Zuquim, Gabriela (2017): Soil exchangeable cation concentration map of Amazonia, link to GeoTif [dataset]. University of Turku, PANGAEA, https://doi.org/10.1594/PANGAEA.879542, Supplement to: Zuquim, Gabriela; Stropp, Juliana; Moulatlet, Gabriel M; Van Doninck, Jasper; Quesada, Carlos A; Figueiredo, Fernando O G; Costa, Flávia R C; Ruokolainen, Kalle; Tuomisto, Hanna (2019): Making the most of scarce data: Mapping soil gradients in data‐poor areas using species occurrence records. Methods in Ecology and Evolution, https://doi.org/10.1111/2041-210X.13178
Always quote citation above when using data! You can download the citation in several formats below.
Published: 2017-08-11 • DOI registered: 2017-09-14
Abstract:
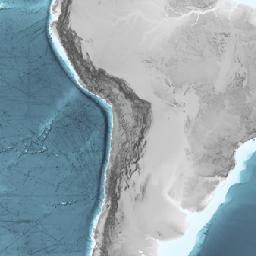
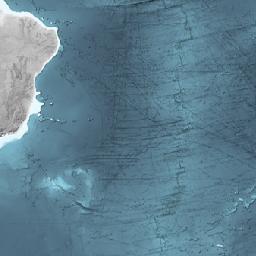
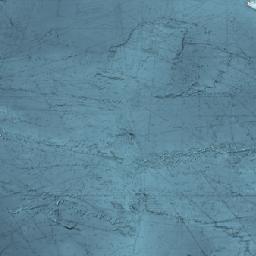
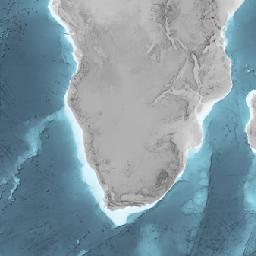
Maps of soil cation concentration as modelled using direct and plant-derived soil data together as input data:
-KrigeSoill_fernRcropNEW.tif - covering the whole Amazonian sensu latissimo. One single interpolation without wetlands claasification.
-KrigeAvg_MaskWETfern_Soil.tif - Two krigings were run separately for wetlands and uplands and ovelaped to compose a single map (map extent limited to the area covered by the available wetlands map).
-KrigeSoill_fernERRORNEW.tif - degree of uncertainty in predicted values as quantified by the Kriging variance associated with map KrigeSoill_fern.tif. To obtain a standard deviation map use the variance map to the power of 2 (KrigeSoill_fernERRORNEW.tif ^2).
-KrigeAvg_WETLANDfern_SoilERROR.tif - degree of uncertainty in predicted values as quantified by the Kriging variance associated with map KrigeAvg_MaskWETfern_Soil.tif. To obtain a standard deviation map use the variance map to the power of 2 (KrigeAvg_WETLANDfern_SoilERROR.tif ^ 2).
Methods in brief:
We defined fern species optima using compiled data from 1,353 quantitative fern and lycophyte inventory plots across Amazonia that also provided locally measured soil cation concentration. We obtained and cleaned species occurrence records from the Global Biodiversity Information Facility (GBIF; http://www.gbif.org) and SpeciesLink (http://www.splink.org.br) and assigned a soil value to each of the georeferenced records according to the exchangeable cation concentration optima estimated for the species (hereafter fern-derived soil points). We combined the fern-derived soil points with soil points provided by Harmonized World Soil Database v1.2 (HWSD) (Nachtergaele et al. 2012) and Brazilian National database (BND) (Cooper et al. 2005). We generated exchangeable cation concentration maps using both direct and indirect environmental data as input points for interpolation using ordinary Kriging. We validated the maps using external soil information from 194 plots of the Amazon Forest Inventory Network (RAINFOR).
--
The files are in .tif format and consist of digital spatial layers that can be opened in QGIS, R and other GIS or spatial analysis programs.
Coverage:
Latitude: -3.000000 * Longitude: -62.000000
Event(s):
License:
Creative Commons Attribution 3.0 Unported (CC-BY-3.0)
Size:
2.1 MBytes
Download Data
Datasets with similar metadata
- Nishina, K; Ito, A; Hanasaki, N et al. (2017): Historical global map of NH4+ and NO3- application in synthetic nitrogen fertilizer, link to NetCDF files. https://doi.org/10.1594/PANGAEA.861203
- Hodges, C; Kaye, J; Brantley, S (2021): Cation concentrations within soil porewaters from the Cole Farm watershed. https://doi.org/10.1594/PANGAEA.932873
- Hörhold, M; Twarloh, B; Behrens, M et al. (2025): Cation concentrations of the EGRIP ice core. https://doi.org/10.1594/PANGAEA.966039
Users interested in this dataset were also interested in
- Lehmann, N; Mears, C; Thomas, H (2022): 10Be erosion rates and riverine alkalinity concentration globally. https://doi.org/10.1594/PANGAEA.940522
- Teschke, K; Pehlke, H; Brey, T (2019): Spatial distribution of demersal and pelagic fishes in the wider Weddell Sea (Antarctica) with links to ArcGIS map packages. https://doi.org/10.1594/PANGAEA.899591
- Becker, H (2007): Soil distribution and classification of sediment core Samoylov_Island_1 (center). https://doi.org/10.1594/PANGAEA.615249