Geological, Mineralogical and Textural Impacts on the Distribution of Environmentally Toxic Trace Elements in Seafloor Massive Sulfide Occurrences

 , , and
Abstract
:1. Introduction
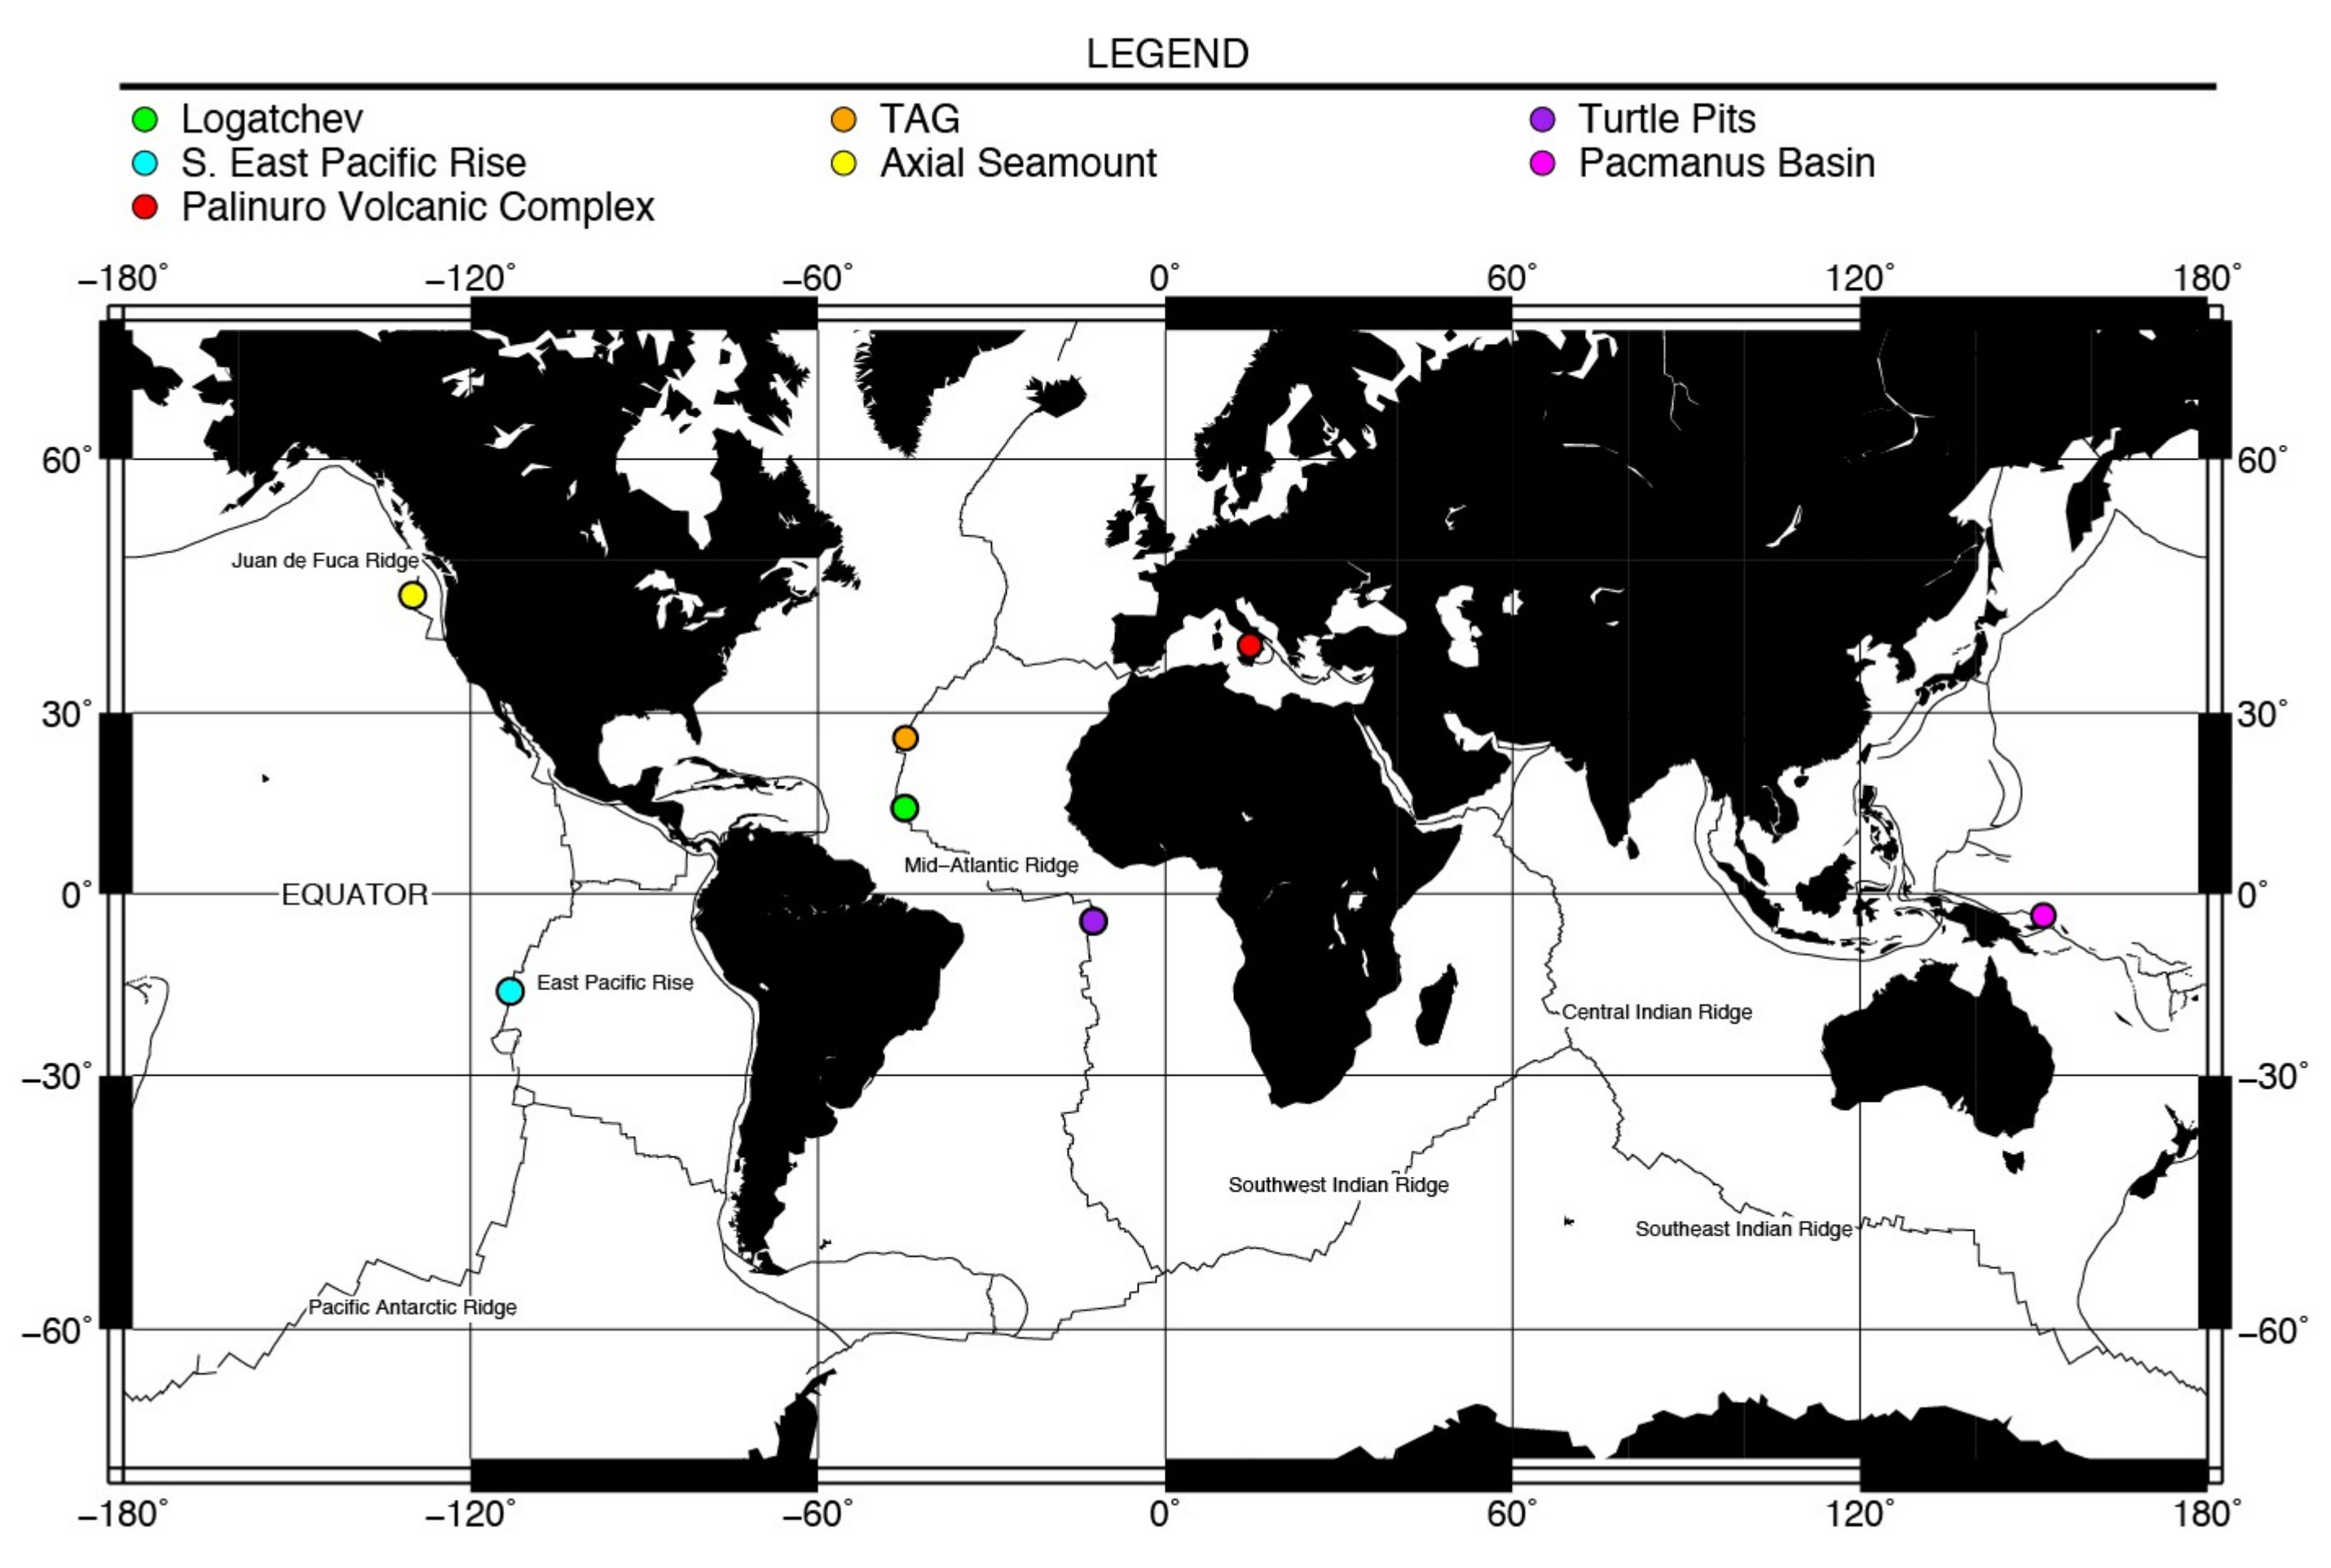
2. Materials
3. Methods
3.1. Electron Microprobe Analysis
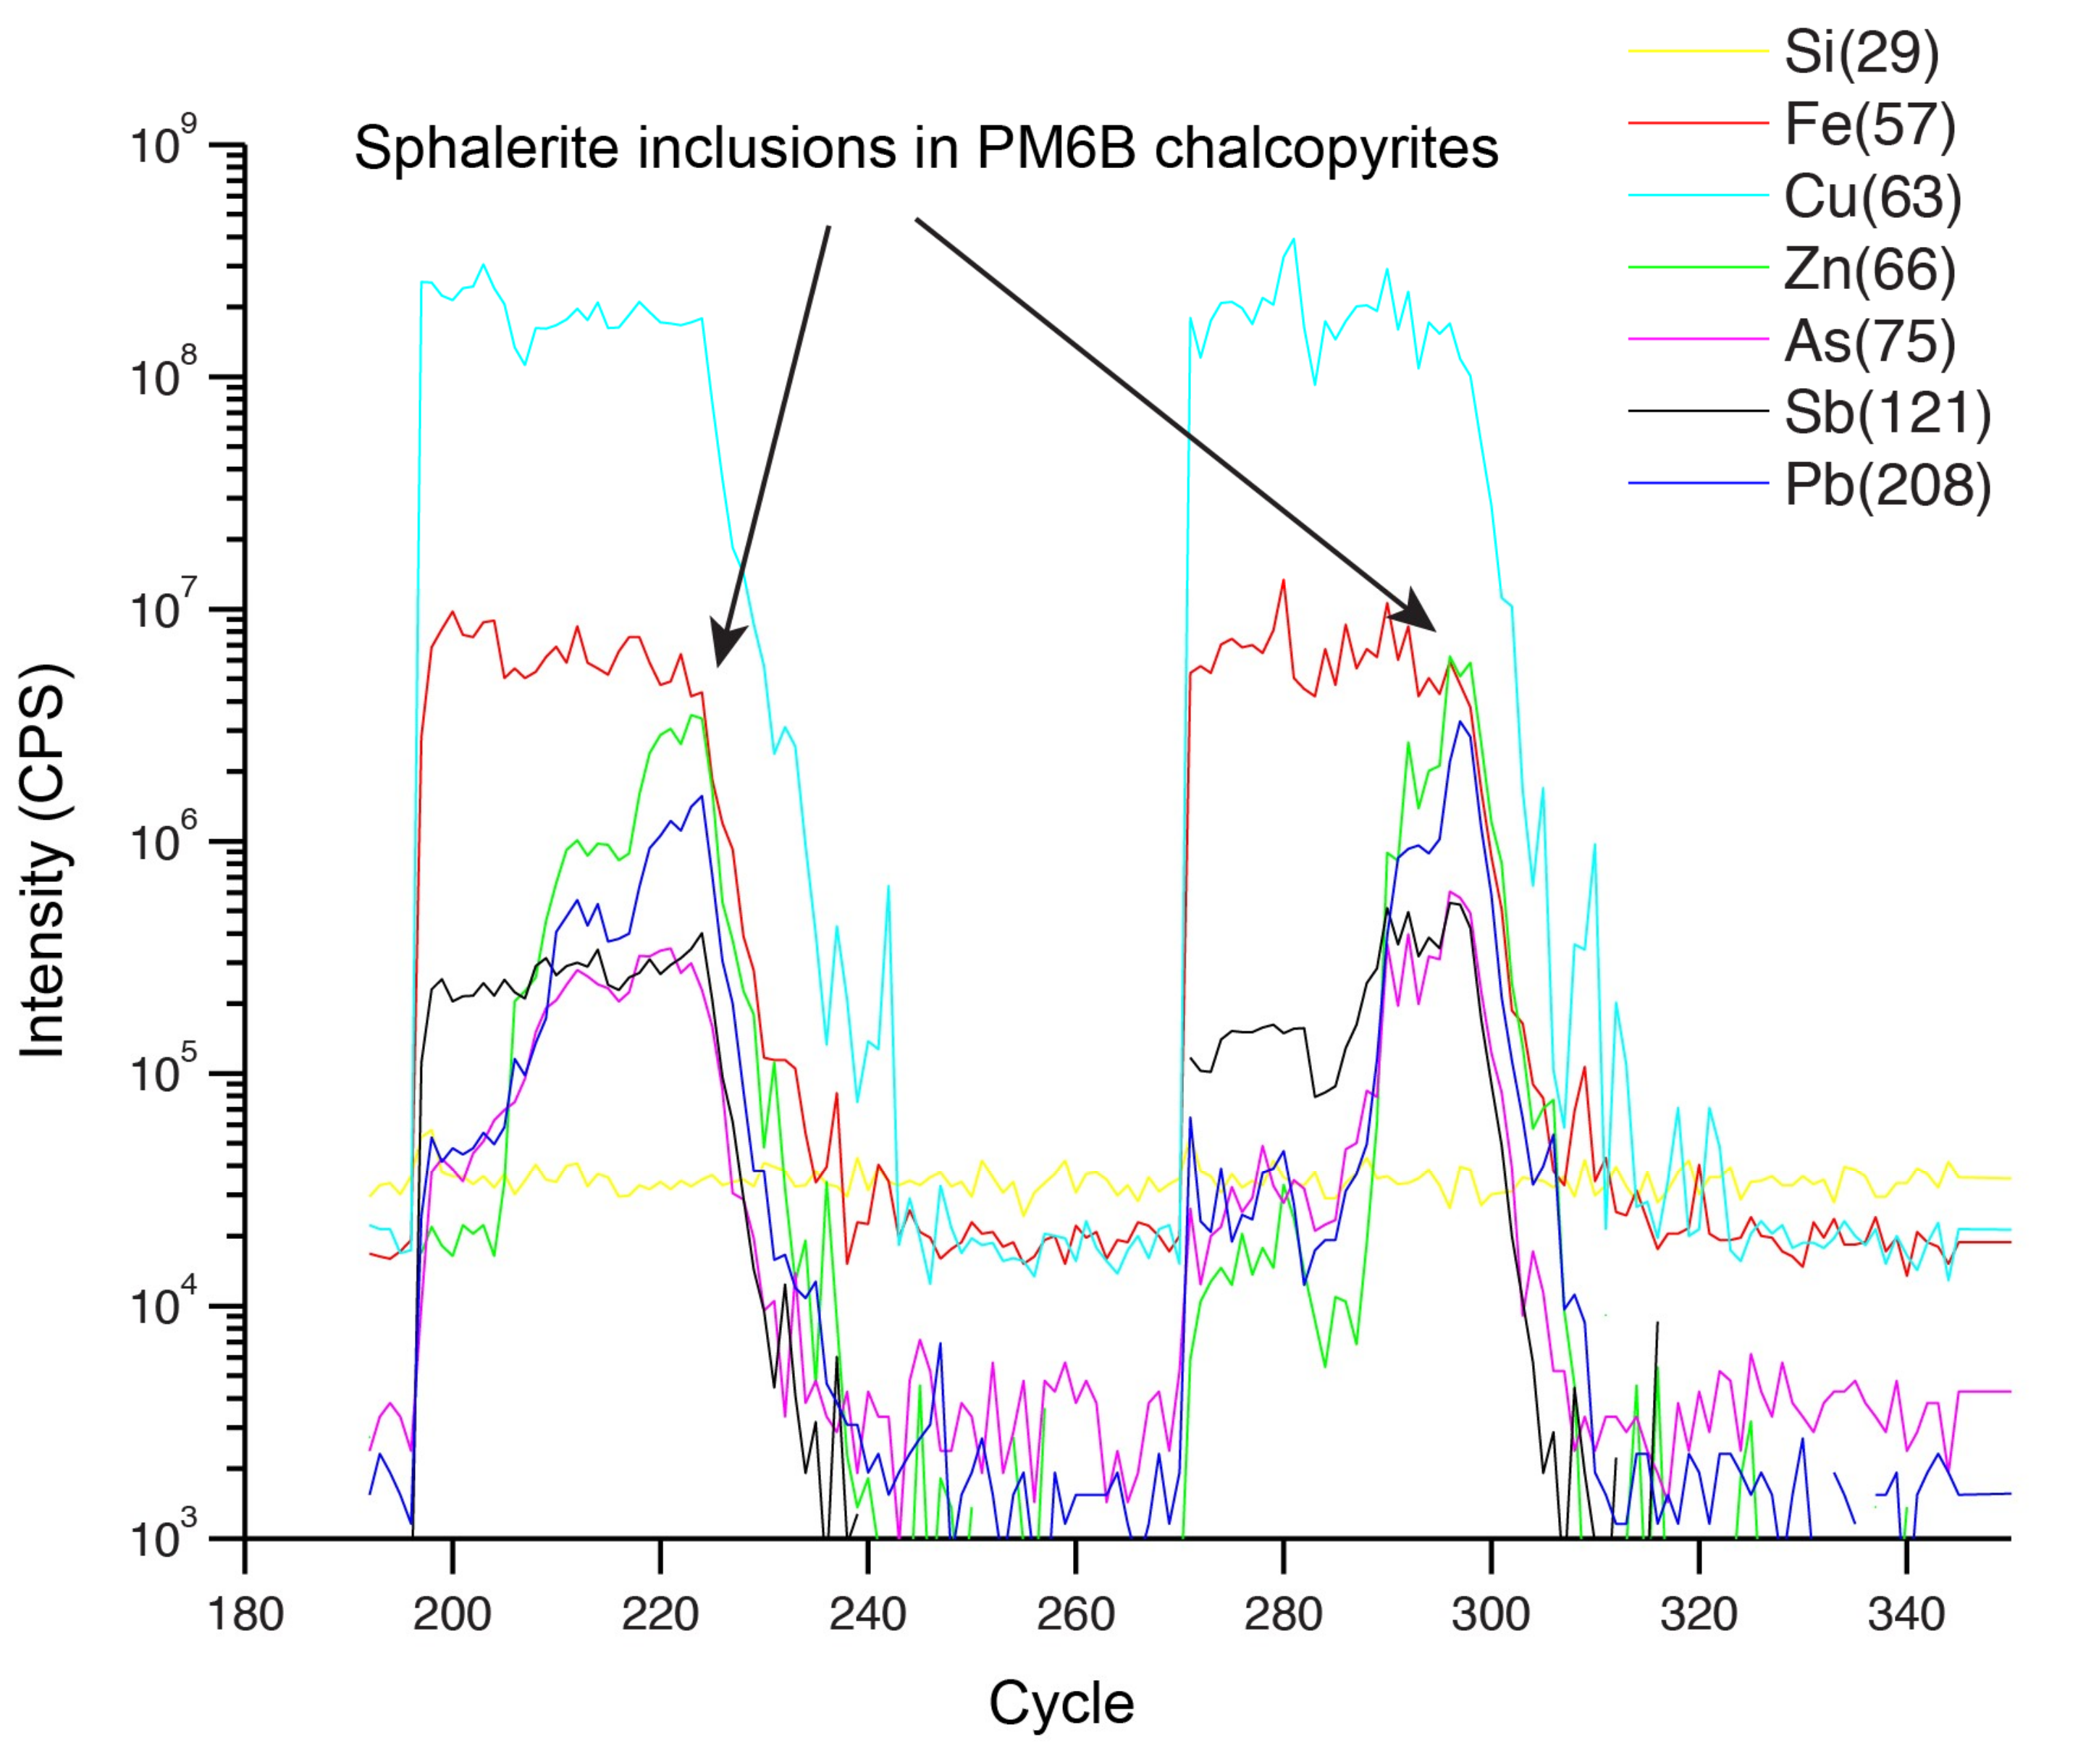
3.2. Laser Ablation Inductively Coupled Mass Spectrometry
3.3. X-Ray Diffraction
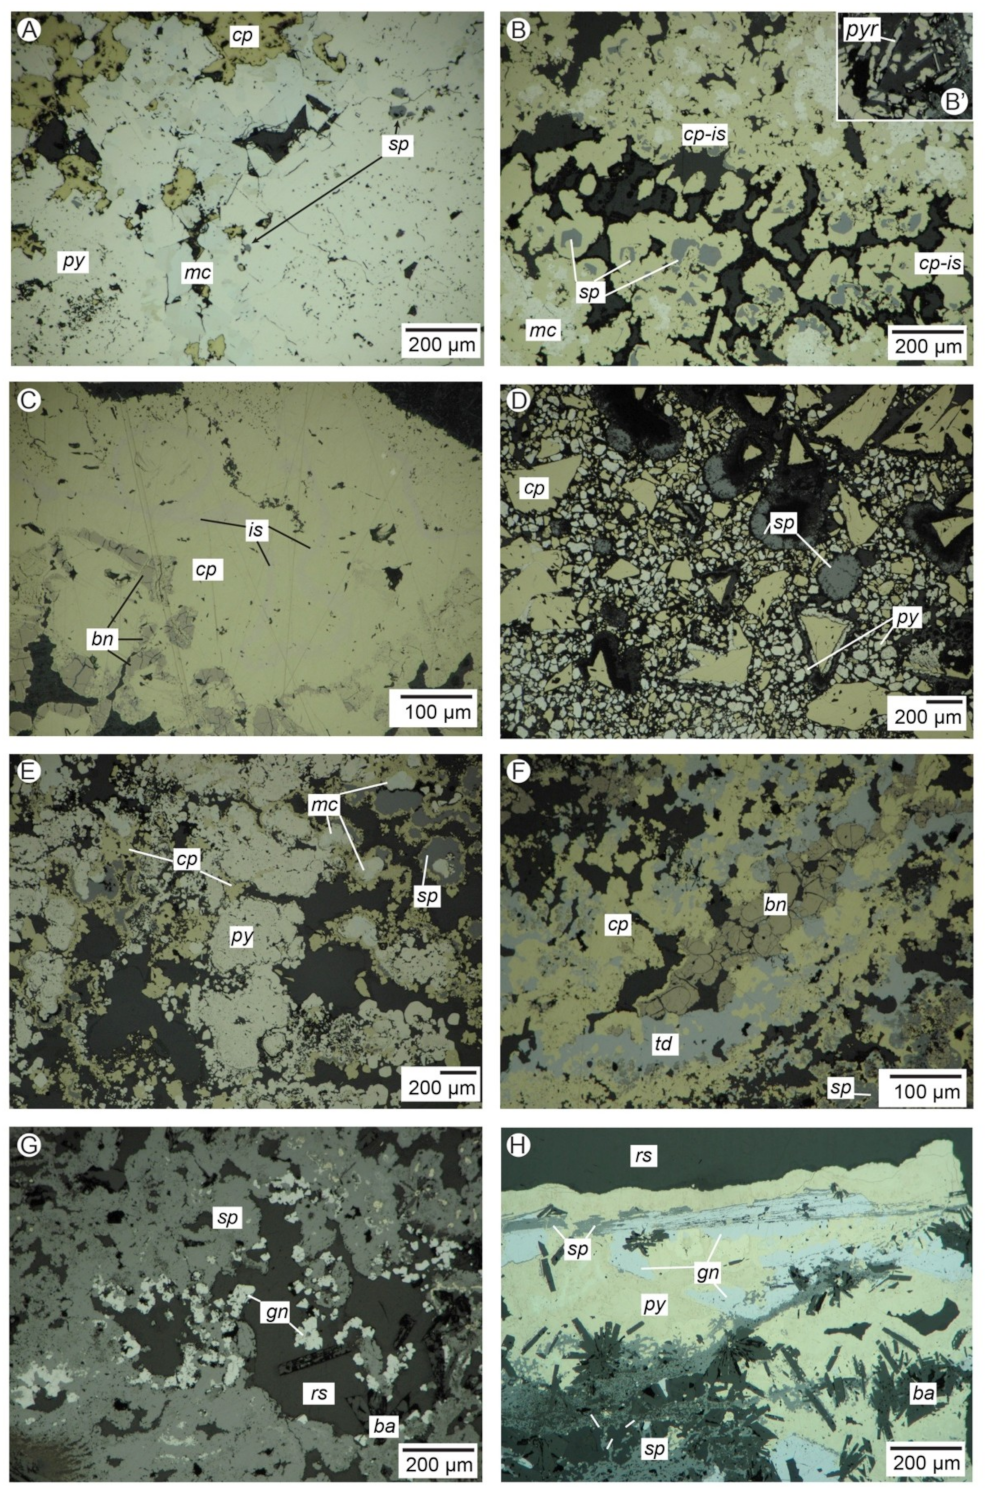
4. Sample Descriptions
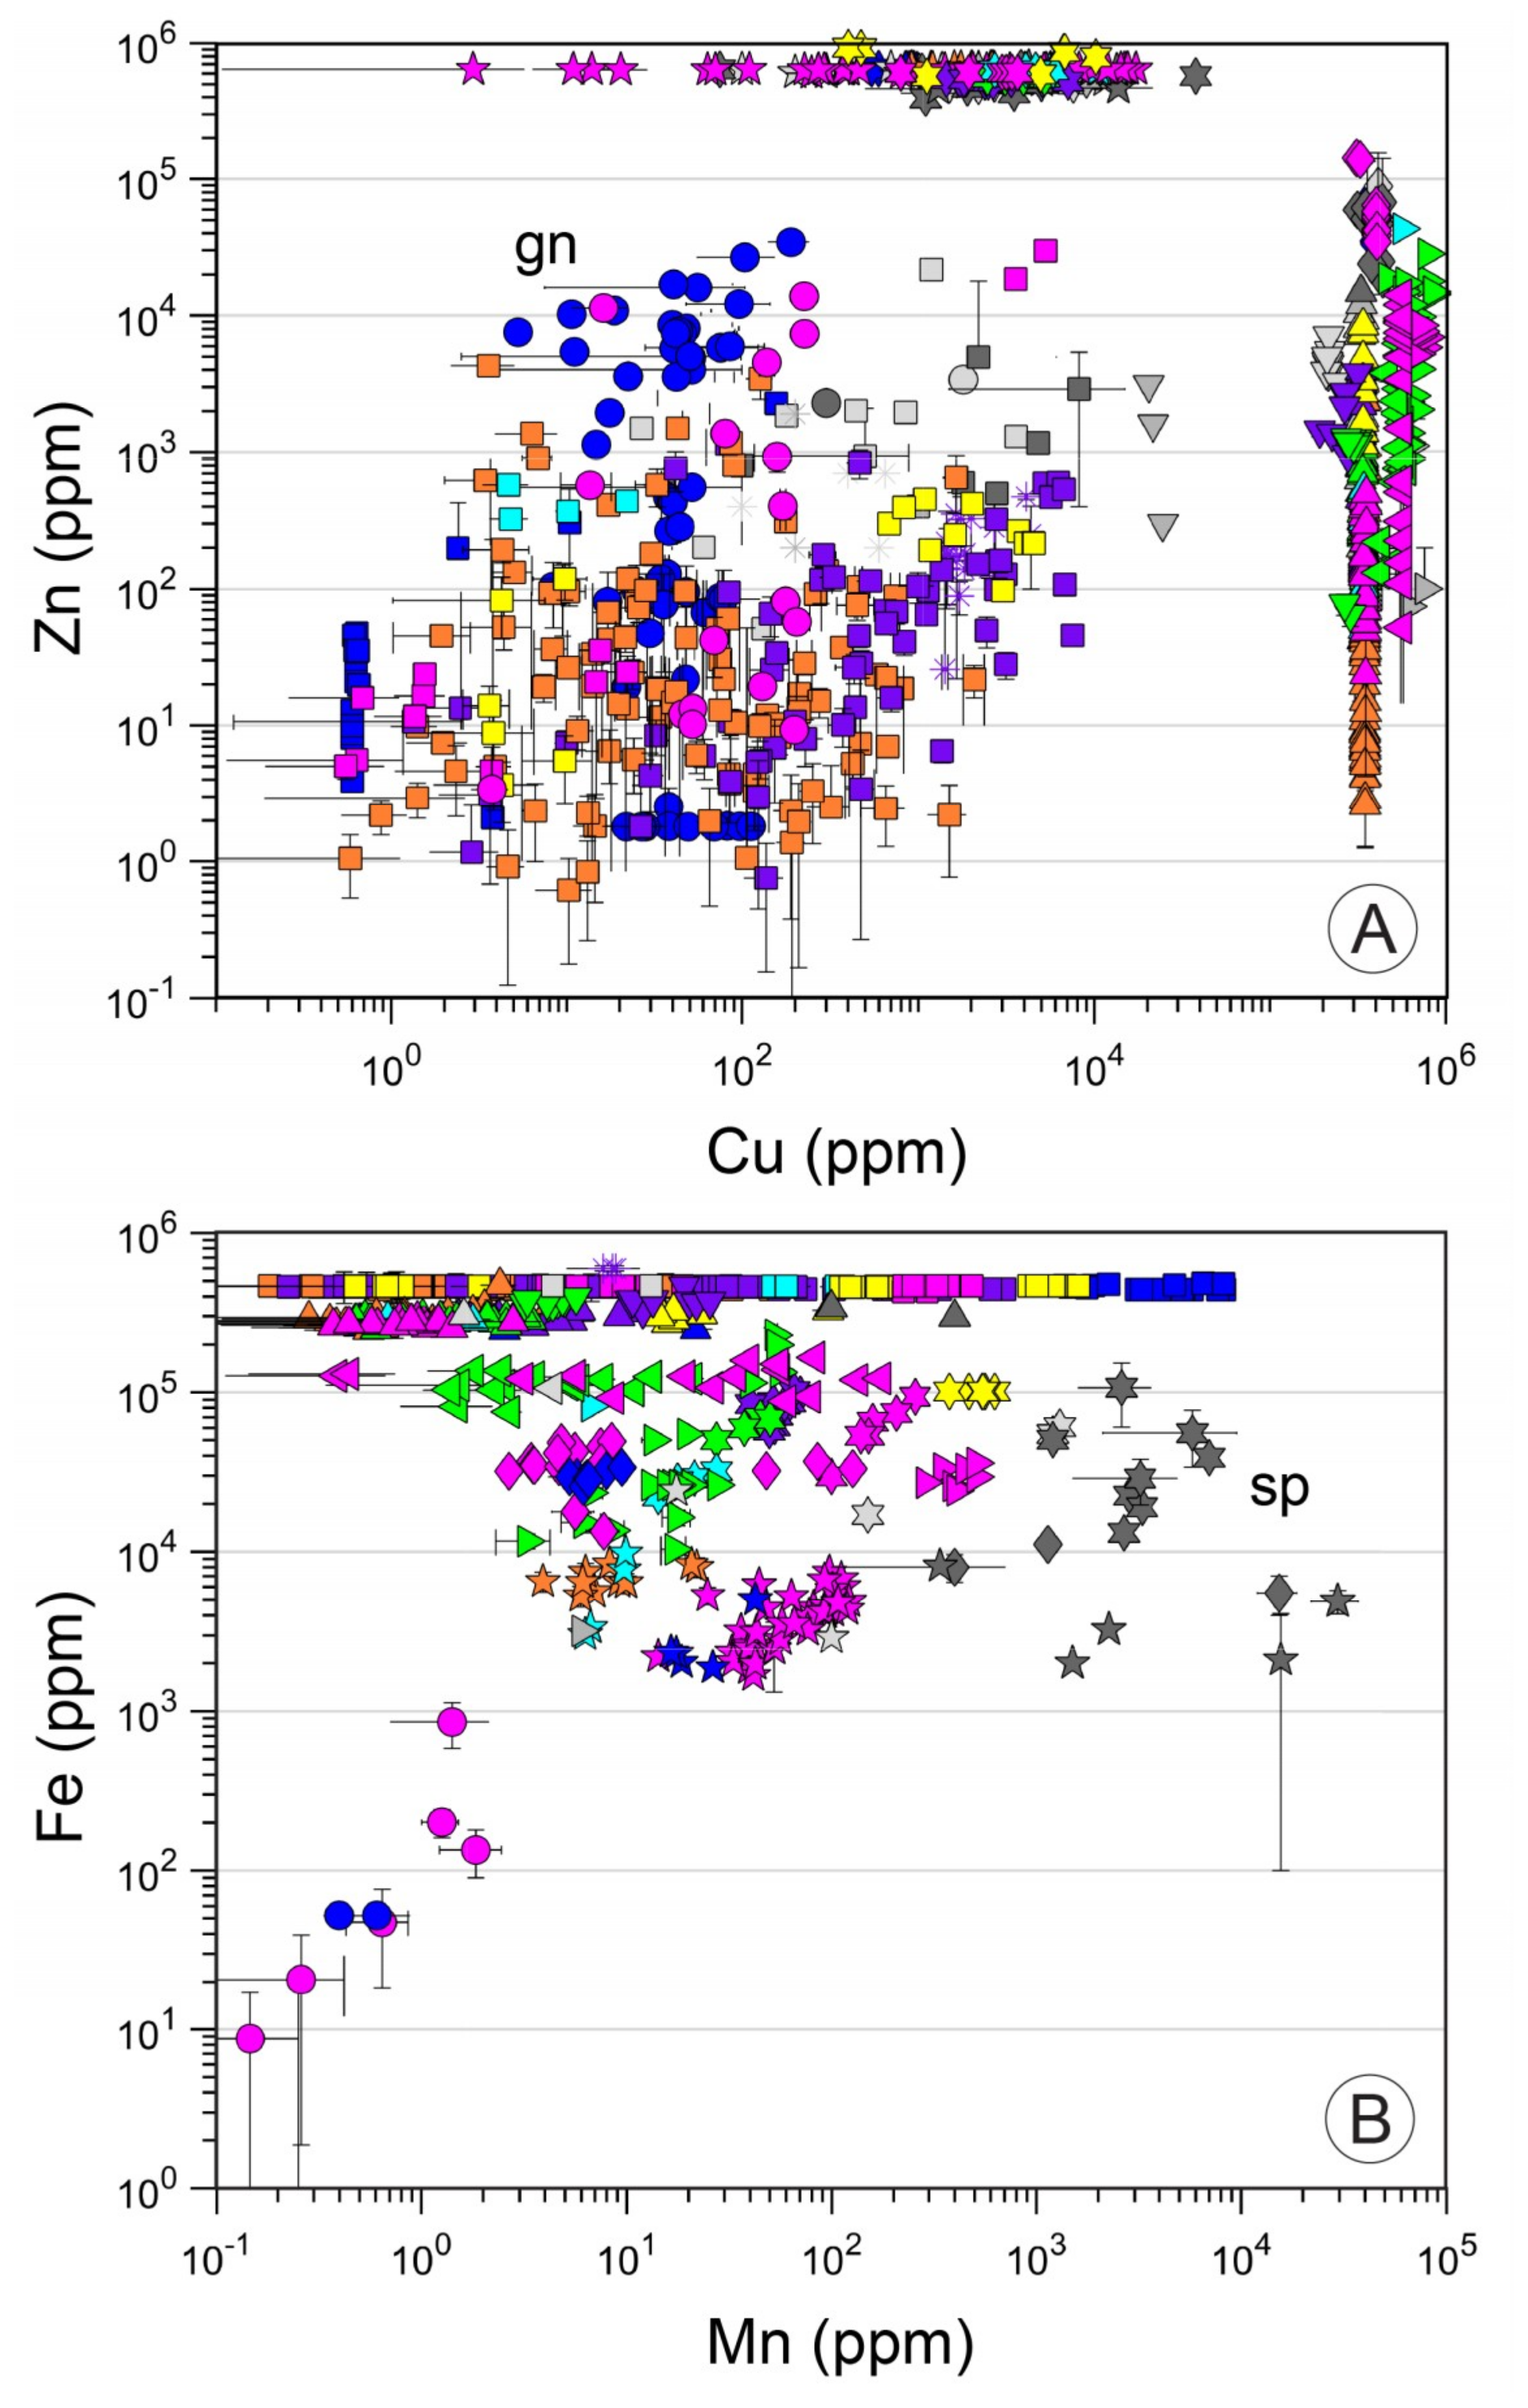
5. Results
6. Discussion
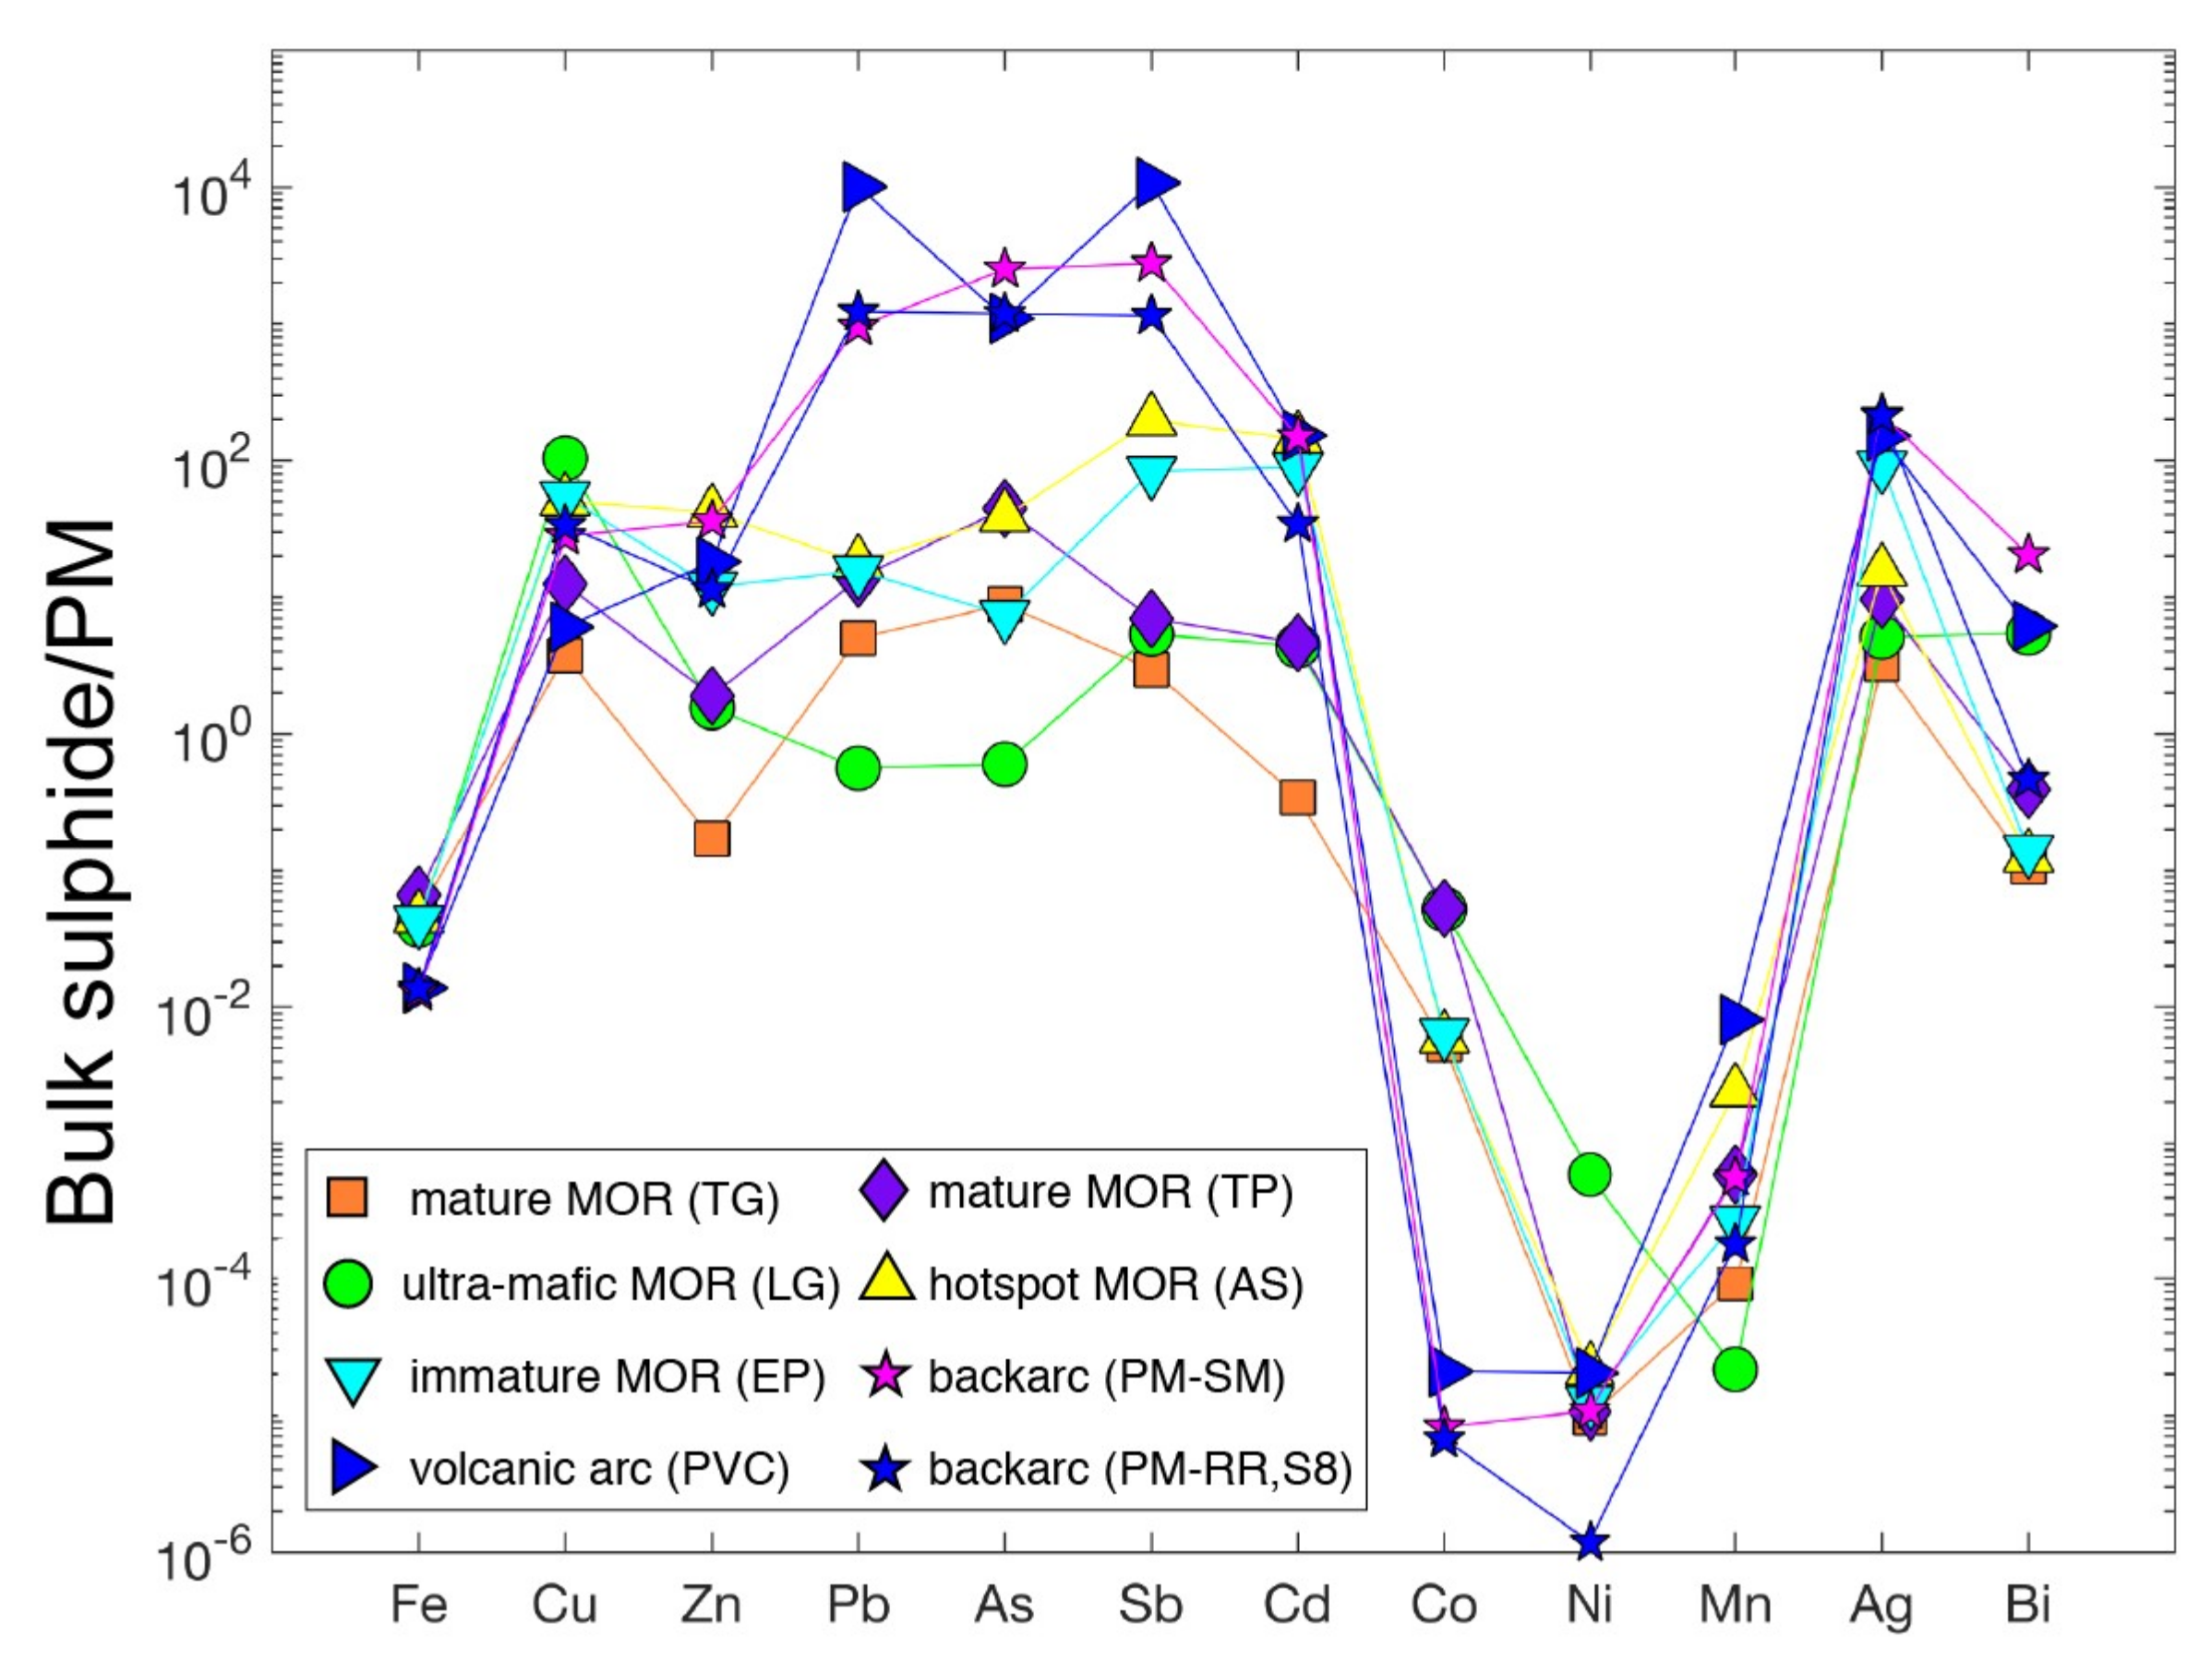
6.1. Control of Geological Setting on Trace Element Distribution
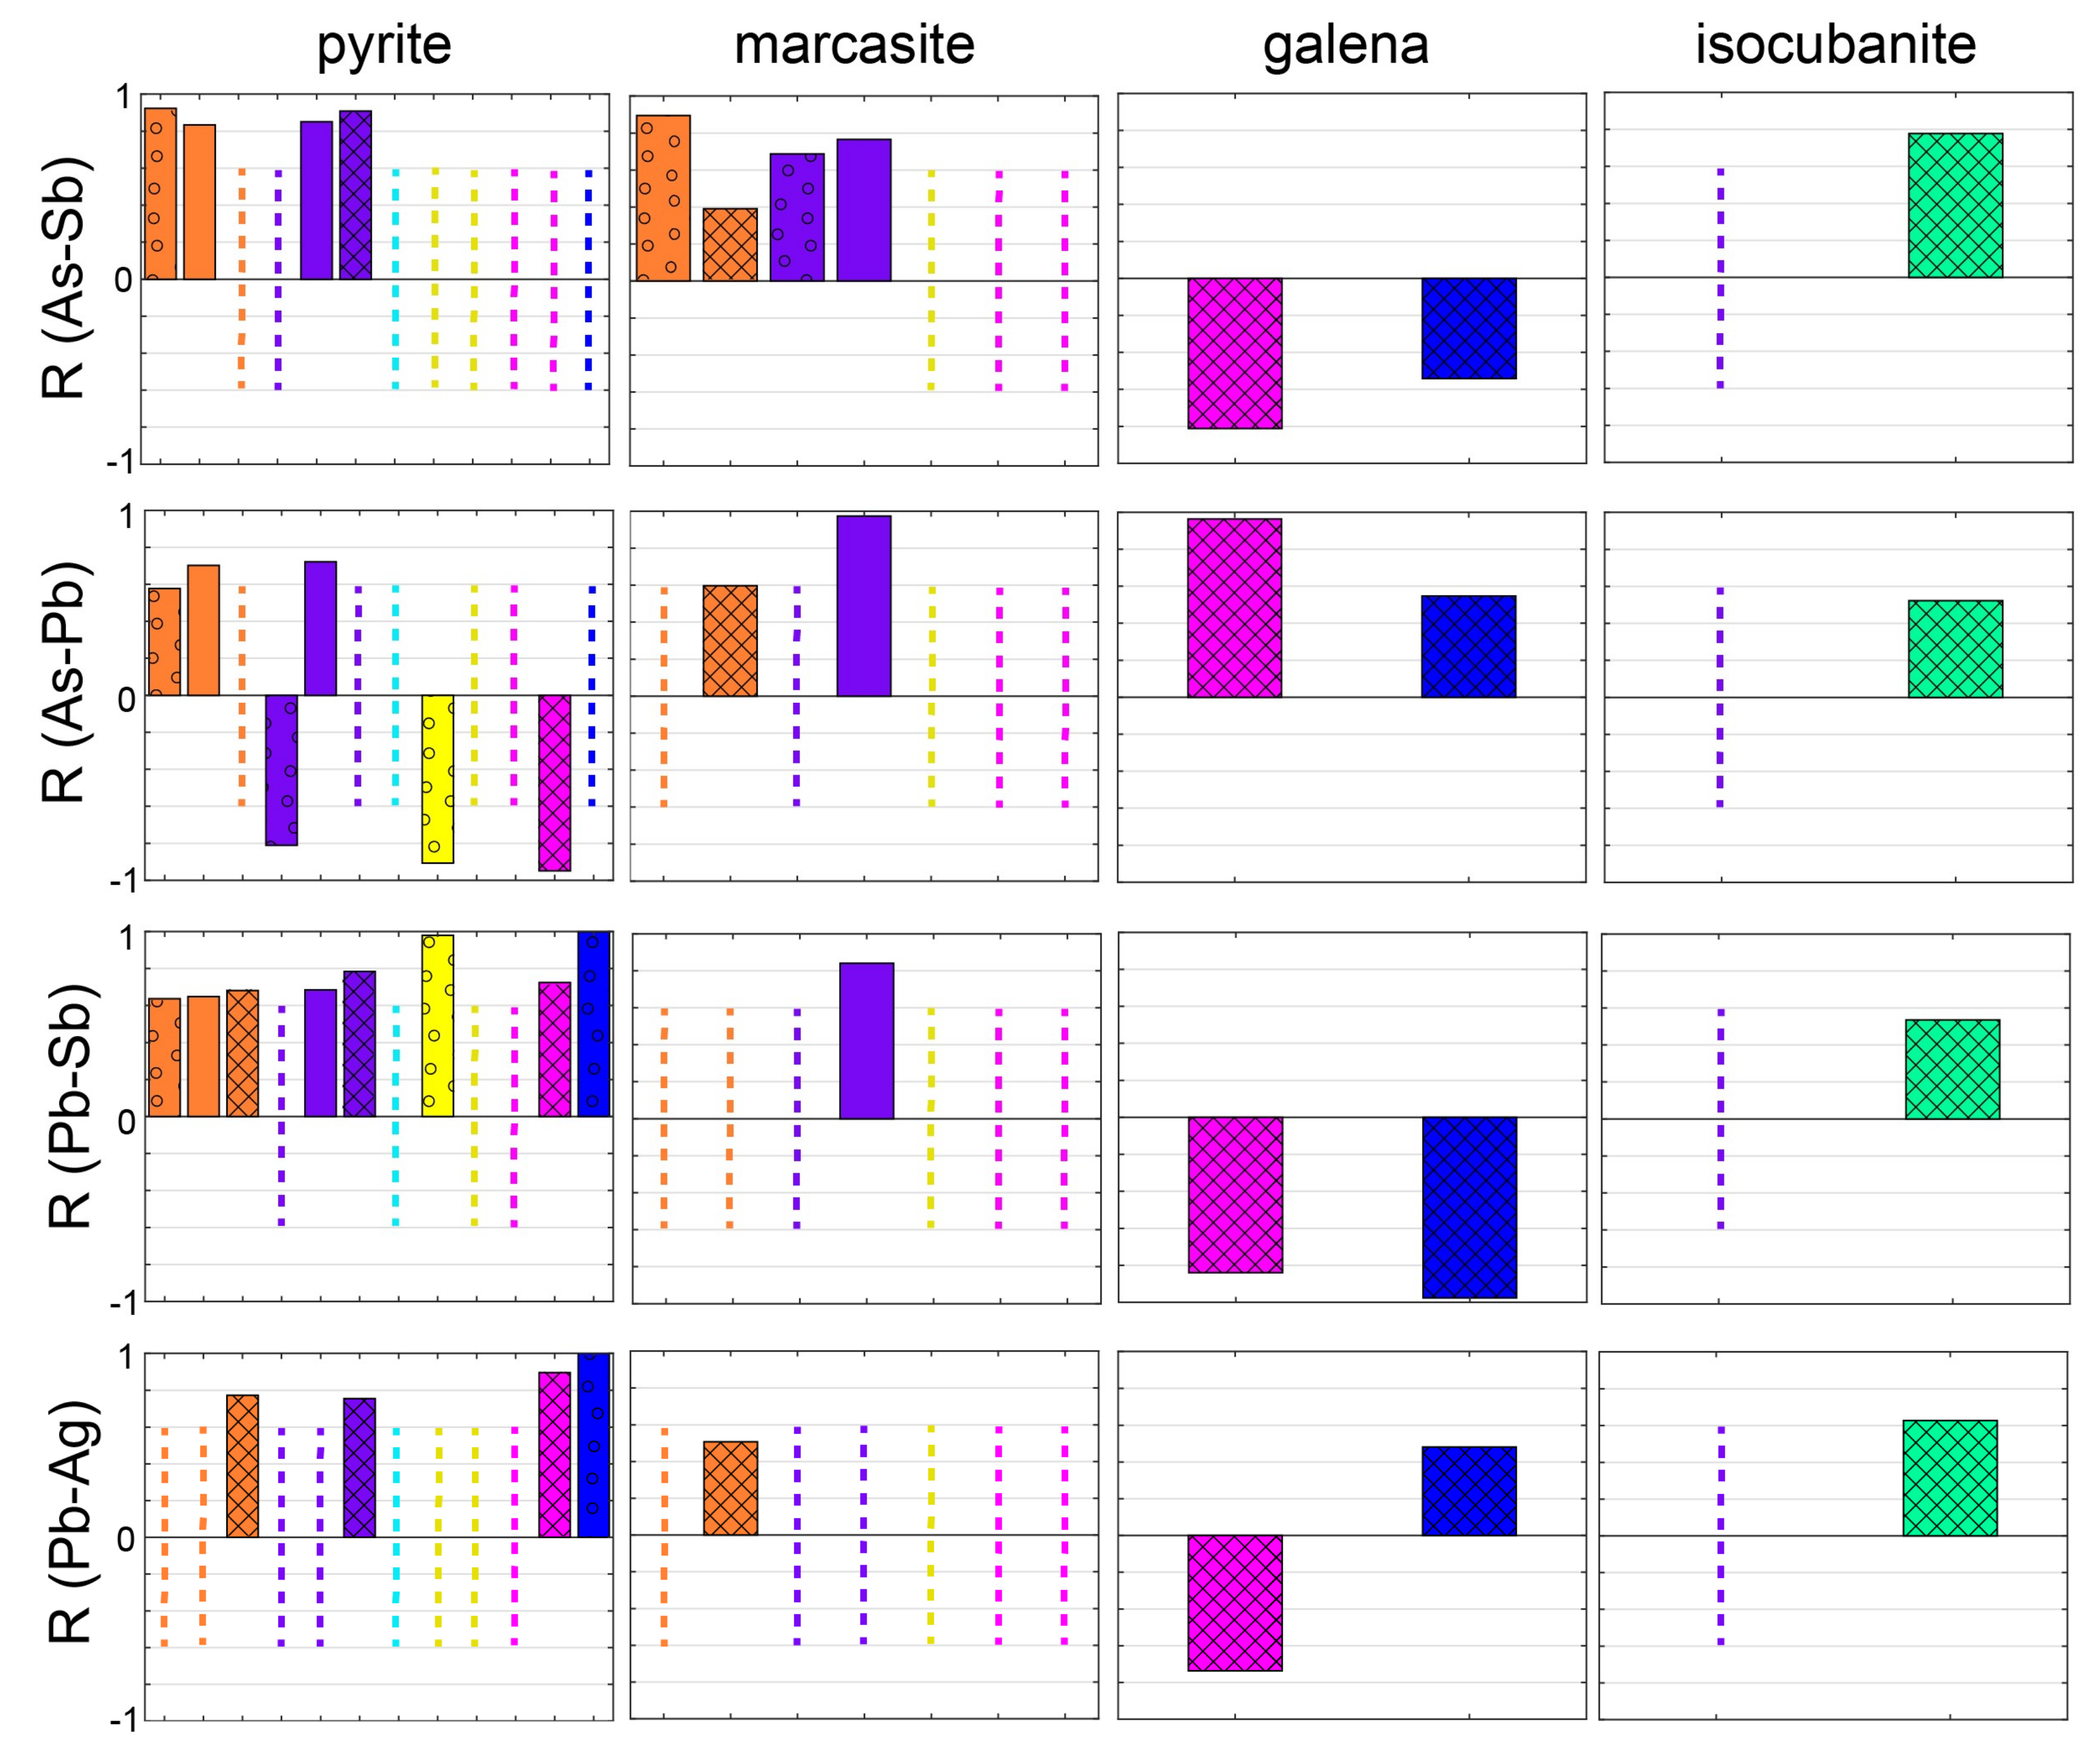
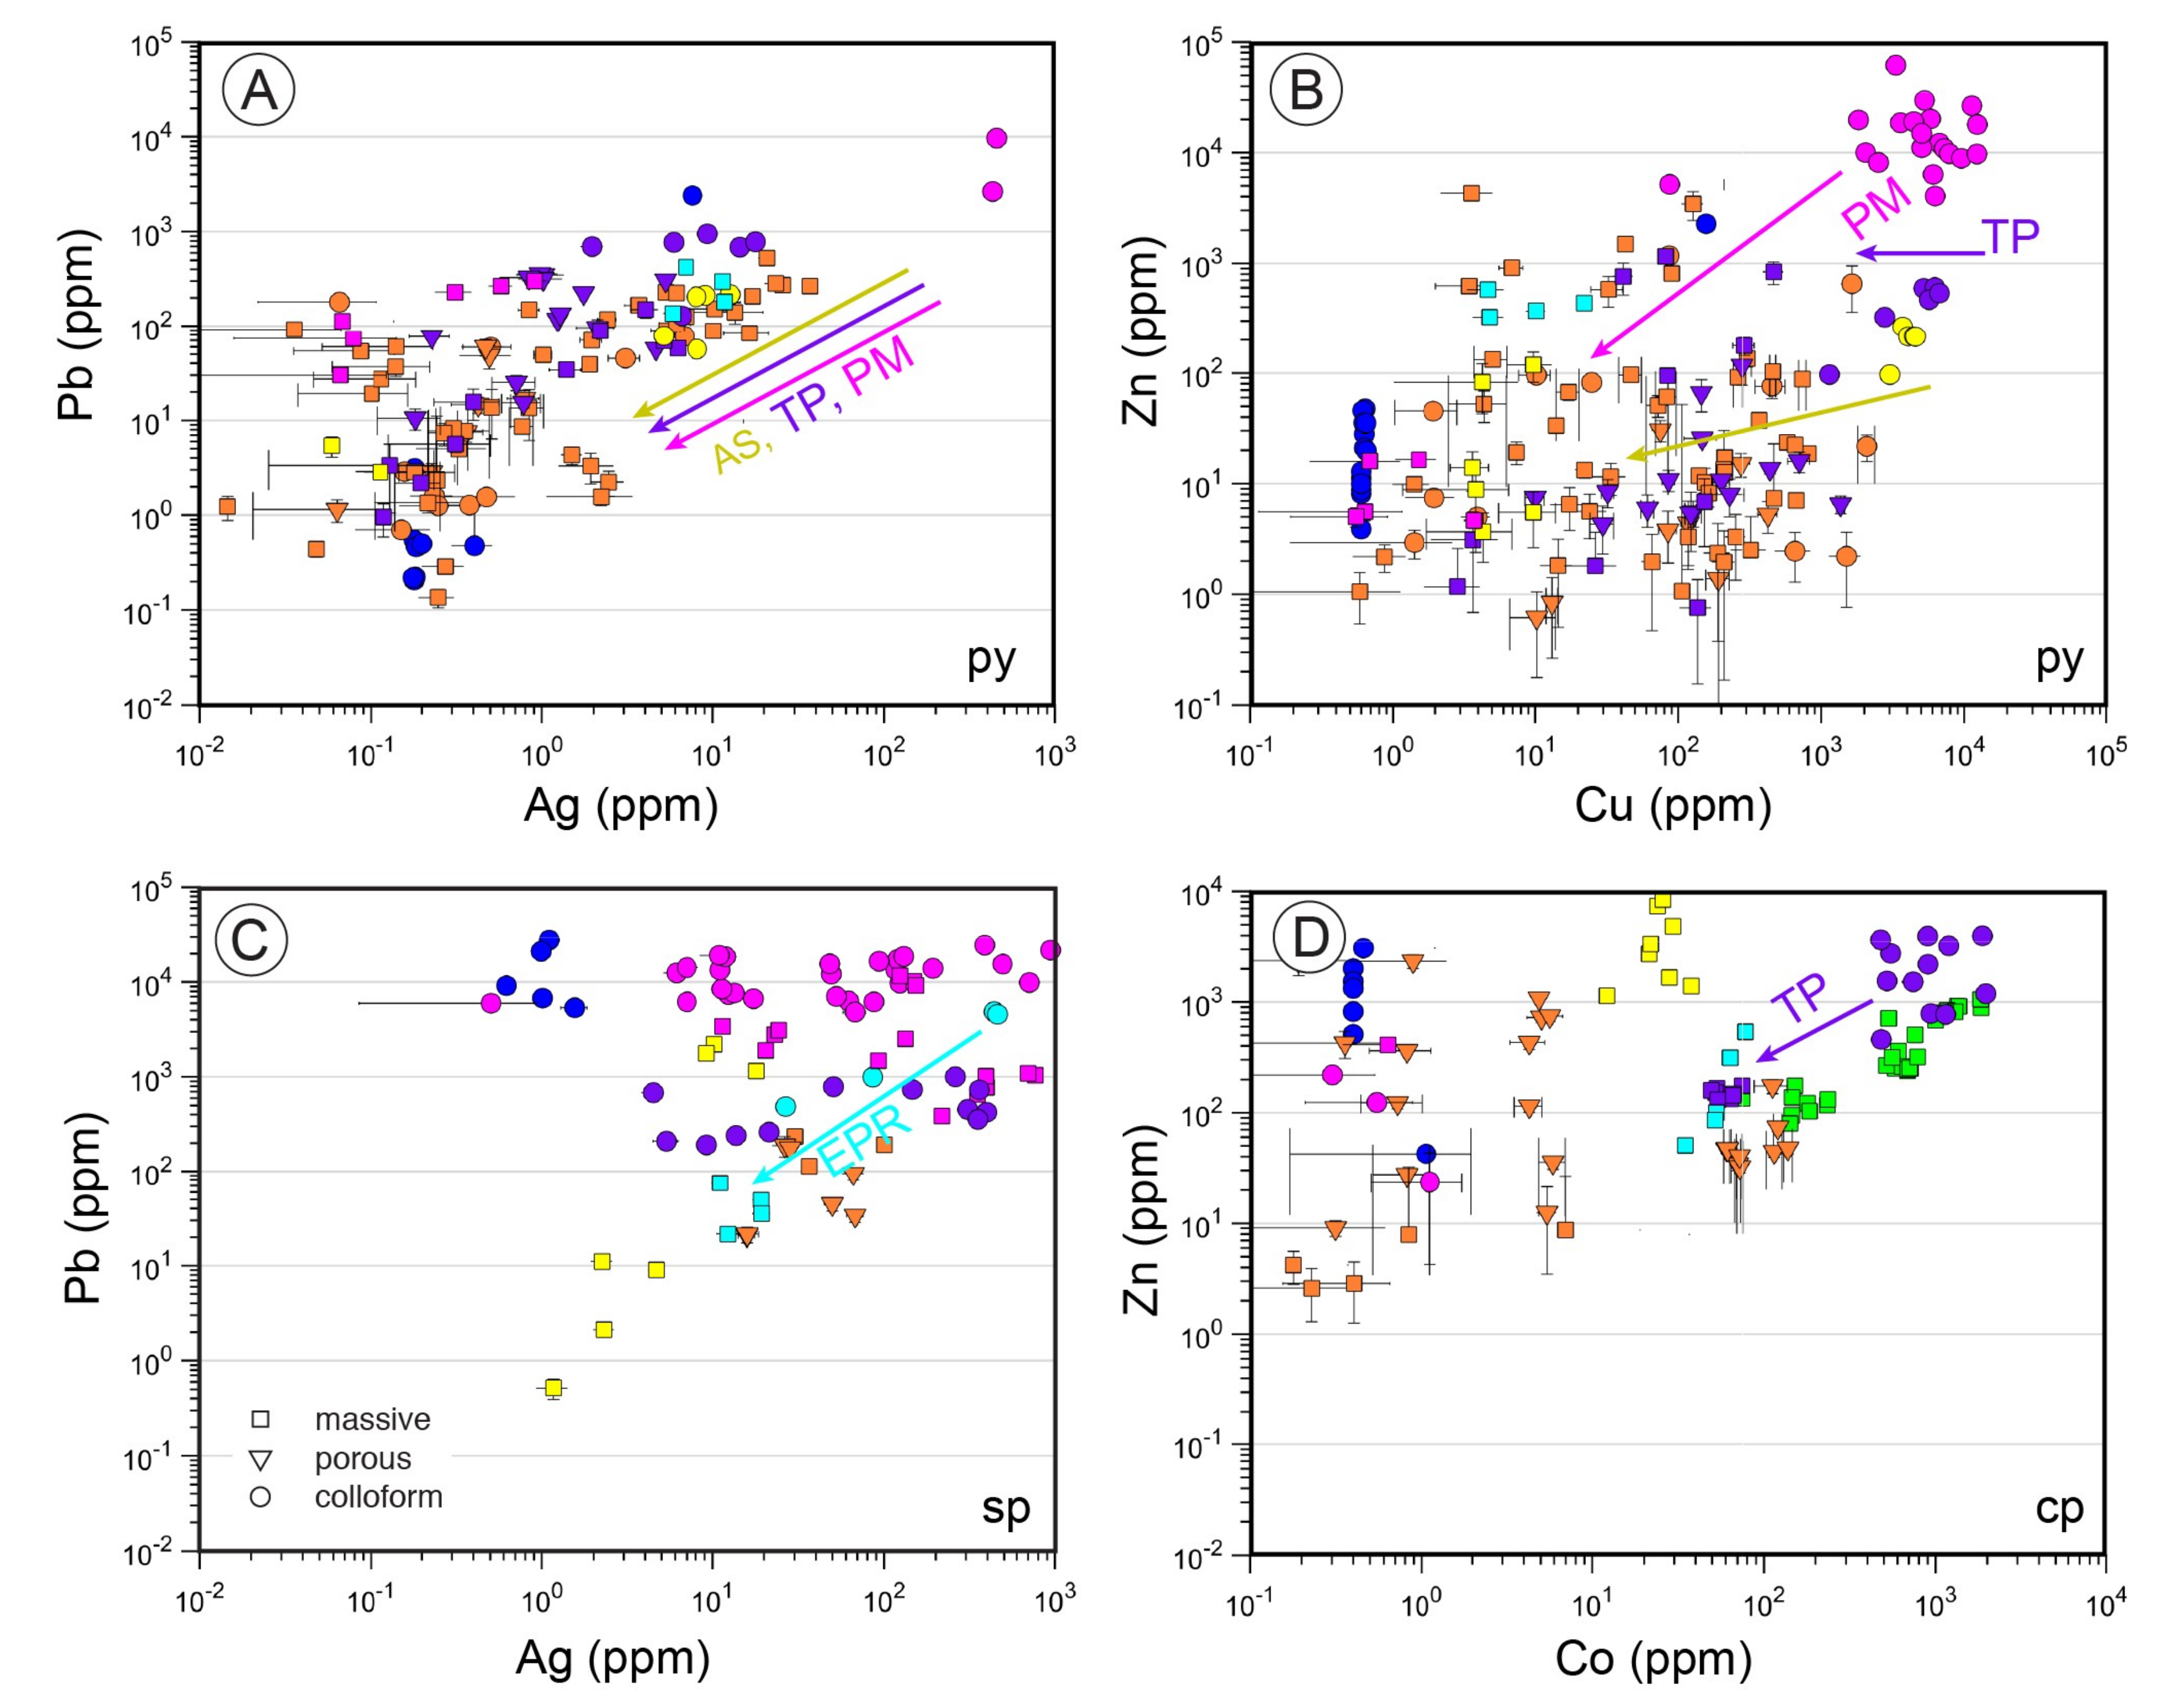
6.2. Control of Mineralogy on Trace Element Distribution
6.2.1. Sphalerite (Cd, Pb, Cu, As, Sb, Mn and Hg)
6.2.2. Galena (Sb, Zn, Ag, Cd and As)
6.2.3. Tennantite-Tetrahedrite (Zn, Pb, Cd, Ag and Hg)
6.2.4. Pyrrhotite (Pb, Co, Ni, Cu and Zn)
6.2.5. Isocubanite (Zn, Co and Ni) and Chalcopyrite (Zn, As, Sb, Pb, Ag, Bi, Co and Ni)
6.2.6. Secondary Cu Sulfides (Bornite, Covellite—Cu, Zn, Ag, Co, Ni, As, Sb and Bi)
6.2.7. Pyrite/Marcasite (Zn, Cu, Mn, Pb, As, Co and Sb)
6.3. Control of Texture on Trace Element Distribution
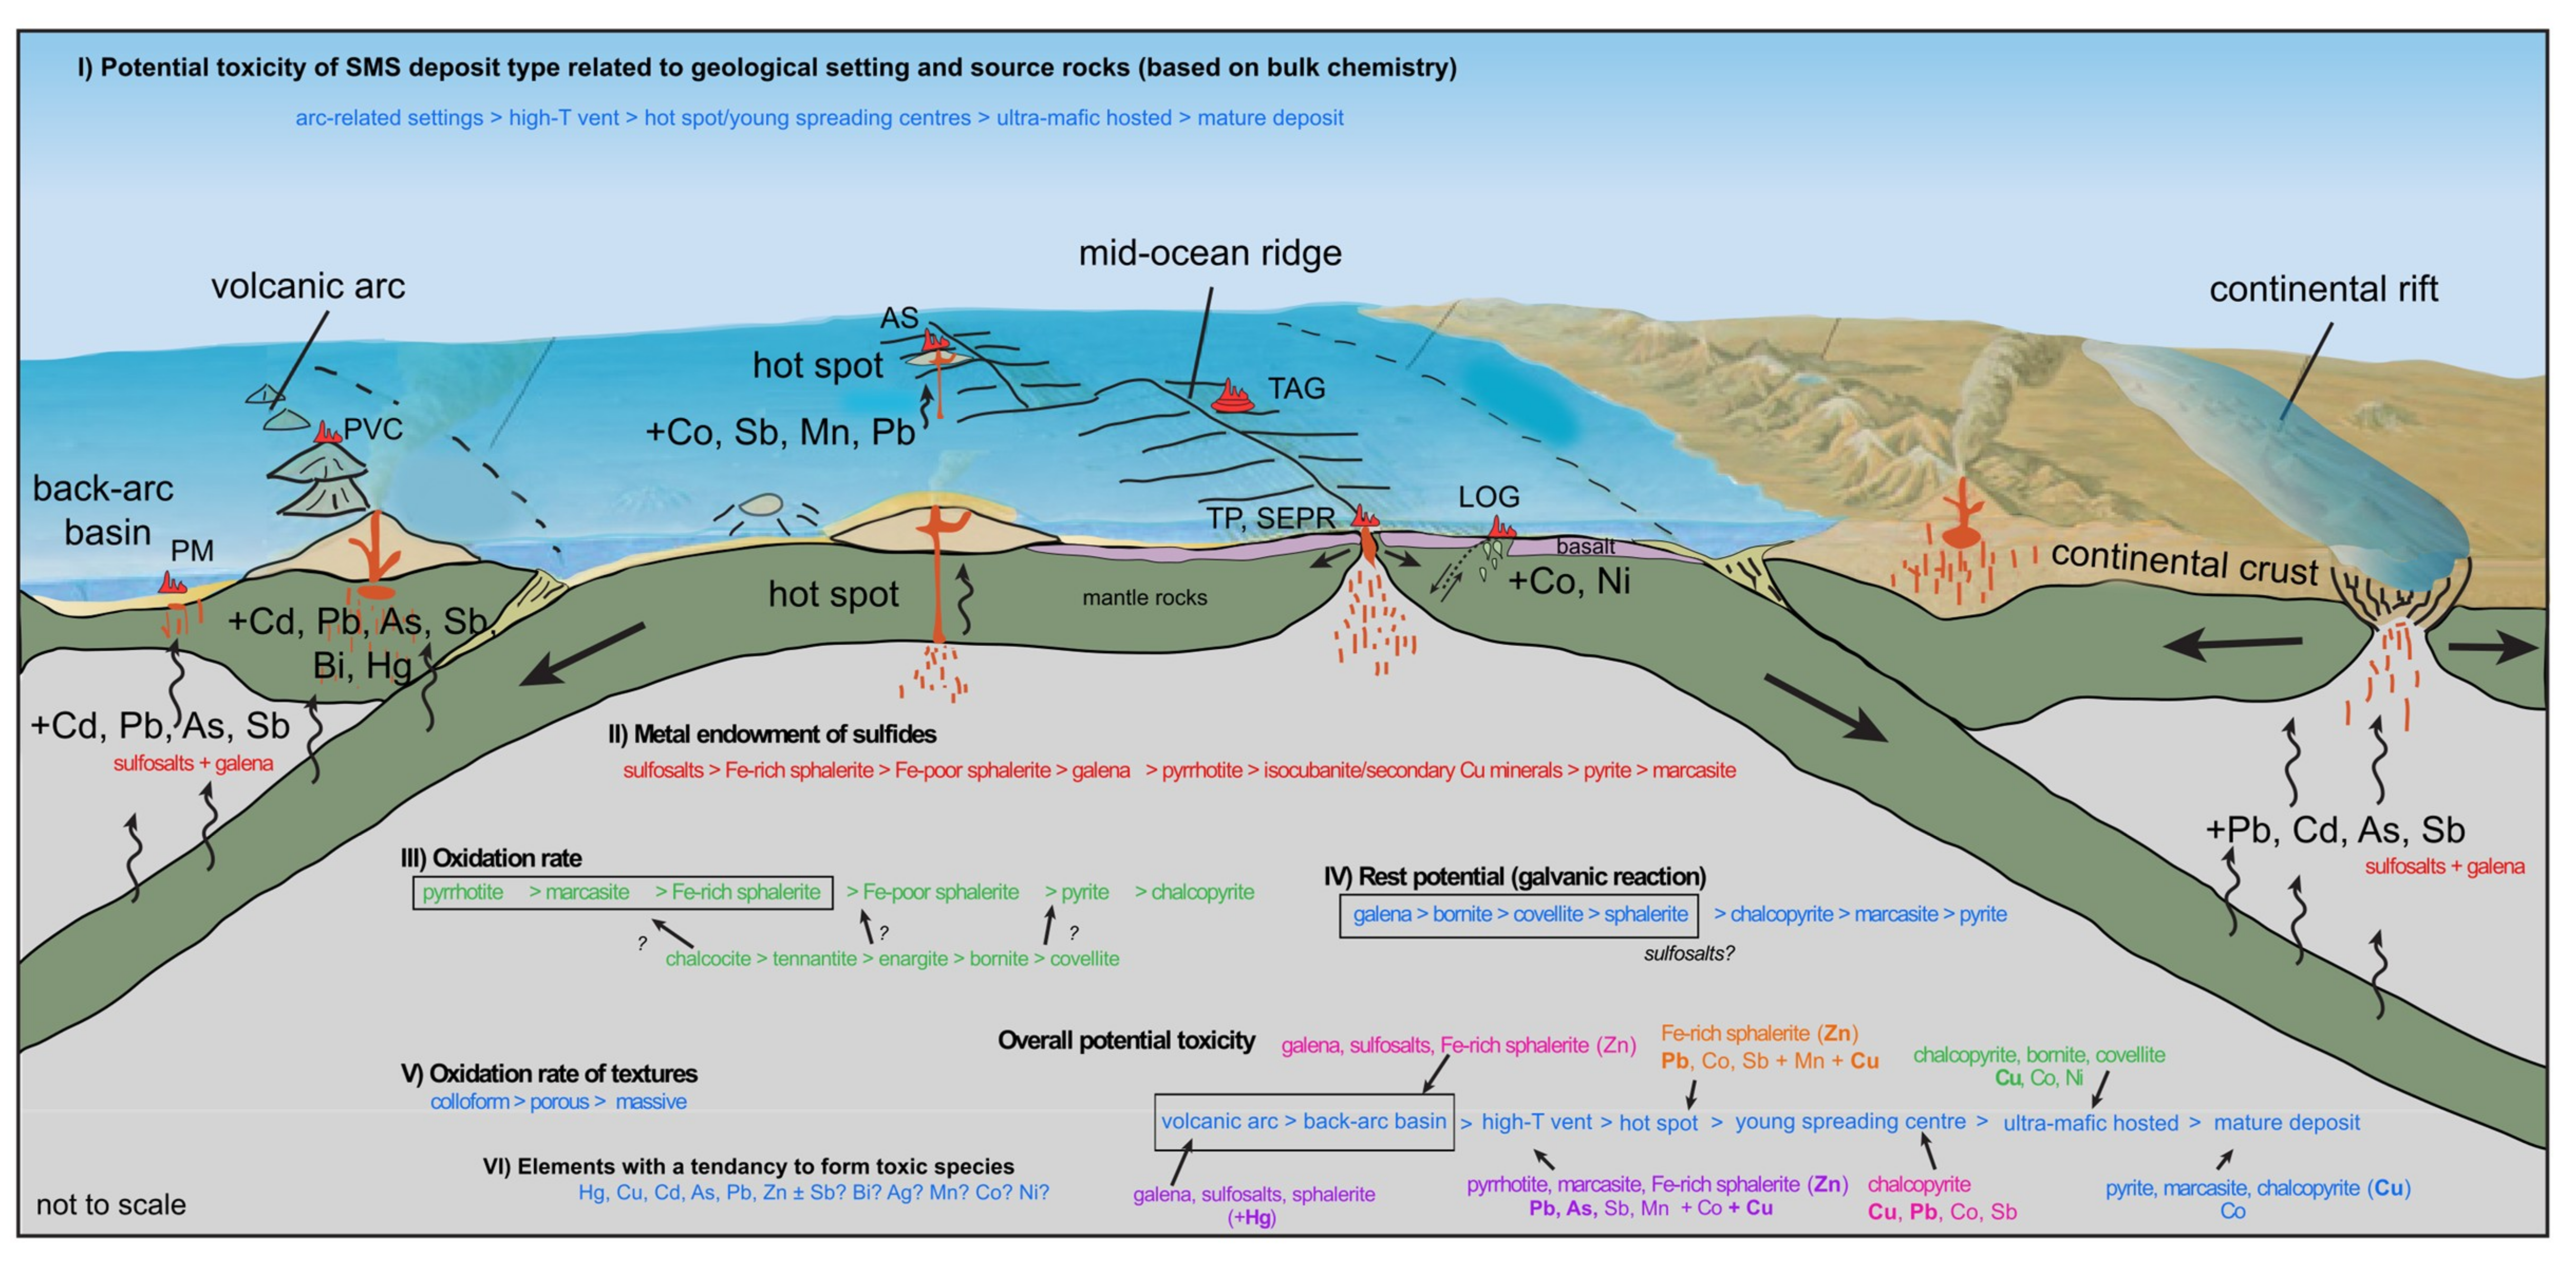
6.4. Potential Toxicity
7. Conclusions
Supplementary Materials
Author Contributions
Funding
Conflicts of Interest
Appendix A
Appendix A.1. TAG, Mid-Atlantic Ridge
Appendix A.2. Turtle Pits, Mid-Atlantic Ridge
Appendix A.3. Logatchev, Mid-Atlantic Ridge
Appendix A.4. Axial Seamount, Juan de Fuca Ridge
Appendix A.5. 16°43’S hydrothermal Field, South East Pacific Rise
Appendix A.6. Pacmanus Basin, Papua New Guinea
Appendix A.7. Palinuro Volcanic Complex, Aeolian Island Arc, Italy
References
- CLCS Oceans and Law of the Sea, United Nations. Available online: http://www.un.org/depts/los/clcs_new/commission_submissions.htm (accessed on 4 March 2019).
- Organisation for Economic Co-Operation and Development (OECD). The Ocean Economy in 2030; IWA Publishing: London, UK, 2017; ISBN 1780408919. [Google Scholar]
- Gwyther, D. Environmental Impact Statement, Solwara 1 Project; Coffey Natural Systems Pty Ltd.: Brisbane, Australia, 2008; Report No.: CR 7008_09_v4. [Google Scholar]
- Fallon, E.K.; Niehorster, E.; Brooker, R.A.; Scott, T.B. Experimental leaching of massive sulphide from TAG active hydrothermal mound and implications for seafloor mining. Mar. Pollut. Bull. 2018, 126, 501–515. [Google Scholar] [CrossRef] [PubMed]
- Fuchida, S.; Ishibashi, J.; Shimada, K.; Nozaki, T.; Kumagai, H.; Kawachi, M.; Matsushita, Y.; Koshikawa, H. Onboard experiment investigating metal leaching of fresh hydrothermal sulfide cores into seawater. Geochem. Trans. 2018, 19, 15. [Google Scholar] [CrossRef] [PubMed]
- Fuchida, S.; Yokoyama, A.; Fukuchi, R.; Ishibashi, J.; Kawagucci, S.; Kawachi, M.; Koshikawa, H. Leaching of Metals and Metalloids from Hydrothermal Ore Particulates and Their Effects on Marine Phytoplankton. ACS Omega 2017, 2, 3175–3182. [Google Scholar] [CrossRef] [PubMed]
- Simpson, S.; Angel, B.; Hamilton, I.; Spadaro, D.; Binet, M. Water and Sediment Characterisation and Toxicity Assessment for the Solwara 1 Project; Coffey Natural Systems Pty Ltd.: Brisbane, Australia, 2007; CSIRO Land and Water Science Report 68/07. [Google Scholar]
- Parry, D.L. Solwara 1 Project Elutriate Report Phase 1 and 2; Coffey Natural Systems Pty Ltd.: Brisbane, Australia, 2008; Tropical Futures: Mineral Program Charles Darwin University Report. [Google Scholar]
- Knight, R.D.; Roberts, S.; Cooper, M.J. Investigating monomineralic and polymineralic reactions during the oxidation of sulphide minerals in seawater: Implications for mining seafloor massive sulphide deposits. Appl. Geochem. 2018, 90, 63–74. [Google Scholar] [CrossRef]
- Rimstidt, J.D.; Chermak, J.A.; Gagen, P.M. Rates of reaction of galena, sphalerite, chalcopyrite, and arsenopyrite with Fe (III) in acidic solutions. In Environmental Geochemistry of Sulfide Oxidation; Alpers, C.N., Blowes, D.W., Eds.; American Chemical Society: Washington, DC, USA, 1994; pp. 2–13. [Google Scholar]
- Corkhill, C.L. The Mineralogical and Biogeochemical Transformations Associated with As-Bearing Sulphide Minerals in Acid Mine Drainage System; The University of Manchester: Manchester, UK, 2008. [Google Scholar]
- Koski, R.A.; Munk, L.; Foster, A.L.; Shanks, W.C.; Stillings, L.L. Sulfide oxidation and distribution of metals near abandoned copper mines in coastal environments, Prince William Sound, Alaska, USA. Appl. Geochem. 2008, 23, 227–254. [Google Scholar] [CrossRef]
- Lizama, H.M.; Suzuki, I. Interaction of chalcopyrite and sphalerite with pyrite during leaching by Thiobacillus ferrooxidans and Thiobacillus thiooxidans. Can. J. Microbiol. 1991, 37, 304–311. [Google Scholar] [CrossRef]
- Vera, M.; Schippers, A.; Sand, W. Progress in bioleaching: Fundamentals and mechanisms of bacterial metal sulfide oxidation-part A. Appl. Microbiol. Biotechnol. 2013, 97, 7529–7541. [Google Scholar] [CrossRef] [PubMed]
- Ahonen, L.; Hiltunen, P.; Tuovinen, O. The role of pyrrhotite and pyrite in the bacterial leaching of chalcopyrite ores. In Fundamental and Applied Biohydrometallurgy; Lawrence, R.W., Branion, R.M.R., Ebner, H.G., Eds.; Elsevier: Amsterdam, The Netherlands, 1986; pp. 13–22. [Google Scholar]
- Berry, V.K.; Murr, L.E.; Hiskey, J.B. Galvanic interaction between chalcopyrite and pyrite during bacterial leaching of low-grade waste. Hydrometallurgy 1978, 3, 309–326. [Google Scholar] [CrossRef]
- Jyothi, N.; Sudha, K.N.; Natarajan, K.A. Electrochemical aspects of selective bioleaching of sphalerite and chalcopyrite from mixed sulphides. Int. J. Miner. Process. 1989, 27, 189–203. [Google Scholar] [CrossRef]
- Mehta, A.P.; Murr, L.E. Kinetic study of sulfide leaching by galvanic interaction between chalcopyrite, pyrite, and sphalerite in the presence of T. ferrooxidans (30 °C) and a thermophilic microorganism (55 °C). Biotechnol. Bioeng. 1982, 24, 919–940. [Google Scholar] [CrossRef] [PubMed]
- Natarajan, K.A.; Iwasaki, I. Role of Galvanic Interactions in the Bioleaching of Duluth Gabbro Copper-Nickel Sulfides. Sep. Sci. Technol. 1983, 18, 1095–1111. [Google Scholar] [CrossRef]
- Meier, D.V.; Pjevac, P.; Bach, W.; Markert, S.; Schweder, T.; Jamieson, J.; Petersen, S.; Amann, R.; Meyerdierks, A. Microbial metal-sulfide oxidation in inactive hydrothermal vent chimneys suggested by metagenomic and metaproteomic analyses. Environ. Microbiol. 2019. [Google Scholar] [CrossRef] [PubMed]
- Wong, J.W.C.; Xiang, L.; Chan, L.C. pH Requirement for the Bioleaching of Heavy Metals from Anaerobically Digested Wastewater Sludge. Water Air Soil Pollut. 2002, 138, 25–35. [Google Scholar] [CrossRef]
- Cui, X.; Wang, X.; Li, Y.; Lu, A.; Hao, R.; Wang, C.; Ding, H. Bioleaching of a Complex Co-Ni-Cu Sulfide Flotation Concentrate by Bacillus megaterium QM B1551 at Neutral pH. Geomicrobiol. J. 2016, 33, 734–741. [Google Scholar] [CrossRef]
- McBeth, J.M.; Little, B.J.; Ray, R.I.; Farrar, K.M.; Emerson, D. Neutrophilic iron-oxidizing “Zetaproteobacteria” and mild steel corrosion in nearshore marine environments. Appl. Environ. Microbiol. 2011, 77, 1405–1412. [Google Scholar] [CrossRef] [PubMed]
- Bilenker, L.D.; Romano, G.Y.; McKibben, M.A. Kinetics of sulfide mineral oxidation in seawater: Implications for acid generation during in situ mining of seafloor hydrothermal vent deposits. Appl. Geochem. 2016, 75, 20–31. [Google Scholar] [CrossRef]
- Boschen, R.E.; Rowden, A.A.; Clark, M.R.; Pallentin, A.; Gardner, J.P.A. Seafloor massive sulfide deposits support unique megafaunal assemblages: Implications for seabed mining and conservation. Mar. Environ. Res. 2016, 115, 78–88. [Google Scholar] [CrossRef] [PubMed]
- Boschen, R.E.; Rowden, A.A.; Clark, M.R.; Gardner, J.P.A. Mining of deep-sea seafloor massive sulfides: A review of the deposits, their benthic communities, impacts from mining, regulatory frameworks and management strategies. Ocean Coast. Manag. 2013, 84, 54–67. [Google Scholar] [CrossRef] [Green Version]
- Van Dover, C.L. The biological environment of polymetallic sulphide deposits, the potential impact of exploration and mining on this environment and data required to establish environmental baselines in exploration areas. In Polymetallic Sulphides and Cobalt-rich Ferromanganese Crusts Deposits: Establishment of Environmental Baselines and an Associated Monitoring Programme During Exploration; International Seabed Authority: Kingston, Jamaica, 2007; pp. 169–190. [Google Scholar]
- Van Dover, C.L. Mining seafloor massive sulphides and biodiversity: What is at risk? ICES J. Mar. Sci. 2010, 68, 341–348. [Google Scholar] [CrossRef]
- Van Dover, C.L. Impacts of anthropogenic disturbances at deep-sea hydrothermal vent ecosystems: A review. Mar. Environ. Res. 2014, 102, 59–72. [Google Scholar] [CrossRef] [PubMed]
- Collins, P.C.; Croot, P.; Carlsson, J.; Colaço, A.; Grehan, A.; Hyeong, K.; Kennedy, R.; Mohn, C.; Smith, S.; Yamamoto, H.; et al. A primer for the Environmental Impact Assessment of mining at seafloor massive sulfide deposits. Mar. Policy 2013, 42, 198–209. [Google Scholar] [CrossRef]
- Newman, M.C.; McIntosh, A.W. Metal Ecotoxicology: Concepts & Applications; Lewis Publishers: Chelsea, MI, USA, 1991; ISBN 0873714113. [Google Scholar]
- Simpson, S.L.; Spadaro, D.A. Bioavailability and Chronic Toxicity of Metal Sulfide Minerals to Benthic Marine Invertebrates: Implications for Deep Sea Exploration, Mining and Tailings Disposal. Environ. Sci. Technol. 2016, 50, 4061–4070. [Google Scholar] [CrossRef] [PubMed]
- Edgcomb, V.P.; Molyneaux, S.J.; Saito, M.A.; Lloyd, K.; Boer, S.; Wirsen, C.O.; Atkins, M.S.; Teske, A. Sulfide Ameliorates Metal Toxicity for Deep-Sea Hydrothermal Vent Archaea. Appl. Environ. Microbiol. 2004, 70, 2551–2555. [Google Scholar] [CrossRef] [PubMed] [Green Version]
- Koski, R. Metal Dispersion Resulting from Mining Activities in Coastal Environments: A Pathways Approach. Oceanography 2012, 25, 170–183. [Google Scholar] [CrossRef] [Green Version]
- Hauton, C.; Brown, A.; Thatje, S.; Mestre, N.C.; Bebianno, M.J.; Martins, I.; Bettencourt, R.; Canals, M.; Sanchez-Vidal, A.; Shillito, B.; et al. Identifying Toxic Impacts of Metals Potentially Released during Deep-Sea Mining—A Synthesis of the Challenges to Quantifying Risk. Front. Mar. Sci. 2017, 4, 368. [Google Scholar] [CrossRef]
- Llanos, J.; Capasso, C.; Parisi, E.; Prieur, D.; Jeanthon, C. Susceptibility to Heavy Metals and Cadmium Accumulation in Aerobic and Anaerobic Thermophilic Microorganisms Isolated from Deep-Sea Hydrothermal Vents. Curr. Microbiol. 2000, 41, 201–205. [Google Scholar] [CrossRef] [PubMed]
- Vetriani, C.; Chew, Y.S.; Miller, S.M.; Yagi, J.; Coombs, J.; Lutz, R.A.; Barkay, T. Mercury adaptation among bacteria from a deep-sea hydrothermal vent. Appl. Environ. Microbiol. 2005, 71, 220–226. [Google Scholar] [CrossRef] [PubMed]
- Ruelas-Inzunza, J.; Soto, L.A.; Páez-Osuna, F. Heavy-metal accumulation in the hydrothermal vent clam Vesicomya gigas from Guaymas basin, Gulf of California. Deep Sea Res. Part I Oceanogr. Res. Pap. 2003, 50, 757–761. [Google Scholar] [CrossRef]
- Kádár, E.; Costa, V.; Santos, R.S.; Powell, J.J. Tissue partitioning of micro-essential metals in the vent bivalve Bathymodiolus azoricus and associated organisms (endosymbiont bacteria and a parasite polychaete) from geochemically distinct vents of the Mid-Atlantic Ridge. J. Sea Res. 2006, 56, 45–52. [Google Scholar] [CrossRef]
- Wang, C.L.; Michels, P.C.; Dawson, S.C.; Kitisakkul, S.; Baross, J.A.; Keasling, J.D.; Clark, D.S. Cadmium removal by a new strain of Pseudomonas aeruginosa in aerobic culture. Appl. Environ. Microbiol. 1997, 63, 4075–4078. [Google Scholar] [PubMed]
- Auguste, M.; Mestre, N.C.; Rocha, T.L.; Cardoso, C.; Cueff-Gauchard, V.; Le Bloa, S.; Cambon-Bonavita, M.A.; Shillito, B.; Zbinden, M.; Ravaux, J.; et al. Development of an ecotoxicological protocol for the deep-sea fauna using the hydrothermal vent shrimp Rimicaris exoculata. Aquat. Toxicol. 2016, 175, 277–285. [Google Scholar] [CrossRef] [PubMed]
- Martins, I.; Goulart, J.; Martins, E.; Morales-Román, R.; Marín, S.; Riou, V.; Colaço, A.; Bettencourt, R. Physiological impacts of acute Cu exposure on deep-sea vent mussel Bathymodiolus azoricus under a deep-sea mining activity scenario. Aquat. Toxicol. 2017, 193, 40–49. [Google Scholar] [CrossRef] [PubMed]
- Mestre, N.C.; Rocha, T.L.; Canals, M.; Cardoso, C.; Danovaro, R.; Dell’Anno, A.; Gambi, C.; Regoli, F.; Sanchez-Vidal, A.; Bebianno, M.J. Environmental hazard assessment of a marine mine tailings deposit site and potential implications for deep-sea mining. Environ. Pollut. 2017, 228, 169–178. [Google Scholar] [CrossRef] [PubMed]
- Brown, A.; Thatje, S.; Hauton, C. The Effects of Temperature and Hydrostatic Pressure on Metal Toxicity: Insights into Toxicity in the Deep Sea. Environ. Sci. Technol. 2017, 51, 10222–10231. [Google Scholar] [CrossRef] [PubMed]
- Luther, G.W.; Rickard, D.T.; Theberge, S.; Olroyd, A. Determination of Metal (Bi)Sulfide Stability Constants of Mn2+, Fe2+, Co2+, Ni2+, Cu2+, and Zn2+ by Voltammetric Methods. Environ. Sci. Technol. 1996, 30, 671–679. [Google Scholar] [CrossRef]
- Metz, S.; Trefry, J.H. Chemical and mineralogical influences on concentrations of trace metals in hydrothermal fluids. Geochim. Cosmochim. Acta 2000, 13, 2267–2279. [Google Scholar] [CrossRef]
- Brown, A.; Wright, R.; Mevenkamp, L.; Hauton, C. A comparative experimental approach to ecotoxicology in shallow-water and deep-sea holothurians suggests similar behavioural responses. Aquat. Toxicol. 2017, 191, 10–16. [Google Scholar] [CrossRef] [PubMed]
- Jou, L.-J.; Chen, B.-C.; Chen, W.-Y.; Liao, C.-M. Sensory determinants of valve rhythm dynamics provide in situ biodetection of copper in aquatic environments. Environ. Sci. Pollut. Res. 2016, 23, 5374–5389. [Google Scholar] [CrossRef] [PubMed]
- Mevenkamp, L.; Brown, A.; Hauton, C.; Kordas, A.; Thatje, S.; Vanreusel, A. Hydrostatic pressure and temperature affect the tolerance of the free-living marine nematode Halomonhystera disjuncta to acute copper exposure. Aquat. Toxicol. 2017, 192, 178–183. [Google Scholar] [CrossRef] [PubMed]
- Koschinsky, A.; Borowski, C.; Halbach, P. Reactions of the Heavy Metal Cycle to Industrial Activities in the Deep Sea: An Ecological Assessment. Int. Rev. Hydrobiol. 2003, 88, 102–127. [Google Scholar] [CrossRef]
- Petersen, S.; Krätschell, A.; Augustin, N.; Jamieson, J.; Hein, J.R.; Hannington, M.D. News from the seabed-Geological characteristics and resource potential of deep-sea mineral resources. Mar. Policy 2016, 70, 175–187. [Google Scholar] [CrossRef]
- GESAMP. Proceeding of the GESAMP International Workshop on the Impacts of Mine Tailings in the Marine Environment (IMO/FAO/UNESCO-IOC/UNIDO/WMO/IAEA/UN/UNEP/UNDP Joint Group of Experts on the Scientific Aspects of Marine Environmental Protection). Rep. Stud. GESAMP 2016, 94, 84. [Google Scholar]
- Dold, B. Bernhard Submarine Tailings Disposal (STD)—A Review. Minerals 2014, 4, 642–666. [Google Scholar] [CrossRef]
- Lindsay, M.B.J.; Moncur, M.C.; Bain, J.G.; Jambor, J.L.; Ptacek, C.J.; Blowes, D.W. Geochemical and mineralogical aspects of sulfide mine tailings. Appl. Geochem. 2015, 57, 157–177. [Google Scholar] [CrossRef]
- Vare, L.L.; Baker, M.C.; Howe, J.A.; Levin, L.A.; Neira, C.; Ramirez-Llodra, E.Z.; Reichelt-Brushett, A.; Rowden, A.A.; Shimmield, T.M.; Simpson, S.L.; et al. Scientific Considerations for the Assessment and Management of Mine Tailings Disposal in the Deep Sea. Front. Mar. Sci. 2018, 5, 17. [Google Scholar] [CrossRef]
- Josefson, A.B.; Hansen, J.L.S.; Asmund, G.; Johansen, P. Threshold response of benthic macrofauna integrity to metal contamination in West Greenland. Mar. Pollut. Bull. 2008, 56, 1265–1274. [Google Scholar] [CrossRef] [PubMed]
- Elberling, B.; Asmund, G.; Kunzendorf, H.; Krogstad, E.J. Geochemical trends in metal-contaminated fiord sediments near a former lead–zinc mine in West Greenland. Appl. Geochem. 2002, 17, 493–502. [Google Scholar] [CrossRef]
- Perner, K.; Leipe, T.; Dellwig, O.; Kuijpers, A.; Mikkelsen, N.; Andersen, T.J.; Harff, J. Contamination of arctic Fjord sediments by Pb–Zn mining at Maarmorilik in central West Greenland. Mar. Pollut. Bull. 2010, 60, 1065–1073. [Google Scholar] [CrossRef] [PubMed]
- Andrade, S.; Moffett, J.; Correa, J.A. Distribution of dissolved species and suspended particulate copper in an intertidal ecosystem affected by copper mine tailings in Northern Chile. Mar. Chem. 2006, 101, 203–212. [Google Scholar] [CrossRef]
- Lee, M.R.; Correa, J.A.; Zhang, H. Effective metal concentrations in porewater and seawater labile metal concentrations associated with copper mine tailings disposal into the coastal waters of the Atacama region of northern Chile. Mar. Pollut. Bull. 2002, 44, 956–961. [Google Scholar] [CrossRef]
- Sanders, J.G.; Riedel, G.F.; Osman, R.W. Arsenic cycling and its impact in estuarine and coastal marine ecosystems. In Arsenic in the Environment. Part 1: Cycling and Characterisation; Nriagu, J.O., Ed.; John Wiley & Sons, Inc.: New York, NY, USA, 1994; pp. 289–308. [Google Scholar]
- Price, R.E.; Pichler, T. Distribution, speciation and bioavailability of arsenic in a shallow-water submarine hydrothermal system, Tutum Bay, Ambitle Island, PNG. Chem. Geol. 2005, 224, 122–135. [Google Scholar] [CrossRef]
- Hannington, M.D.; de Ronde, C.E.J.; Petersen, S. Modern seafloor tectonics and submarine hydrothermal systems. Econ. Geol. One Hundredth Anniv. Vol. 2005, 100, 111–141. [Google Scholar]
- German, C.R.; Petersen, S.; Hannington, M.D. Hydrothermal exploration of mid-ocean ridges: Where might the largest sulfide deposits be forming? Chem. Geol. 2016, 420, 114–126. [Google Scholar] [CrossRef] [Green Version]
- Hannington, M.; Jamieson, J. Estimating the metal content of SMS deposits. In Proceedings of the Oceans’11 MTS/IEEE Kona, Waikoloa, HI, USA, 19–22 September 2011. [Google Scholar]
- Monecke, T.; Petersen, S.; Hannington, M.D.; Grant, H.; Samson, I. The minor element endowment of modern sea-floor massive sulfide deposits and comparison with deposits hosted in ancient volcanic successions. Rev. Econ. Geol. 2016, 18, 245–306. [Google Scholar]
- Hannington, M.D.; Jamieson, J.; Monecke, T.; Petersen, S. Modern Sea-Floor Massive Sulfides and Base Metal Resources: Toward an Estimate of Global Sea-Floor Massive Sulfide Potential. Soc. Econ. Geol. Spec. Publ. 15 2010, 15, 317–338. [Google Scholar]
- Stoffers, P.; Hannington, M.; Wright, I.; Herzig, P.; Ronde, C. de Elemental mercury at submarine hydrothermal vents in the Bay of Plenty, Taupo volcanic zone, New Zealand. Geology 1999, 27, 931–934. [Google Scholar] [CrossRef]
- Abraitis, P.; Pattrick, R.A.D.; Vaughan, D.J. Variations in the compositional, textural and electrical properties of natural pyrite: A review. Int. J. Miner. Process. 2004, 74, 41–59. [Google Scholar] [CrossRef]
- Chen, J.; Wang, L.; Chen, Y.; Guo, J. A DFT study of the effect of natural impurities on the electronic structure of galena. Int. J. Miner. Process. 2011, 98, 132–136. [Google Scholar] [CrossRef]
- Chen, Y.; Chen, J.; Guo, J. A DFT study on the effect of lattice impurities on the electronic structures and floatability of sphalerite. Miner. Eng. 2010, 23, 1120–1130. [Google Scholar] [CrossRef]
- Lehner, S.; Savage, K.; Ciobanu, M.; Cliffel, D.E. The effect of As, Co, and Ni impurities on pyrite oxidation kinetics: An electrochemical study of synthetic pyrite. Geochim. Cosmochim. Acta 2007, 71, 2491–2509. [Google Scholar] [CrossRef]
- Liu, R.; Wolfe, A.L.; Dzombak, D.A.; Stewart, B.W.; Capo, R.C. Comparison of dissolution under oxic acid drainage conditions for eight sedimentary and hydrothermal pyrite samples. Environ. Geol. 2007, 56, 171–182. [Google Scholar] [CrossRef]
- Wei, D. Semiconductor Electrochemistry of Particulate Pyrite: Dissolution via Hole and Electron Pathways. J. Electrochem. Soc. 1996, 143, 3192. [Google Scholar] [CrossRef]
- Jamieson, H.E.; Walker, S.R.; Parsons, M.B. Mineralogical characterization of mine waste. Appl. Geochem. 2015, 57, 85–105. [Google Scholar] [CrossRef]
- Fallon, E.K.; Petersen, S.; Brooker, R.A.; Scott, T.B. Oxidative dissolution of hydrothermal mixed-sulphide ore: An assessment of current knowledge in relation to seafloor massive sulphide mining. Ore Geol. Rev. 2017, 86, 309–337. [Google Scholar] [CrossRef]
- Wohlgemuth-Ueberwasser, C.C.; Viljoen, F.; Petersen, S.; Vorster, C. Distribution and solubility limits of trace elements in hydrothermal black smoker sulfides: An in-situ LA-ICP-MS study. Geochim. Cosmochim. Acta 2015, 159, 16–41. [Google Scholar] [CrossRef]
- Butler, I.B.; Nesbitt, R.W. Trace element distributions in the chalcopyrite wall of a black smoker chimney: Insights from laser ablation inductively coupled plasma mass spectrometry (LA–ICP–MS). Earth Planet. Sci. Lett. 1999, 167, 335–345. [Google Scholar] [CrossRef]
- Cook, N.J.; Ciobanu, C.L.; Pring, A.; Skinner, W.; Shimizu, M.; Danyushevsky, L.; Saini-Eidukat, B.; Melcher, F. Trace and minor elements in sphalerite: A LA-ICPMS study. Geochim. Cosmochim. Acta 2009, 73, 4761–4791. [Google Scholar] [CrossRef]
- Ye, L.; Cook, N.J.; Ciobanu, C.L.; Yuping, L.; Qian, Z.; Tiegeng, L.; Wei, G.; Yulong, Y.; Danyushevskiy, L. Trace and minor elements in sphalerite from base metal deposits in South China: A LA-ICPMS study. Ore Geol. Rev. 2011, 39, 188–217. [Google Scholar] [CrossRef]
- Petersen, S.; Herzig, P.M.; Hannington, M.D. Third dimension of a presently forming VMS deposit: TAG hydrothermal mound, Mid-Atlantic Ridge, 26°N. Miner. Depos. 2000, 35, 233–259. [Google Scholar] [CrossRef]
- Haase, K.M.; Petersen, S.; Koschinsky, A.; Seifert, R.; Devey, C.W.; Keir, R.; Lackschewitz, K.S.; Melchert, B.; Perner, M.; Schmale, O.; et al. Young volcanism and related hydrothermal activity at 5°S on the slow-spreading southern Mid-Atlantic Ridge. Geochem. Geophys. Geosyst. 2007, 8. [Google Scholar] [CrossRef] [Green Version]
- Petersen, S.; Kuhn, K.; Kuhn, T.; Augustin, N.; Hékinian, R.; Franz, L.; Borowski, C. The geological setting of the ultramafic-hosted Logatchev hydrothermal field (14°45′N, Mid-Atlantic Ridge) and its influence on massive sulfide formation. Lithos 2009, 112, 40–56. [Google Scholar] [CrossRef]
- Petersen, S.; Monecke, T.; Westhues, A.; Hannington, M.D.; Gemmell, J.B.; Sharpe, R.; Peters, M.; Strauss, H.; Lackschewitz, K.; Augustin, N.; et al. Drilling Shallow-Water Massive Sulfides at the Palinuro Volcanic Complex, Aeolian Island Arc, Italy. Econ. Geol. 2014, 109, 2129–2158. [Google Scholar] [CrossRef]
- Yang, K.; Scott, S.D. Possible contribution of a metal-rich magmatic fluid to a sea-floor hydrothermal system. Nature 1996, 383, 420–423. [Google Scholar] [CrossRef]
- Binns, R.A. Data Report: Geochemistry of Massive and Semimassive Sulphides from Site 1189, Ocean Drilling Program Leg 193; Barriga, F.J.A.S., Binns, R.A., Miller, D.J., Herzig, P.M., Eds.; Texas A&M University: College Station, TX, USA, 2006; pp. 1–22. [Google Scholar]
- Beaulieu, S.E.; Baker, E.T.; German, C.R.; Maffei, A. An authoritative global database for active submarine hydrothermal vent fields. Geochem. Geophys. Geosyst. 2013, 14, 4892–4905. [Google Scholar] [CrossRef] [Green Version]
- Fietzke, J.; Frische, M. Experimental evaluation of elemental behavior during LA-ICP-MS: Influences of plasma conditions and limits of plasma robustness. J. Anal. At. Spectrom. 2016, 31, 234–244. [Google Scholar] [CrossRef]
- Barakat, M.A. New trends in removing heavy metals from industrial wastewater. Arab. J. Chem. 2011, 4, 361–377. [Google Scholar] [CrossRef] [Green Version]
- Kearns, J.; Turner, A. An evaluation of the toxicity and bioaccumulation of bismuth in the coastal environment using three species of macroalga. Environ. Pollut. 2016, 208, 435–441. [Google Scholar] [CrossRef] [PubMed] [Green Version]
- Jeanthon, C.; Prieur, D. Resistance to heavy metals of heterotrophic bacteria isolated from the deep-sea hydrothermal vent polychaete, Alvinella pompejana. Prog. Oceanogr. 1990, 24, 81–88. [Google Scholar] [CrossRef]
- Luoma, S.N.; Ho, Y.B.; Bryan, G.W. Fate, bioavailability and toxicity of silver in estuarine environments. Mar. Pollut. Bull. 1995, 31, 44–54. [Google Scholar] [CrossRef]
- Hogstrand, C.; Wood, C.M. Toward a better understanding of the bioavailability, physiology, and toxicity of silver in fish: Implications for water quality criteria. Environ. Toxicol. Chem. 1998, 17, 547–561. [Google Scholar] [CrossRef]
- Barriada, J.L.; Tappin, A.D.; Evans, E.H.; Achterberg, E.P. Dissolved silver measurements in seawater. TrAC Trends Anal. Chem. 2007, 26, 809–817. [Google Scholar] [CrossRef]
- Wohlgemuth-Ueberwasser, C.C.; Viljoen, F.; McClung, C.R. Metamorphic alteration of the massive sulfide horizon from the Salt River VMS deposit (South Africa). Ore Geol. Rev. 2014, 56, 45–52. [Google Scholar] [CrossRef]
- Jochum, K.P.; Stoll, B.; Herwig, K.; Willbold, M.; Hofmann, A.W.; Amini, M.; Aarburg, S.; Abouchami, W.; Hellebrand, E.; Mocek, B.; et al. MPI-DING reference glasses for in situ microanalysis: New reference values for element concentrations and isotope ratios. Geochem. Geophys. Geosyst. 2006, 7. [Google Scholar] [CrossRef] [Green Version]
- George, L.L.; Cook, N.J.; Ciobanu, C.L. Partitioning of trace elements in co-crystallized sphalerite–galena–chalcopyrite hydrothermal ores. Ore Geol. Rev. 2016, 77, 97–116. [Google Scholar] [CrossRef]
- George, L.; Cook, N.; Ciobanu, C. Minor and Trace Elements in Natural Tetrahedrite-Tennantite: Effects on Element Partitioning among Base Metal Sulphides. Minerals 2017, 7, 17. [Google Scholar] [CrossRef]
- Humphris, S.E.; Herzig, P.M.; Miller, J. Ocean Drilling Program: Leg 158 Preliminary Report, TAG: Drilling an Active Hydrothermal System on a Sediment-Free Slow-Spreading Ridge; Texas A&M University: College Station, TX, USA, 1994. [Google Scholar]
- Haase, K. Cruise Report M064/1—MARSUED II; Leitstelle Meteor: Hamburg, Germany, 2005. [Google Scholar]
- Kuhn, T. Cruise Report M060/3—HYDROMAR I—Mineralogical, Geochemical, and Biological Investigations of Hydrothermal Systems on the Mid-Atlantic Ridge between 14°45′N and 15°05′N (No. 03-04); Leitstelle Meteor: Hamburg, Germany, 2004. [Google Scholar]
- Herzig, P.; Suess, E.; Linke, P. RV Sonne Cruise Report SO109 Hydrotrace; GEOMAR Report 58; GEOMAR: Kiel, Germany, 1997. [Google Scholar]
- Marchig, V. Cruise Report: SO 62: GEOMETEP 5 04.04.1989-03.07; Bundesanstalt für Geowissenschaften und Rohstoffe: Hannover, Germany, 1989. [Google Scholar]
- Herzig, P.; Kuhn, T.; Petersen, S. Detailed Investigation of the Magmatic-Hydrothermal Gold Mineralisation at Conical Seamount (New Ireland Basin) and of Massive Sulphides at PACMANUS (Eastern Manus Basin); Papua New Guinea by shallow drilling: Cruise Report: SO-166 CONDRILL; Freiberg University of Mining and Technology: Freiberg, Germany, 2003. [Google Scholar]
- Bach, W.; Dubilier, N.; Borowski, C.; Breuer, C.; Brumner, B.; Franke, P.; Herschelmann, O.; Hourdez, S.; Jonda, L.; Jons, N.; et al. Report and Preliminary Results of RV SONNE Cruise SO 216, Townsville (Australia)-Makassar (Indonesia), June 14–July 23, 2011. BAMBUS, Back-Arc Manus Basin Underwater Solfataras; University of Bremen: Bremen, Germany, 2011. [Google Scholar]
- Petersen, S.; Monecke, T. Cruise Report M073/2—Shallow Drilling of Hydrothermal Sites in the Tyrrhenian Sea (Palindrill) (No. 30); IFM-GEOMAR: Kiel, Germany, 2009. [Google Scholar]
- Humphris, S.E.; Herzig, P.M.; Miller, D.J.; Alt, J.C.; Becker, K.; Brown, D.; Brügmann, G.; Chiba, H.; Fouquet, Y.; Gemmell, J.B.; et al. The internal structure of an active sea-floor massive sulphide deposit. Nature 1995, 377, 713–716. [Google Scholar] [CrossRef]
- Hannington, M.D.; Jonasson, I.R.; Herzig, P.M.; Petersen, S. Physical and chemical processes of seafloor mineralization at mid-ocean ridges. In Seafloor Hydrothermal Systems: Physical, Chemical, Biological, and Geological Interactions; American Geophysical Union: Washington DC, USA, 1995; pp. 115–157. ISBN 9781118663998. [Google Scholar]
- Petersen, S.; Herzig, P.M.; Schwarz-Schampera, U.; Hannington, M.D.; Jonasson, I.R. Hydrothermal precipitates associated with bimodal volcanism in the Central Bransfield Strait, Antarctica. Miner. Depos. 2004, 39, 358–379. [Google Scholar] [CrossRef]
- Monecke, T.; Petersen, S.; Hannington, M.M.D. Constraints on Water Depth of Massive Sulfide Formation: Evidence from Modern Seafloor Hydrothermal Systems in Arc-Related Settings. Econ. Geol. 2014, 109, 2079–2101. [Google Scholar] [CrossRef]
- Fouquet, Y.; Cambon, P.; Etoubleau, J.; Charlou, J.L.; Ondréas, H.; Barriga, F.J.A.S.; Cherkashov, G.; Semkova, T.; Poroshina, I.; Bohn, M.; et al. Geodiversity of Hydrothermal Processes Along the Mid-Atlantic Ridge and Ultramafic-Hosted Mineralization: A New Type of Oceanic Cu-Zn-Co-Au Volcanogenic Massive Sulfide Deposit. Divers. Hydrotherm. Syst. Slow Spread. Ocean Ridges 2010, 188, 321–367. [Google Scholar]
- Binns, R.A.; Barriga, F.J.A.S.; Miller, J. Proceedings of the Ocean Drilling Program; Initial Reports; Anatomy of an Active Felsic-Hosted Hydrothermal System, Eastern Manus Basin, 193; Texas A&M University: College Station, TX, USA, 2002. [Google Scholar]
- Fouquet, Y.; Wafik, A.; Cambon, P.; Mevel, C.; Meyer, G.; Gente, P. Tectonic setting and mineralogical and geochemical zonation in the Snake Pit sulfide deposit (Mid-Atlantic Ridge at 23°N). Econ. Geol. 1993, 88, 2018–2036. [Google Scholar] [CrossRef]
- Marques, A.F.A.; Barriga, F.; Chavagnac, V.; Fouquet, Y. Mineralogy, geochemistry, and Nd isotope composition of the Rainbow hydrothermal field, Mid-Atlantic Ridge. Miner. Depos. 2006, 41, 52–67. [Google Scholar] [CrossRef] [Green Version]
- Wang, Y.; Han, X.; Petersen, S.; Jin, X.; Qiu, Z.; Zhu, J. Mineralogy and geochemistry of hydrothermal precipitates from Kairei hydrothermal field, Central Indian Ridge. Mar. Geol. 2014, 354, 69–80. [Google Scholar] [CrossRef]
- Libbey, R.B.; Williams-Jones, A.E. Relating sulfide mineral zonation and trace element chemistry to subsurface processes in the Reykjanes geothermal system, Iceland. J. Volcanol. Geotherm. Res. 2016, 310, 225–241. [Google Scholar] [CrossRef]
- Migdisov, A.A.; Zezin, D.; Williams-Jones, A.E. An experimental study of Cobalt (II) complexation in Cl− and H2S-bearing hydrothermal solutions. Geochim. Cosmochim. Acta 2011, 75, 4065–4079. [Google Scholar] [CrossRef]
- Mozgova, N.N.; Efimov, A.; Borodaev, Y.S.; Krasnov, S.G.; Cherkashov, G.A.; Stepanova, T.V.; Ashadze, A.M. Mineralogy and chemistry of massive sulfides from the Logatchev hydrothermal field (14 degrees 45’N Mid-Atlantic Ridge). Explor. Min. Geol. 1999, 8, 379–395. [Google Scholar]
- Marques, A.F.A.; Barriga, F.J.A.S.; Scott, S.D. Sulfide mineralization in an ultramafic-rock hosted seafloor hydrothermal system: From serpentinization to the formation of Cu–Zn–(Co)-rich massive sulfides. Mar. Geol. 2007, 245, 20–39. [Google Scholar] [CrossRef]
- Lein, A.Y.; Bogdanov, Y.A.; Maslennikov, V.V.; Li, S.; Ulyanova, N.V.; Maslennikova, S.P.; Ulyanov, A.A. Sulfide minerals in the Menez Gwen nonmetallic hydrothermal field (Mid-Atlantic Ridge). Lithol. Miner. Resour. 2010, 45, 305–323. [Google Scholar] [CrossRef]
- Hannington, M.; Galley, A. Comparison of the TAG Mound and Stockwork Complex with Cyprus-Type Massive Sulfide Deposits. Proc. Ocean Drill. Program. Sci. Results 1998, 158. [Google Scholar]
- Hannington, M.; Herzig, P.; Scott, S.; Thompson, G.; Rona, P.A. Comparative mineralogy and geochemistry of gold-bearing sulfide deposits on the mid-ocean ridges. Mar. Geol. 1991, 101, 217–248. [Google Scholar] [CrossRef]
- Butterfield, D.; Massoth, G.; McDuff, R.; Lupton, J. Geochemistry of hydrothermal fluids from Ashes Vent Field, Axial Seamount, Juan de Fuca Ridge: Subseafloor boiling and subsequent fluid-rock. J. Geophys. Res 1990, 95, 12895–12921. [Google Scholar] [CrossRef]
- Chiba, H.; Masuda, H.; Lee, S.-Y.; Fujioka, K. Chemistry of hydrothermal fluids at the TAG Active Mound, MAR 26°N, in 1998. Geophys. Res. Lett. 2001, 28, 2919–2922. [Google Scholar] [CrossRef] [Green Version]
- Reeves, E.P.; Seewald, J.S.; Saccocia, P.; Bach, W.; Craddock, P.R.; Shanks, W.C.; Sylva, S.P.; Walsh, E.; Pichler, T.; Rosner, M. Geochemistry of hydrothermal fluids from the PACMANUS, Northeast Pual and Vienna Woods hydrothermal fields, Manus Basin, Papua New Guinea. Geochim. Cosmochim. Acta 2011, 75, 1088–1123. [Google Scholar] [CrossRef] [Green Version]
- Klevenz, V.; Bach, W.; Schmidt, K.; Hentscher, M.; Koschinsky, A.; Petersen, S. Geochemistry of vent fluid particles formed during initial hydrothermal fluid-seawater mixing along the Mid-Atlantic Ridge. Geochem. Geophys. Geosyst. 2011, 12. [Google Scholar] [CrossRef] [Green Version]
- Schwartz, M.O. Cadmium in Zinc Deposits: Economic Geology of a Polluting Element. Int. Geol. Rev. 2000, 42, 445–469. [Google Scholar] [CrossRef]
- Binns, R.A.; Scott, S.D. Actively forming polymetallic sulfide deposits associated with felsic volcanic rocks in the eastern Manus back-arc basin, Papua New Guinea. Econ. Geol. 1993, 88, 2226–2236. [Google Scholar] [CrossRef]
- Keith, M.; Haase, K.M.; Schwarz-Schampera, U.; Klemd, R.; Petersen, S.; Bach, W. Effects of temperature, sulfur, and oxygen fugacity on the composition of sphalerite from submarine hydrothermal vents. Geology 2014, 42, 699–702. [Google Scholar] [CrossRef]
- Spycher, N.F.; Reed, M.H. Evolution of a broadlands-type epithermal ore fluid along alternative P-T paths; implications for the transport and deposition of base, precious, and volatile metals. Econ. Geol. 1989, 84, 328–359. [Google Scholar] [CrossRef]
- Spycher, N.F.; Reed, M.H. As (III) and Sb(III) sulfide complexes: An evaluation of stoichiometry and stability from existing experimental data. Geochim. Cosmochim. Acta 1989, 53, 2185–2194. [Google Scholar] [CrossRef]
- Obolensky, A.A.; Gushchina, L.V.; Borisenko, A.S.; Borovikov, A.A.; Pavlova, G.G. Antimony in hydrothermal processes: Solubility, conditions of transfer, and metal-bearing capacity of solutions. Russ. Geol. Geophys. 2007, 48, 992–1001. [Google Scholar] [CrossRef]
- Stauffer, R.E.; Thompson, J.M. Arsenic and antimony in geothermal waters of Yellowstone National Park, Wyoming, USA. Geochim. Cosmochim. Acta 1984, 48, 2547–2561. [Google Scholar] [CrossRef]
- Kremheller, A.; Levine, A.K.; Gashurov, G. Hydrothermal preparation of two-component solid solutions from II–VI compounds. J. Electrochem. Soc. 1960, 107, 12. [Google Scholar] [CrossRef]
- Chen, J.; Chen, Y. A first-principle study of the effect of vacancy defects and impurities on the adsorption of O2 on sphalerite surfaces. Colloid. Surf. A Physicochem. Eng. Asp. 2010, 363, 56–63. [Google Scholar] [CrossRef]
- Perez, I.P.; Dutrizac, J. The effect of the iron content of sphalerite on its rate of dissolution in ferric sulphate and ferric chloride media. Hydrometallurgy 1991, 26, 211–232. [Google Scholar] [CrossRef]
- Weisener, C.G.; Smart, R.S.C.; Gerson, A.R. A comparison of the kinetics and mechanism of acid leaching of sphalerite containing low and high concentrations of iron. Int. J. Miner. Process. 2004, 74, 239–249. [Google Scholar] [CrossRef]
- Fouquet, Y.; Auclair, G.; Cambon, P.; Etoubleau, J. Geological setting and mineralogical and geochemical investigations on sulfide deposits near 13°N on the East Pacific Rise. Mar. Geol. 1988, 84, 145–178. [Google Scholar] [CrossRef]
- Wohlgemuth-Ueberwasser, C. Analysis of As and Sb in samples from Turtle Pits hydrothermal field using new standard material. Mineral. Mag. 2011, 75, 2169. [Google Scholar]
- Iwaida, C.; Ueno, H. Ore and gangue minerals of seafloor hydrothermal deposits in the Mariana trough. JAMSTEC Rep. Res. Dev. 2005, 1, 1–12. [Google Scholar]
- Suzuki, R.; Ishibashi, J.-I.; Nakaseama, M.; Konno, U.; Tsunogai, U.; Gena, K.; Chiba, H. Diverse Range of Mineralization Induced by Phase Separation of Hydrothermal Fluid: Case Study of the Yonaguni Knoll IV Hydrothermal Field in the Okinawa Trough Back-Arc Basin. Resour. Geol. 2008, 58, 267–288. [Google Scholar] [CrossRef] [Green Version]
- Ueno, H.; Hamasaki, H.; Murakawa, Y.; Kitazono, S.; Takeda, T. Ore and gangue minerals of sulfide chimneys from the North Knoll. JAMSTEC J. Deep Sea Res. 2003, 22, 19–62. [Google Scholar]
- Tivey, M.K.; Stakes, D.S.; Cook, T.L.; Hannington, M.D.; Petersen, S. A model for growth of steep-sided vent structures on the Endeavour Segment of the Juan de Fuca Ridge: Results of a petrologic and geochemical study. J. Geophys. Res. Solid Earth 1999, 104, 22859–22883. [Google Scholar] [CrossRef] [Green Version]
- Chetty, R.; Bali, A.; Mallik, R.C. Tetrahedrites as thermoelectric materials: An overview. J. Mater. Chem. C 2015, 3, 12364–12378. [Google Scholar] [CrossRef]
- Halbach, P.; Pracejus, B.; Maerten, A. Geology and mineralogy of massive sulfide ores from the central Okinawa Trough, Japan. Econ. Geol. 1993, 88, 2210–2225. [Google Scholar] [CrossRef]
- Herzig, P.M.; Hannington, M.D. Polymetallic massive sulphides at the modern seafloor: A review. Ore Geol. Rev. 1995, 10, 95–115. [Google Scholar] [CrossRef]
- Paradis, S.; Jonasson, I.R.; Le Cheminant, G.M.; Watkinson, D.H. Two zinc-rich chimneys from the plume site, Southern Juan de Fuca Ridge. Can. Mineral. 1988, 26, 637–654. [Google Scholar]
- Halbach, P.; Blum, N.; Münch, U.; Plüger, W.; Garbe-Schönberg, D.; Zimmer, M. Formation and decay of a modern massive sulfide deposit in the Indian Ocean. Miner. Depos. 1998, 33, 302–309. [Google Scholar] [CrossRef]
- Wang, Y.; Han, X.; Petersen, S.; Frische, M.; Qiu, Z.; Li, H.; Li, H.; Wu, Z.; Cui, R. Mineralogy and trace element geochemistry of sulfide minerals from the Wocan Hydrothermal Field on the slow-spreading Carlsberg Ridge, Indian Ocean. Ore Geol. Rev. 2017, 84, 1–19. [Google Scholar] [CrossRef]
- Hannington, M.D.; Thompson, G.; Rona, P.A.; Scott, S.D. Gold and native copper in supergene sulphides from the Mid-Atlantic Ridge. Nature 1988, 333, 64–66. [Google Scholar] [CrossRef]
- Herzig, P.M.; Hannington, M.D.; Scott, S.D.; Maliotis, G.; Rona, P.A.; Thompson, G. Gold-rich sea-floor gossans in the Troodos Ophiolite and on the Mid-Atlantic Ridge. Econ. Geol. 1991, 86, 1747–1755. [Google Scholar] [CrossRef]
- Grant, H.L.J.; Hannington, M.D.; Petersen, S.; Frische, M.; Fuchs, S.H. Constraints on the behavior of trace elements in the actively-forming TAG deposit, Mid-Atlantic Ridge, based on LA-ICP-MS analyses of pyrite. Chem. Geol. 2018, 498, 45–71. [Google Scholar] [CrossRef]
- Goh, S.W.; Buckley, A.N.; Lamb, R.N.; Rosenberg, R.A.; Moran, D. The oxidation states of copper and iron in mineral sulfides, and the oxides formed on initial exposure of chalcopyrite and bornite to air. Geochim. Cosmochim. Acta 2006, 70, 2210–2228. [Google Scholar] [CrossRef]
- Chouinard, A.; Paquette, J.; Williams-Jones, A.E. Crystallographic controls on trace-element incorporation in Auriferous pyrite from the Pascua epithermal high-sulfidation deposit, Chile-Argentina. Can. Mineral. 2005, 43, 951–963. [Google Scholar] [CrossRef]
- Archibald, S.M.; Migdisov, A.A.; Williams-Jones, A.E. An experimental study of the stability of copper chloride complexes in water vapor at elevated temperatures and pressures. Geochim. Cosmochim. Acta 2002, 66, 1611–1619. [Google Scholar] [CrossRef]
- Blanchard, M.; Wright, K.; Richard, C.; Catlow, A. Arsenic incorporation into FeS2 pyrite and its influence on dissolution: A DFT study. Geochim. Cosmochim. Acta 2006, 71, 624–630. [Google Scholar] [CrossRef]
- Koschinsky, A.; Garbe-Schönberg, D.; Sander, S.; Schmidt, K.; Gennerich, H.-H.; Strauss, H. Hydrothermal venting at pressure-temperature conditions above the critical point of seawater, 5°S on the Mid-Atlantic Ridge. Geology 2008, 36, 615–618. [Google Scholar] [CrossRef]
- Savage, K.S.; Stefan, D.; Lehner, S.W. Impurities and heterogeneity in pyrite: Influences on electrical properties and oxidation products. Appl. Geochemistry 2008, 23, 103–120. [Google Scholar] [CrossRef]
- Rona, P.A.; Bogdanov, Y.A.; Gurvich, E.G.; Rimski-Korsakov, N.A.; Sagalevitch, A.M.; Hannington, M.D.; Thompson, G. Relict hydrothermal zones in the TAG Hydrothermal Field, Mid-Atlantic Ridge 26°N, 45°W. J. Geophys. Res. 1993, 98, 9715. [Google Scholar] [CrossRef]
- Bilenker, L. Abiotic Oxidation Rate of Chalcopyrite in Seawater: Implications for Seafloor Mining; University of California, Riverside: Riverside, CA, USA, 2011. [Google Scholar]
- Feely, R.A.; Lewison, M.; Massoth, G.J.; Robert-Baldo, G.; Lavelle, J.W.; Byrne, R.H.; Von Damm, K.L.; Curl, H.C. Composition and dissolution of black smoker particulates from active vents on the Juan de Fuca Ridge. J. Geophys. Res. 1987, 92, 11347–11363. [Google Scholar] [CrossRef]
- Morse, J.W. Oxidation kinetics of sedimentary pyrite in seawater. Geochim. Cosmochim. Acta 1991, 55, 3665–3667. [Google Scholar] [CrossRef]
- Romano, G.Y. Kinetics of Pyrrhotite Oxidation in Seawater: Implications for Mining Seafloor Hotsprings; University of California, Riverside: Riverside, CA, USA, 2012. [Google Scholar]
- Embile, R.F.; Walder, I. Galena Non-oxidative Dissolution Kinetics in Seawater. Aquat. Geochem. 2018, 24, 107–119. [Google Scholar] [CrossRef]
- Abraitis, P.; Pattrick, R.A.D.; Kelsall, G.H.; Vaughan, D.J. Acid leaching and dissolution of major sulphide ore minerals: Processes and galvanic effects in complex systems. Mineral. Mag. 2004, 68, 343–351. [Google Scholar] [CrossRef]
- Heidel, C.; Tichomirowa, M.; Junghans, M. Oxygen and sulfur isotope investigations of the oxidation of sulfide mixtures containing pyrite, galena, and sphalerite. Chem. Geol. 2013, 342, 29–43. [Google Scholar] [CrossRef]
- Kwong, Y.T.J.; Swerhone, G.W.; Lawrence, J.R. Galvanic sulphide oxidation as a metal-leaching mechanism and its environmental implications. Geochem. Explor. Environ. Anal. 2003, 3, 337–343. [Google Scholar] [CrossRef] [PubMed]
- Li, Z.; Heping, L.; Liping, X. Galvanic interaction between galena and pyrite in an open system. Chin. J. Geochem. 2006, 25, 230–237. [Google Scholar] [CrossRef]
- Liu, Q.; Li, H.; Zhou, L. Galvanic interactions between metal sulfide minerals in a flowing system: Implications for mines environmental restoration. Appl. Geochem. 2008, 23, 2316–2323. [Google Scholar] [CrossRef]
- Fullston, D.; Fornasiero, D.; Ralston, J. Zeta potential study of the oxidation of copper sulfide minerals. Colloid. Surf. A Physicochem. Eng. Asp. 1999, 146, 113–121. [Google Scholar] [CrossRef]
- Peter, J.M.; Scott, S.D. Mineralogy, composition and fluid-inclusion microthermometry of seafloor hydrothermal deposits in the Southern Trough of the Guaymas Basin, Gulf of California. Can. Mineral. 1988, 26, 567–587. [Google Scholar]
- Zierenberg, R.A.; Fouquet, Y.; Miller, D.J.; Bahr, J.M.; Baker, P.A.; Bjerkgard, T.; Brunner, C.A.; Duckworth, R.C.; Gable, R.; Gieskes, J.; et al. The deep structure of a sea-floor hydrothermal deposit. Nature 1998, 392, 485–488. [Google Scholar] [CrossRef]
- Berndt, C.; Hensen, C.; Mortera-Gutierrez, C.; Sarkar, S.; Geilert, S.; Schmidt, M.; Liebetrau, V.; Kipfer, R.; Scholz, F.; Doll, M.; et al. Rifting under steam—How rift magmatism triggers methane venting from sedimentary basins. Geology 2016, 44, 767–770. [Google Scholar] [CrossRef] [Green Version]
- Paduan, J.B.; Zierenberg, R.A.; Clague, D.A.; Spelz, R.M.; Caress, D.W.; Troni, G.; Thomas, H.; Glessner, J.; Lilley, M.D.; Lorenson, T.; et al. Discovery of Hydrothermal Vent Fields on Alarcón Rise and in Southern Pescadero Basin, Gulf of California. Geochem. Geophys. Geosyst. 2018, 19, 4788–4819. [Google Scholar] [CrossRef]
- Humphris, S.E.; Herzig, P.M.; Miller, D.J. TAG-1 Area. Ocean Drilling Program: Leg 158 Preliminary Report; Texas A&M University: College Station, TX, USA, 1996; pp. 65–140. [Google Scholar]
- Moss, R.; Scott, S.D. Geochemistry and mineralogy of gold-rich hydrothermal precipitates from the Eastern Manus Basin, Papua New Guinea. Can. Mineral. 2001, 39, 957–978. [Google Scholar] [CrossRef]
- Petersen, S.; Herzig, P.M.; Kuhn, T.; Franz, L.; Hannington, M.D.; Monecke, T.; Gemmell, J.B. Shallow Drilling of Seafloor Hydrothermal Systems Using the BGS Rockdrill: Conical Seamount (New Ireland Fore-Arc) and PACMANUS (Eastern Manus Basin), Papua New Guinea. Mar. Geores. Geotechnol. 2005, 23, 175–193. [Google Scholar] [CrossRef]


| Hydrothermal Field | Location | Depth (m) | Tectonic Setting | Spreading Rate (mm/yr) | Host Rock | Characteristics | Max Recorded T of Fluids (°C) | No. Samples |
|---|---|---|---|---|---|---|---|---|
| Trans-Atlantic Geotraverse (TAG) | Mid-Atlantic Ridge (26°08’N, 44°49’W) | 3650 | Mature, sediment starved spreading ridge | Slow (23) | Basalt | 5 × 5 km hydrothermal field Mature active mound (200 m diameter) with Cu-rich deep core and Zn-rich outer margins Black Smoker Complex includes cluster of cp-anh rich active chimneys | 363 | 11 |
| Turtle Pits | Mid-Atlantic Ridge (4°48’S) | 2990 | Mature, sediment starved spreading ridge | Slow (31) | Basalt | Very active volcanism Two major sulfide talus mounds with active and inactive chimneys superimposed | 407 | 2 |
| Logatchev-1 | Mid-Atlantic Ridge (14°45’N, 44°58’W) | 3000 | Mature, sediment starved spreading ridge | Slow (24) | Ultra-mafic complex of peridotite, gabbronorite, minor basalt | “Smoking crater” vent morphologies Unusually rich in Cu and Au Zn rich restricted to northern field (not sampled here) | 370 [87] | 2 |
| ASHES | Axial Volcano, Juan de Fuca Ridge (45°56’N, 130°00’E) | 1530 | Spreading ridge and hot spot (Cobb-Eikelberg) | Intermediate (51) | Basalt | Located within the caldera 200 × 1200 m hydrothermal field | 348 [87] | 1 |
| 16°43’S | East Pacific Rise (South) (16°43’S, 113°04W) | 2745 | Young spreading ridge | Ultrafast (141) | Basalt | Clusters of active chimneys and inactive massive sulfides and hydrothermal mounds | N/A High T (>300) based on microscopic observations | 1 |
| Pacmanus | Manus Basin, Pual Ridge, Papua New Guinea (03°43’S, 151°40’W) | 1650–1800 | Arc/Back-arc basin (rifted arc) | Ultrafast (140) | Dacite/Rhyolite | >20,000 m2 hydrothermal area Distinct areas of venting: SW–S (Satanic Mills—SM, Solwara-8—S-8) and NE (Roman Ruins—RR) cluster SM S-8 RR: Largest field in the area with mounds, chimneys (mostly inactive, some active up to 7 m) and lower T diffuse chimneys. Two mineral assemblages: py-sp and cp-sp with minor barite SM: Central cluster of branched thin chimney structures (up to 10 m high, 20 cm diameter). Cp-rich mineralogy, minor sp. Vent fluids display enrichments of CO2, SO4, H2S and F, with associated presence of magmatophile trace elements all linked to presence of an exsolved magmatic fluid component S-8: Clusters of chimneys up to 12 m both Cu and Zn rich | SM: 345 S-8: 305 RR: 341 | 4 |
| Palinuro | Palinuro Volcanic Complex, Marsili Basin, Tyrrhenian Sea, Italy | 600–630 | Arc/Back-arc basin (active volcanic arc) | Basalt/Andesite | Due to close proximity to an eroding landmass, the deposit is buried beneath tens of centimeters to metres of sediment with no classic chimney structures observed. Formed by sub-seafloor replacement, infiltration and microbial processes. Consists of metal-enriched upper vuggy-barite-sulfide zone and barren lower zone. Samples enriched with precious metals (Au, Ag) and anomalously high epithermal elements (As, Hg, Bi and Sb) linked to the presence of an exsolved magmatic fluid component with high volatiles (CO2 and SO2) | 58 (in diffuse fluids of waning stage) | 2 |
| Mn | Fe | Co | Ni | Cu | Zn | Pb | As | Ag | Cd | Sn | Sb | Bi | |
|---|---|---|---|---|---|---|---|---|---|---|---|---|---|
| Precision (RSD) | 2.3 | 2.8 | 3.4 | 13.9 | 4.8 | 7.2 | 9.0 | 5.6 | 4.6 | 8.1 | 4.3 | 4.8 | 4.7 |
| N | 279 | 277 | 278 | 274 | 271 | 271 | 272 | 143 | 157 | 157 | 157 | 156 | 157 |
| Mineral | Average Detection Limits (ppm) | |||||||||
|---|---|---|---|---|---|---|---|---|---|---|
| As | Cd | Co | Cu | Fe | Mn | Ni | Pb | Sb | Zn | |
| Pyrite (N = 63) | ||||||||||
| 0.24 | 0.19 | 0.05 | 0.29 | 5.44 | 0.05 | 2.43 | 0.02 | 0.03 | 0.28 | |
| Marcasite (N = 36) | ||||||||||
| 0.39 | 0.26 | 0.08 | 0.33 | 7.41 | 0.08 | 3.60 | 0.02 | 0.04 | 0.49 | |
| Pyrrhotite (N = 4) | ||||||||||
| 394 | 1.34 | 0.23 | 77.6 | 38.6 | 0.45 | 9.63 | 0.11 | 0.24 | 194 | |
| Chalcopyrite (N = 53) | ||||||||||
| 0.78 | 0.49 | 0.11 | 1.99 | 13.6 | 0.10 | 3.34 | 0.11 | 0.06 | 0.68 | |
| Isocubanite (N = 5) | ||||||||||
| 2.13 | 0.21 | 0.08 | 0.90 | 11.9 | 0.23 | 3.85 | 0.03 | 0.05 | 1.05 | |
| Bornite (N = 14) | ||||||||||
| 1.02 | 0.28 | 0.09 | 1.19 | 12.9 | 0.15 | 3.25 | 0.02 | 0.12 | 0.75 | |
| Covellite (N = 17) | ||||||||||
| 0.38 | 0.18 | 0.06 | 0.66 | 7.55 | 0.08 | 2.00 | 0.02 | 0.04 | 0.45 | |
| Sphalerite (N = 58) | ||||||||||
| 0.35 | 0.27 | 0.06 | 0.97 | 8.62 | 0.09 | 7.35 | 0.06 | 0.05 | 0.72 | |
| Galena (N = 7) | ||||||||||
| 0.36 | 0.17 | 0.05 | 0.47 | 5.04 | 0.07 | 0.90 | 0.14 | 0.04 | 0.64 | |
| Hydrothermal Field, Location | Sample | Type | Cruise | Ref | Brief Description | Assemblage | Mineral Abundances (%) | |||||||||||||
|---|---|---|---|---|---|---|---|---|---|---|---|---|---|---|---|---|---|---|---|---|
| Py | Mc | Pyr | Cp | Iss | Sp | Cc-Cv | Bn | Td | Gn | Ba | Atc | Anh | Others | |||||||
| TAG-4, MAR | TAG-H 158/957/M/2/R/1/W/12-14cm | RD | IODP Leg 158 (1994) | [99] | Active mound: Massive sulfide crust | Intermediate to low | 38 | 44 | 1 | 1.0 | 15 | |||||||||
| TAG-4, MAR | TAG-I 158/957/K/1/X/1/W/3-4cm | RD | IODP Leg 158 (1994) | [99] | Active mound: Upper mound—porous colloform py, mc | Intermediate to low | 51 | 38 | 1 | 1 | 10 | |||||||||
| TAG-4, MAR | TAG-J 158/957/K/2/N/1/W/10-12cm | RD | IODP Leg 158 (1994) | [99] | Active mound: Massive sulfide crust | Intermediate to low | 84 | 6 | 5 | 1 | 1 | 1 | 3 | |||||||
| TAG-5, MAR | TAG-K 158/957/P/1/R/1/W/79cm | RD | IODP Leg 158 (1994) | [99] | Active mound: Semi massive pyrite-anhydrite | Intermediate to high | 11 | 4 | 86 * | |||||||||||
| TAG-5, MAR | TAG-L * 158/957/P/1/R/1/W/50-52 cm | RD | IODP Leg 158 (1994) | [99] | Active mound: Semi massive pyrite-anhydrite breccias with cp | Intermediate to high | 30 | 5 | 65 | |||||||||||
| TAG-1, MAR | TAG-M * 158/957/E/1/R/1/W/1-3 cm | RD | IODP Leg 158 (1994) | [99] | Active mound: Semi massive pyrite-anhydrite breccias with cp | Intermediate to high | 45 | 10 | 45 | |||||||||||
| TAG-4, MAR | TAG-46 158/957/K/2/N/1/9 | RD | IODP Leg 158 (1994) | [99] | Active mound: Massive sulfide crust | Intermediate to low | 56 | 37 | 5 | 3 | ||||||||||
| TAG-4, MAR | TAG-47 158/957/K/3/X/1/6 | RD | IODP Leg 158 (1994) | [99] | Active mound: Massive sulfide crust | Intermediate to low | 62 | 33 | 1 | 4 | ||||||||||
| TAG-4, MAR | TAG-48 158/957/K/3/X/1/7 | RD | IODP Leg 158 (1994) | [99] | Active mound: Massive sulfide crust with porous colloform py, mc | Intermediate to low | 48 | 38 | 3 | 11 | ||||||||||
| TAG-1, MAR | TAG-6F 158/957/C/7/N/1/6F | RD | IODP Leg 158 (1994) | [99] | Active mound: Massive pyrite breccias with abundant cp | Intermediate to high | 65 | 10 | 15 | 10 | ||||||||||
| TAG-1, MAR | TAG-27 158/957/C/7/N/1/6G | RD | IODP Leg 158 (1994) | [99] | Active mound: Massive pyrite breccias with abundant cp | Intermediate to high | 41 | 24 | 13 | 7 | 16 | |||||||||
| Turtle Pits Mound, MAR | TP2L 124-GTV-2L | GTV | Meteor M64/1 (2005) | [100] | Outer part of massive inactive chimney | Low to intermediate | 73 | 13 | 6 | 3 | 1 * | 3 | ||||||||
| Southern Tower, Turtle Pits, MAR | TP4B 114-ROV-4B | ROV | Meteor M64/1 (2005) | [100] | Cu-rich, interior of active chimney | High | 51 | 24 | 2 | 6 | 12 | 4 | 2 | |||||||
| Candelaber, Logatchev, MAR | LOG11 64-ROV-11 | ROV | Meteor M60/3 (2004) | [101] | Cu-rich inactive chimney | High (some areas of oxidation) | 81 | 11 | 3 | 3 | ||||||||||
| Irina-1, Logatchev, MAR | LOG13 53-ROV-13 | ROV | Meteor M60/3 (2004) | [101] | Multilayered active Cu rich chimney (talus) | High | 82 | 1 | 10 | 8 | ||||||||||
| ASHES vent field, JDFR | AS1 SO109-89-GTV/4 | GTV | Sonne SO109 (1996) | [102] | Inactive Cu-rich chimney | High | 19 | 7 | 44 | 29 | 1 | 1 | ||||||||
| 16°43’S hydrothermal field, EPR | SEPR SO62-310GTV | GTV | Sonne SO62 (1991) | [103] | Inactive chimney | Intermediate to high | 32 | 6 | 41 | 10 | 4 | 7 | ||||||||
| Roman Ruins, Pacmanus field, Manus Basin, PNG | PM2D 70-GTV-2D | GTV | Sonne SO166 (2002) | [104] | Inactive chimney, porous massive sphalerite cementing dacite-sulfide breccia | Low | 12 | 4 | 1 | 13 | 4 | 25 | 41 | |||||||
| Satanic Mills, Pacmanus field, Manus Basin, PG | PM5E 58-GTV-5E | GTV | Sonne SO166 (2002) | [104] | Active black smoker, in dacite matrix | High | 5 | tr † | 35 | 22 | 5 ‡ | 1 | 27 | 5 | ||||||
| Satanic Mills, Pacmanus field, Manus Basin, PNG | PM6B 58-GTV-6B | GTV | Sonne SO166 (2002) | [104] | Active black smoker, porous sphalerite plus chalcopyrite | Intermediate | 10 | tr † | 3 | 40 | 4 ‡ | 2 | 41 | 1 | ||||||
| Solwara 8, Pacmanus field, Manus Basin, PNG | PM2F 33-GTV-02F | GTV | Sonne SO216 (2011) | [105] | Talus, Secondary Cu-sulfides | High (some areas of oxidation) | 28 | 6 | 3 | 12 | 4 | tr † | 32 | 15 | 1 | |||||
| Palinuro Volcanic Complex, Aeolian Island Arc, Italy | 851-RD * 851-RD-011-015 | RD | M73/2 (2007) | [106] | Subseafloor SMS Vuggy-barite zone (Low T assemblage) | Intermediate to low | 10 | 30 | 5 § | 25 | 45 | 5 | ||||||||
| Palinuro Volcanic Complex, Aeolian Island Arc, Italy | 932-RD * 932-RD-066-070 | RD | M73/2 (2007) | [106] | Subseafloor SMS Vuggy-barite zone (High T assemblage) | Intermediate to low | 25 | 5 | 5 | 10 | 45 | 10 | ||||||||
| Mineral | Texture | As-Sb | As-Pb | Pb-Sb | Sb-Ag | Pb-Ag | Cd-Pb | Cd-Mn | Co-Ni | Fe-Mn | Cd-Fe | Sb-Hg | |
|---|---|---|---|---|---|---|---|---|---|---|---|---|---|
| TAG | mc | III | 0.3910 | 0.5970 | - | 0.5879 | 0.5078 | - | - | - | - | - | n.d. |
| mc | I | 0.8947 | - | - | - | - | - | - | - | −0.8609 | - | n.d. | |
| py | III | - | - | 0.6814 | 0.7214 | 0.7733 | - | - | - | - | - | n.d. | |
| py | II | 0.8340 | 0.7025 | 0.6486 | 0.8850 | - | - | - | - | - | 0.6667 | n.d. | |
| py | I | 0.9229 | 0.5772 | 0.6365 | - | - | - | - | - | - | - | n.d. | |
| cp | III | - | - | 0.5724 | 0.6688 | 0.7296 | - | 0.6748 | - | −0.5522 | - | n.d. | |
| cp | II | - | - | 0.6588 | - | - | 0.3766 | - | - | 0.4722 | - | n.d. | |
| sp | III | - | - | −0.9980 | - | - | - | - | - | - | - | n.d. | |
| sp | II | - | 0.8021 | - | −0.7756 | - | - | - | - | 0.7768 | - | n.d. | |
| LOG | cp | III | 0.3841 | 0.3999 | 0.4609 | - | - | - | - | 0.8784 | - | - | n.d. |
| is | III | 0.7775 | 0.5228 | 0.5357 | - | 0.6280 | - | 0.4834 | - | - | - | n.d. | |
| cv | III | 0.4727 | - | 0.9537 | - | −0.4673 | 0.5046 | - | 0.9927 | 0.9030 | - | n.d. | |
| sp | III | - | - | 0.9933 | - | - | 0.9817 | 0.9687 | - | 0.9639 | 0.9736 | n.d. | |
| bn | III | - | - | 0.8962 | - | - | 0.8747 | - | - | - | - | n.d. | |
| TP | cp | III | - | - | 0.9529 | - | - | 0.8056 | 0.8830 | - | - | - | n.d. |
| cp | I | - | 0.7265 | - | - | - | - | - | - | 0.5826 | - | n.d. | |
| py | I | - | −0.8105 | - | - | - | - | - | - | - | - | n.d. | |
| py | II | 0.8512 | 0.7216 | 0.6849 | - | - | - | - | - | - | - | n.d. | |
| py | III | 0.9082 | - | 0.7846 | 0.9665 | 0.7546 | - | - | 0.5881 | - | - | n.d. | |
| mc | I | 0.6872 | - | - | - | - | - | - | - | −0.8707 | - | n.d. | |
| mc | II | 0.7659 | 0.9732 | 0.8402 | - | - | - | - | - | −0.7547 | - | n.d. | |
| is | III | - | - | - | - | - | - | - | - | - | - | n.d. | |
| pyr | III | - | - | - | - | - | - | - | - | - | - | n.d. | |
| sp | I | - | - | - | - | - | - | - | - | 0.6190 | - | n.d. | |
| PM | gn | III | −0.8121 | 0.9629 | −0.8394 | 0.7539 | −0.7365 | 0.7186 | 0.5471 | - | - | - | n.d. |
| tt | III | - | - | - | 0.6048 | 0.8267 | 0.8928 | - | - | - | −0.8718 | n.d. | |
| bn | III | 0.9328 | 0.8261 | 0.6841 | 0.7776 | 0.8736 | 0.9702 | 0.8788 | - | - | - | n.d. | |
| cv | III | - | - | - | - | - | - | - | - | - | - | n.d. | |
| mc | III | - | - | - | - | - | - | - | - | - | - | n.d. | |
| mc | I | - | - | - | - | - | - | - | - | - | - | n.d. | |
| py | III | - | −0.9489 | 0.7237 | 0.8683 | 0.8958 | - | - | - | - | - | n.d. | |
| py | I | - | - | - | −0.9594 | - | - | - | - | - | - | n.d. | |
| sp | I | - | 0.9056 | 0.4871 | 0.8836 | 0.4133 | - | - | - | 0.7466 | - | n.d. | |
| sp | III | −0.6794 | - | - | 0.9321 | - | 0.6272 | - | - | 0.9692 | - | n.d. | |
| cp | I | 0.8763 | 0.6385 | 0.8045 | 0.7283 | 0.6610 | - | - | - | - | - | n.d. | |
| cp | III | - | - | - | - | - | - | - | - | - | - | n.d. | |
| AS | cp | III | - | 0.8681 | - | - | - | - | - | - | - | −0.7135 | n.d. |
| mc | III | - | - | - | - | - | - | - | - | - | - | n.d. | |
| py | III | - | - | - | - | - | - | - | - | - | - | n.d. | |
| py | I | - | −0.9071 | 0.9789 | - | - | - | - | - | - | - | n.d. | |
| sp | III | 0.9931 | 0.9731 | 0.9550 | 0.8374 | - | - | - | - | - | - | n.d. | |
| SEPR | cv | III | - | - | - | - | - | - | - | - | - | - | n.d. |
| cp | III | - | 0.9699 | - | 0.9681 | - | - | - | - | - | - | n.d. | |
| py | III | - | - | - | 0.9802 | - | - | - | - | - | - | n.d. | |
| sp | III | - | - | - | - | - | - | 0.9549 | - | - | 0.9653 | n.d. | |
| sp | I | - | −0.9817 | - | - | 0.9957 | - | 0.9555 | - | 0.9750 | - | n.d. | |
| PV | gn | I | −0.5416 | 0.5472 | −0.9764 | - | 0.4812 | - | - | −0.5954 | - | - | 0.4438 * p = 0.0851 |
| PV | py | I | - | - | - | - | - | - | - | −0.7288 | - | - | n.d. |
| PV | tt | I | −0.9958 | - | - | - | - | - | −0.8467 | 0.8309 | 0.7781 | −0.7794 | 0.6772 * p = 0.0650 |
| PV | cp | I | - | 0.7924 | - | - | - | - | - | - | - | - | n.d. |
| PV | sp | I | - | - | 0.9774 | - | - | - | - | - | - | - | n.d. |
© 2019 by the authors. Licensee MDPI, Basel, Switzerland. This article is an open access article distributed under the terms and conditions of the Creative Commons Attribution (CC BY) license (http://creativecommons.org/licenses/by/4.0/).
Share and Cite
Fallon, E.K.; Frische, M.; Petersen, S.; Brooker, R.A.; Scott, T.B. Geological, Mineralogical and Textural Impacts on the Distribution of Environmentally Toxic Trace Elements in Seafloor Massive Sulfide Occurrences. Minerals 2019, 9, 162. https://doi.org/10.3390/min9030162
Fallon EK, Frische M, Petersen S, Brooker RA, Scott TB. Geological, Mineralogical and Textural Impacts on the Distribution of Environmentally Toxic Trace Elements in Seafloor Massive Sulfide Occurrences. Minerals. 2019; 9(3):162. https://doi.org/10.3390/min9030162
Chicago/Turabian StyleFallon, Emily K., Matthias Frische, Sven Petersen, Richard A. Brooker, and Thomas B. Scott. 2019. "Geological, Mineralogical and Textural Impacts on the Distribution of Environmentally Toxic Trace Elements in Seafloor Massive Sulfide Occurrences" Minerals 9, no. 3: 162. https://doi.org/10.3390/min9030162