Article

Metabolic Regulation of Copper Toxicity during Marine Mussel Embryogenesis

1
Aquaculture Biotechnology Research Group, Department of Environmental Science, School of Science, Auckland University of Technology, Auckland 1010, New Zealand
2
Centre for Biomedical and Chemical Sciences, School of Science, Auckland University of Technology, Auckland 1010, New Zealand
3
School of Biological Sciences, University of Auckland, Private Bag 92019, Auckland 1010, New Zealand
4
Cawthron Institute, Nelson 7010, New Zealand
5
Department of Chemistry, University of Otago, P.O. Box 56, Dunedin 9010, New Zealand
6
Marine Mineral Resources Group, Research Division 4: Dynamics of the Ocean Floor, Magmatic and Hydrothermal Systems, GEOMAR Helmholtz Centre for Ocean Research Kiel, Wischhofstr. 1-3, 24148 Kiel, Germany
7
Department of Botany, University of Otago, 464 Great King St, Dunedin 9016, New Zealand
8
Faculty of Fisheries, Vietnam National University of Agriculture, Hanoi 000084, Vietnam
*
Author to whom correspondence should be addressed.
Metabolites 2023, 13(7), 838; https://doi.org/10.3390/metabo13070838
Submission received: 12 May 2023 / Revised: 19 June 2023 / Accepted: 4 July 2023 / Published: 11 July 2023

Abstract

:
The development of new tools for assessing the health of cultured shellfish larvae is crucial for aquaculture industries to develop and refine hatchery methodologies. We established a large-volume ecotoxicology/health stressor trial, exposing mussel (Perna canaliculus) embryos to copper in the presence of ethylenediaminetetraacetic acid (EDTA). GC/MS-based metabolomics was applied to identify potential biomarkers for monitoring embryonic/larval health and to characterise mechanisms of metal toxicity. Cellular viability, developmental abnormalities, larval behaviour, mortality, and a targeted analysis of proteins involved in the regulation of reactive oxygen species were simultaneously evaluated to provide a complementary framework for interpretative purposes and authenticate the metabolomics data. Trace metal analysis and speciation modelling verified EDTA as an effective copper chelator. Toxicity thresholds for P. canaliculus were low, with 10% developmental abnormalities in D-stage larvae being recorded upon exposure to 1.10 μg·L−1 bioavailable copper for 66 h. Sublethal levels of bioavailable copper (0.04 and 1.10 μg·L−1) caused coordinated fluctuations in metabolite profiles, which were dependent on development stage, treatment level, and exposure duration. Larvae appeared to successfully employ various mechanisms involving the biosynthesis of antioxidants and a restructuring of energy-related metabolism to alleviate the toxic effects of copper on cells and developing tissues. These results suggest that regulation of trace metal-induced toxicity is tightly linked with metabolism during the early ontogenic development of marine mussels. Lethal-level bioavailable copper (50.3 μg·L−1) caused severe metabolic dysregulation after 3 h of exposure, which worsened with time, substantially delayed embryonic development, induced critical oxidative damage, initiated the apoptotic pathway, and resulted in cell/organism death shortly after 18 h of exposure. Metabolite profiling is a useful approach to (1) assess the health status of marine invertebrate embryos and larvae, (2) detect early warning biomarkers for trace metal contamination, and (3) identify novel regulatory mechanisms of copper-induced toxicity.

Graphical Abstract

1. Introduction

Copper is an essential trace element involved in many biological processes and is required for the survival of all living organisms [1]. Cells use copper as a structural element in regulatory proteins, and due to its unique redox potential, copper serves as a cofactor for several enzymes that carry out fundamental functions during embryonic development, mitochondrial respiration, iron metabolism, antioxidant defence, and the synthesis of neurotransmitters and neuropeptides [2,3,4,5,6,7]. However, when intracellular concentrations exceed the capacity of cells to sequester the ion, free copper is extremely cytotoxic. Redox cycling between Cu2+ and Cu+ can catalyse the production of reactive oxygen species (ROS) [8]. Although ROS themselves are essential for many biological processes at low levels (including embryonic development [9]), they cause oxidative stress and damage when generated in excess via the oxidative attack of lipids, proteins, DNA, and other cellular components [10]. Thus, to ensure that metal availability is in accordance with physiological needs, it is crucial that all organisms have mechanisms in place to detect and regulate intracellular copper levels through a controlled balance of uptake, efflux, and sequestration [11,12,13].
Bivalve molluscs have high capacities to bioaccumulate dissolved and particulate-bound metals from seawater. For this reason, bivalves are routinely used as sentinels for trace metal contamination biomonitoring purposes around the world (e.g., the long-running US National Oceanic and Atmospheric Administration’s ‘Mussel Watch’ Program) [14,15]. Some species are, however, particularly sensitive to copper and are disappearing from coastal regions with high loadings of the metal [16,17]. Dissolved copper levels in oceanic and coastal waters typically range from 0.05–1.7 µg·L−1, but due to anthropogenic inputs, they have been detected at levels up to 20 µg·L−1 in New Zealand and as high as 40 µg·L−1 in Australia [18,19,20]. These values far exceed the Australian and New Zealand Environment and Conservation Council 95% protection trigger value of 1.3 µg·L−1, and the EC50 embryotoxicity values reported for numerous marine invertebrate species (e.g., mussels, oysters, and sea urchins) [21,22,23,24,25,26,27].
Contributing sources of copper in New Zealand waters include stormwater drainage, leachates from antifouling paints, and run-off from hard-stand activities (e.g., boat-washing, scraping, and repainting) [19]. For the Auckland region alone, it is estimated that up to 22,000 kg of copper are leached from boat hulls every year, with about half of this quantity coming from boats berthed in marinas [28,29]. Copper contamination of New Zealand’s marine environment has the potential to adversely affect wild populations of marine molluscs (as has already been the case for tin [30]) and could pose a threat to the developing aquaculture industry.
Shellfish farming provides a lucrative source of revenue for New Zealand, and the sector is currently being targeted for expansion [31]. GreenshellTM mussel (Perna canaliculus) aquaculture has particularly received considerable investment for growth through shared government–industry funding [32]. Researchers aim to develop technologies to cultivate mussel embryos and larvae at commercial scale to provide farms with high-quality hatchery-reared juveniles for grow-out. This would substantially reduce reliance on wild-sourced stock and provide an excellent avenue to advance the country’s selective breeding programme for improved trait enhancements. P. canaliculus is one of New Zealand’s most sensitive endemic bivalves to heavy metal contamination [33], and a number of knowledge gaps exist regarding the toxicity thresholds of certain metals, such as copper, and their toxicological mechanisms in different life history stages (i.e., embryos, larvae, spats, and adults).
Mass larval mortalities in shellfish hatcheries occur at times due to undetermined causes. Potential trace element contamination of bulk seawater used by hatcheries is a general concern for industry, but comprehensive monitoring and source tracking can be very difficult and expensive to implement. The toxicity of metals in seawater is complicated due to speciation and the formation of complexes that alter bioavailable forms. Metal bioavailability is challenging to measure and is strongly impacted by pH, salinity, and the contents of carbonate and organic matter [34]. Such parameters can also be highly dynamic in coastal waters. A common method used by hatcheries worldwide to alleviate concerns of potential trace metal contamination in source seawater is through the use of metal chelators, such as ethylenediaminetetraacetic acid (EDTA). Adding EDTA during embryonic incubation (when shellfish are at their most vulnerable development stage) alters the bioaccumulation of trace metals into larval tissues, ameliorates oxidative stress, and substantially improves the yield/survival of early D-stage larvae [35,36,37]. However, the impact of EDTA additions on hatchery seawater chemistry and metal bioavailability through speciation and complexation is currently unascertained. A better understanding of how embryos and larvae cope with trace metal contamination in the presence of EDTA is also needed, with a focus on biochemical regulatory mechanisms using fine-grained health assessment endpoints to investigate sublethal effects on metabolism and physiology.
In this study, we use passive sampling and a metal speciation modelling approach to measure copper bioavailability in typical EDTA-treated hatchery seawater, with and without excess copper. We also gain industry-relevant information on the toxicity thresholds of copper in early-developing mussels by exposing newly fertilised embryos to copper treatments under simulated hatchery conditions. We further investigate mechanistic aspects of copper toxicity through comprehensive profiling of embryonic/larval metabolites (metabolomics), targeted analyses of enzymes involved in ROS regulation, and evaluation of biomarkers for oxidative damage to lipids, proteins, and DNA.

2. Materials and Methods

2.1. Experimental Design Summary

Fertilised mussel embryos were exposed to various concentrations of copper in the presence of EDTA during a large-volume hatchery trial at the Cawthron Institute Aquaculture Park (CAP), Nelson, New Zealand. Approximately 150 million embryos were evenly distributed among 15 × 170 L conical plastic tanks containing natural seawater and 4 µM EDTA. The addition of EDTA to the embryonic incubation seawater is current standard commercial practice for the first 48 h of development and is important for the successful development of P. canaliculus embryos [36]. Volumes of a copper sulphate stock solution were added to the relevant tanks to provide four nominal levels of total copper (0, 100, 200, 300 µg·L−1), with three tank replicates per treatment level. Samples of embryos/larvae were taken recurrently from each tank over a period of 72 h for assessments of cell viability and mortality, development rate, structural abnormalities, swimming behaviour, and metabolite profiling. A comprehensive compositional analysis of the source seawater used in the experiment was conducted through a variety of standard analytical methods. Due to the complexities of incorporating EDTA into the experimental design, analysis of copper speciation during the trial was essential and thus determined via diffusive gradients in thin films (DGTs), passive samplers, inductively coupled plasma mass spectrometry, and a metal speciation modelling approach.

2.2. Chemicals and Seawater Preparation

Unless otherwise stated, all reagents were obtained from Sigma-Aldrich Pty Ltd. (Sydney, Australia). Stock solutions of CuSO4 (1000 mg·L−1 dissolved in Milli-QTM H2O; Quantum R Tex cartridge with Biopack polisher) and EDTA disodium salt (5 mM molecular grade [Scharlau: Chemie, Spain] dissolved in Milli-Q H2O, and buffered to pH 8.0 with 5 M NaOH) were prepared using acid washed glassware and stored at 4 °C three days prior to use. Embryo incubation tanks were filled with 154.8 L of 16 °C seawater 24 h before the start of the experiment. This seawater had been pumped from the Tasman Bay (Nelson) and filtered to 40 μm (Arkal Filtration Systems CS Ltd.: Jordan, Israel); stored in 25,000 L tanks; pumped sequentially through three in-line filters: 25 μm, 5 μm, and 1 μm; foam fractionated (PPS4 Foam Fractionator–Aquasonic: NSW, Australia); temperature mixed (achieved by drawing from a 10,000 L storage tank maintained at the target temperature via an external loop passing through a titanium plate heat exchanger); and end-of-line 1 µm cartridge filtered (model E1PP10-FG–Filterpure: Auckland, New Zealand).
Once all tanks were filled with seawater, 132 mL of stock EDTA solution was added to each tank (based on prior optimisation trials at CAP; unpublished data) to provide final EDTA concentrations of 4 µM, and gentle aeration was provided (500–1000 mL min−1). At the same time, 15 × 15 L fertilisation tanks were filled with 10.2 L of similarly treated seawater, and 12 mL of stock EDTA was added to each tank. The bulk seawater and EDTA in all tanks were given 24 h to mix and become thermally stable at room temperature (17 °C). Two hours prior to adding the fertilised mussel embryos, aliquots of the CuSO4 stock solution were administered to the relevant embryo incubation tanks in order to give the systems time to equilibrate/stabilise (i.e., mixtures of dissolved organic matter, inorganic compounds, EDTA-metal complexes, and various other Cu species).

2.3. Broodstock Collection and Spawning

Mussel (P. canaliculus) broodstock (~300 individuals) were collected 24 h prior to spawning from suspended rope culture in Admiralty Bay (Marlborough Sounds, Nelson, New Zealand) and transported to CAP. Mussels were biosecurity treated according to CAP protocols (i.e., gently scrubbed clean, induced to close with a freshwater dip, and then treated with 0.4% [v/v] sodium hypochlorite in freshwater for 2–5 min), briefly rehydrated, and then maintained dry overnight under a damp cloth (~16 °C) ready for spawning the next day. Spawning was induced via thermal cycling, and gametes from 50 female and 50 male mussels were collected, pooled by sex, and enumerated via microscopy. Established protocols for broodstock handling, spawning, and fertilisation were employed as previously described in our other works [36,38,39], and citations therein.

2.4. Fertilisation and Tank Incubation

Approximately 10.2 million oocytes were added to each of the 15 × 15 L fertilisation tanks containing 10.2 L of 24 h aged seawater incorporating 4 µM EDTA. The sperm pool was diluted with FSW and aliquoted into each tank to provide a ratio of 500 sperm per oocyte. After 30 min, successful fertilisations were confirmed by the presence of polar bodies, and the total contents of each fertilisation tank were transferred into one of the incubation tanks (providing a total incubation seawater volume of 165 L). Ambient air temperature, and therefore tank seawater temperature, was maintained at 17 ± 1 °C throughout the trial (routinely validated by spot thermometer checks of the water in the incubation tanks).

2.5. Embryo and Larval Sampling

A range of embryonic and larval samples were taken from each of the incubation tanks at 3, 18, 42, and 72 h post-Cu exposure for various microscopical and biochemical analyses. To first determine embryonic/larval densities, triplicate 2 mL samples were taken from each tank via pipette (whilst homogenising the seawater with a large, perforated plunger), transferred to individual wells of BD FalconTM 24-well Tissue Culture Plates (BD Biosciences: NSW, Australia), and enumerated under a microscope. To assess the cell viability of embryos and larval survival, similar 2 mL samples were taken and characterised using a vital stain (neutral red) in accordance with published protocols [40]. To evaluate temporal developmental parameters, 2 mL samples were taken from each tank (while homogenising tank contents), pooled for each treatment level, gently filtered through a 15 µm mesh sieve, transferred to 1.5 mL Eppendorf tubes, and fixed in Davidson’s solution [41] for subsequent microscopy.
To obtain high biomass samples for metabolomic-based and oxidative stress biomarker analyses (ca. 200,000 pooled individuals per sample), organisms were sampled by opening valves at the bottom of the conical tanks (whilst homogenising) and draining a specific volume (calculated from the embryonic/larval densities) into a 15 µm sieve immersed in seawater. Organisms were gently rinsed in FSW to remove debris/biofloc and treatment solutions, concentrated, transferred to 15 mL FalconTM centrifuge tubes using 3 mL disposable plastic Pasteur pipettes (LabServ–Thermo Fisher: Auckland, New Zealand), and then made up to 14 mL with FSW. Samples were centrifuged at 4× g for 30 s, and 6 mL of seawater was removed before being re-homogenised. Then, 1.5 mL aliquots were transferred to a series of BioStorTM 2 mL RNase/DNase-free cryovials (National Scientific Supply: Claremont, CA, USA). Cryovials were centrifuged at 25× g for 30 s, excess seawater removed, then immediately snap-frozen in liquid nitrogen and stored at −80 °C until metabolite extraction. Towards the end of the experiment (at 66 hpf [not 72 hpf due to logistical constraints]), samples of D-stage larvae (containing ~50 individuals) were directly taken via pipette from each incubation tank to assess swimming behaviour and conduct in situ determinations of development stage and the presence/absence of structural abnormalities (e.g., shell deformation) by optical microscopy (Olympus: Model CK-X31).

2.6. Seawater Chemistry

2.6.1. Bulk Seawater Composition

The composition of bulk seawater prior to EDTA additions was characterised using standard analytical methods, according to APHA (2005), and included the following: total alkalinity (APHA 2520 B), total organic nitrogen (APHA 4500-Norg D), total ammonical nitrogen (APHA 4500-NH3 F), nitrate and nitrite (APHA 4500-NO3 I), dissolved reactive phosphorus (APHA 4500-P G), reactive silica (APHA 4500-SiO2 F: modified from flow injection analysis), chloride (APHA 4500 Cl E: modified from continuous flow analysis), bromide (APHA 4110 B), total organic carbon (APHA 5310 B), and concentrations of up to 32 metals, including total dissolved Cu via ICP-MS (APHA 3125 B). pH was monitored in situ using a calomel glass electrode, and salinity was calculated from the total chloride concentration, where: salinity (ppt) = 1.8066 × 10⁻³ × [Cl] (mg·L−1). Temperature and pH readings (recorded with both bench-top Mettler Toledo and mini handheld ISFET pH meters [Shindengen model KS701]) were also performed during every seawater collection, every embryonic/larval sampling, and also during the deployment and retrieval of Diffusive Gradients in Thin Film (DGT) passive samplers.

2.6.2. Copper Speciation Analysis

The actual total dissolved Cu concentrations in an incubation experiment can vary significantly from the intended nominal total dissolved Cu concentration due to contamination and adsorption/desorption processes [42]. In order to assess actual vs. nominal total dissolved Cu concentrations and to evaluate potential rates of Cu loss/gain through bio-uptake and/or adhesion to the tank material and/or evaporation, 500 mL of seawater was sampled from every incubation tank 2 h after embryos had been added and also at the end of the trial (72 h later). Trace metal-clean plastic containers (Nalgene, LabServe–Thermo Fisher: Auckland, New Zealand) were used during seawater sampling. Samples were obtained by immersing a clean 15 µm sieve into the tanks and collecting the embryo-free seawater inside. These samples were immediately chilled to 4 °C and dispatched for analysis to the Centre for Trace Element Analysis (CTEA) (University of Otago, New Zealand) within 12 h of collection. Total dissolved Cu concentrations were measured by ICP-MS using an Agilent 7500ce system with an ESI PFA100 micro-concentric nebulizer, following the manufacturer’s recommendations for robust conditions. Calibration was performed with commercial multi-element solutions (Claritas CLMS-2) with In and Sc as reference elements.
DGT passive samplers were also installed for the duration of the experiment to estimate the bioavailable Cu fraction. The devices house a binding gel, diffusive gel, and membrane filter, and passively accumulate labile species from solution while deployed in situ. Labile species are assimilated by the binding gel in a predictable, rate-controlled manner. After recovery of the DGT samplers, the gel layers are leached in acid and analysed by ICP-MS, which allows the estimation of labile copper [43]. Duplicate DGTs were randomly deployed into one incubation tank for every treatment level, two hours after embryo additions. DGTs were placed adjacent to the air flow to promote the movement of seawater across the devices, and care was taken not to contaminate the membrane filters. At the end of the experiment, DGTs were carefully recovered, packaged at 4 °C, and dispatched to CTEA for ICP-MS analysis.
The DGT-labile metal concentration was calculated according to [43]. The bioavailable Cu concentration is assumed to be the labile fraction of dissolved Cu. Other Cu speciation was modelled using the Visual MINTEQ (v 3.0) program [44]. While the inorganic-bound Cu speciation is defined by the bulk seawater composition, EDTA and DOC at the concentration levels quantified in the samples were used to estimate the free Cu concentration. A fixed humic acid to fulvic acid ratio of 1:9 was used to estimate the humic-bound Cu [45].

2.7. Metabolite Analysis

2.7.1. Sample Preparation

Metabolites were extracted using a cold methanol-water method [46], with minor modifications for marine invertebrate embryo and larval tissues. The cryovials containing the frozen larvae were placed on dry ice, and 1000 µL of a cold (–20 °C) 1:1 MeOH:H2O solution was added (MeOH [Merck: Darmstadt, Germany]; Milli-Q filtered H2O), followed by 20 µL of internal standard (10 mM L-alanine-2,3,3,3-d4 [Sigma-Aldrich: St. Louis, MO, USA]). Samples were partially thawed and vortexed for 1 min, then placed through a series of three freeze–thaw cycles with vortexing in between. Samples were cold-centrifuged (2–4 °C) at 20,800× g for 10 min. Supernatants were transferred to 15 mL Falcon tubes and cold-stored on dry ice. A second extraction was performed on the leftover pellets by adding 800 µL of cold 4:1 MeOH:H2O, followed by two further freeze–thaw cycles. Samples were centrifuged as previously described, and the paired supernatants were combined from both extractions. The remaining biological materials were re-frozen and stored at −80 °C for subsequent protein analysis. The total volume of the methanol-water extracts was brought up to 6.5 mL with cold Milli-Q water, vortexed briefly to mix, and then frozen at −80 °C. Sample extracts were lyophilised in a 12 L freeze dryer (Labconco Corporation: Kansas city, MO, USA) at −80 °C and 0.03 mbar for 24 h, then derivatised by alkylation.
Methyl chloroformate (MCF) derivatives were prepared to convert amino and non-amino organic acids into volatile carbamates and esters. Lyophilised samples were re-suspended in 400 μL of 1 M sodium hydroxide (Merck: Darmstadt, Germany) and 68 μL of pyridine (Sigma-Aldrich: St. Louis, MO, USA). Mixtures were transferred to KimbleTM silanised borosilicate glass tubes (12 × 75 mm) (ThermoFisher: Auckland, NZ) containing 334 μL of methanol. Then, 20 μL of MCF reagent (Sigma-Aldrich: St. Louis, MO, USA) was added, and samples were vortexed for 30 s. Another 20 μL of MCF was added, followed by vortexing for 30 s. To separate the MCF derivatives from the mixture, 400 μL of chloroform (Merck: Darmstadt, Germany) was added, vortexed for 10 s, followed by the addition of 400 μL of 50 mM sodium bicarbonate (Merck: Darmstadt, Germany) solution and vortexing for a further 10 s. The upper aqueous layer was discarded, and a small amount of anhydrous sodium sulphate (BDH Chemicals: Poole, UK) was added to remove residual H2O. The chloroform phase containing the MCF derivatives was transferred to 2 mL amber CG glass vials fitted with inserts (Sigma-Aldrich: St. Louis, MO, USA). A sample blank containing 20 μL of L-alanine-2,3,3,3-d4 was similarly derivatised for QC purposes, along with a separate standard amino acid mix (100 µL, 20 mM [Merk: Darmstadt, Germany]).

2.7.2. GC-MS Analysis

Immediately after derivatisation, the MCF derivatives were injected into a GC-MS system (GC7890 coupled to a MSD5975 [Agilent Technologies], with a quadrupole mass selective detector [EI] operated at 70 eV). The system was equipped with a ZB-1701 GC capillary column (30 m × 250 μm id × 0.15 μm with a 5 m stationary phase [86% dimethylpolysiloxane, 14% cyanopropylphenyl]) (Phenomenex: Torrance, CA, USA). The instrumental setup parameters were conducted according to [47]. Samples (1 µL) were injected in pulsed splitless mode with the injector temperature at 260 °C. The helium gas flow through the GC-column was set at a constant flow of 1 mL min−1. The GC-oven temperature was initially held at 45 °C for 2 min, and then raised with a gradient of 9 °C min−1 to 180 °C; after 5 min, the temperature was increased to 220 °C at 40 °C min−1. After a further 5 min, the temperature was increased at 40 °C min−1 to 240 °C and held for 11.5 min. Finally, the temperature was increased at 40 °C min−1 until it reached 280 °C where it was held for a further 2 min. The interface temperature was set to 250 °C and the quadrupole temperature was set at 200 °C. The mass spectrometer was operated in scan mode (starting after 6 min; mass range 38–650 a.m.u. at 1.47 scans s−1). A derivatised sample blank containing the internal standard, a derivatised standard amino acid mix, a non-derivatised standard alkane mix, and a sample of pure chloroform solvent were also injected and analysed for QC purposes.

2.7.3. Data Pre-Processing and Metabolite Identification

Deconvolution of raw chromatographic data was performed using the Automated Mass Spectral Deconvolution and Identification System (AMDIS v2.66) software (online software distributed by the National Institute of Standards and Technology, USA—http://www.amdis.net/, accessed on 13 February 2021). Metabolite identifications and peak integrations (relative quantification) were conducted using Chemstation Software (Agilent Technologies) and customised R xcms-based scripts [48] to interrogate an in-house mass spectral library of MCF derivatised commercial standards. Analyses were carried out in ‘R’ platform version 2.15.0 (http://www.r-project.org/, accessed on 5 May 2021). Compound identifications were based on matches to both the MS spectrum of the derivatised metabolite and its respective chromatographic retention time. The values are generated from the maximum height of the reference ion for the compound peak. The reference ion used as a measure of abundance for each compound is usually the most abundant fragment and is not the molecular ion.
A Microsoft® Excel file containing peak height data for each metabolite was generated and manually checked for the presence of contaminants (e.g., MCF derivative artefacts and plasticisers). Aberrant records were removed, and the resulting QC-filtered peak intensity values were normalised by the intensity of the internal standard to compensate for potential technical variations (e.g., variable metabolite recoveries).

2.7.4. Statistical Analysis and Data Visualisation

Statistical analysis of the survival data was conducted using SPSS v22.0 statistical software (IBM Corp: Armonk, NY, USA). One-way Analysis of Variance (ANOVA) with Tukey’s Post Hoc Tests was performed separately for each of the three sampling times (18, 42, and 72 h post-Cu exposure) across the treatment levels. Pre-processing and statistical analysis of the metabolite data were conducted using MetaboAnalyst v5.0 [49]. After uploading the .csv files containing the formatted peak intensity tables, the data were autoscaled to meet the distributional requirements for subsequent data analyses.
Lethal and sublethal effects of Cu on the embryonic/larval metabolic profiles were assessed separately due to the occurrence of high mortalities between 18 and 42 h post-exposure of embryos to 50.3 µg·L−1 bioavailable Cu. To first investigate the underlying structure of the data, Hierarchical Cluster Analysis (HCA) was performed as an unsupervised classification method to identify inherent sample groupings. Euclidian distance and Ward’s criterion were selected as the measures of distance and aggregation, respectively. Heatmap analysis combined with HCA of all metabolite features identified in the embryonic samples was performed to provide a simple visual summary of the data, and cluster metabolites with similar expression profiles across the samples.
For each exposure duration (3 and 18 h), supervised Projection to Latent Structures Discriminant Analysis (PLS-DA) was performed to construct sample classification models and identify metabolites that contributed most towards group partitioning. Metabolites contributing most to the classification model were identified based on the Variable Importance in Projection (VIP) scores. Metabolites with VIP scores ≥ 1.0 were considered important to the model. The quality of the models was evaluated via the R2 and Q2 values of the first two latent variables (LVs), which indicate the total variation explained in the data and the cross-validated predicted variation, respectively, using the leave-one-out cross validation (LOOCV) approach.
To identify the metabolite features that were significantly altered by Cu treatment within each timeframe of exposure, Significance Analysis of Microarrays/Metabolites (SAM) and fold-change analyses were performed at 3 and 18 h post-treatment as univariate measures to discriminate the toxicological effects. SAM employed an alpha cutoff of 0.05; global false discovery rates (FDR) are provided.
To assist in the interpretation of the data beyond the investigation of single metabolite variations and examine the metabolomics profiles more comprehensively, secondary bioinformatics procedures were performed to extract various sets of functionally related metabolites involved in the same biochemical pathways. These sets were then analysed together to determine the likelihood of entire pathways being differentially regulated as a response to Cu treatment. All reliably annotated metabolites were mapped into metabolic pathways using the Kyoto Encyclopedia of Genes and Genomes (KEGG) database and assessed via Quantitative Enrichment Analysis (QEA) and Network Topology Analysis (NTA) as described by [50]. QEA and NTA were conducted on the control vs. treatment data for each exposure duration. In order to assess the effect of Cu exposure duration on the differential regulation of the enriched biochemical pathways, the results of the QEA and NTA analyses for each timeframe were extracted and re-plotted together (i.e., overlaid) so that any shifts in the significance of particular metabolic pathways could more easily be visualised and discerned.
To investigate the effects of sublethal Cu exposures, PLS-DA analysis of all metabolomics data across development stages and treatments was first performed. Since some data were missing for particular development stages (due to metabolite levels being zero or below the detection limits), these were replaced using the half minimum approach for ‘not missing at random’ data as recommended by [51]. Mean LV1 and LV2 values (±SE) were plotted on a 2-D score plot to summarise general temporal trends in the developing embryonic/larval mussel metabolome and expose the toxicological effect on metabolism.
As the embryos developed, large phenotypic effects were clearly apparent in the baseline metabolic trajectory. Thus, all data were phenotypically normalised and subsequently re-analysed. The normalisation procedure involved the division of each metabolite peak height by the respective mean control value for each development stage. This process essentially resulted in control sample values being centred around 1.0, and treatment data being expressed as a relative fold change compared to controls for each of the four developmental phenotypes. The produced plot revealed new information that was not discernible in the original plot. To provide a visual summary of the metabolite abundances that were responsible for the positioning of sample groups and the metabolic trajectories in the phenotype-normalised PLS-DA plot, Heatmap analysis with combined HCA of metabolites was performed. For each development stage/exposure duration, mean log2 foldchange values relative to control samples were calculated, imported into PermutMatrix (v 1.9.3) software [52], and then clustered using Euclidian distance and Ward’s criterion as measures of distance and aggregation, respectively.

2.8. Oxidative Stress/Damage Analysis

2.8.1. Protein, Lipid, and DNA Analysis

Prior to extraction, embryonic and larval samples (each containing approximately 200,000 individuals) were thawed in a 20 °C water bath for 1 min. Total protein was extracted on ice by adding 500 µL of ice-cold enzyme extraction buffer (50 mM potassium phosphate [pH 7.2], containing 0.1 mM Na2EDTA, 1 mM EGTA, 125 mM KCl, and 1 mM phenylmethylsulfonyl fluoride) to the samples, followed by mixing with a vortex mixer and homogenising for 1 min using a Mini-Beadbeater-1 and Zirconia/Silica beads (Biospec Products: Bartlesville, OK, USA). The homogenate was centrifuged (Eppendorf 5417R: Eppendorf South Pacific Pty. Ltd.: North Ryde, NSW, Australia) for 15 min at 20,800× g and 4 °C. The supernatant, now referred to as the protein extract, was then transferred to a 1.5 mL microcentrifuge tube. The pellet of cell debris was retained for lipid extraction, and the protein extract was subjected to ultrafiltration using Vivaspin® 500 Centrifugal Concentrators with 10,000 MWCO membranes (Sartorius Stedim Biotech Gmbh: Goettingen, Germany) according to the manufacturer’s instructions. The ultrafiltered protein extract was reconstituted with ice-cold 100 mM potassium phosphate (pH 7.2), and protein contents were determined using the Lowry protein assay [53]. Samples were then diluted as required with 100 mM potassium phosphate (pH 7.2) prior to targeted enzyme analyses. Protein carbonyl levels in the reconstituted protein extracts were determined via reaction with 2,4-dinitrophenylhydrazine (DNPH) according to [54] and expressed as nmols of carbonyls per mg protein.
Lipids were extracted from the pellet of cell debris (remaining after protein extraction) by adding 500 µL of methanol-chloroform solution (2:1 v/v) to the tube. Each sample was left to stand for 1 min, and then 200 µL of chloroform was added and vortex-mixed for 30 s. Deionized water (200 µL) was added, and the extract was mixed again for 30 s. To separate the phases, the resulting homogenate was centrifuged (Eppendorf 5417R) twice for 1 min at 20,800× g at ambient temperature. Lipid hydroperoxide levels were determined using the ferric thiocyanate method described by [55], adapted for measurement in a microtitre plate reader. Lipid hydroperoxide levels were determined by measuring the absorbance at 500 nm. A calibration curve with t-butyl hydroperoxide was used, and the lipid hydroperoxide content was calculated as nmol of lipid hydroperoxide per sample. The above assays were carried out using a multilabel counter (Wallac Victor 1420, Perkin Elmer: San Jose, CA, USA) controlled by a PC and fitted with a temperature control cell (set to 25 °C) and an auto-dispenser. The data were acquired and processed using the WorkOut 2.0 software package (Perkin Elmer).
DNA was extracted using an ISOLATE II Genomic DNA Kit (Bioline: N.S.W, Australia), following the manufacturers’ instructions for standard samples, but with minor modifications. After addition of the pre-lysis buffer, samples were homogenised for 1 min using a Mini-Beadbeater-96 and Zirconia/Silica beads (Biospec Products). In addition, the pre-lysis was supplemented with 5 mM deferoxamine and 20 mM EDTA, and the lysis buffer was supplemented with 5 mM deferoxamine. All solutions were deoxygenated by gently bubbling with nitrogen gas for 5 min.
Digested DNA samples were analysed using high-performance liquid chromatography (HPLC), followed by UV detection of guanine and coulometric detection of 8-hydroxy-2′-deoxyguanosine (8-OHdG). The procedure was performed using a C18 reverse-phase column (5 mm, 4.6 mm × 250 mm) (JASCO: Tokyo, Japan), an HPLC system (PerkinElmer: Boston, MA, USA), and an electrochemical detector (5100 Coulochem, ESA: Chelmsford, MA, USA). Separation of DNA was achieved using an isocratic mobile phase (50 mM potassium phosphate [pH 5.5] and 10% methanol) at a flow rate of 1 mL min−1, with the column maintained at 30 °C. The analytical cell oxidation potentials of the electrochemical detector were set to 150 mV and 350 mV for electrodes 1 and 2, respectively, with the guard cell potential set at 400 mV. Unmodified nucleosides were detected by their absorbance at 260 nm. Peak data were collected and analysed using a DataCenter 4000 (DataworkX: Brisbane, Australia) general-purpose laboratory data interface and Delta 5.0 chromatography data acquisition and analysis software (DataworkX). The retention times for guanine and 8-OHdG were 12 and 17 min, respectively. Pure solutions of 8-OHdG and guanine (Sigma-Aldrich: St Louis, MO, USA) were prepared in HPLC-grade water (Merck: Darmstadt, Germany) and sterilised by passage through 0.22 μm filters (Millipore: Bedford, MA, USA) to be used as standards. The amount of DNA injected onto the column for each sample was estimated using the signal for guanine, and 8-OHdG was quantified by comparison to external standards.

2.8.2. Antioxidant Enzyme Analysis

Total protein was extracted as previously described for protein carbonyl measurements and followed by enzymatic antioxidant assays for superoxide dismutase (SOD: EC 1.15.1.1), catalase (CAT: EC 1.11.1.6), glutathione peroxidase (GPx: EC 1.11.1.9), glutathione reductase (GR: EC 1.8.1.7), and glutathione-S-tranferase (GST: EC 2.5.1.18) activity using a Perkin Elmer Wallac Victor 1420 multilabel counter.
SOD activity was determined using the microplate assay [56], with minor modifications. 50 μL of protein extract or standard (prepared from bovine liver SOD [Sigma-Aldrich] where one unit of SOD corresponded to the amount of enzyme that inhibited the reduction of cytochrome c by 50% in a coupled system with xanthine oxidase at pH 7.8 and 25 °C) was mixed with 125 μL of freshly prepared reaction solution containing PIPES buffer, pH 7.8, 0.4 mM of o-dianisidine, 0.5 mM of diethylenetriaminepentaacetic acid, and 26 μM of riboflavin. Absorbance at 450 nm was measured immediately (t = 0 min), then samples were illuminated with an 18 W fluorescent lamp placed 12 cm above the plate for 30 min and measured again (t = 30 min). A regression analysis was used to prepare a standard line relating SOD activity to the change in absorbance. Superoxide dismutase activities in the extracts, calculated with reference to the standard line, are expressed as units of SOD per mg of total protein.
CAT activity was determined using the chemiluminescent method, adapted for 96-well microplates [57]. 50 μL of extract or standard (purified bovine liver CAT [Sigma-Aldrich] in homogenization buffer) was mixed with 100 μL of 100 mM phosphate buffer (pH 7.0) containing 100 mM of Na2EDTA and 50 μL of 1 μM H2O2. Samples were then incubated at 25 °C for 30 min, after which 50 μL of a solution containing 20 mM luminol and 11.6 U/mL of horseradish peroxidase (Sigma-Aldrich) was injected into each well. Light emission, the intensity of which was proportional to the amount of H2O2 remaining in the mixture, was measured. A regression analysis was used to prepare a standard line relating standard CAT activities to the intensity of light emission. CAT activities in the extracts were calculated with reference to the standard line and expressed as µmol of H2O2 consumed per min per mg of total protein.
GPx activity was determined using the spectrophotometric method [58], adapted for a microplate reader. 20 μL of extract or standard was mixed with 170 μL of assay buffer containing 50 mM of Tris-HCl buffer (pH 7.6), 5 mM of Na2EDTA, 0.14 mM of NADPH, 1 mM of GSH, and 3 U/mL of wheat germ glutathione reductase (EC 1.6.4.2) (Sigma-Aldrich). The reaction was initiated by the addition of 20 μL of t-butyl hydroperoxide to give a final concentration of 0.2 mM. The consumption of nicotinamide adenine dinucleotide phosphate was monitored at 340 nm every 30 s for 3 min, with the plate shaken automatically before each reading. The GPx activities in the extracts were calculated with reference to a standard line constructed with GPx purified from bovine erythrocytes (Sigma-Aldrich) in extraction buffer. The data are expressed as nmol per min per mg of total protein.
GR activity was determined using the method of [59], with minor modifications. Briefly, 50 μL of extract (diluted extract or standard GR from wheat germ [Sigma-Aldrich] in homogenization buffer) was mixed with 150 μL of 100 mM sodium phosphate buffer (pH 7.6) containing 0.1 mM 5,5′-dithiobis(2-nitrobenzoic acid) and 10 μL of 12 mM NADPH. The reaction was initiated by the injection of 10 μL of 3.25 mM oxidised glutathione, and the absorbance was measured at 415 nm every 30 s for 3 min, with the plate shaken automatically before each reading. The rate of absorbance increase per min was calculated, and a calibration curve relating standard GR activities to the change in absorbance was constructed. GR activities in the extracts were calculated and expressed as nmol of oxidised glutathione reduced per min per mg of total protein at pH 7.6 and 25 °C.
GST activity was determined using the photometric 1-chloro-2,4-dinitrobenzene (CDNB) method according to [60], with minor modifications. The absorbance at 340 nm was measured every 30 s for 3 min, with the plate shaken automatically before each reading. The change in absorbance per minute was calculated and converted into nmol of CDNB conjugated to GSH per min per mg of total protein using the extinction coefficient (E340 = 9.6 mM−1 cm−1) of the resulting S-2,4-dinitrophenylglutathione.

2.8.3. Reduced Glutathione Analysis

Glutathione (GSH) was extracted and identified during an untargeted metabolomics-based analysis. Due to its high relevance in mechanisms of oxidative stress, glutathione data are presented together with other oxidative stress biomarkers that were targeted. To obtain semi-quantitative GSH data, GC/MS-derived peak intensity values were standardised against the L-Alanine-d4 internal standard (i.e., [glutathione peak height/int. std. peak height] x int. std. concentration), assuming a similar response factor of 1.

2.8.4. Analysis of Reactive Oxygen Species

ROS production was measured in vivo using the cell-permeant ROS-detecting fluorescent dye 2′,7′-dichlorodihydrofluorescein diacetate (H2-DCFDA) (Invitrogen–Molecular Probes, D399: Eugene, OR, USA). Upon cleavage of the acetate groups by intracellular esterases and oxidation, the non-fluorescent H2-DCFDA is converted to the highly fluorescent 2′,7′-dichlorofluorescein (DCF), which can be measured via fluorescence spectroscopy. At 18, 36, and 66 h post-fertilisation (the final sampling time for this analysis was not 72 h due to logistical constraints), approximately 60,000 embryos or larvae from each of the 15 incubation tanks were concentrated on a 15 µm mesh screen, transferred via pipette to a 50 mL FalconTM tube, and made up to 25 mL with FSW. Six 210 µL subsamples (technical replicates) of each larval solution, containing approximately 500 larvae, were then transferred to wells of a 96-well microplate. Blank seawater controls contained 210 µL of FSW. Immediately prior to performing each ROS assay, a pre-frozen stock of the H2-DCFDA probe (1 mM in DSMO) was thawed and a 20 × dilution was prepared in FSW. Then, 40 µL of this diluted H2-DCFDA working solution was pipetted into all wells, and the plates were incubated in the dark at 19 ± 0.5 °C for 120 min. ROS production was assessed by measuring the DCF fluorescence intensity on a Perkin Elmer microplate reader (Ex/Em: 490/520 nm). Variations in intensity values are reflective of relative differences in ROS production among treatments.

2.8.5. Statistics and Data Presentation

To identify differential expressions/activities of targeted oxidative stress biomarkers in Cu-exposed larvae compared to control organisms, each biomarker was assessed separately via t-test analysis for each development stage and treatment level using SPSS v22.0 (IBM Corporation: Armonk, NY, USA). To facilitate visualisation of the trends on a common scale, the data have been autoscaled and each biomarker presented separately in line plots. A summary of results is also displayed in the form of a table with colour coding, where up/down arrows represent statistically different (p < 0.05) biomarker expressions/activities in the Cu-exposed embryos and larvae compared to non-exposed control organisms.

3. Results

3.1. Seawater Chemistry

The composition of the 1 µm filtered bulk seawater used for the experiment prior to additions of EDTA and CuSO4 is presented in Table 1. The salinity and pH (free scale) were 34.3 ppt and 8.1, respectively. After EDTA and CuSO4 additions, the actual values of total dissolved Cu were slightly higher than nominally designed, and between-treatment compositional differences in Cu fractionation was verified (Table 2). The bioavailable Cu previously present in the source seawater was almost entirely chelated (99.6%) by the addition of EDTA in the control tanks. EDTA addition also made substantial amounts of Cu biologically unavailable in the treatment tanks. The ability of 4 µM EDTA to complex high levels of toxic Cu species became limiting when the measured total dissolved Cu was between 250 µg·L−1 (96% EDTA-bound) and 370 µg·L−1 (70% EDTA-bound). Final treatment levels of bioavailable Cu were determined to be 0.04, 1.10, and 50.30 µg·L−1. The pH and water temperatures in the incubation tanks did not change significantly throughout the experiment.

3.2. Survival and Development

At sublethal bioavailable Cu-exposure levels (0.04 and 1.10 µg·L−1), proportions of surviving embryos and larvae at each sampling time (18, 42, and 72 h post-fertilisation [hpf]) were comparable to those surviving in the control tanks (t-tests; p > 0.05) (Figure 1A). Although exposure of embryos to 50.3 µg·L−1 of bioavailable Cu did not compromise survival for the first 18 h significantly, it is likely that they perished soon afterwards as there were no visible indications of intact biological material present during a 36 h post-treatment spot-check. A visual assessment during the mortality assay after 18 h of high Cu exposure revealed that those embryos were also substantially delayed in their development. These comprised mostly of 16 to 32-cell blastulae, some gastrulae, and a few non-swimming trochophores with evidence of abnormal cell differentiation when compared to normally developed and highly mobile trochophore-stage embryos in control tanks. In addition, although cell membrane integrity appeared to be mostly maintained in embryos exposed for 18 h to the high Cu treatment (i.e., demonstrated by the active transport of neutral red across the membrane and permanent incorporation into lysosomes), there were some indications of changes in cell morphology and size (mostly through oncosis, but with some shrinkage also observed), cellular injury and blebbing, and a commencing of loss of cellular adhesion (apparent as cellular dissociation). These observations strongly suggest that the initiation of Cu-induced mechanisms of cellular apoptosis and/or necrosis was occurring in these samples.
Of the surviving organisms towards the end of the experiment, prolonged exposure to Cu resulted in proportions of D-larvae displaying signs of reduced swimming velocity and abnormal motion trajectories (Figure 1B). Approximately 10% of the D-larvae that had been exposed to 1.10 µg·L−1 bioavailable Cu also presented developmental abnormalities, such as retarded growth and deformities in shell structure.

3.3. Untargeted Metabolomics Analyses

3.3.1. Lethal Exposure Effects

Exposure of embryos to 50.3 µg·L−1 bioavailable Cu caused extensive metabolic alterations prior to cell death. Hierarchical cluster analysis (HCA) of the 3 h and 18 h Cu-exposed groups and their respective controls revealed that all samples were correctly clustered based on the underlying structure of the metabolite data (Figure 2).
Heatmap analysis (Figure 3A) provides a clear visualisation of the global differences/similarities in the metabolite expression profiles that were responsible for the distinct clustering of samples. Separate projection to latent structures discriminant analysis (PLS-DA) models (Figure 3B,C) were constructed for each development stage due to the large influence of the baseline developmental phenotype on the embryonic metabolomes (i.e., 3 h vs. 18 h control samples), and the differential metabolic responses to high Cu levels between these groups. For the 3 h Cu-exposed embryos (Figure 3B), the first latent variable (LV1) accounted for 32.5% of the explained variation between sample groups in the PLS-DA model (R2 = 0.99; Q2 = 0.61). Analysis of the variable importance in projection (VIP) scores (Figure 3D) revealed that the abundances of 35 features contributed most (i.e., VIP ≥ 1.0) towards sample classification, including metabolites associated with energy production (i.e., succinic, fumaric, and malic acids), lipid metabolism (i.e., free fatty acids), and protein metabolism and osmotic regulation (i.e., free amino acids), among others. Significance analysis of metabolites (SAM) (Figure 4A) identified 17 metabolites that were statistically different between control and treatment groups after 3 h of exposure, with varying directions of expression (positive vs. negative fold changes).
After 18 h of exposure, the effect of elevated Cu on the embryonic metabolome was far more pronounced. PLS-DA analysis of the 18 h Cu-exposed embryos (Figure 3C) resulted in LV1 accounting for 76.3% of the explained variation between groups in the classification model (R2 > 0.99; Q2 > 0.99). Of the total number of metabolites detected, a substantial proportion (61%) contributed highly (VIP ≥ 1.0) towards the PLS-DA model (Figure 3E). After 18 h of exposure, SAM analysis (Figure 4B) identified 62 metabolites, including 18 unannotated metabolites/features, with abundances that were statistically different between the control and treatment groups.
The majority of metabolites that were differentially expressed after 3 h were also differentially expressed after 18 h (Figure 4). Many of these metabolites also displayed similar foldchange directions. For example, lysine, β-alanine, valine, dodecanoic acid, and an unassigned feature (142(100) 153(51.8)…) were all elevated in the Cu-exposed groups, whereas methionine, aminomalonic acid, glutathione, and 2-aminobutyric acid were similarly reduced. Conversely, a number of metabolites exhibited differential levels that were dependent on the duration of Cu exposure. For example, after 3 h, the abundances of some energy-associated metabolites (malic, fumaric, and lactic acids) were all elevated compared to control embryos; but after a further 15 h of Cu exposure, the expression patterns of these functionally related metabolites fell below control levels.
Quantitative enrichment analysis and network topology analysis of the 3 h and 18 h metabolite datasets (treatment vs. control) exposed some major changes in pathway regulation, which could be compared when overlaid (Figure 5). After 3 h of Cu exposure, eight pathways were identified as being differentially regulated compared to control embryos. These comprise networks associated with energy production, glutathione metabolism, the biosynthesis of aminoacyl-tRNA, and various subsets of amino acid metabolism. After 18 h of Cu exposure, all but one of these pathways (pyruvate metabolism) became significantly disturbed compared to the metabolic baseline controls, as revealed by the pronounced vertical movement of the data. The extended exposure duration also resulted in a further 10 pathways displaying differential regulation compared to control embryos. These included networks associated with extra subsets of amino acid metabolism, methane metabolism, glyoxylate and dicarboxylate metabolism, arachidonic metabolism, and fatty acid biosynthesis.

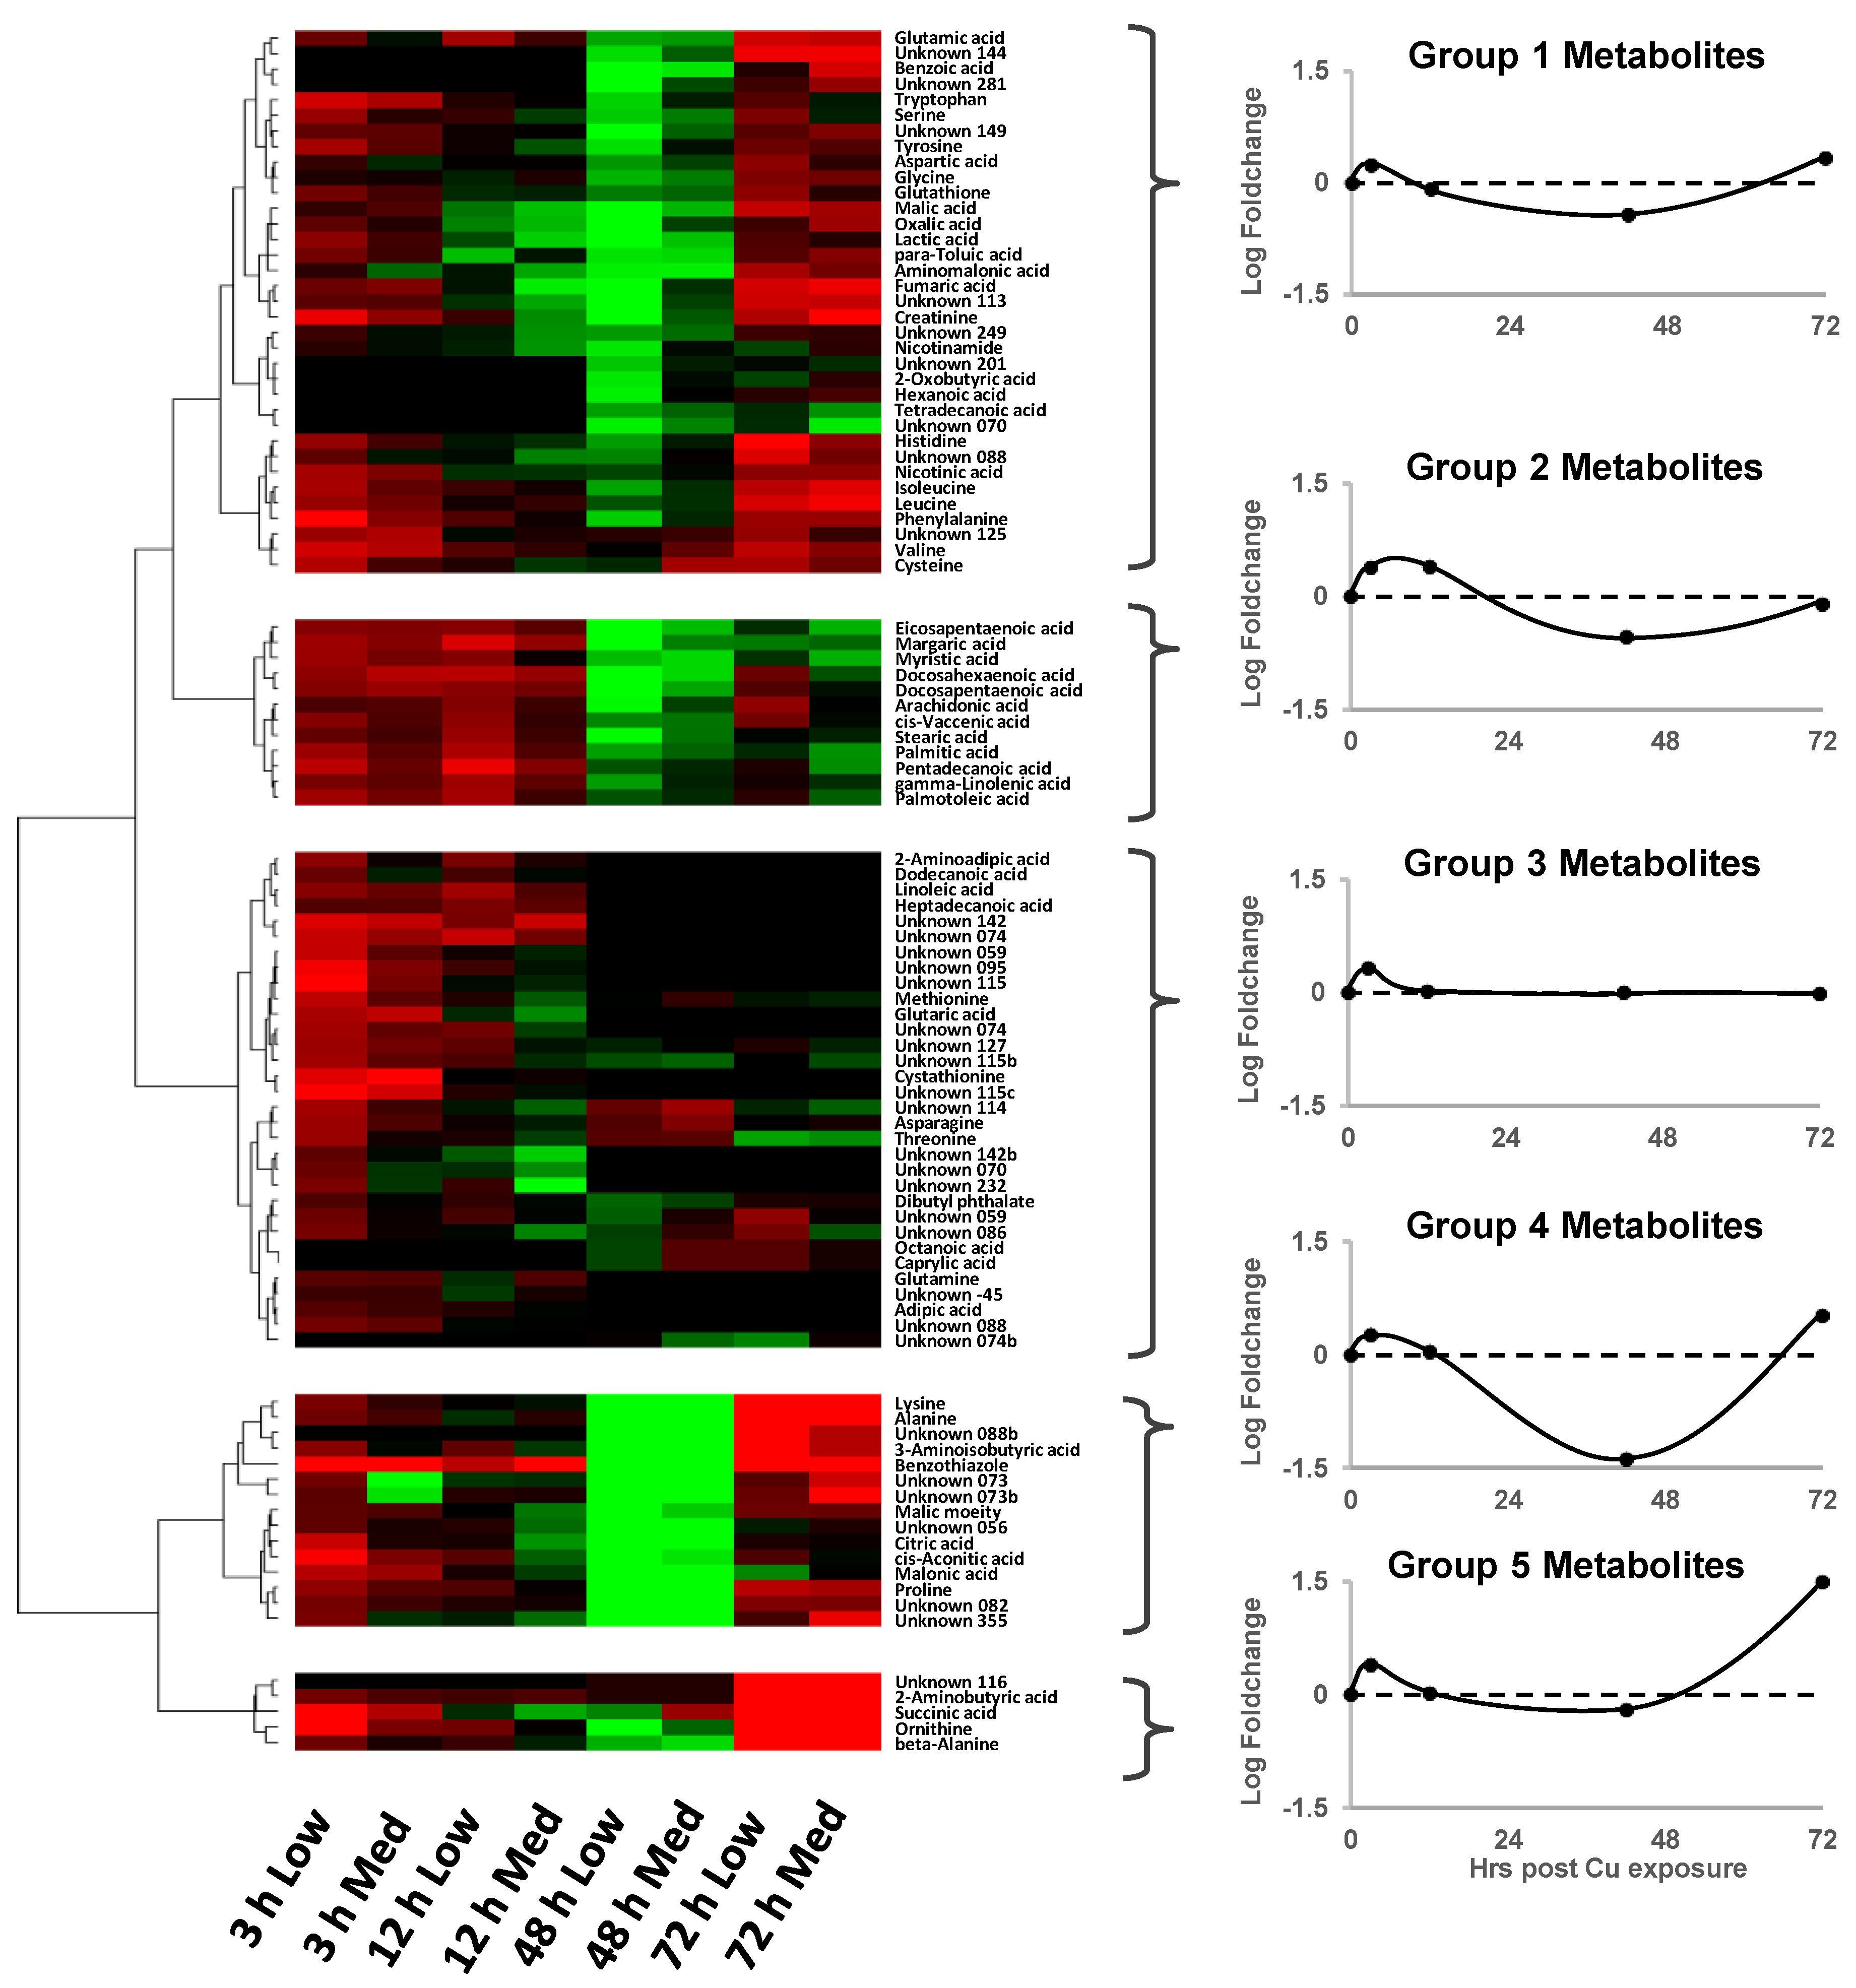
3.3.2. Sublethal Exposure Effects

Exposure of mussel embryos to sublethal levels of bioavailable Cu (0.04 and 1.10 µg·L−1) revealed that even low concentrations had substantial effects on metabolism (Figure 6). These metabolic responses were dependent both on the concentration and duration of Cu exposure. PLS-DA analysis of the sublethal metabolomics data across all samples revealed that there was a clear metabolic trajectory associated with developmental timing (Figure 6A). For each Cu exposure duration, deviations from this baseline trajectory were apparent. The positioning of treated samples within the PLS-DA score plot, relative to their respective controls, indicated that different metabolites were responsible for variations in treatment-induced trajectories along the LV1 and LV2 axes.
Due to the large effect of developmental timing on the embryonic metabolome, the subtleties of some treatment effects were masked, especially when their trajectories aligned with the metabolic path during baseline development (i.e., exposure of embryos to 0.04 µg·L−1 bioavailable Cu after 18 and 42 h of exposure). Thus, to remove unimportant components of the global variation contributing towards group partitioning in the model and visually capture the effects of Cu treatments without developmental-induced biases, phenotypic normalisation was applied, and the resulting data were replotted (Figure 6B).
The phenotype-normalised metabolic trajectory plot (Figure 6B) revealed that low and medium bioavailable Cu treatment levels substantially perturbed embryonic and larval metabolic signatures compared to controls. For each exposure duration, the divergent trajectory directions and lengths along the LV1 and LV2 axes further substantiate that the relative abundances of different metabolites are responsible for the observed pattern and provide evidence that the toxic effect of Cu on the embryonic/larval metabolome is time-dependent. Furthermore, there appear to be similar temporal treatment effects between the two Cu treatment levels (Figure 6B, dotted lines), which could not be discerned prior to phenotypic normalisation. This trend is consistently offset between the two Cu treatment levels (with the higher dose being further away from controls than the lower dose), which indicates that higher Cu exposures cause more pronounced disturbances to baseline metabolism than the lower Cu dose, regardless of exposure duration or development stage. However, the positioning of the samples between Cu treatments within each exposure duration is relatively close to one another, indicating that the exposure duration had more of an effect than the copper concentration.
After 3 h, most metabolites increased in their relative abundances compared to non-Cu-treated controls (Figure 7). After 18 h, many metabolite levels within the low Cu dose exposure group remained higher than in control embryos, whereas levels of various metabolites in the medium dose exposure group had dropped below control values. After 42 h, the majority of metabolites consistently had negative foldchange values (ca. −2.0) compared to control organisms. These observations suggest that the higher of the two Cu doses initiated the temporal change in metabolite profiles much earlier (after 18 h in trochophore-stage embryos) than the lower treatment dose (apparent after 42 h in D-stage larvae). Continued exposure to sublethal Cu levels resulted in differential metabolite responses after 72 h. The relative abundances of a few metabolites (e.g., succinic acid and 2-aminobutyric acid [Group 5]) increased substantially above control values, many metabolites (e.g., glutamic acid, histidine, and glycine [Group 1]) appeared to return to levels corresponding with those found after 3 h of exposure, and a number of metabolites (e.g., fatty acids [Group 2]) had returned to control levels. A large proportion of metabolites comprising some amino acids and unknown compounds (e.g., asparagine, threonine, and methionine [Group 3]) were minimally impacted. These general trends are summarised in plots of the mean Cu-induced foldchange values for each exposure duration based on the cluster analysis of metabolites (Figure 7 line plots); five broad response patterns were identified.

3.4. Targeted Analysis of the ROS Regulatory System

Exposure of mussel embryos to copper induced a number of significant changes in the oxidative stress biomarkers assayed. These effects were dependent on the dose and duration of exposure. After 18 h of exposure, levels of embryonic ROS were similar for all treatment groups (Figure 8A). After 36 h of exposure to sub-lethal Cu concentrations, ROS production was significantly elevated (ANOVA; Tukey’s post hoc tests; p < 0.05) compared to controls (Figure 8B). A re-balance of the ROS regulatory system was seemingly achieved upon prolonged exposure, with levels resembling the control after 66 h of exposure (Figure 8C).
Evidence of oxidative stress responses to copper exposure was revealed in the analysis of enzymes involved in balancing intracellular ROS, and through elevated levels of macromolecular oxidation products (Figure 9; Table 3). Exposure of embryos to low bioavailable Cu (0.04 µg·L−1) for 42 h resulted in subtle signs of lipid damage (ca. 13% higher lipid peroxides than control values); with this one exception, macromolecule damage was not significant. This demonstrates that the low-dose treatment did not result in lasting negative effects associated with the characteristic mechanism of heavy metal toxicity via ROS-induced oxidative damage to DNA, proteins, and lipids. A slight response of the ROS regulatory system was apparent via increasing relative GSH levels.
In contrast, exposure of larvae to the medium Cu dose (1.10 µg·L−1) resulted in a rapid increase in GST and GPx activity after 3 h of exposure. After 18 h of exposure, evidence of oxidative damage to all three macromolecule biomarkers was apparent. After 42 h, DNA, protein, and lipid damage persisted with co-elevation of GR, SOD, and CAT activities. The high dose Cu treatment (50.3 µg·L−1) induced extensive damage to DNA, protein, and lipids in embryos after only 3 h of exposure. Unlike the sublethal Cu treatments, reduced activities of several antioxidant enzymes (i.e., GR, SOD, and CAT) were detected at the first sampling point, indicating severe toxicological effects. By 18 h, these impacts had expanded to include simultaneous reductions in GSH levels and the activities of GST and GPx.

4. Discussion

4.1. Seawater Chemistry

Most of the bulk seawater compositional features were within the range of expected values for nearshore waters in New Zealand. However, according to the Australian and New Zealand guidelines for marine water quality [21], the total Cu level measured (2.9 µg·L−1) was more than two-fold higher than the 95% trigger value (1.3 µg·L−1). Guideline trigger values are concentrations that indicate a potential environmental problem if exceeded. The percentage value is the protection level that signifies the proportion of species expected to be protected if total Cu ≤ 1.3 µg·L−1. Taking into consideration the concentration of dissolved organic carbon (DOC), speciation modelling predicted that the majority (ca. 95%) of the total Cu was bound to the fraction of DOC defined as humic(-like) substances. The resulting calculated level of bioavailable Cu in the bulk seawater prior to EDTA additions was 0.133 µg·L−1.
Speciation and competition of trace metals in aquatic environments is complex and depends on a multitude of factors, including pH, temperature, salinity, inorganic ion composition, and DOC content [34,42]. In seawater, Cu speciation is largely dominated by the formation of natural organic complexes. In the absence of a more specific characterization of the organic binding capacity of matrix, it has generally been assumed that the Cu-binding capacity of DOC is well represented by that of humic(-like) substances [45,61]. When bound to these natural organic ligands, Cu toxicity is greatly ameliorated since the free cupric ion (Cu2+) is largely or completely unavailable for uptake by aquatic organisms [24,62]. The remaining Cu consists of free Cu2+ and an array of Cu-containing inorganic compounds. In these weakly bound ionic forms, Cu is labile, bioavailable, and toxic [45].
To provide aquaculture industry-relevant information in the current study, the addition of EDTA to the incubation tanks was included to simulate commercial hatchery conditions [63]. Without EDTA, embryonic development and D-larval yield are routinely very low for this species (<10%), with occurrences of cellular membrane degradation, detachment of microvilli, perivitelline space increases, changes in behaviour, and various enzymatic and macromolecular bioindicators of severe oxidative stress [35,36,37]. Although higher survival with EDTA supplementation during embryogenesis is generally considered to be linked with the detoxification of trace metal contaminated source water, it may also be linked to the reduction of virulence factors (e.g., metal-dependent proteases) associated with ubiquitous pathogenic bacteria [64,65,66,67].
The addition of EDTA to the embryo incubation water dramatically reduced the bioavailability of Cu in the dosing treatments. The bioavailable Cu fraction (free Cu2+ + ∑ inorganic labile species) within each sublethal treatment was low (Table 2 [treatments 1 and 2]), with the vast majority of total Cu in these treatments being strongly bound as Cu-EDTA complexes. These findings may be of interest to the developing mussel industry in New Zealand since such levels of total Cu are beyond those that would normally be found within local coastal waters, even in highly polluted zones. A recent analysis detected total Cu levels in New Zealand mussel hatchery source water to be as high as 13.2 µg·L−1 [35]. This supports the continued use of metal chelators during embryo incubation as a precautionary safety measure against heavy metal contamination.
The lower treatment levels were not lethal, but they did induce dose-dependent developmental retardation, behavioural abnormalities, and structural deformities. Under the experimental conditions that were employed, data reveal that the approximate 72 h EC10 of bioavailable Cu for developmental abnormalities was around 1.10 µg·L−1. Comparative embryotoxicity information for the effects of Cu on P. canaliculus is thus far lacking; perturbation during embryogenesis may compromise subsequent larval performance, metamorphosis, and recruitment [38]. It would therefore be valuable to consider potential toxin-induced carry-over effects on later developmental stages in conjunction with sublethal embryo assessment.

4.2. Biochemical Profiling

Profiling of key metabolites and enzymes demonstrated that the embryonic and larval metabolomes of marine mussels are extremely sensitive to Cu-induced toxicological influences. These profiles are representative of unique ‘metabolic fingerprints’ that reflect health conditions and are thus in themselves biomarker signatures of physiological status. Distinct metabolic trajectories associated with embryonic developmental timing, levels of Cu concentration, and the duration of Cu exposure were identified. Discrimination between treatment groups was obtained via unsupervised and supervised multivariate analyses, with results showing the presence of intricate temporal metabolite variations.
One striking feature of the sublethal data was what appeared to be a sinusoidal oscillation of metabolite fold changes over time in Cu-exposed embryos compared to controls (e.g., Figure 7). This may suggest that an initial toxic shock (revealed by subtle accumulations of many metabolites in late-stage blastula embryos) was buffered via metabolic adaptation, leading to transitional returns towards baseline levels through trochophore development. However, many of these metabolites fell below control levels in early D-stage larvae, indicating potential metabolic dysregulation. This perturbation seemed to trigger an attempt to re-establish baseline metabolism during subsequent development to overcome the possible deleterious effects of sublethal treatments.
A lethal-level Cu dose caused major alterations in many metabolites and resulted in catastrophic metabolic failures and mortalities shortly after 18 h of exposure. Pathway analysis revealed changes in the levels of a number of functionally related metabolites within a range of known biochemical pathways. This approach enabled unique temporal profiles dependent on exposure duration to be discerned, which might not otherwise have been identified using more conventional procedures. As might be expected, dysregulation of these pathways became more severe with time (Figure 5). Eight out of 19 pathways showed signs of imbalance after 3 h of high Cu exposure, whereas 18 out of the 19 pathways were likely affected after 18 h of exposure. Changes in metabolite compositions indicated dysregulation of energy production, the occurrence of osmotic stress, potential neuro- and immuno-toxic associations, and numerous indicators of oxidative stress through disrupted regulation of reactive oxygen species.

4.2.1. Energy Metabolism

Under normal physiological conditions, concentrations of TCA cycle intermediates remain almost constant [68]. When intermediates are removed to serve as biosynthetic precursors, they are typically replenished in dynamic balance via anaplerotic reactions (e.g., glutamine → α-ketoglutarate) [69]. However, decreases in the abundance of TCA cycle intermediates can be considered indicative of increased pathway flux, ATP demand, utilisation for secondary biosynthesis, and/or reduced mitochondrial function [70,71,72]. After 42 h of exposure, sublethal-level Cu treatments caused reductions in citrate, cis-aconitate, fumarate, and malate. These data may suggest that low concentrations of Cu alter energy metabolism in early D-stage larvae through enhanced demands for ATP to fuel detoxification processes, such as the synthesis of antioxidant enzymes. Indeed, sublethal trace metal exposures increase respiration rates in various organisms, probably to account for enhanced ATP expenditure during toxin-induced requirements for defence and repair mechanisms whilst simultaneously maintaining routine metabolism [73,74,75,76]. The decreased pool of free amino acids at this time may also indicate enrichment in protein synthesis and/or an enhanced requirement for energy through their oxidation and utilisation as TCA cycle substrates. However, these responses were transient, with levels of all detected TCA cycle intermediates returning, or adhering, to control levels by the end of the trial. This implies a capacity for metabolic regulation of immunotoxicity in developing D-larvae.
Cis-aconitate is a key substrate for the enzyme aconitase. Exposure of embryos to lethal-level Cu induced an accumulation of this metabolite, which can be attributed to reduced aconitase activity [77]. Iron-sulphur-containing aconitase is a well-known target of Cu toxicity, and, being the most sensitive TCA cycle enzyme to ROS inhibition, its activity can be used as a biomarker of oxidative stress [78,79,80,81,82]. Enzyme inhibition in the case of Cu toxicity involves O2˙ and OH˙ produced via the Haber–Weiss reaction, a process analogous to the Fenton reaction [83,84,85]. Oxidative inactivation of aconitase promotes cluster instability, causing the enzyme to release redox-active Fe2+ and stimulating the associated formation of H2O2 which encourages Fenton reaction events and further production of OH˙, thus creating a self-amplifying cycle if unresolved [86,87]. Aconitase forms a direct link between ROS metabolism, iron homeostasis, the flow of metabolite intermediates in the TCA cycle, and energy production [82].
Cheng et al. [77] demonstrated via aconitase gene knockdown in a Drosophila model that reduced mitochondrial aconitase activity impairs glycolysis and the TCA cycle and decreases the generation of ATP. Specific markers of impaired energy metabolism caused by reduced aconitase activity included an increase in levels of cis-aconitate, and substantial concomitant decreases in downstream levels of succinate, fumarate, and malate. Results of the current study match this metabolite expression pattern for the group of embryos exposed to lethal-level Cu for 18 h, with the potential Cu/ROS-induced inhibition of aconitase limiting the synthesis and turnover of downstream TCA cycle intermediates under severe oxidative stress conditions.

4.2.2. Amino Acid Metabolism

Compositional alterations in the free amino acid (FAA) pool in Cu-exposed embryos were dependent on exposure duration and level of treatment. FAAs play diverse roles in marine organisms; they represent the pool from which new proteins can be synthesised during early development, and they serve as important fuels for energy acquisition in embryos and larvae [88,89]. The FAA pool is also the receiving depot for the catabolism of endogenous protein during embryogenesis in some bivalves [90], as well as the proteinaceous components of food once feeding competency has been attained. Total free essential amino acid contents can be used as a rough proxy for protein turnover [91], and these patterns likely reflect, in part, differential capacities and/or requirements for protein production through embryogenesis and between treatments and controls. Indeed, with major perturbations to most of the FAAs detected, aminoacyl-tRNA biosynthesis being identified as a significantly affected pathway was a likely outcome due to its pivotal role in delivering amino acids to ribosomes during protein synthesis.
FAAs also have diagnostic capabilities for early detection of various pathologies and can serve as biomarkers for a number of physiological states [92]. Particular amino acids may contribute towards antioxidant protection as small peptides (e.g., glutathione) [93,94], some act as signalling molecules or precursors for their synthesis (e.g., glutamate and tyrosine) [95,96], whereas others have important biochemical roles specific for the adaptation of aquatic organisms to flourish in marine environments. For example, marine osmoconformers such as bivalve molluscs utilise certain FAAs as organic osmolytes to balance intracellular osmolality with the external medium [97].

4.2.3. Osmoregulation

Free glycine, alanine, and β-alanine serve as organic osmolytes in bivalves, with sodium-dependent cotransport being responsible for their accumulation or release from tissues to maintain cell volume [97,98,99,100,101,102,103]. These osmolytes were differentially regulated in Cu-exposed embryos, compared to controls. Heavy metal toxicity appears to be strongly dependent on the abilities of some organisms to regulate intracellular osmolality. However, there are still many questions surrounding the osmoregulatory mechanistic basis for salinity-dependent Cu toxicity, especially for marine osmoconformers [102]. Nevertheless, exposure of marine bivalves to Cu and other metals induces compositional variations in FAAs with osmolytic function [103,104,105,106,107], and some new mechanistic advances have progressed our understanding of Cu-induced toxicity in these organisms. Although it has been suggested that Cu-toxicity in marine molluscs is more related to effects on acid-base equilibrium and ammonia excretion than imbalances in ion regulation, intracellular ion regulation plays a key mechanistic role [102].
Exposure of marine clam cells to Cu results in reductions of intracellular Na+, K+, and Cl concentrations, which are presumed to be associated with inhibition of Na+/K+-ATPase activity and competition by Cu for cell membrane ion transport systems, such as Na+ channels and the Na+/K+/2Cl cotransporter [108,109]. However, although haemolymph osmolality and levels of Na+ and K+ are not altered by Cu exposure in clams, Na+/K+-ATPase expression increases in gills and digestive glands [110,111]. This suggests that increased Na+/K+-ATPase expression may be a compensatory physiological response to ameliorate the metal-induced inhibition of enzyme activity. Additional Cu-induced changes on intracellular levels of divalent cations (Mg2+ and Ca2+) have also been observed in clams [111], and Ca2+ flux has been linked with organic osmolyte transport systems in mussels and clams [112,113]. Thus, it is becoming clearer that Cu is an ionoregulatory toxicant in marine bivalves, affecting ionic and volume control at the cellular level.

4.2.4. Neurotoxicity

Neurotoxicity may have been an important mechanistic feature contributing to deteriorating health in Cu-exposed embryos. We recently established that neurogenesis in P. canaliculus commences early on during development, with expressions of solitary FMRF-amidergic cells being identifiable via immunochemical labelling at the trochophore stage (18 hpf) [39]. By the early D-larval stage (42 hpf), immunoreactivity patterns within neural compartments are consistent with the initial formation of the cerebral ganglion, which quickly progresses to include the emergence of the peripheral system and mantle nerve within a couple of days. In the current study, levels of a number of amino acids associated with neurotransmission were found to be differentially affected. Pathway enrichment analysis also substantiated this with the detection of significant network alterations to glutamine and glutamate metabolism, as well as phenylalanine, tyrosine, and tryptophan metabolism.
Phenylalanine and tyrosine are precursors for the biosynthesis of L-DOPA and the catecholamine signalling messengers, dopamine and epinephrine. These amino acids and/or their neuroactive derivatives can modulate larval behaviour in different mussel species, including P. canaliculus [40,114,115]. Such metabolites also have the ability to regulate larval swimming activities and developmental timing of other molluscan taxa through their actions on ciliary beat frequencies of innervated velar tissues and morphogenetic programmes, respectively [116]. Phenylalanine and tyrosine are tightly coupled with the production of endogenous catecholamines in molluscs and are thought to regulate neuronal processes in developing embryos and larvae. For example, enhancement of tyrosine or L-DOPA concentrations in molluscan tissues leads to increased catecholamine synthesis [117,118,119], and inhibition of the catecholamine re-uptake system in oyster embryos leads to developmental retardation, a reduction in growth rate, and the formation of shell structure abnormalities in early D-stage larvae [120].
Neurotoxic effects of heavy metals on metabolite intermediates associated with catecholamine biosynthesis have been described in various model invertebrates. Exposure of nematodes (Caenorhabditis elegans) to sublethal lead levels reduces whole animal tissue concentrations of free phenylalanine and tyrosine and is suggested to contribute towards toxicity through deleterious neuronal consequences of atypically enhanced catecholamine production [121]. Short-term exposure of water fleas (Daphnia magna) to sublethal levels of metals (Cu, Li, and/or Cd) for 24–48 h also causes a reduction in phenylalanine content, increases tyrosine hydroxylase gene expression, and enhances production of L-DOPA and dopamine [122,123]. These coordinated precursor-product alterations are highly supportive of a mechanistic link, and the upregulation of this pathway may be a general response to metal stress [123].
Tryptophan is the precursor of serotonin, which plays an important role during early embryogenesis in molluscs [124,125,126,127]. Serotonin is involved in oocyte maturation, fertilisation, and cleavage divisions, and is associated with embryonic/larval sensory organs, the regulation of embryonic rotations, and controlling development rates and larval behaviours [127,128,129]. Studies on Cu-induced neurotoxicity via modulation of tryptophan metabolism and disruption of the serotonergic nervous system are currently lacking in molluscan models. However, mechanistic insights from fish studies, e.g., [130,131,132,133,134], may provide foundations for hypothesis generation.
Glutamine is the common precursor for the biosynthesis of glutamate and ƴ-aminobutyric acid (GABA). Glutamate is considered a major excitatory neurotransmitter, whereas GABA is a major inhibitory neurotransmitter across vertebrate and invertebrate taxa. However, in particular, molluscan neurons can act in both excitatory and inhibitory modes [135]. When applied exogenously to seawater, these metabolites modulate larval swimming and attachment behaviours in molluscs and induce fast synchronous metamorphosis in sea urchin larvae [116,136,137,138,139]. Glutamatergic neurons are also identifiable in the peripheral and central nervous systems of ascidian and molluscan larvae, with presumed functions in mechanical and sensory processes [140]. Together, these observations signify various neuroactive roles during early marine invertebrate development.
Glutamine and glutamate have been suggested as useful biomarkers of neurotoxicity in adult mussels exposed to heavy metal contamination [103,141]. Differential regulation of glutamine and glutamate metabolism as a neurotoxic response to Hg, Zn, and Cd has also been demonstrated in fish and clams [142,143,144], and Cd and/or Cu exposure influences glutamine synthetase mRNA expression and/or glutamate dehydrogenase activity in mussels and fish [145,146]. Excessive levels of Mn, Hg, and Pb trigger neurotoxicity through similar disruptions of the glutamine/glutamate-GABA cycle, which underlines a common mechanism of metal toxicity [147,148]. Wirbisky et al. [149] demonstrated that Pb exerts neurotoxicity in fish embryos by influencing the GABAergic system in a dose-responsive and temporally variable manner through embryogenesis. Our results indicate that glutamine and glutamate biosynthesis in mussel embryos are similarly perturbed by Cu exposure, which is consistent with the findings of these studies and further suggests that this system may also be a useful biomarker of metal-induced neurotoxicity in molluscan embryos.

4.2.5. Pyrimidine Catabolism

The pyrimidine nucleotides thymine and cytosine are catabolised in mussels to 3-aminoisobutyric acid (BAIBA) and β-alanine through their uracil derivatives, respectively [150]. Both degradation products were found to be higher in mussel embryos exposed to lethal-level Cu. Since β-alanine serves osmoregulatory functions in marine bivalves associated with Cu-induced toxicity and sodium-dependent co-transport, tissue concentrations are likely to reflect the net outcome of the interplay between these systems. BAIBA can also be used as an approximate indicator for the rate of DNA and tRNA turnover [151]. Increases in BAIBA have been found in different animal models exposed to lead and insecticides, with toxin-induced DNA/RNA damage thought to be responsible for the elevated levels observed [152,153,154,155]. The higher levels of pyrimidine degradation products measured in our study are indicative of shifts in nucleotide metabolism, with potential adverse implications for DNA/RNA production, protein synthesis, and organismal growth. Links between pyrimidine metabolism and oxidative stress have been implicated in a number of disease pathologies and metal toxicity responses [156,157,158,159,160,161,162].

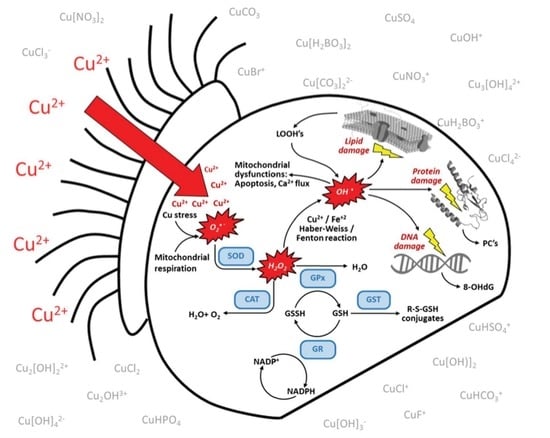
4.2.6. Oxidative Stress, Redox Homeostasis, and Metal Chelation

The generation of reactive oxygen species (ROS) and oxidative stress is one of the most well-known mechanisms of metal toxicity in aquatic organisms [163,164]. A number of metabolite signatures associated with oxidative stress responses and/or with roles in the maintenance of redox homeostasis or metal chelation were identified. These included increased levels of ROS, changes in aminomalonic acid levels, variation in histidine metabolism, alterations to the transsulfuration pathway, differential regulation of glutathione (GSH) metabolism, and the presence of lipid peroxidation by-products. The metabolite signatures of an oxidative stress response were further verified via targeted analyses of enzymes involved in ROS regulation and macromolecular oxidative damage to DNA, proteins, and lipids.
Aminomalonic acid (AMA) showed variable flux in embryos exposed to Cu. When protein-/peptide-bound, AMA has possible origins stemming from errors in protein synthesis and oxidative damage to amino acids [165]. The moiety is generated by free radical oxidation of proteins and can arise due to hydrogen atom abstraction from the α-position of glycine residues [166]. The dicarboxylic acid can also be derived from metal-induced cysteine oxidation via β-elimination of the sulphur residue [167]. Reductions in free AMA within rabbit hepatic tumours are suspected due to depletion of cysteine stemming from enhanced requirements for GSH to alleviate oxidative stress [168], and toxin-induced changes in the free metabolite have previously been recorded in water fleas exposed to polyaromatic hydrocarbons [169].
Free histidine can serve as a high affinity chelator of metals, and it has been suggested that elevation of histidine levels as a response to Cu toxicity may provide an energetically low-cost detoxification mechanism for invertebrates [170], as is the case for plants [171,172]. However, Bundy et al. [173] comprehensively tested the hypothesis that Cu exposure upregulates histidine metabolism in earthworms and found a weak negative correlation between levels of free histidine and Cu dose. Digilio et al. [174] conducted a metabolomics-based investigation of Cu toxicity in adult mussels and found a parallel trend of subtle histidine reductions in haemolymph samples with increasing doses of Cu. Exposure of mussel embryos to lethal-level Cu in the present study similarly caused histidine levels to decrease in mussel embryos. Incorporation of histidine into histidine-rich glycoprotein (HRG) may be acting as a detoxification strategy against excess metal concentrations. HRGs are important immunoresponsive macromolecules that are widely distributed across bivalve taxa and have very high capacities to bind and detoxify divalent metal ions such as Cu [175,176].
The transsulfuration pathway involves the conversion of methionine to cysteine, via cystathionine, and is strongly affected by metal exposure [177,178,179,180]. Cysteine and methionine metabolism were differentially regulated in mussel embryos exposed to Cu, with relative metabolite levels involved indicating depletion of methionine through enrichment in transsulfuration, and subsequent downstream metabolism of cysteine. Cysteine is an important structural component of glutathione (GSH), and the rate-limiting precursor in its biosynthesis [181]. When the demand for GSH is high due to generation of ROS, the transsulfuration pathway can act as a reserve pathway that channels methionine towards cysteine (through initial conversion to homocysteine, subsequent conjugation with serine to form cystathionine, and then final cleavage and transsulfuration of the carbon-sulphur bond) [182]. In its free form, cysteine’s thiol group gives it an effective capacity to chelate metal ions. However, when bound to redox-active metals, such as copper, free cysteine is quickly oxidised, and the reduced metal may undergo a Fenton-like reaction to form highly toxic hydroxyl radicals (˙HO); thus, keeping free cysteine levels low is necessary to protect against these harmful oxidants [183]. Conversely, as a residue within GSH, cysteine’s amino group is blocked via conjugation with glutamate, and thiol oxidation by transition metals is greatly diminished so as to prevent deleterious Fenton-like reactions from occurring, while simultaneously providing a tripeptide with strong antioxidant properties [183]. Jeppe et al. [179] reported that exposure of aquatic midge larvae to Cu resulted in differential expression patterns of transsulfuration genes, advocating that Cu induces an increased flux of cysteine into GSH synthesis, while, at the same time, diminishing pools of cystathionine. Our results appear to be consistent with these findings.
Lethal-level Cu treatment caused free methionine, cystathionine, and cysteine to decrease markedly in mussel embryos, which may have been a metabolic attempt to alleviate oxidative stress caused by the metal. Such responses could prevent Fenton reactions from occurring and also be indicative of an enhanced requirement for GSH production and antioxidant activity. It appears that Cu, Cd, and Zn may have quite diverse mechanisms of toxicity regarding their particular impacts on transsulfuration pathway components [179,180]. For example, Cu and Cd differentially modulate transsulfuration pathway metabolites, suggesting that different pathway components are being targeted by the toxins [179]. Although many transition metals share some mechanistic similarities in their toxic actions, it has been suggested that the transsulfuration pathway could be used as a specific diagnostic biomarker suite for detecting the identity of distinct metal stressors [180].
Pathway enrichment and topology analysis identified GSH metabolism as being differentially regulated after lethal-level Cu exposure. The network includes the metabolites cysteine, glycine, glutamic acid, GSH, ornithine, and generic collectively termed L-amino acids, all of which were detected by our methods. Copper exposure caused levels of GSH to fall, which was an expected response to Cu toxicity since metals increase GSH oxidation, resulting in a depletion of cellular GSH under high oxidative stress conditions [184]. GSH is an efficient antioxidant and provides protection against oxidative stress by conjugating with electrophiles and reducing ROS [184]. During this process, GSH is converted into its oxidised form (GSSG) via catalysis by GPx. GSH is also involved in the formation of GSH-S conjugates with ionic forms of Cu (forming linear II covalent complexes) and acts as an intracellular chelator to prevent the nucleophilic interaction of Cu with the main cellular structures [185,186]. Lower-level Cu exposures in mussel embryos caused transient responses in GSH pathway metabolites, which were indicative of variations between oxidative stress-induced GSH demand, biosynthesis, and oxidation. Under low-to-moderate oxidative stress conditions, GSH concentrations may be replenished through biosynthesis from precursor metabolites and/or through the NADPH-dependent reduction of GSSG [187,188]. Indeed, the maintenance of basal-level GSH flux during sublethal Cu treatments is indicative of a well-functioning GSH homeostatic control mechanism.
ROS homeostasis and GSH turnover are regulated by an elaborate system of enzymes, antioxidants, and pro-oxidants. Cu-induced toxicity responses of different biochemical components accountable for controlling redox balance in aquatic organisms can vary widely depending on the duration of Cu exposure, the Cu concentration, the type of tissue assessed, the cellular localisation of the biomarkers themselves, and also the particular enzyme isoform(s) being considered [189,190,191,192,193]. The response patterns of ROS and activity levels of enzymes involved in ROS regulation and GSH turnover provide clear complementary evidence that oxidative stress was occurring in Cu-exposed embryos. This was further verified by levels of oxidative damage to DNA, proteins, and lipids in developing embryos.

4.2.7. Lipid Metabolism

Prior to attaining feeding competency, lipids are the most important sources of energy during embryonic and larval development for many bivalve species [194,195,196]. When energy requirements are high, lipases hydrolyse triacylglycerols and release fatty acids (FAs). These free fatty acids (FFAs) are rapidly metabolised to acetate by β-oxidation in the mitochondria and ultimately enter the TCA cycle under optimal conditions to supply ATP for various essential cellular processes (anabolic reactions, active transport, cell division, motility, muscular contraction, etc.). Increased lipid catabolism, and/or enriched FA biosynthesis, and/or reduced FFA consumption can all lead to apparent rises in the total FFA pool, and vice versa.
Bivalve oocytes and embryos contain high levels of maternally derived FA desaturase mRNA for altering the degree of FA saturation during early development and can therefore perform certain fatty acid conversion tasks (e.g., C20:4[n-3] to C20:5[n-3]) [197,198]. However, they typically do not have appreciable levels of elongase activity prior to attaining feeding competency and are therefore unlikely to be able to generate fatty acids from acetyl-CoA subunits, or from smaller fatty acid precursors [199]. Thus, variations in levels of FFAs in the current study are more likely indicative of altered lipid metabolism than changes in de novo FFA biosynthesis.
With increases in FFA pools and greater demands for energy under enhanced oxidative stress conditions, it seems reasonable to suggest that lipid catabolism was being upregulated in certain Cu-treated groups. At the same time, reduced TCA cycle flux due to extreme Cu toxicity on enzyme activities may have simultaneously blocked FFA consumption, leading to extreme FFA accumulations, as was indicated under lethal-level Cu exposures by the relative levels of TCA cycle intermediates.

4.2.8. Immunotoxic Associations

FFA accumulations are associated with mechanisms of immunotoxicity. Increases in the FFA pool can induce oxidative stress through ROS generation and stimulate inflammation via upregulation of the redox-sensitive transcription factor Nuclear Factor-[kappa]B (NF-κB) [200,201,202]. These processes are not exclusive of one another. FFA-induced oxidative stress and harmful proinflammatory responses are inextricably linked via crosstalk between ROS and the NF-κB pathway. For example, while ROS have various inhibitory or stimulatory roles in NF-κB signalling, certain NF-κB-regulated genes serve major functions in mediating cellular ROS levels [203]. The NF-κB pathway is crucially involved in many biological processes, including innate immune responses in molluscs, inflammation, cell proliferation and differentiation, apoptosis, and embryonic morphogenesis [204,205,206,207,208,209,210]. In addition, it has been established that Cu-induced immunotoxicity involves activation of the NF-κB pathway via direct or indirect ROS-mediated effects on the transcription factor [211,212]. Thus, the large increases in the total FFA pool that were observed in moribund embryos exposed to lethal-level Cu both indicate and promote a high level of oxidative stress and inflammation. This consequence was not apparent from the metabolomics data after short-term (3 h) lethal-level exposure or significant at any time during sublethal treatments. This may suggest that the response occurs due to severe failures of the system only under high Cu dose conditions. Under sublethal conditions, FFA consumption and conversion through a less negatively impacted TCA cycle to deliver the required energy demands may have been responsible for circumnavigating the potentially damaging immunotoxic effects of excessive FFA accumulations.

4.2.9. Other Metabolic Responses

Malonic acid levels were enhanced by lethal-level Cu exposure. Elevated malonic acid was recently reported in shrimp and oysters from sites contaminated by industrial discharges with high concentrations of trace metals [213,214,215]. Malonic acid is a C3 dicarboxylic acid and is well-known for its regulatory role in cellular respiration by competing for the active site of succinate dehydrogenase/respiratory complex II (SDH/CII), which catalyses the oxidation of succinate to fumarate in the TCA cycle [216,217]. Enzyme inhibition would reduce the amount of fumarate being synthesised, which is in accordance with the diminished levels of fumarate that were detected in the Cu-exposed embryos. The induced mitochondrial dysfunction caused by SDH/CII inhibition can, in turn, trigger ROS production, which depletes GSH and NADPH, thus overwhelming mitochondrial antioxidant capacity and resulting in lipid peroxidation and mitochondrial swelling [218]. Malonic acid is also associated with osmotic adjustment and secondary neuronal excitotoxicity and can potentiate the release of cytochrome c to induce apoptosis [218,219].
The C5 dicarboxylic acid glutaric acid is an endogenous toxin also known to induce oxidative stress [220]. Lethal-level Cu caused levels of glutaric acid to increase in mussel embryos, whereas sublethal exposures did not. Although the mechanisms involved are not yet fully characterised, increased metabolite levels have been associated with decreased GSH concentrations, reduced GSH peroxidase activity, depressed total antioxidant reactivity, and increased lipid peroxidation and protein carbonylation [221,222]. Glutaric acid also plays roles in apoptotic pathways and can impair energy metabolism through inhibition of Na+/K+-ATPase and enzymes involved in oxidative phosphorylation [221,223].
2-Aminobutyric acid (2-ABA) has also been linked with mechanisms of oxidative stress [224]. Under cysteine deficiency caused by considerable oxidative stress and high GSH demand, the first enzyme (glutamate cysteine ligase) of the GSH biosynthetic pathway utilises 2-ABA instead of cysteine (due to its similar structure) and causes the production of ophthalmic acid instead of GSH [225,226]. Thus, reductions in 2-ABA provide additional evidence within the metabolomics data for severe dysregulation of the redox system under conditions of high Cu contamination. This effect was not observed after sub-lethal Cu exposures, with ROS homeostasis and GSH demand seemingly being maintained within certain acceptable boundaries.

4.3. Metabolomics as a Health Assessment Tool

The capacity of metabolomics to discriminate larval groups in this study was far more powerful than using routine visual assessment methods. The lowest sublethal-level copper exposure caused some (~10%) changes in D-larval swimming behaviour (i.e., slowed swimming and altered motion trajectories) towards the end of the trial, but did not impact the rate of embryonic development. Metabolomic analysis of these samples identified significant compositional changes in embryonic metabolite profiles after only 3 h of exposure, and similarly could discriminate treated embryos/larvae at every subsequent sampling point from non-treated controls. This highlights the sensitivity that metabolomics can offer to detect changes in metabolic processes days before organisms display any visually observable phenotypic traits of an altered health state. These findings also suggest that metabolomic approaches can be used for the early detection of poor larval health and have potential capacities for prognosis and diagnosis.
Within the context of molluscan aquaculture, there is positive scope for the application of metabolomics to monitor larval health during hatchery culture. The causes of poor larval health and incidences of mass mortality within hatcheries are often undefined; being able to identify the precise timing of physiological ‘tipping points’ could inform a re-evaluation of husbandry practices. Metabolite profiling is also clearly useful for characterising mechanisms of toxicity and could be incorporated into ecotoxicological test methods to provide information earlier than traditional biological endpoints, such as ‘% D-larval yield’ and mortality. With further development and biomarker validation, metabolomic approaches could provide additional measures of toxicity, enhance test sensitivity, and reduce test duration.

5. Conclusions

Simultaneous profiling of metabolites, enzymatic biomarkers associated with the maintenance of ROS homeostasis, and non-enzymatic biomarkers associated with the oxidative damage to key cellular components clearly demonstrated the occurrence of oxidative stress in mussel embryos as a response to Cu. Untargeted and targeted analytical strategies can be used effectively to gain highly complementary information. Metabolomic analysis was more sensitive at discriminating copper-exposed embryos/larvae from non-exposed organisms compared to analysis of oxidative stress biomarkers since the lowest Cu dose altered the embryonic metabolome but not the ROS regulatory system. This indicates that metabolic processes can be affected by Cu as a first consequence in the absence of an oxidative stress mechanism. Furthermore, it appears that metabolic regulation of low-level Cu toxicity can be achieved effectively without significant inputs from the primary redox balance system. Metabolomics is a useful approach to characterising oxidative stress and revealing additional insights into mechanisms associated with metabolic dysfunctions that underpin poor embryonic/larval health in marine invertebrates.

Author Contributions

Study design: T.Y. and S.L.G.; Experimentation, sampling, and in situ observations and measurements: T.Y., S.L.G., N.L.C.R. and D.V.L.; Biochemical analyses: T.Y., S.L.G. and D.J.B.; Inorganic chemical analyses and metal speciation modelling: S.G.S. and B.B.; Logistical support, technical advice, and resources: A.C.A., S.G.V.-B., S.G.S. and N.L.C.R.; Data analyses and manuscript draft writing: T.Y. All authors provided significant contributions to this research and commented on previous versions of the manuscript. All authors have read and agreed to the published version of the manuscript.

Funding

This work was funded by the New Zealand government Ministry of Business, Innovation and Employment Shellfish Aquaculture Platform, hosted by the Cawthron Institute (Strategic Science Investment Fund contract CAWX1801).

Institutional Review Board Statement

Not applicable.

Informed Consent Statement

Not applicable.

Data Availability Statement

The datasets generated during the current study are not publicly available due to commercial sensitivity but are available from the corresponding author on reasonable request.

Acknowledgments

The authors are thankful for the technical assistance provided by Erica Zarate (University of Auckland), Jolene Berry (Cawthron Institute), and Ellie Watts (Cawthron Institute). We also acknowledge and appreciate the support from an Auckland University of Technology Scholarship awarded to Tim Young under the supervision of Andrea C. Alfaro, and the University of Otago for the Scholarship awarded to Billy Benedict under the supervision of Sylvia G. Sander.

Conflicts of Interest

The authors declare no conflict of interest.

References

  1. Uriu-Adams, J.Y.; Keen, C.L. Copper, oxidative stress, and human health. Mol. Asp. Med. 2005, 26, 268–298. [Google Scholar]
  2. Lee, J.; Prohaska, J.R.; Thiele, D.J. Essential role for mammalian copper transporter Ctr1 in copper homeostasis and embryonic development. Proc. Natl. Acad. Sci. USA 2001, 98, 6842–6847. [Google Scholar]
  3. Madsen, E.; Gitlin, J.D. Copper deficiency. Curr. Opin. Gastroenterol. 2007, 23, 187–192. [Google Scholar] [PubMed]
  4. Horn, D.; Barrientos, A. Mitochondrial copper metabolism and delivery to cytochrome c oxidase. IUBMB Life 2008, 60, 421–429. [Google Scholar] [PubMed] [Green Version]
  5. Nose, Y.; Rees, E.M.; Thiele, D.J. Structure of the Ctr1 copper trans ‘PORE’ter reveals novel architecture. Trends Biochem. Sci. 2006, 31, 604–607. [Google Scholar]
  6. Klotz, L.O.; Kröncke, K.D.; Buchczyk, D.P.; Sies, H. Role of copper, zinc, selenium and tellurium in the cellular defense against oxidative and nitrosative stress. J. Nutr. 2003, 133, 1448S–1451S. [Google Scholar]
  7. Scheiber, I.F.; Mercer, J.F.; Dringen, R. Metabolism and functions of copper in brain. Prog. Neurobiol. 2014, 116, 33–57. [Google Scholar]
  8. Harrison, M.D.; Jones, C.E.; Solioz, M.; Dameron, C.T. Intracellular copper routing: The role of copper chaperones. Trends Biochem. Sci. 2000, 25, 29–32. [Google Scholar] [CrossRef]
  9. Dennery, P.A. Effects of oxidative stress on embryonic development. Birth Defects Res. Part C Embryo Today Rev. 2007, 81, 155–162. [Google Scholar]
  10. Temple, M.D.; Perrone, G.G.; Dawes, I.W. Complex cellular responses to reactive oxygen species. Trends Cell Biol. 2005, 15, 319–326. [Google Scholar]
  11. Puig, S.; Thiele, D.J. Molecular mechanisms of copper uptake and distribution. Curr. Opin. Chem. Biol. 2002, 6, 171–180. [Google Scholar]
  12. Kim, B.E.; Nevitt, T.; Thiele, D.J. Mechanisms for copper acquisition, distribution and regulation. Nat. Chem. Biol. 2008, 4, 176–185. [Google Scholar]
  13. Rubino, J.T.; Franz, K.J. Coordination chemistry of copper proteins: How nature handles a toxic cargo for essential function. J. Inorg. Biochem. 2012, 107, 129–143. [Google Scholar] [PubMed]
  14. Schöne, B.R.; Krause, R.A. Retrospective environmental biomonitoring–Mussel Watch expanded. Glob. Planet. Chang. 2016, 144, 228–251. [Google Scholar]
  15. Farrington, J.W.; Tripp, B.W.; Tanabe, S.; Subramanian, A.; Sericano, J.L.; Wade, T.L.; Knap, A.H.; Edward, D. Goldberg’s proposal of “the mussel watch”: Reflections after 40 years. Mar. Pollut. Bull. 2016, 110, 501–510. [Google Scholar] [PubMed]
  16. Arnold, W.; Cotsifas, J.S.; Ogle, R.S.; DePalma, S.G.; Smith, D.S. A comparison of the copper sensitivity of six invertebrate species in ambient salt water of varying dissolved organic matter concentrations. Environ. Toxicol. Chem. 2010, 29, 311–319. [Google Scholar]
  17. Funes, V.; Alhama, J.; Navas, J.I.; López-Barea, J.; Peinado, J. Ecotoxicological effects of metal pollution in two mollusc species from the Spanish South Atlantic littoral. Environ. Pollut. 2006, 139, 214–223. [Google Scholar]
  18. Neff, J.M. Copper in seawater. In Bioaccumulation in Marine Organisms: Effect of Contaminants from Oil Well Produced Water; Neff, J.M., Ed.; Elsevier: Amsterdam, The Netherlands, 2002; pp. 145–160. [Google Scholar]
  19. Gadd, J.; Cameron, M. Antifouling Biocides in Marinas: Measurement of Copper Concentrations and Comparison to Model Predictions for Eight Auckland Sites; Auckland Council Technical Report TR2012/033; NIWA for Auckland Council: Auckland, New Zealand, 2012. [Google Scholar]
  20. Jahan, S.; Strezov, V. Water quality assessment of Australian ports using water quality evaluation indices. PLoS ONE 2017, 12, e0189284. [Google Scholar]
  21. ANZECC; ARMCANZ. Australian Guidelines for Water Quality Monitoring and Reporting; National Water Quality Management Strategy Paper No 7; Australian and New Zealand Environment and Conservation Council (ANZECC) & Agriculture and Resource Management Council of Australia and New Zealand (ARMCANZ): Canberra, Australia, 2000.
  22. Martin, M.; Osborn, K.E.; Billig, P.; Glickstein, N. Toxicities of ten metals to Crassostrea gigas and Mytilus edulis embryos and Cancer magister larvae. Mar. Pollut. Bull. 1981, 12, 305–308. [Google Scholar]
  23. Rosen, G.; Rivera-Duarte, I.; Kear-Padilla, L.; Chadwick, D.B. Use of laboratory toxicity tests with bivalve and echinoderm embryos to evaluate the bioavailability of copper in San Diego Bay, California, USA. Environ. Toxicol. Chem. 2005, 24, 415–422. [Google Scholar] [CrossRef] [Green Version]
  24. Nadella, S.R.; Fitzpatrick, J.L.; Franklin, N.; Bucking, C.; Smith, S.; Wood, C.M. Toxicity of dissolved Cu, Zn, Ni and Cd to developing embryos of the blue mussel (Mytilus trossolus) and the protective effect of dissolved organic carbon. Comp. Biochem. Physiol. Part C Toxicol. Pharmacol. 2009, 149, 340–348. [Google Scholar] [CrossRef] [PubMed]
  25. Bosse, C.; Rosen, G.; Colvin, M.; Earley, P.; Santore, R.; Rivera-Duarte, I. Copper bioavailability and toxicity to Mytilus galloprovincialis in Shelter Island Yacht Basin, San Diego, CA. Mar. Pollut. Bull. 2014, 85, 225–234. [Google Scholar] [CrossRef] [PubMed]
  26. Worboys, M.A.; Leung, K.M.Y.; Grist, E.P.M.; Crane, M. Time should be considered in developmental ecotoxicity test. Mar. Pollut. Bull. 2002, 45, 92–99. [Google Scholar] [CrossRef] [PubMed]
  27. King, C.K.; Riddle, M.J. Effects of metal contaminants on the development of the common Antarctic sea urchin Sterechinus neumayeri and comparisons of sensitivity with tropical and temperate echinoids. Mar. Ecol. Prog. Ser. 2001, 215, 143–154. [Google Scholar] [CrossRef]
  28. Beca Infrastructure. Auckland Recreational Boating Study; Beca Infrastructure Ltd. (Beca) for Auckland Council: Auckland, New Zealand, 2012. [Google Scholar]
  29. Gadd, J.; Depree, C.; Hickey, C. Relevance to New Zealand of the OECD Emission Scenario Document for Antifouling Paints: Phase 2 Report; Report for the Environmental Protection Authority (EPA); National Institute of Water and Atmospheric Research Ltd.: Hamilton, New Zealand, 2011. [Google Scholar]
  30. Smith, P.J. Selective decline in imposex levels in the dogwhelk Lepsiella scobina following a ban on the use of TBT antifoulants in New Zealand. Mar. Pollut. Bull. 1996, 32, 362–365. [Google Scholar] [CrossRef]
  31. Symonds, J.E.; Clarke, S.M.; King, N.; Walker, S.P.; Blanchard, B.; Sutherland, D.; Roberts, R.; Preece, M.A.; Tate, M.; Buxton, P.; et al. Developing successful breeding programs for New Zealand aquaculture: A perspective on progress and future genomic opportunities. Front. Genet. 2019, 10, 27. [Google Scholar] [CrossRef] [Green Version]
  32. Bradley, N. SPATnz End of Programme Review Primary Growth Partnership: SPATnz Programme Evaluation Report; Report prepared for Ministry for Primary Industries; Maven Consulting Ltd.: North Vancouver, BC, Canada, 2020. [Google Scholar]
  33. Chandurvelan, R.; Marsden, I.D.; Gaw, S.; Glover, C.N. Impairment of green-lipped mussel (Perna canaliculus) physiology by waterborne cadmium: Relationship to tissue bioaccumulation and effect of exposure duration. Aquat. Toxicol. 2012, 124, 114–124. [Google Scholar] [CrossRef]
  34. Deruytter, D.; Vandegehuchte, M.B.; Garrevoet, J.; De Laender, F.; Vergucht, E.; Delbeke, K.; Blust, R.; De Schamphelaere, K.A.; Vincze, L.; Janssen, C.R. Salinity and dissolved organic carbon both affect copper toxicity in mussel larvae: Copper speciation or competition cannot explain everything. Environ. Toxicol. Chem. 2015, 34, 1330–1336. [Google Scholar] [CrossRef]
  35. McDougall, D.R.; Chan, A.; McGillivray, D.J.; de Jonge, M.D.; Miskelly, G.M.; Jeffs, A.G. Examining the role of ethylenediaminetetraacetic acid (EDTA) in larval shellfish production in seawater contaminated with heavy metals. Aquat. Toxicol. 2019, 217, 105330. [Google Scholar] [CrossRef]
  36. Gale, S.L.; Burritt, D.J.; Adams, S.L. The role of ethylenediaminetetraacetic acid in green-lipped mussel (Perna canaliculus) embryo development: A biochemical and morphological characterization. Aquaculture 2016, 463, 22–27. [Google Scholar] [CrossRef]
  37. McDougall, D.R.; Kihara, S.; Reinhardt, J.; Miskelly, G.M.; McGillivray, D.J.; Jeffs, A.G. Biodegradable chelating agent improves the survival of early larvae for shellfish aquaculture. Aquat. Toxicol. 2020, 228, 105645. [Google Scholar] [CrossRef] [PubMed]
  38. Ragg, N.L.; Gale, S.L.; Le, D.V.; Hawes, N.A.; Burritt, D.J.; Young, T.; Ericson, J.A.; Hilton, Z.; Watts, E.; Berry, J.; et al. The Effects of aragonite saturation state on hatchery-reared larvae of the Greenshell mussel Perna canaliculus. J. Shellfish Res. 2019, 38, 779–793. [Google Scholar] [CrossRef]
  39. Rusk, A.B.; Alfaro, A.C.; Young, T.; Watts, E.; Adams, S.L. Investigation of early mussel (Perna canaliculus) development using histology, SEM imaging, immunochemistry and confocal microscopy. Mar. Biol. Res. 2017, 13, 314–329. [Google Scholar] [CrossRef]
  40. Young, T.; Alfaro, A.C.; Sánchez-Lazo, C.; Robertson, J. Putative involvement of adrenergic receptors in regulation of mussel (Perna canaliculus) larval settlement. Mar. Biol. Res. 2015, 11, 655–665. [Google Scholar] [CrossRef] [Green Version]
  41. Howard, D.W.; Smith, C.S. Histological Techniques for Marine Bivalve Mollusks; NOAA Technical Memorandum NMFS-F/NEC-25; National Oceanic and Atmospheric Administration: Woods Hole, MA, USA, 1983.
  42. Zitoun, R.; Clearwater, S.J.; Hassler, C.; Thompson, K.J.; Albert, A.; Sander, S.G. Copper toxicity to blue mussel embryos (Mytilus galloprovincialis): The effect of natural dissolved organic matter on copper toxicity in estuarine waters. Sci. Total Environ. 2019, 653, 300–314. [Google Scholar] [CrossRef]
  43. Stewart, M.; Cameron, M.; McMurtry, M.; Sander, S.G.; Benedict, B.; Graham, L.; Hosie, M.; Green, T. Development of passive sampling devices for bioavailable contaminants of current and emerging concern: Waitemata Harbour case study. N. Z. J. Mar. Freshw. Res. 2016, 50, 526–548. [Google Scholar] [CrossRef]
  44. Gustafsson, J.P. Visual MINTEQ Ver. 3.0; Based on de Allison JD, Brown DS, Novo-Gradac KJ, MINTEQA2 ver, 4.; KTH Department of Land and Water Resources Engineering: Stockholm, Sweden, 2011. [Google Scholar]
  45. Sander, S.G.; Buck, K.N.; Wells, M. The effect of natural organic ligands on trace metal speciation in San Francisco Bay: Implications for water quality criteria. Mar. Chem. 2015, 173, 269–281. [Google Scholar] [CrossRef]
  46. Villas-Bôas, S.G.; Smart, K.F.; Sivakumaran, S.; Lane, G.A. Alkylation or silylation for analysis of amino and non-amino organic acids by GC-MS? Metabolites 2011, 1, 3–20. [Google Scholar] [CrossRef] [Green Version]
  47. Smart, K.F.; Aggio, R.B.; Van Houtte, J.R.; Villas-Bôas, S.G. Analytical platform for metabolome analysis of microbial cells using MCF derivatization followed by gas chromatography-mass spectrometry. Nat. Protoc. 2010, 5, 1709–1729. [Google Scholar] [CrossRef]
  48. Aggio, R.; Villas-Bôas, S.G.; Ruggiero, K. Metab: An R package for high-throughput analysis of metabolomics data generated by GC-MS. Bioinformatics 2011, 27, 2316–2318. [Google Scholar] [CrossRef] [Green Version]
  49. Xia, J.; Mandal, R.; Sinelnikov, I.V.; Broadhurst, D.; Wishart, D.S. MetaboAnalyst 3.0—Making metabolomics more meaningful. Nucleic Acids Res. 2015, 43, W251–W257. [Google Scholar] [CrossRef] [PubMed] [Green Version]
  50. Young, T.; Kesarcodi-Watson, A.; Alfaro, A.C.; Merien, F.; Nguyen, T.V.; Mae, H.; Le, D.V.; Villas-Bôas, S. Differential expression of novel metabolic and immunological biomarkers in oysters challenged with a virulent strain of OsHV-1. Dev. Comp. Immunol. 2017, 73, 229–245. [Google Scholar] [CrossRef] [PubMed] [Green Version]
  51. Wei, R.; Wang, J.; Su, M.; Jia, E.; Chen, S.; Chen, T.; Ni, Y. Missing value imputation approach for mass spectrometry-based metabolomics data. Sci. Rep. 2018, 8, 663. [Google Scholar] [CrossRef] [PubMed] [Green Version]
  52. Caraux, G.; Pinloche, S. PermutMatrix: A graphical environment to arrange gene expression profiles in optimal linear order. Bioinformatics 2005, 21, 1280–1281. [Google Scholar] [CrossRef] [Green Version]
  53. Fryer, H.J.; Davis, G.E.; Manthorpe, M.; Varon, S. Lowry protein assay using an automatic microtiter plate spectrophotometer. Anal. Biochem. 1986, 153, 262–266. [Google Scholar] [CrossRef]
  54. Reznick, A.Z.; Packer, L. Oxidative damage to proteins: Spectrophotometric method for carbonyl assay. Methods Enzymol. 1994, 233, 357–363. [Google Scholar]
  55. Mihaljević, B.; Katušin-Ražem, B.; Ražem, D. The reevaluation of the ferric thiocyanate assay for lipid hydroperoxides with special considerations of the mechanistic aspects of the response. Free Radic. Biol. Med. 1996, 21, 53–63. [Google Scholar] [CrossRef]
  56. Banowetz, G.M.; Dierksen, K.P.; Azevedo, M.D.; Stout, R. Microplate quantification of plant leaf superoxide dismutases. Anal. Biochem. 2004, 332, 314–320. [Google Scholar] [CrossRef]
  57. Janssens, B.J.; Childress, J.J.; Baguet, F.; Rees, J.F. Reduced enzymatic antioxidative defense in deep-sea fish. J. Exp. Biol. 2000, 203, 3717–3725. [Google Scholar] [CrossRef]
  58. Paglia, D.E.; Valentine, W.N. Studies on the quantitative and qualitative characterization of erythrocyte glutathione peroxidase. J. Lab. Clin. Med. 1967, 70, 158–169. [Google Scholar]
  59. Cribb, A.E.; Leeder, J.S.; Spielberg, S.P. Use of a microplate reader in an assay of glutathione reductase using 5,5′-dithiobis (2-nitrobenzoic acid). Anal. Biochem. 1989, 183, 195–196. [Google Scholar] [CrossRef] [PubMed]
  60. Habig, W.H.; Pabst, M.J.; Jakoby, W.B. Glutathione S-transferases the first enzymatic step in mercapturic acid formation. J. Biol. Chem. 1974, 249, 7130–7139. [Google Scholar] [CrossRef] [PubMed]
  61. Kogut, M.B.; Voelker, B.M. Strong copper-binding behavior of terrestrial humic substances in seawater. Environ. Sci. Technol. 2001, 35, 1149–1156. [Google Scholar] [CrossRef] [PubMed]
  62. Lorenzo, J.I.; Beiras, R.; Mubiana, V.K.; Blust, R. Copper uptake by Mytilus edulis in the presence of humic acids. Environ. Toxicol. Chem. 2005, 24, 973–980. [Google Scholar] [CrossRef] [PubMed] [Green Version]
  63. Helm, M.M.; Bourne, N.; Lovatelli, A. Hatchery Culture of Bivalves: A Practical Manual; FOA Fisheries Technical Paper; Food and Agriculture Organization of the United Nations: Rome, Italy, 2004. [Google Scholar]
  64. Hasegawa, H.; Lind, E.J.; Boin, M.A.; Häse, C.C. The extracellular metalloprotease of Vibrio tubiashii is a major virulence factor for pacific oyster (Crassostrea gigas) larvae. Appl. Environ. Microbiol. 2008, 74, 4101–4110. [Google Scholar] [CrossRef] [Green Version]
  65. Hasegawa, H.; Häse, C.C. The extracellular metalloprotease of Vibrio tubiashii directly inhibits its extracellular haemolysin. Microbiology 2009, 155, 2296–2305. [Google Scholar] [CrossRef]
  66. Mersni-Achour, R.; Cheikh, Y.B.; Pichereau, V.; Doghri, I.; Etien, C.; Degremont, L.; Saulnier, D.; Fruitier-Arnaudin, I.; Travers, M.-A. Factors other than metalloprotease are required for full virulence of French Vibrio tubiashii isolates in oyster larvae. Microbiology 2015, 161, 997–1007. [Google Scholar] [CrossRef]
  67. Wang, W.; Lv, X.; Liu, Z.; Song, X.; Yi, Q.; Wang, L.; Song, L. The sensing pattern and antitoxic response of Crassostrea gigas against extracellular products of Vibrio splendidus. Dev. Comp. Immunol. 2020, 102, 103467. [Google Scholar] [CrossRef]
  68. Sweetlove, L.J.; Beard, K.F.; Nunes-Nesi, A.; Fernie, A.R.; Ratcliffe, R.G. Not just a circle: Flux modes in the plant TCA cycle. Trends Plant Sci. 2010, 15, 462–470. [Google Scholar] [CrossRef]
  69. Cheng, T.; Sudderth, J.; Yang, C.; Mullen, A.R.; Jin, E.S.; Matés, J.M.; DeBerardinis, R.J. Pyruvate carboxylase is required for glutamine-independent growth of tumor cells. Proc. Natl. Acad. Sci. USA 2011, 108, 8674–8679. [Google Scholar] [CrossRef]
  70. Chan, E.C.Y.; Koh, P.K.; Mal, M.; Cheah, P.Y.; Eu, K.W.; Backshall, A.; Cavill, R.; Nicholson, J.K.; Keun, H.C. Metabolic profiling of human colorectal cancer using high-resolution magic angle spinning nuclear magnetic resonance (HR-MAS NMR) spectroscopy and gas chromatography mass spectrometry (GC/MS). J. Proteome Res. 2009, 8, 352–361. [Google Scholar] [CrossRef] [PubMed]
  71. Aggio, R.B.; Ruggiero, K.; Villas-Bôas, S.G. Pathway Activity Profiling (PAPi): From the metabolite profile to the metabolic pathway activity. Bioinformatics 2010, 26, 2969–2976. [Google Scholar] [CrossRef] [PubMed] [Green Version]
  72. Morita, M.; Gravel, S.P.; Chénard, V.; Sikström, K.; Zheng, L.; Alain, T.; Gandin, V.; Avizonis, D.; Arguello, M.; Zakaria, C.; et al. mTORC1 controls mitochondrial activity and biogenesis through 4E-BP-dependent translational regulation. Cell Metab. 2013, 18, 698–711. [Google Scholar] [CrossRef] [PubMed] [Green Version]
  73. Romanowska, E.; Igamberdiev, A.U.; Parys, E.; Gardeström, P. Stimulation of respiration by Pb2+ in detached leaves and mitochondria of C3 and C4 plants. Physiol. Plant. 2002, 116, 148–154. [Google Scholar] [CrossRef]
  74. Vosloo, A.; van Aardt, W.J.; Mienie, L.J. Sublethal effects of copper on the freshwater crab Potamonautes warreni. Comp. Biochem. Physiol. Part A Mol. Integr. Physiol. 2002, 133, 695–702. [Google Scholar] [CrossRef] [PubMed]
  75. Handy, R.D. Chronic effects of copper exposure versus endocrine toxicity: Two sides of the same toxicological process? Comp. Biochem. Physiol. Part A Mol. Integr. Physiol. 2003, 135, 25–38. [Google Scholar] [CrossRef]
  76. Muyssen, B.T.; de Schamphelaere, K.A.; Janssen, C.R. Mechanisms of chronic waterborne Zn toxicity in Daphnia magna. Aquat. Toxicol. 2006, 77, 393–401. [Google Scholar] [CrossRef]
  77. Cheng, Z.; Tsuda, M.; Kishita, Y.; Sato, Y.; Aigaki, T. Impaired energy metabolism in a Drosophila model of mitochondrial aconitase deficiency. Biochem. Biophys. Res. Commun. 2013, 433, 145–150. [Google Scholar] [CrossRef]
  78. Tretter, L.; Adam-Vizi, V. Inhibition of Krebs cycle enzymes by hydrogen peroxide: A key role of α-ketoglutarate dehydrogenase in limiting NADH production under oxidative stress. J. Neurosci. 2000, 20, 8972–8979. [Google Scholar] [CrossRef] [Green Version]
  79. Bota, D.A.; Davies, K.J. Lon protease preferentially degrades oxidized mitochondrial aconitase by an ATP-stimulated mechanism. Nat. Cell Biol. 2002, 4, 674–680. [Google Scholar] [CrossRef]
  80. Talbot, D.A.; Brand, M.D. Uncoupling protein 3 protects aconitase against inactivation in isolated skeletal muscle mitochondria. Biochim. Biophys. Acta Bioenerg. 2005, 1709, 150–156. [Google Scholar] [CrossRef] [PubMed] [Green Version]
  81. Cherkasov, A.A.; Overton, R.A.; Sokolov, E.P.; Sokolova, I.M. Temperature-dependent effects of cadmium and purine nucleotides on mitochondrial aconitase from a marine ectotherm, Crassostrea virginica: A role of temperature in oxidative stress and allosteric enzyme regulation. J. Exp. Biol. 2007, 210, 46–55. [Google Scholar] [CrossRef] [PubMed] [Green Version]
  82. Lushchak, O.V.; Piroddi, M.; Galli, F.; Lushchak, V.I. Aconitase post-translational modification as a key in linkage between Krebs cycle, iron homeostasis, redox signaling, and metabolism of reactive oxygen species. Redox Rep. 2014, 19, 8–15. [Google Scholar] [CrossRef] [PubMed] [Green Version]
  83. Winterbourn, C.C. Toxicity of iron and hydrogen peroxide: The Fenton reaction. Toxicol. Lett. 1995, 82, 969–974. [Google Scholar] [CrossRef]
  84. Murakami, K.; Yoshino, M. Inactivation of aconitase in yeast exposed to oxidative stress. IUBMB Life 1997, 41, 481–486. [Google Scholar] [CrossRef]
  85. Kehrer, J.P. The Haber–Weiss reaction and mechanisms of toxicity. Toxicology 2000, 149, 43–50. [Google Scholar] [CrossRef]
  86. Cantu, D.; Schaack, J.; Patel, M. Oxidative inactivation of mitochondrial aconitase results in iron and H2O2-mediated neurotoxicity in rat primary mesencephalic cultures. PLoS ONE 2009, 4, e7095. [Google Scholar] [CrossRef] [Green Version]
  87. Rose, S.; Melnyk, S.; Pavliv, O.; Bai, S.; Nick, T.G.; Frye, R.E.; James, S.J. Evidence of oxidative damage and inflammation associated with low glutathione redox status in the autism brain. Transl. Psychiatry 2012, 2, e134. [Google Scholar] [CrossRef] [Green Version]
  88. Rønnestad, I.; Fyhn, H.J. Metabolic aspects of free amino acids in developing marine fish eggs and larvae. Rev. Fish. Sci. 1993, 1, 239–259. [Google Scholar] [CrossRef]
  89. Rønnestad, I.; Tonheim, S.K.; Fyhn, H.J.; Rojas-Garcı, C.R.; Kamisaka, Y.; Koven, W.; Finn, R.; Terjesen, B.; Barr, Y.; Conceição, L. The supply of amino acids during early feeding stages of marine fish larvae: A review of recent findings. Aquaculture 2003, 227, 147–164. [Google Scholar] [CrossRef]
  90. Da Costa, F.; Nóvoa, S.; Ojea, J.; Martínez-Patiño, D. Changes in biochemical and fatty acid composition of the razor clam Solen marginatus (Solenidae: Bivalvia) during larval development. Mar. Biol. 2011, 158, 1829–1840. [Google Scholar] [CrossRef]
  91. Waterlow, J. Protein Turnover; CABI Publishing: Wallingford, UK, 2006. [Google Scholar]
  92. Combs, G.F.; Trumbo, P.R.; McKinley, M.C.; Milner, J.; Studenski, S.; Kimura, T.; Watkins, S.M.; Raiten, D.J. Biomarkers in nutrition: New frontiers in research and application. Ann. N. Y. Acad. Sci. 2013, 1278, 1–10. [Google Scholar] [CrossRef]
  93. Wu, H.C.; Chen, H.M.; Shiau, C.Y. Free amino acids and peptides as related to antioxidant properties in protein hydrolysates of mackerel (Scomber austriasicus). Food Res. Int. 2003, 36, 949–957. [Google Scholar] [CrossRef]
  94. Elias, R.J.; Kellerby, S.S.; Decker, E.A. Antioxidant activity of proteins and peptides. Crit. Rev. Food Sci. Nutr. 2008, 48, 430–441. [Google Scholar] [CrossRef]
  95. Hyde, R.; Taylor, P.M.; Hundal, H.S. Amino acid transporters: Roles in amino acid sensing and signalling in animal cells. Biochem. J. 2003, 373, 1–18. [Google Scholar] [CrossRef] [PubMed] [Green Version]
  96. Meijer, A.J.; Dubbelhuis, P.F. Amino acid signalling and the integration of metabolism. Biochem. Biophys. Res. Commun. 2004, 313, 397–403. [Google Scholar] [CrossRef] [PubMed]
  97. Kube, S.; Gerber, A.; Jansen, J.M.; Schiedek, D. Patterns of organic osmolytes in two marine bivalves, Macoma balthica, and Mytilus spp.; along their European distribution. Mar. Biol. 2006, 149, 1387–1396. [Google Scholar] [CrossRef]
  98. Powell, E.N.; Kasschau, M.; Chen, E.; Koenig, M.; Pecon, J. Changes in the free amino acid pool during environmental stress in the gill tissue of the oyster, Crassostrea virginica. Comp. Biochem. Physiol. Part A Physiol. 1982, 71, 591–598. [Google Scholar] [CrossRef]
  99. Sansone, G.; Cotugno, M.; Cosma, I.; Zatta, P. The effect of β-alanine on the concentration of taurine and other free amino acids during osmotic stress of Mytilus galloprovincialis. J. Mar. Biol. Assoc. U. K. 1987, 67, 111–117. [Google Scholar] [CrossRef]
  100. Hosoi, M.; Kubota, S.; Toyohara, M.; Toyohara, H.; Hayashi, I. Effect of salinity change on free amino acid content in Pacific oyster. Fish. Sci. 2003, 69, 395–400. [Google Scholar] [CrossRef]
  101. Preston, R.L. Transport of amino acids by marine invertebrates. J. Exp. Zool. 1993, 265, 410–421. [Google Scholar] [CrossRef]
  102. Grosell, M.; Blanchard, J.; Brix, K.V.; Gerdes, R. Physiology is pivotal for interactions between salinity and acute copper toxicity to fish and invertebrates. Aquat. Toxicol. 2007, 84, 162–172. [Google Scholar] [CrossRef] [PubMed]
  103. Wu, H.; Wang, W.X. NMR-based metabolomic studies on the toxicological effects of cadmium and copper on green mussels Perna viridis. Aquat. Toxicol. 2010, 100, 339–345. [Google Scholar] [CrossRef] [PubMed]
  104. Zhang, L.; Liu, X.; You, L.; Zhou, D.; Wu, H.; Li, L.; Zhao, J.; Feng, J.; Yu, J. Metabolic responses in gills of Manila clam Ruditapes philippinarum exposed to copper using NMR-based metabolomics. Mar. Environ. Res. 2011, 72, 33–39. [Google Scholar] [CrossRef] [PubMed]
  105. Kwon, Y.K.; Jung, Y.S.; Park, J.C.; Seo, J.; Choi, M.S.; Hwang, G.S. Characterizing the effect of heavy metal contamination on marine mussels using metabolomics. Mar. Pollut. Bull. 2012, 64, 1874–1879. [Google Scholar] [CrossRef]
  106. Ji, C.; Wang, Q.; Wu, H.; Tan, Q.; Wang, W.-X. A metabolomic investigation of the effects of metal pollution in oysters Crassostrea hongkongensis. Mar. Pollut. Bull. 2015, 90, 317–322. [Google Scholar] [CrossRef]
  107. Ji, C.; Cao, L.; Li, F. Toxicological evaluation of two pedigrees of clam Ruditapes philippinarum as bioindicators of heavy metal contaminants using metabolomics. Environ. Toxicol. Pharmacol. 2015, 39, 545–554. [Google Scholar] [CrossRef]
  108. Lopes, T.M.; Barcarolli, I.F.; de Oliveira, C.B.; de Souza, M.M.; Bianchini, A. Effect of copper on ion content in isolated mantle cells of the marine clam Mesodesma mactroides. Environ. Toxicol. Chem. 2011, 30, 1582–1585. [Google Scholar] [CrossRef]
  109. Nogueira, L.S.; Wood, C.M.; Gillis, P.L.; Bianchini, A. Isolation and fractionation of gill cells from freshwater (Lasmigona costata) and seawater (Mesodesma mactroides) bivalves for use in toxicological studies with copper. Cytotechnology 2013, 65, 773–783. [Google Scholar] [CrossRef] [Green Version]
  110. Boyle, R.T.; Oliveira, L.F.; Bianchini, A.; Souza, M.M. The effects of copper on Na+/K+-ATPase and aquaporin expression in two euryhaline invertebrates. Bull. Environ. Contam. Toxicol. 2013, 90, 387–390. [Google Scholar] [CrossRef]
  111. Jorge, M.B.; Lauer, M.M.; Martins, C.D.M.G.; Bianchini, A. Impaired regulation of divalent cations with acute copper exposure in the marine clam Mesodesma mactroides. Comp. Biochem. Physiol. Part C Toxicol. Pharmacol. 2016, 179, 79–86. [Google Scholar] [CrossRef] [PubMed] [Green Version]
  112. Bishop, S.H.; Greenwalt, D.E.; Kapper, M.A.; Paynter, K.T.; Ellis, L.L. Metabolic regulation of proline, glycine, and alanine accumulation as intracellular osmolytes in ribbed mussel gill tissue. J. Exp. Zool. 1994, 268, 151–161. [Google Scholar] [CrossRef]
  113. Pierce, S.K. Osmolyte permeability in molluscan red cells is regulated by Ca2+ and membrane protein phosphorylation: The present perspective. J. Exp. Zool. 1994, 268, 166–170. [Google Scholar] [CrossRef]
  114. Alfaro, A.C.; Young, T.; Ganesan, A.M. Regulatory effects of mussel (Aulacomya maoriana Iredale 1915) larval settlement by neuroactive compounds, amino acids and bacterial biofilms. Aquaculture 2011, 322, 158–168. [Google Scholar] [CrossRef] [Green Version]
  115. Sánchez-Lazo, C.; Martínez-Pita, I.; Young, T.; Alfaro, A.C. Induction of settlement in larvae of the mussel Mytilus galloprovincialis using neuroactive compounds. Aquaculture 2012, 344–349, 210–215. [Google Scholar] [CrossRef] [Green Version]
  116. Alfaro, A.C.; Young, T.; Bowden, K. Neurophysiological control of swimming behaviour, attachment and metamorphosis in black-footed abalone (Haliotis iris) larvae. N. Z. J. Mar. Freshw. Res. 2014, 48, 314–334. [Google Scholar] [CrossRef] [Green Version]
  117. Pires, A.; Croll, R.P.; Hadfield, M.G. Catecholamines modulate metamorphosis in the opisthobranch gastropod Phestilla sibogae. Biol. Bull. 2000, 198, 319–331. [Google Scholar] [CrossRef]
  118. Boadle-Biber, M.C.; Roth, R.H. Factors modifying the synthesis of dopamine from tyrosine in pedal ganglia of Mercenaria mercenaria (Mollusca). Comp. Gen. Pharmacol. 1972, 3, 61–74. [Google Scholar] [CrossRef]
  119. Zhu, W.; Mantione, K.J.; Shen, L.; Cadet, P.; Esch, T.; Goumon, Y.; Bianchi, E.; Sonetti, D.; Stefano, G.B. Tyrosine and tyramine increase endogenous ganglionic morphine and dopamine levels in vitro and in vivo: Cyp2d6 and tyrosine hydroxylase modulation demonstrates a dopamine coupling. Med. Sci. Monit. 2005, 11, BR397–BR404. [Google Scholar]
  120. Di Poi, C.; Evariste, L.; Serpentini, A.; Halm-Lemeille, M.P.; Lebel, J.M.; Costil, K. Toxicity of five antidepressant drugs on embryo–larval development and metamorphosis success in the Pacific oyster, Crassostrea gigas. Environ. Sci. Pollut. Res. 2014, 21, 13302–13314. [Google Scholar] [CrossRef]
  121. Sudama, G.; Zhang, J.; Isbister, J.; Willett, J.D. Metabolic profiling in Caenorhabditis elegans provides an unbiased approach to investigations of dosage dependent lead toxicity. Metabolomics 2013, 9, 189–201. [Google Scholar] [CrossRef] [PubMed] [Green Version]
  122. Poynton, H.C.; Taylor, N.S.; Hicks, J.; Colson, K.; Chan, S.; Clark, C.; Scanlan, L.; Loguinov, A.V.; Vulpe, C.; Viant, M.R. Metabolomics of microliter hemolymph samples enables an improved understanding of the combined metabolic and transcriptional responses of Daphnia magna to cadmium. Environ. Sci. Technol. 2011, 45, 3710–3717. [Google Scholar] [CrossRef] [PubMed]
  123. Nagato, E.G.; Jessica, C.; Lankadurai, B.P.; Poirier, D.G.; Reiner, E.J.; Simpson, A.J.; Simpson, M.J. 1H NMR-based metabolomics investigation of Daphnia magna responses to sub-lethal exposure to arsenic, copper and lithium. Chemosphere 2013, 93, 331–337. [Google Scholar] [CrossRef]
  124. Dickinson, A.J.; Croll, R.P.; Voronezhskaya, E.E. Development of embryonic cells containing serotonin, catecholamines, and FMRFamide-related peptides in Aplysia californica. Biol. Bull. 2000, 199, 305–315. [Google Scholar] [CrossRef]
  125. Buznikov, G.A.; Nikitina, L.A.; Voronezhskaya, E.E.; Bezuglov, V.V.; Willows, A.D.; Nezlin, L.P. Localization of serotonin and its possible role in early embryos of Tritonia diomedea (Mollusca: Nudibranchia). Cell Tissue Res. 2003, 311, 259–266. [Google Scholar] [CrossRef] [PubMed]
  126. Franchini, A. The distribution of cells containing FMRFamide-and 5-HT-related molecules in the embryonic development of Viviparus ater (Mollusca, Gastropoda). Eur. J. Histochem. 2005, 49, 301–308. [Google Scholar] [CrossRef]
  127. Filla, A.; Hiripi, L.; Elekes, K. Role of aminergic (serotonin and dopamine) systems in the embryogenesis and different embryonic behaviors of the pond snail, Lymnaea stagnalis. Comp. Biochem. Physiol. Part C Toxicol. Pharmacol. 2009, 149, 73–82. [Google Scholar] [CrossRef]
  128. Guerrier, P.; Leclerc-David, C.; Moreau, M. Evidence for the involvement of internal calcium stores during serotonin-induced meiosis reinitiation in oocytes of the bivalve mollusc Ruditapes philippinarum. Dev. Biol. 1993, 159, 474–484. [Google Scholar] [CrossRef]
  129. Kempf, S.C.; Page, L.R.; Pires, A. Development of serotonin-like immunoreactivity in the embryos and larvae of nudibranch mollusks with emphasis on the structure and possible function of the apical sensory organ. J. Comp. Neurol. 1997, 386, 507–528. [Google Scholar] [CrossRef]
  130. De Boeck, G.; Nilsson, G.E.; Elofsson, U.; Vlaeminck, A.; Blust, R. Brain monoamine levels and energy status in common carp (Cyprinus carpio) after exposure to sublethal levels of copper. Aquat. Toxicol. 1995, 33, 265–277. [Google Scholar] [CrossRef]
  131. Lepage, O.; Tottmar, O.; Winberg, S. Elevated dietary intake of L-tryptophan counteracts the stress-induced elevation of plasma cortisol in rainbow trout (Oncorhynchus mykiss). J. Exp. Biol. 2002, 205, 3679–3687. [Google Scholar] [CrossRef] [PubMed]
  132. Morandini, L.; Ramallo, M.R.; Moreira, R.G.; Höcht, C.; Somoza, G.M.; Silva, A.; Pandolfi, M. Serotonergic outcome, stress and sexual steroid hormones, and growth in a South American cichlid fish fed with an L-tryptophan enriched diet. Gen. Comp. Endocrinol. 2015, 223, 27–37. [Google Scholar] [CrossRef] [PubMed]
  133. Hoseini, S.M.; Hosseini, S.A.; Soudagar, M. Dietary tryptophan changes serum stress markers, enzyme activity, and ions concentration of wild common carp Cyprinus carpio exposed to ambient copper. Fish Physiol. Biochem. 2012, 38, 1419–1426. [Google Scholar] [CrossRef] [PubMed]
  134. Fatahi, S.; Hoseini, S.M. Effect of dietary tryptophan and betaine on tolerance of Caspian roach (Rutilus rutilus caspicus) to copper toxicity. Int. J. Aquat. Biol. 2013, 1, 76–81. [Google Scholar]
  135. Mathieu, S.; Sylvain, D.; Walden, F.; Catapane, E.; Carroll, M. GABA is an inhibitory neurotransmitter in ganglia of the bivalve mollusc, Crassostrea virginica. FASEB J. 2014, 28 (Suppl. S1), 1059.4. [Google Scholar] [CrossRef]
  136. Stewart, P.; Soonklang, N.; Stewart, M.J.; Wanichanon, C.; Hanna, P.J.; Poomtong, T.; Sobhon, P. Larval settlement of the tropical abalone, Haliotis asinina Linnaeus, using natural and artificial chemical inducers. Aquac. Res. 2008, 39, 1181–1189. [Google Scholar] [CrossRef]
  137. Young, T.; Alfaro, A.C.; Robertson, J. Effect of neuroactive compounds on the settlement of mussel (Perna canaliculus) larvae. Aquaculture 2011, 319, 277–283. [Google Scholar] [CrossRef] [Green Version]
  138. Naidenko, T.K. Induction of metamorphosis of two species of sea urchin from Sea of Japan. Mar. Biol. 1996, 126, 685–692. [Google Scholar] [CrossRef]
  139. Sato, Y.; Yazaki, I. A cellular analysis of sea urchin metamorphosis induced by L-glutamine. In Echinoderm Research 1998; Carnevali, M.D.C., Bonasoro, F., Eds.; A.A. Balkema: Rotterdam, The Netherlands, 1999; pp. 221–226. [Google Scholar]
  140. Hatakeyama, D.; Aonuma, H.; Ito, E.; Elekes, K. Localization of glutamate-like immunoreactive neurons in the central and peripheral nervous system of the adult and developing pond snail, Lymnaea stagnalis. Biol. Bull. 2007, 213, 172–186. [Google Scholar] [CrossRef] [Green Version]
  141. Wu, H.; Wang, W.X. Tissue-specific toxicological effects of cadmium in green mussels (Perna viridis): Nuclear magnetic resonance-based metabolomics study. Environ. Toxicol. Chem. 2011, 30, 806–812. [Google Scholar] [CrossRef]
  142. Liu, X.; Zhang, L.; You, L.; Cong, M.; Zhao, J.; Wu, H.; Li, C.; Liu, D.; Yu, J. Toxicological responses to acute mercury exposure for three species of Manila clam Ruditapes philippinarum by NMR-based metabolomics. Environ. Toxicol. Pharmacol. 2011, 31, 323–332. [Google Scholar] [CrossRef] [PubMed]
  143. Liu, X.; Zhang, L.; You, L.; Yu, J.; Zhao, J.; Li, L.; Wang, Q.; Li, F.; Li, C.; Liu, D.; et al. Differential toxicological effects induced by mercury in gills from three pedigrees of Manila clam Ruditapes philippinarum by NMR-based metabolomics. Ecotoxicology 2011, 20, 177–186. [Google Scholar] [CrossRef] [PubMed]
  144. Kim, S.; Yoon, D.; Lee, M.; Yoon, C.; Kim, S. Metabolic responses in zebrafish (Danio rerio) exposed to zinc and cadmium by nuclear magnetic resonance-based metabolomics. Chem. Ecol. 2016, 32, 136–148. [Google Scholar] [CrossRef]
  145. Casanova, F.M.; Honda, R.T.; Ferreira-Nozawa, M.S.; Aride, P.H.R.; Nozawa, S.R. Effects of copper and cadmium exposure on mRnA expression of catalase, Glutamine synthetase, cytochrome p450 and Heat shock protein 70 in Tambaqui fish (Colossoma Macropomum). Gene Expr. Genet. Genom. 2013, 6, 1–8. [Google Scholar]
  146. Venkata, C.M.; Radhakrishnaiah, K. A study on the toxicity of cadmium on certain aspects of protein metabolism of the freshwater mussel Lamellidens marginalis (Lamarck) and freshwater fish Labeo rohita (Hamilton). Int. J. Environ. Sci. 2013, 4, 15–27. [Google Scholar]
  147. Fitsanakis, V.A.; Aschner, M. The importance of glutamate, glycine, and γ-aminobutyric acid transport and regulation in manganese, mercury and lead neurotoxicity. Toxicol. Appl. Pharmacol. 2005, 204, 343–354. [Google Scholar] [CrossRef]
  148. Sidoryk-Wegrzynowicz, M.; Aschner, M. Manganese toxicity in the central nervous system: The glutamine/glutamate-γ-aminobutyric acid cycle. J. Intern. Med. 2013, 273, 466–477. [Google Scholar] [CrossRef] [Green Version]
  149. Wirbisky, S.E.; Weber, G.J.; Lee, J.W.; Cannon, J.R.; Freeman, J.L. Novel dose-dependent alterations in excitatory GABA during embryonic development associated with lead (Pb) neurotoxicity. Toxicol. Lett. 2014, 229, 1–8. [Google Scholar] [CrossRef] [Green Version]
  150. Awapara, J.; Allen, K. Occurrence of β-aminoisobutyric acid in Mytilus edulis. Science 1959, 130, 1250. [Google Scholar] [CrossRef]
  151. Nielsen, H.R.; Nyholm, K.; Sjølin, K.E. Relationship between urinary β-aminoisobutyric acid and transfer RNA turnover in cancer patients. Cancer Res. 1974, 34, 3428–3432. [Google Scholar]
  152. Farkas, W.R.; Fischbein, A.; Solomon, S.; Buschman, F.; Borek, E.; Sharma, O.K. Elevated urinary excretion of β-aminoisobutyric acid and exposure to inorganic lead. Arch. Environ. Health Int. J. 1987, 42, 96–99. [Google Scholar] [CrossRef] [PubMed]
  153. Tomokuni, K.; Ichiba, M.; Hirai, Y. Elevated urinary excretion of β-aminoisobutyric acid and δ-aminolevulinic acid (ALA) and the inhibition of ALA-synthase and ALA-dehydratase activities in both liver and kidney in mice exposed to lead. Toxicol. Lett. 1991, 59, 169–173. [Google Scholar] [PubMed]
  154. Tomokuni, K.; Ichiba, M.; Mori, K. Relation between urinary beta-aminoisobutyric acid excretion and concentration of lead in the blood of workers occupationally exposed to lead. Br. J. Ind. Med. 1992, 49, 365–368. [Google Scholar] [CrossRef] [PubMed] [Green Version]
  155. Brinzer, R.A.; Henderson, L.; Marchiondo, A.A.; Woods, D.J.; Davies, S.A.; Dow, J.A. Metabolomic profiling of permethrin-treated Drosophila melanogaster identifies a role for tryptophan catabolism in insecticide survival. Insect Biochem. Mol. Biol. 2015, 67, 74–86. [Google Scholar] [CrossRef] [Green Version]
  156. Van Kuilenburg, A.B.; Meinsma, R.; Beke, E.; Assmann, B.; Ribes, A.; Lorente, I.; Busch, R.; Mayatepek, E.; Abeling, N.G.; van Cruchten, A.; et al. β-Ureidopropionase deficiency: An inborn error of pyrimidine degradation associated with neurological abnormalities. Hum. Mol. Genet. 2004, 13, 2793–2801. [Google Scholar] [CrossRef]
  157. Van Kuilenburg, A.B.P.; Stroomer, A.E.M.; Abeling, N.G.G.M.; van Gennip, A.H. A pivotal role for β-aminoisobutyric acid and oxidative stress in dihydropyrimidine dehydrogenase deficiency? Nucl. Nucl. Nucleic Acids 2006, 25, 1103–1106. [Google Scholar] [CrossRef]
  158. Glahn, F.; Schmidt-Heck, W.; Zellmer, S.; Guthke, R.; Wiese, J.; Golka, K.; Hergenröder, R.; Degen, G.H.; Lehmann, T.; Hermes, M.; et al. Cadmium, cobalt and lead cause stress response, cell cycle deregulation and increased steroid as well as xenobiotic metabolism in primary normal human bronchial epithelial cells which is coordinated by at least nine transcription factors. Arch. Toxicol. 2008, 82, 513–524. [Google Scholar] [CrossRef]
  159. Gemelli, T.; de Andrade, R.B.; Rojas, D.B.; Bonorino, N.F.; Mazzola, P.N.; Tortorelli, L.S.; Funchal, C.; Dutra Filho, C.S.; Wannmacher, C.M.D. Effects of β-alanine administration on selected parameters of oxidative stress and phosphoryltransfer network in cerebral cortex and cerebellum of rats. Mol. Cell. Biochem. 2013, 380, 161–170. [Google Scholar] [CrossRef]
  160. Bo, Y.; Jin, C.; Liu, Y.; Yu, W.; Kang, H. Metabolomic analysis on the toxicological effects of TiO2 nanoparticles in mouse fibroblast cells: From the perspective of perturbations in amino acid metabolism. Toxicol. Mech. Methods 2014, 24, 461–469. [Google Scholar] [CrossRef]
  161. Liu, X.; Li, Q.; Sheng, J.; Hu, B.; Zhu, Z.; Zhou, S.; Yin, J.; Gong, Q.; Wang, Y.; Zhang, C. Unique plasma metabolomic signature of osteonecrosis of the femoral head. J. Orthop. Res. 2015, 34, 1158–1167. [Google Scholar] [CrossRef] [Green Version]
  162. Miccheli, A.; Capuani, G.; Marini, F.; Tomassini, A.; Praticò, G.; Ceccarelli, S.; Gnani, D.; Baviera, G.; Alisi, A.; Putignani, L.; et al. Urinary 1H-NMR-based metabolic profiling of children with NAFLD undergoing VSL#3 treatment. Int. J. Obes. 2015, 39, 1118–1125. [Google Scholar]
  163. Valavanidis, A.; Vlahogianni, T.; Dassenakis, M.; Scoullos, M. Molecular biomarkers of oxidative stress in aquatic organisms in relation to toxic environmental pollutants. Ecotoxicol. Environ. Saf. 2006, 64, 178–189. [Google Scholar] [CrossRef] [PubMed]
  164. Sevcikova, M.; Modra, H.; Slaninova, A.; Svobodova, Z. Metals as a cause of oxidative stress in fish: A review. Vet. Med. 2011, 56, 537–546. [Google Scholar] [CrossRef] [Green Version]
  165. Copley, S.D.; Frank, E.; Kirsch, W.M.; Koch, T.H. Detection and possible origins of aminomalonic acid in protein hydrolysates. Anal. Biochem. 1992, 201, 152–157. [Google Scholar] [CrossRef] [PubMed]
  166. Dean, R.T.; Fu, S.; Stocker, R.; Davies, M.J. Biochemistry and pathology of radical-mediated protein oxidation. Biochem. J. 1997, 324, 1–18. [Google Scholar] [CrossRef] [Green Version]
  167. Kang, D.K.; Jeong, J.; Drake, S.K.; Wehr, N.B.; Rouault, T.A.; Levine, R.L. Iron regulatory protein 2 as iron sensor Iron-dependent oxidative modification of cysteine. J. Biol. Chem. 2003, 278, 14857–14864. [Google Scholar] [CrossRef] [Green Version]
  168. Ibarra, R.; Dazard, J.E.; Sandlers, Y.; Rehman, F.; Abbas, R.; Kombu, R.; Zhang, G.-F.; Brunengraber, H.; Sanabria, J. Metabolomic analysis of liver tissue from the VX2 rabbit model of secondary liver tumors. HPB Surg. 2014, 2014, 310372. [Google Scholar] [CrossRef] [Green Version]
  169. Vandenbrouck, T.; Jones, O.A.; Dom, N.; Griffin, J.L.; De Coen, W. Mixtures of similarly acting compounds in Daphnia magna: From gene to metabolite and beyond. Environ. Int. 2010, 36, 254–268. [Google Scholar] [CrossRef]
  170. Gibb, J.O.T.; Svendsen, C.; Weeks, J.M.; Nicholson, J.K. 1H NMR spectroscopic investigations of tissue metabolite biomarker response to Cu II exposure in terrestrial invertebrates: Identification of free histidine as a novel biomarker of exposure to copper in earthworms. Biomarkers 1997, 2, 295–302. [Google Scholar] [CrossRef]
  171. Krämer, U.; Cotter-Howells, J.D.; Charnock, J.M.; Baker, A.J.; Smith, J.A.C. Free histidine as a metal chelator in plants that accumulate nickel. Nature 1996, 379, 635–638. [Google Scholar] [CrossRef]
  172. Wycisk, K.; Kim, E.J.; Schroeder, J.I.; Krämer, U. Enhancing the first enzymatic step in the histidine biosynthesis pathway increases the free histidine pool and nickel tolerance in Arabidopsis thaliana. FEBS Lett. 2004, 578, 128–134. [Google Scholar] [CrossRef]
  173. Bundy, J.G.; Sidhu, J.K.; Rana, F.; Spurgeon, D.J.; Svendsen, C.; Wren, J.F.; Stürzenbaum, S.R.; Morgan, A.J.; Kille, P. ‘Systems toxicology’ approach identifies coordinated metabolic responses to copper in a terrestrial non-model invertebrate, the earthworm Lumbricus rubellus. BMC Biol. 2008, 6, 25. [Google Scholar] [CrossRef] [Green Version]
  174. Digilio, G.; Sforzini, S.; Cassino, C.; Robotti, E.; Oliveri, C.; Marengo, E.; Musso, D.; Osella, D.; Viarengo, A. Haemolymph from Mytilus galloprovincialis: Response to copper and temperature challenges studied by 1H-NMR metabonomics. Comp. Biochem. Physiol. Part C Toxicol. Pharmacol. 2016, 183, 61–71. [Google Scholar] [CrossRef]
  175. Abebe, A.T.; Devoid, S.J.; Sugumaran, M.; Etter, R.; Robinson, W.E. Identification and quantification of histidine-rich glycoprotein (HRG) in the blood plasma of six marine bivalves. Comp. Biochem. Physiol. Part B Biochem. Mol. Biol. 2007, 147, 74–81. [Google Scholar] [CrossRef] [PubMed]
  176. Devoid, S.J.; Etter, R.; Sugumaran, M.; Wallace, G.T.; Robinson, W.E. Histidine-rich glycoprotein from the hemolymph of the marine mussel Mytilus edulis L. binds Class A, Class B, and borderline metals. Environ. Toxicol. Chem. 2007, 26, 872–877. [Google Scholar] [CrossRef] [PubMed]
  177. Sugiura, Y.; Kashiba, M.; Maruyama, K.; Hoshikawa, K.; Sasaki, R.; Saito, K.; Kimura, H.; Goda, N.; Suematsu, M. Cadmium exposure alters metabolomics of sulfur containing amino acids in rat testes. Antioxid. Redox Signal. 2005, 7, 781–787. [Google Scholar] [CrossRef]
  178. Hughes, S.L.; Bundy, J.G.; Want, E.J.; Kille, P.; Sturzenbaum, S.R. The metabolomic responses of Caenorhabditis elegans to cadmium are largely independent of metallothionein status but dominated by changes in cystathionine and phytochelatins. J. Proteome Res. 2009, 8, 3512–3519. [Google Scholar] [CrossRef] [PubMed]
  179. Jeppe, K.J.; Carew, M.E.; Long, S.M.; Lee, S.F.; Pettigrove, V.; Hoffmann, A.A. Genes involved in cysteine metabolism of Chironomus tepperi are regulated differently by copper and by cadmium. Comp. Biochem. Physiol. Part C Toxicol. Pharmacol. 2014, 162, 1–6. [Google Scholar] [CrossRef] [PubMed]
  180. Long, S.M.; Tull, D.L.; Jeppe, K.J.; De Souza, D.P.; Dayalan, S.; Pettigrove, V.J.; McConville, M.J.; Hoffmann, A.A. A multi-platform metabolomics approach demonstrates changes in energy metabolism and the transsulfuration pathway in Chironomus tepperi following exposure to zinc. Aquat. Toxicol. 2015, 162, 54–65. [Google Scholar] [CrossRef]
  181. Aquilano, K.; Baldelli, S.; Ciriolo, M.R. Glutathione: New roles in redox signaling for an old antioxidant. Front. Pharmacol. 2014, 5, 196. [Google Scholar] [CrossRef] [PubMed] [Green Version]
  182. McBean, G.J. The transsulfuration pathway: A source of cysteine for glutathione in astrocytes. Amino Acids 2012, 42, 199–205. [Google Scholar] [CrossRef] [Green Version]
  183. Jozefczak, M.; Remans, T.; Vangronsveld, J.; Cuypers, A. Glutathione is a key player in metal-induced oxidative stress defenses. Int. J. Mol. Sci. 2012, 13, 3145–3175. [Google Scholar] [CrossRef] [Green Version]
  184. Wang, W.; Ballatori, N. Endogenous glutathione conjugates: Occurrence and biological functions. Pharmacol. Rev. 1998, 50, 335–356. [Google Scholar]
  185. Rabenstein, D.L. Metal complexes of glutathione and their biological significance. In Glutathione: Chemical Biochemical and Medical Aspects: Coenzymes and Cofactors; Dolphin, D., Auramovibc, O., Poulson, R., Eds.; Wiley: New York, NY, USA, 1989; Volume 3, pp. 147–186. [Google Scholar]
  186. Maracine, M.; Segner, H. Cytotoxicity of metals in isolated fish cells: Importance of the cellular glutathione status. Comp. Biochem. Physiol. Part A Mol. Integr. Physiol. 1998, 120, 83–88. [Google Scholar] [CrossRef]
  187. Lu, S.C. Regulation of glutathione synthesis. Mol. Asp. Med. 2009, 30, 42–59. [Google Scholar] [CrossRef] [Green Version]
  188. Marí, M.; Morales, A.; Colell, A.; García-Ruiz, C.; Fernández-Checa, J.C. Mitochondrial glutathione, a key survival antioxidant. Antioxid. Redox Signal. 2009, 11, 2685–2700. [Google Scholar] [CrossRef] [PubMed] [Green Version]
  189. Geret, F.; Serafim, A.; Barreira, L.; Bebianno, M.J. Response of antioxidant systems to copper in the gills of the clam Ruditapes decussatus. Mar. Environ. Res. 2002, 54, 413–417. [Google Scholar] [CrossRef] [PubMed]
  190. Bigot, A.; Vasseur, P.; Rodius, F. SOD and CAT cDNA cloning, and expression pattern of detoxification genes in the freshwater bivalve Unio tumidus transplanted into the Moselle river. Ecotoxicology 2010, 19, 369–376. [Google Scholar] [CrossRef] [PubMed]
  191. Maria, V.L.; Bebianno, M.J. Antioxidant and lipid peroxidation responses in Mytilus galloprovincialis exposed to mixtures of benzo(a)pyrene and copper. Comp. Biochem. Physiol. Part C Toxicol. Pharmacol. 2011, 154, 56–63. [Google Scholar] [CrossRef] [PubMed]
  192. Atli, G.; Grosell, M. Characterization and response of antioxidant systems in the tissues of the freshwater pond snail (Lymnaea stagnalis) during acute copper exposure. Aquat. Toxicol. 2016, 176, 38–44. [Google Scholar] [CrossRef] [PubMed]
  193. Zhang, L.; Qiu, L.; Wu, H.; Liu, X.; You, L.; Pei, D.; Chen, L.; Wang, Q.; Zhao, J. Expression profiles of seven glutathione S-transferase (GST) genes from Venerupis philippinarum exposed to heavy metals and benzo[a]pyrene. Comp. Biochem. Physiol. Part C Toxicol. Pharmacol. 2012, 155, 517–527. [Google Scholar] [CrossRef] [PubMed]
  194. Gireesh, R.; Biju, A.; Muthiah, P. Biochemical changes during larval development in the short neck clam, Paphia malabarica Chemnitz. Aquac. Res. 2009, 40, 1510–1515. [Google Scholar] [CrossRef] [Green Version]
  195. Matias, D.; Joaquim, S.; Ramos, M.; Sobral, P.; Leitão, A. Biochemical compounds’ dynamics during larval development of the carpet-shell clam Ruditapes decussatus (Linnaeus, 1758): Effects of mono-specific diets and starvation. Helgol. Mar. Res. 2010, 65, 369–379. [Google Scholar] [CrossRef] [Green Version]
  196. Sánchez-Lazo, C.; Martínez-Pita, I. Biochemical and energy dynamics during larval development of the mussel Mytilus galloprovincialis (Lamarck, 1819). Aquaculture 2012, 358, 71–78. [Google Scholar] [CrossRef]
  197. Liu, H.; Guo, Z.; Zheng, H.; Wang, S.; Wang, Y.; Liu, W.; Zhang, G. Functional characterization of a Δ5-like fatty acyl desaturase and its expression during early embryogenesis in the noble scallop Chlamys nobilis Reeve. Mol. Biol. Rep. 2014, 41, 7437–7445. [Google Scholar] [CrossRef]
  198. Da Costa, F.; Robert, R.; Quéré, C.; Wikfors, G.H.; Soudant, P. Essential fatty acid assimilation and synthesis in larvae of the bivalve Crassostrea gigas. Lipids 2015, 50, 503–511. [Google Scholar] [CrossRef] [Green Version]
  199. Pettersen, A.K.; Turchini, G.M.; Jahangard, S.; Ingram, B.A.; Sherman, C.D. Effects of different dietary microalgae on survival, growth, settlement and fatty acid composition of blue mussel (Mytilus galloprovincialis) larvae. Aquaculture 2010, 309, 115–124. [Google Scholar] [CrossRef]
  200. Paolisso, G.; Gambardella, A.; Tagliamonte, M.R.; Saccomanno, F.; Salvatore, T.; Gualdiero, P.; D’Onofrio, M.V.; Howard, B.V. Does free fatty acid infusion impair insulin action also through an increase in oxidative stress? J. Clin. Endocrinol. Metab. 1996, 81, 4244–4248. [Google Scholar] [CrossRef]
  201. Tripathy, D.; Aljada, A.; Dandona, P. Free fatty acids (FFA) and endothelial dysfunction; Role of increased oxidative stress and inflammation. Diabetologia 2003, 46, 300–301. [Google Scholar] [CrossRef] [Green Version]
  202. Tripathy, D.; Mohanty, P.; Dhindsa, S.; Syed, T.; Ghanim, H.; Aljada, A.; Dandona, P. Elevation of free fatty acids induces inflammation and impairs vascular reactivity in healthy subjects. Diabetes 2003, 52, 2882–2887. [Google Scholar] [CrossRef] [Green Version]
  203. Morgan, M.J.; Liu, Z.G. Crosstalk of reactive oxygen species and NF-κB signaling. Cell Res. 2011, 21, 103–115. [Google Scholar] [CrossRef] [PubMed] [Green Version]
  204. Zhou, Z.; Wang, M.; Zhao, J.; Wang, L.; Gao, Y.; Zhang, H.; Song, L. The increased transcriptional response and translocation of a Rel/NF-κB homologue in scallop Chlamys farreri during the immune stimulation. Fish Shellfish Immunol. 2013, 34, 1209–1215. [Google Scholar] [CrossRef] [PubMed]
  205. Li, R.; Zhang, R.; Zhang, L.; Zou, J.; Xing, Q.; Dou, H.; Hu, X.; Zhang, L.; Wang, R.; Bao, Z. Characterizations and expression analyses of NF-κB and Rel genes in the Yesso scallop (Patinopecten yessoensis) suggest specific response patterns against Gram-negative infection in bivalves. Fish Shellfish Immunol. 2015, 44, 611–621. [Google Scholar] [CrossRef] [PubMed]
  206. Baker, R.G.; Hayden, M.S.; Ghosh, S. NF-κB, inflammation, and metabolic disease. Cell Metab. 2011, 13, 11–22. [Google Scholar] [CrossRef] [Green Version]
  207. Janssen-Heininger, Y.M.; Poynter, M.E.; Baeuerle, P.A. Recent advances towards understanding redox mechanisms in the activation of nuclear factor κb. Free Radic. Biol. Med. 2000, 28, 1317–1327. [Google Scholar] [CrossRef]
  208. Biswas, D.K.; Shi, Q.; Baily, S.; Strickland, I.; Ghosh, S.; Pardee, A.B.; Iglehart, J.D. NF-κB activation in human breast cancer specimens and its role in cell proliferation and apoptosis. Proc. Natl. Acad. Sci. USA 2004, 101, 10137–10142. [Google Scholar] [CrossRef]
  209. Hayden, M.S.; Ghosh, S. NF-κB in immunobiology. Cell Res. 2011, 21, 223–244. [Google Scholar] [CrossRef] [Green Version]
  210. Gilmore, T.D.; Wolenski, F.S. NF-κB: Where did it come from and why? Immunol. Rev. 2012, 246, 14–35. [Google Scholar] [CrossRef]
  211. Persichini, T.; Percario, Z.; Mazzon, E.; Colasanti, M.; Cuzzocrea, S.; Musci, G. Copper activates the NF-κB pathway in vivo. Antioxid. Redox Signal. 2006, 8, 1897–1904. [Google Scholar] [CrossRef]
  212. Korashy, H.M.; El-Kadi, A.O. The role of redox-sensitive transcription factors NF-κB and AP-1 in the modulation of the Cyp1a1 gene by mercury, lead, and copper. Free Radic. Biol. Med. 2008, 44, 795–806. [Google Scholar] [CrossRef]
  213. Ji, C.; Wang, Q.; Wu, H.; Tan, Q.; Wang, W.-X. A metabolomic study on the biological effects of metal pollutions in oysters Crassostrea sikamea. Mar. Pollut. Bull. 2016, 102, 216–222. [Google Scholar] [CrossRef] [PubMed]
  214. Ji, C.; Yu, D.; Wang, Q.; Li, F.; Zhao, J.; Wu, H. Impact of metal pollution on shrimp Crangon affinis by NMR-based metabolomics. Mar. Pollut. Bull. 2016, 106, 372–376. [Google Scholar] [CrossRef] [PubMed]
  215. Xu, L.; Ji, C.; Zhao, J.; Wu, H. Metabolic responses to metal pollution in shrimp Crangon affinis from the sites along the Laizhou Bay in the Bohai Sea. Mar. Pollut. Bull. 2016, 113, 536–541. [Google Scholar] [CrossRef] [PubMed]
  216. Kim, Y.S. Malonate metabolism: Biochemistry, molecular biology, physiology, and industrial application. BMB Rep. 2002, 35, 443–451. [Google Scholar] [CrossRef] [Green Version]
  217. Wojtovich, A.P.; Brookes, P.S. The endogenous mitochondrial complex II inhibitor malonate regulates mitochondrial ATP-sensitive potassium channels: Implications for ischemic preconditioning. Biochim. Biophys. Acta Bioenerg. 2008, 1777, 882–889. [Google Scholar] [CrossRef] [Green Version]
  218. Döbrössy, M.D.; Büchele, F.; Nikkhah, G. Excitotoxic lesions of the rodent striatum. In Animal Models of Movement Disorders: Volume II; Lane, E.L., Dunnett, S.B., Eds.; Humana Press: Totowa, NJ, USA; Springer: New York, NY, USA, 2011; pp. 21–35. [Google Scholar]
  219. Fernandez-Gomez, F.J.; Galindo, M.F.; Gómez-Lázaro, M.; Yuste, V.J.; Comella, J.X.; Aguirre, N.; Jordán, J. Malonate induces cell death via mitochondrial potential collapse and delayed swelling through an ROS-dependent pathway. Br. J. Pharmacol. 2005, 144, 528–537. [Google Scholar] [CrossRef] [Green Version]
  220. De Oliveira Marques, F.; Hagen, M.E.K.; Pederzolli, C.D.; Sgaravatti, A.M.; Durigon, K.; Testa, C.G.; Wannmacher, C.M.D.; Wyse, A.T.D.S.; Wajner, M.; Dutra-Filho, C.S. Glutaric acid induces oxidative stress in brain of young rats. Brain Res. 2003, 964, 153–158. [Google Scholar] [CrossRef]
  221. Fighera, M.R.; Royes, L.F.F.; Furian, A.F.; Oliveira, M.S.; Fiorenza, N.G.; Frussa-Filho, R.; Petry, J.C.; Coelho, R.C.; Mello, C.F. GM1 ganglioside prevents seizures, Na+, K+-ATPase activity inhibition and oxidative stress induced by glutaric acid and pentylenetetrazole. Neurobiol. Dis. 2006, 22, 611–623. [Google Scholar] [CrossRef]
  222. Latini, A.; Ferreira, G.C.; Scussiato, K.; Schuck, P.F.; Solano, A.F.; Dutra-Filho, C.S.; Vargas, C.R.; Wajner, M. Induction of oxidative stress by chronic and acute glutaric acid administration to rats. Cell. Mol. Neurobiol. 2007, 27, 423–438. [Google Scholar] [CrossRef]
  223. Tian, F.; Fu, X.; Gao, J.; Ying, Y.; Hou, L.; Liang, Y.; Ning, Q.; Luo, X. Glutaric acid-mediated apoptosis in primary striatal neurons. BioMed Res. Int. 2014, 2014, 484731. [Google Scholar] [CrossRef] [Green Version]
  224. Soga, T.; Baran, R.; Suematsu, M.; Ueno, Y.; Ikeda, S.; Sakurakawa, T.; Kakazu, Y.; Ishikawa, T.; Robert, M.; Nishioka, T.; et al. Differential metabolomics reveals ophthalmic acid as an oxidative stress biomarker indicating hepatic glutathione consumption. J. Biol. Chem. 2006, 281, 16768–16776. [Google Scholar] [CrossRef] [PubMed] [Green Version]
  225. Fujii, J.; Ito, J.I.; Zhang, X.; Kurahashi, T. Unveiling the roles of the glutathione redox system in vivo by analyzing genetically modified mice. J. Clin. Biochem. Nutr. 2011, 49, 70–78. [Google Scholar] [CrossRef] [PubMed] [Green Version]
  226. Dello, S.A.; Neis, E.P.; de Jong, M.C.; van Eijk, H.M.; Kicken, C.H.; Damink, S.W.O.; Dejong, C.H. Systematic review of ophthalmate as a novel biomarker of hepatic glutathione depletion. Clin. Nutr. 2013, 32, 325–330. [Google Scholar] [CrossRef] [PubMed]
Figure 1. Effects of copper exposure on embryonic/larval survival, larval development, and larval swimming behaviour: (A) Percent of organisms surviving at 18, 42, and 72 h post-fertilisation when exposed to sublethal and lethal Cu levels; (B) Percent of normally developed D-larvae, abnormally developed D-larvae (very small and/or with shell structure deformities), and incidence of abnormal swimming behaviour (static or slowed movement) after 66 h of exposure to sublethal Cu level, compared to controls. No survivors were found within the 50.3 µg·L−1 Cu treatment.
Metabolites 13 00838 g001
Figure 2. Hierarchical Cluster Analysis (Euclidian distance; Ward’s criterion) of embryo samples (branches) based on global compositional changes in metabolites as a response to 50.3 µg·L−1 bioavailable Cu exposure.
Metabolites 13 00838 g002
Figure 3. Toxicological effects of high Cu levels (50.3 µg·L−1 bioavailable Cu) on the embryonic metabolome after 3 and 18 h of exposure: (A) Heatmap of metabolite levels (red > green) with combined HCA of all metabolite features (rows where n = 90); (B,C) Projection to Latent Structures Discriminate Analysis (PLS-DA) plots of 3 h and 18 h exposed embryos, respectively, compared to their control groups; (D,E) Variable of Importance (VIP) scores for each of the PLS-DA models.
Metabolites 13 00838 g003
Figure 4. Lists of significantly altered (p < 0.05) metabolites detected via SAM analysis in embryos exposed to elevated (50.3 µg·L−1 bioavailable) Cu for: (A) 3 h (global FDR = 0.11); or (B) 18 h (global FDR = 0.01). Red circles (Metabolites 13 00838 i001) indicate metabolite fold changes in Cu-treated embryos relative to control embryos (green circles; Metabolites 13 00838 i002) plotted using a log2 scale.
Metabolites 13 00838 g004
Figure 5. Pathway enrichment and topology analysis of the effects of elevated bioavailable Cu (50.3 µg·L−1) on embryos after 3 h (blue circles) and 18 h (red circles) exposure, compared to their respective controls. The y-axis represents the −log of the raw p-value (i.e., ln[x]) associated with pathway enrichment analysis, and the x-axis represents the Pathway Impact (PI) score associated with topology analysis (a measure of metabolite centrality within the pathways). The black dotted line denotes the threshold p-value of significance, where pathways below the line (p > 0.05) were identified as not being significantly different from those functioning in control embryos. The effects of Cu exposure duration on differentially enriched pathways are seen as vertical shifts in significance.
Metabolites 13 00838 g005
Figure 6. Metabolic trajectory analyses of embryos exposed to sub-lethal Cu2+ levels derived from PLS-DA of control embryos (yellow circles) and embryos continuously exposed to 0.04 g·L−1 (orange circles) and 1.10 g·L−1 (red circles) bioavailable Cu: (A) Data are presented as means ± SD of triplicate samples. Black lines/arrows summarise the main trends/trajectories during baseline embryonic development and in response to sublethal Cu exposures for each treatment duration; (B) Phenotype-normalised metabolic trajectory analysis derived from PLS-DA of control embryos (yellow circle) and embryos continuously exposed to 0.04 g·L−1 (orange circles) and 1.10 g·L−1 (red circles) bioavailable Cu. Control data are presented as the mean ± SD of 12 replicates (i.e., triplicate samples for each development stage/exposure duration), whereas treatment data are presented as the mean ± SD of triplicate samples. Black lines/arrows summarise the main metabolic trends/trajectories in embryos/larvae for each exposure duration, and the coloured dashed lines summarise the metabolic trends/trajectories of embryos exposed to each Cu level during the experiment.
Metabolites 13 00838 g006
Figure 7. Heatmap and cluster analysis (left) of mean metabolite foldchanges in Cu-treated organisms relative to their respective controls, where: Tn = exposure duration (h); Low = 0.04 µg·L−1 bioavailable Cu; Med = 1.10 µg·L−1 bioavailable Cu. Five general treatment-averaged foldchange trends are also displayed (line plots on the right) based on the cluster analysis of metabolites.
Metabolites 13 00838 g007
Figure 8. Production of reactive oxygen species (ROS) in embryos and larvae reared under different levels of bioavailable Cu for (A) 18 h, (B) 36 h, and (C) 66 h. ROS levels are expressed as % H2O2 micro-equivalents per individual. Asterisks denote significant differences compared to controls (ANOVA; Dunnet’s post hoc tests; p < 0.05).
Metabolites 13 00838 g008
Figure 9. Targeted analysis of oxidative stress biomarkers in mussel embryos incubated in different copper environments. Data are autoscaled, and the widths of coloured lines are bounded by the standard error of the means of triplicate samples of pooled embryos/larvae (n ≈ 200,000), where grey = controls; green = 0.04 µg·L−1 bioavailable Cu; orange = 1.10 µg·L−1 bioavailable Cu; red = 50.3 µg·L−1 bioavailable Cu.
Metabolites 13 00838 g009
Table 1. Bulk seawater composition prior to EDTA and CuSO4 additions.
Copper Species/FractionConcentrationElementConcentrationElementConcentration
Total dissolved Cu2.90 µg·L−1Aluminium<13.0 µg·L−1Magnesium1.49 g·L−1
Humic-bound Cu2.76 µg·L−1Arsenic<4.2 µg·L−1Manganese<1.1 µg·L−1
Free Cu2+0.01 µg·L−1Barium5.9 µg·L−1Mercury<80.0 ng·L−1
Inorganic-bound Cu0.123 µg·L−1Beryllium<0.63 µg·L−1Molybdenum11.1 µg·L−1
Bioavailable Cu0.133 µg·L−1Boron4.0 mg·L−1Nickel<6.3 µg·L−1
Nutrient ProfileConcentrationBromine82.0 mg·L−1Phosphorus22.0 µg·L−1
Total ammoniacal-N<10.0 µg·L−1Cadmium<0.21 µg·L−1Potassium0.4 g·L−1
Nitrite-N<2.0 µg·L−1Cesium<1.9 µg·L−1Rubidium0.12 mg·L−1
Nitrate-N4.0 µg·L−1Calcium0.42 g·L−1Selenium<4.2 µg·L−1
Nitrite-N + Nitrate-N4.0 µg·L−1Carbon24.0 mg·L−1Silver<0.43 µg·L−1
Dissolved reactive P8.0 µg·L−1Chloride19.0 g·L−1Sodium11.2 g·L−1
OtherConcentrationChromium<1.1 µg·L−1Strontium8.7 mg·L−1
Alkalinity (CaCO3)116.0 mg·L−1Cobalt<0.63 µg·L−1Thallium<0.21 µg·L−1
Total Kjeldahl Nitrogen<0.2 mg·L−1Fluoride1.6 mg·L−1Tin<1.7 µg·L−1
Reactive silica (SiO2)0.29 mg·L−1Iron5.4 µg·L−1Uranium3.3 µg·L−1
Dissolved non-purgeable organic C1.1 mg·L−1Lead<1.1 µg·L−1Vanadium1.9 µg·L−1
Lithium0.19 mg·L−1Zinc6.3 µg·L−1
Table 2. Between-treatment variation in different copper fractions within incubation tanks after EDTA addition and three levels of CuSO4 treatment. Note differences in concentration units.
Copper Species/FractionExperimental Copper Concentrations
ControlLow DoseMedium DoseHigh Dose
Target total dissolved Cu0.0 µg·L−1100 µg·L−1200 µg·L−1300 µg·L−1
Measured total dissolved Cu2.6 µg·L−1130 µg·L−1250 µg·L−1370 µg·L−1
Humic-bound Cu26.0 ng·L−11.6 µg·L−19.0 µg·L−157.0 µg·L−1
EDTA-bound Cu2.6 µg·L−1130 µg·L−1240 µg·L−1260 µg·L−1
Free Cu2+0.06 ng·L−13.2 ng·L−183.0 ng·L−14.3 µg·L−1
Inorganic-bound Cu4.0 ng·L−139.0 ng·L−10.98 µg·L−151.0 µg·L−1
Non-bioavailable Cu2.6 µg·L−1130 µg·L−1249 µg·L−1310 µg·L−1
Bioavailable Cu0.47 ng·L−10.04 µg·L−11.1 µg·L−150.3 µg·L−1
Table 3. Relative temporal changes in oxidative stress biomarkers across Cu treatments compared to controls. Up/down-arrows represent statistical differences (ANOVA; Dunnet’s post hoc tests; p < 0.05) between treatments and controls displayed in Figure 9 at different time points; hyphens represent non-statistical differences.
Biomarker0.04 µg·L−11.10 µg·L−150.3 µg·L−1
3 h18 h42 h72 h3 h18 h42 h72 h3 h18 h
DNA damage-----
Protein damage-----
Lipid damage---
GSH--------
CAT------
SOD------
GR------
GST------
GPx-----
Disclaimer/Publisher’s Note: The statements, opinions and data contained in all publications are solely those of the individual author(s) and contributor(s) and not of MDPI and/or the editor(s). MDPI and/or the editor(s) disclaim responsibility for any injury to people or property resulting from any ideas, methods, instructions or products referred to in the content.

