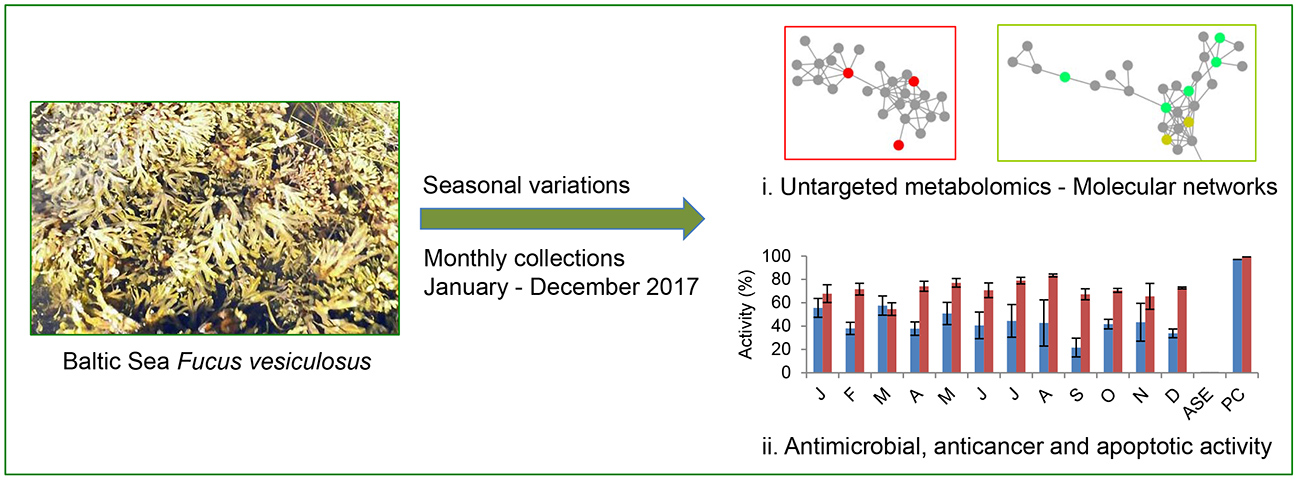
Seasonal Variations in the Metabolome and Bioactivity Profile of Fucus vesiculosus Extracted by an Optimised, Pressurised Liquid Extraction Protocol

 , ,
, ,
Abstract
:
1. Introduction
2. Results
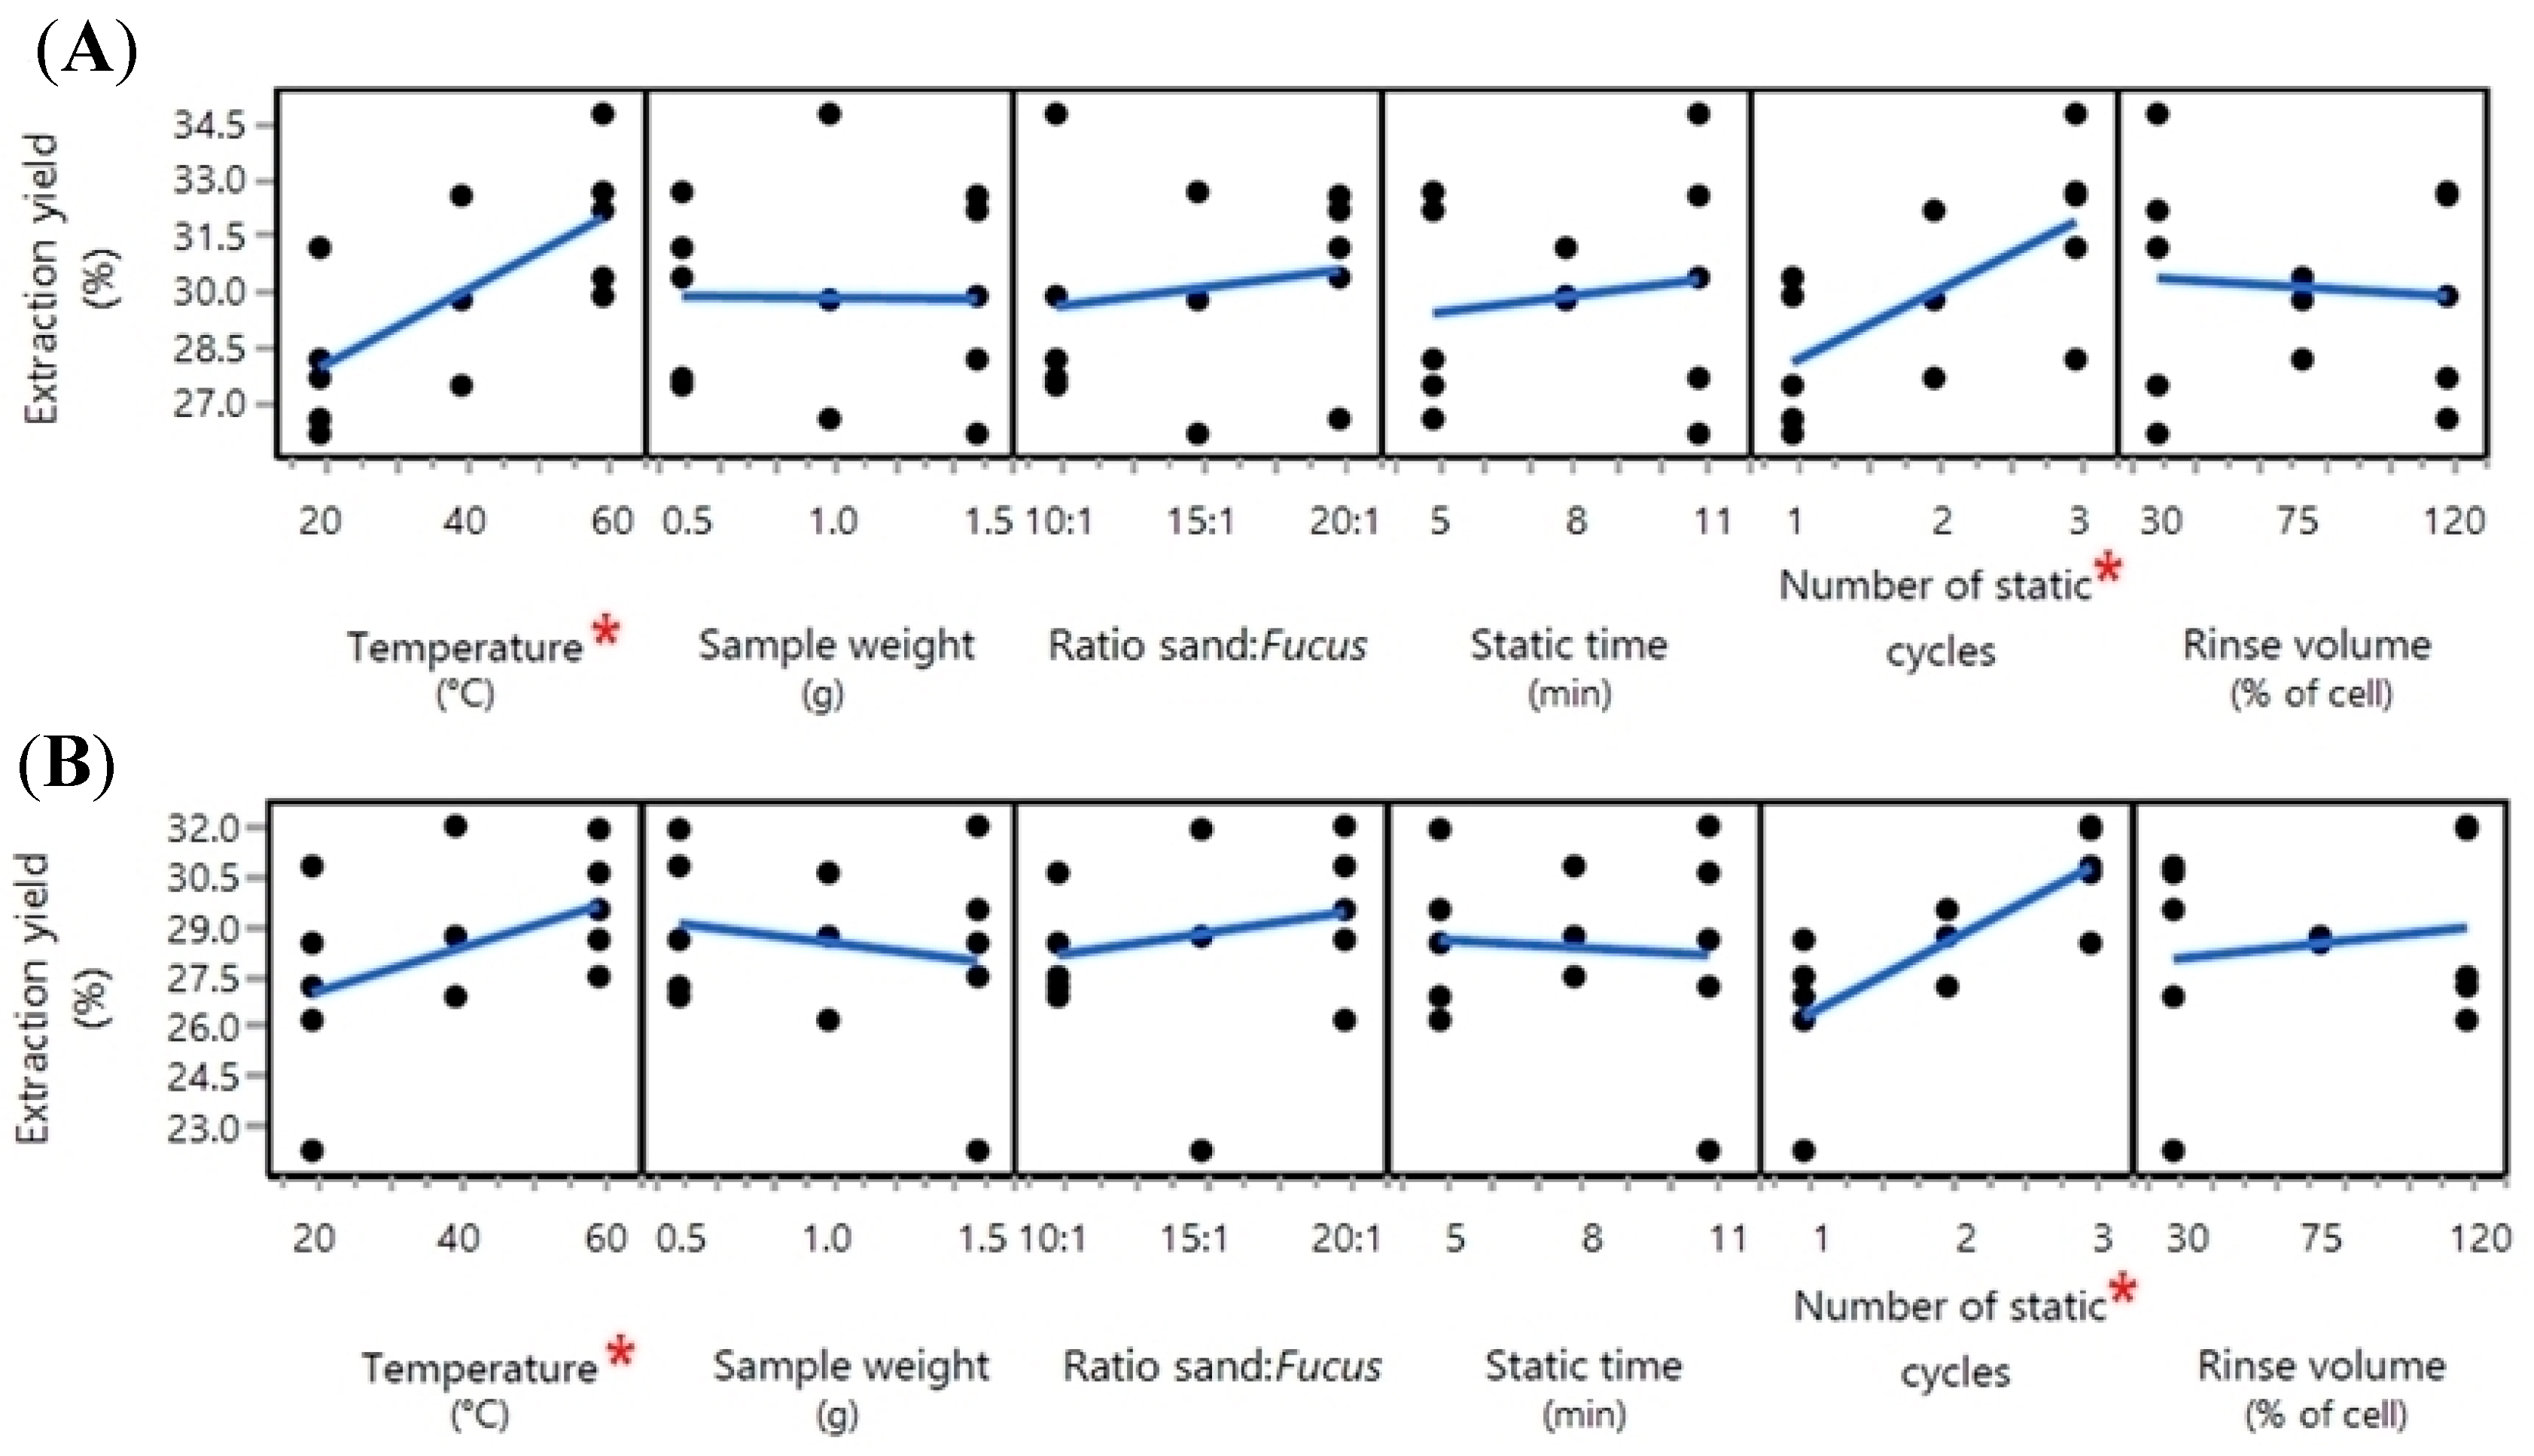
2.1. Optimisation of the PLE Conditions
2.1.1. The Water Extraction Step
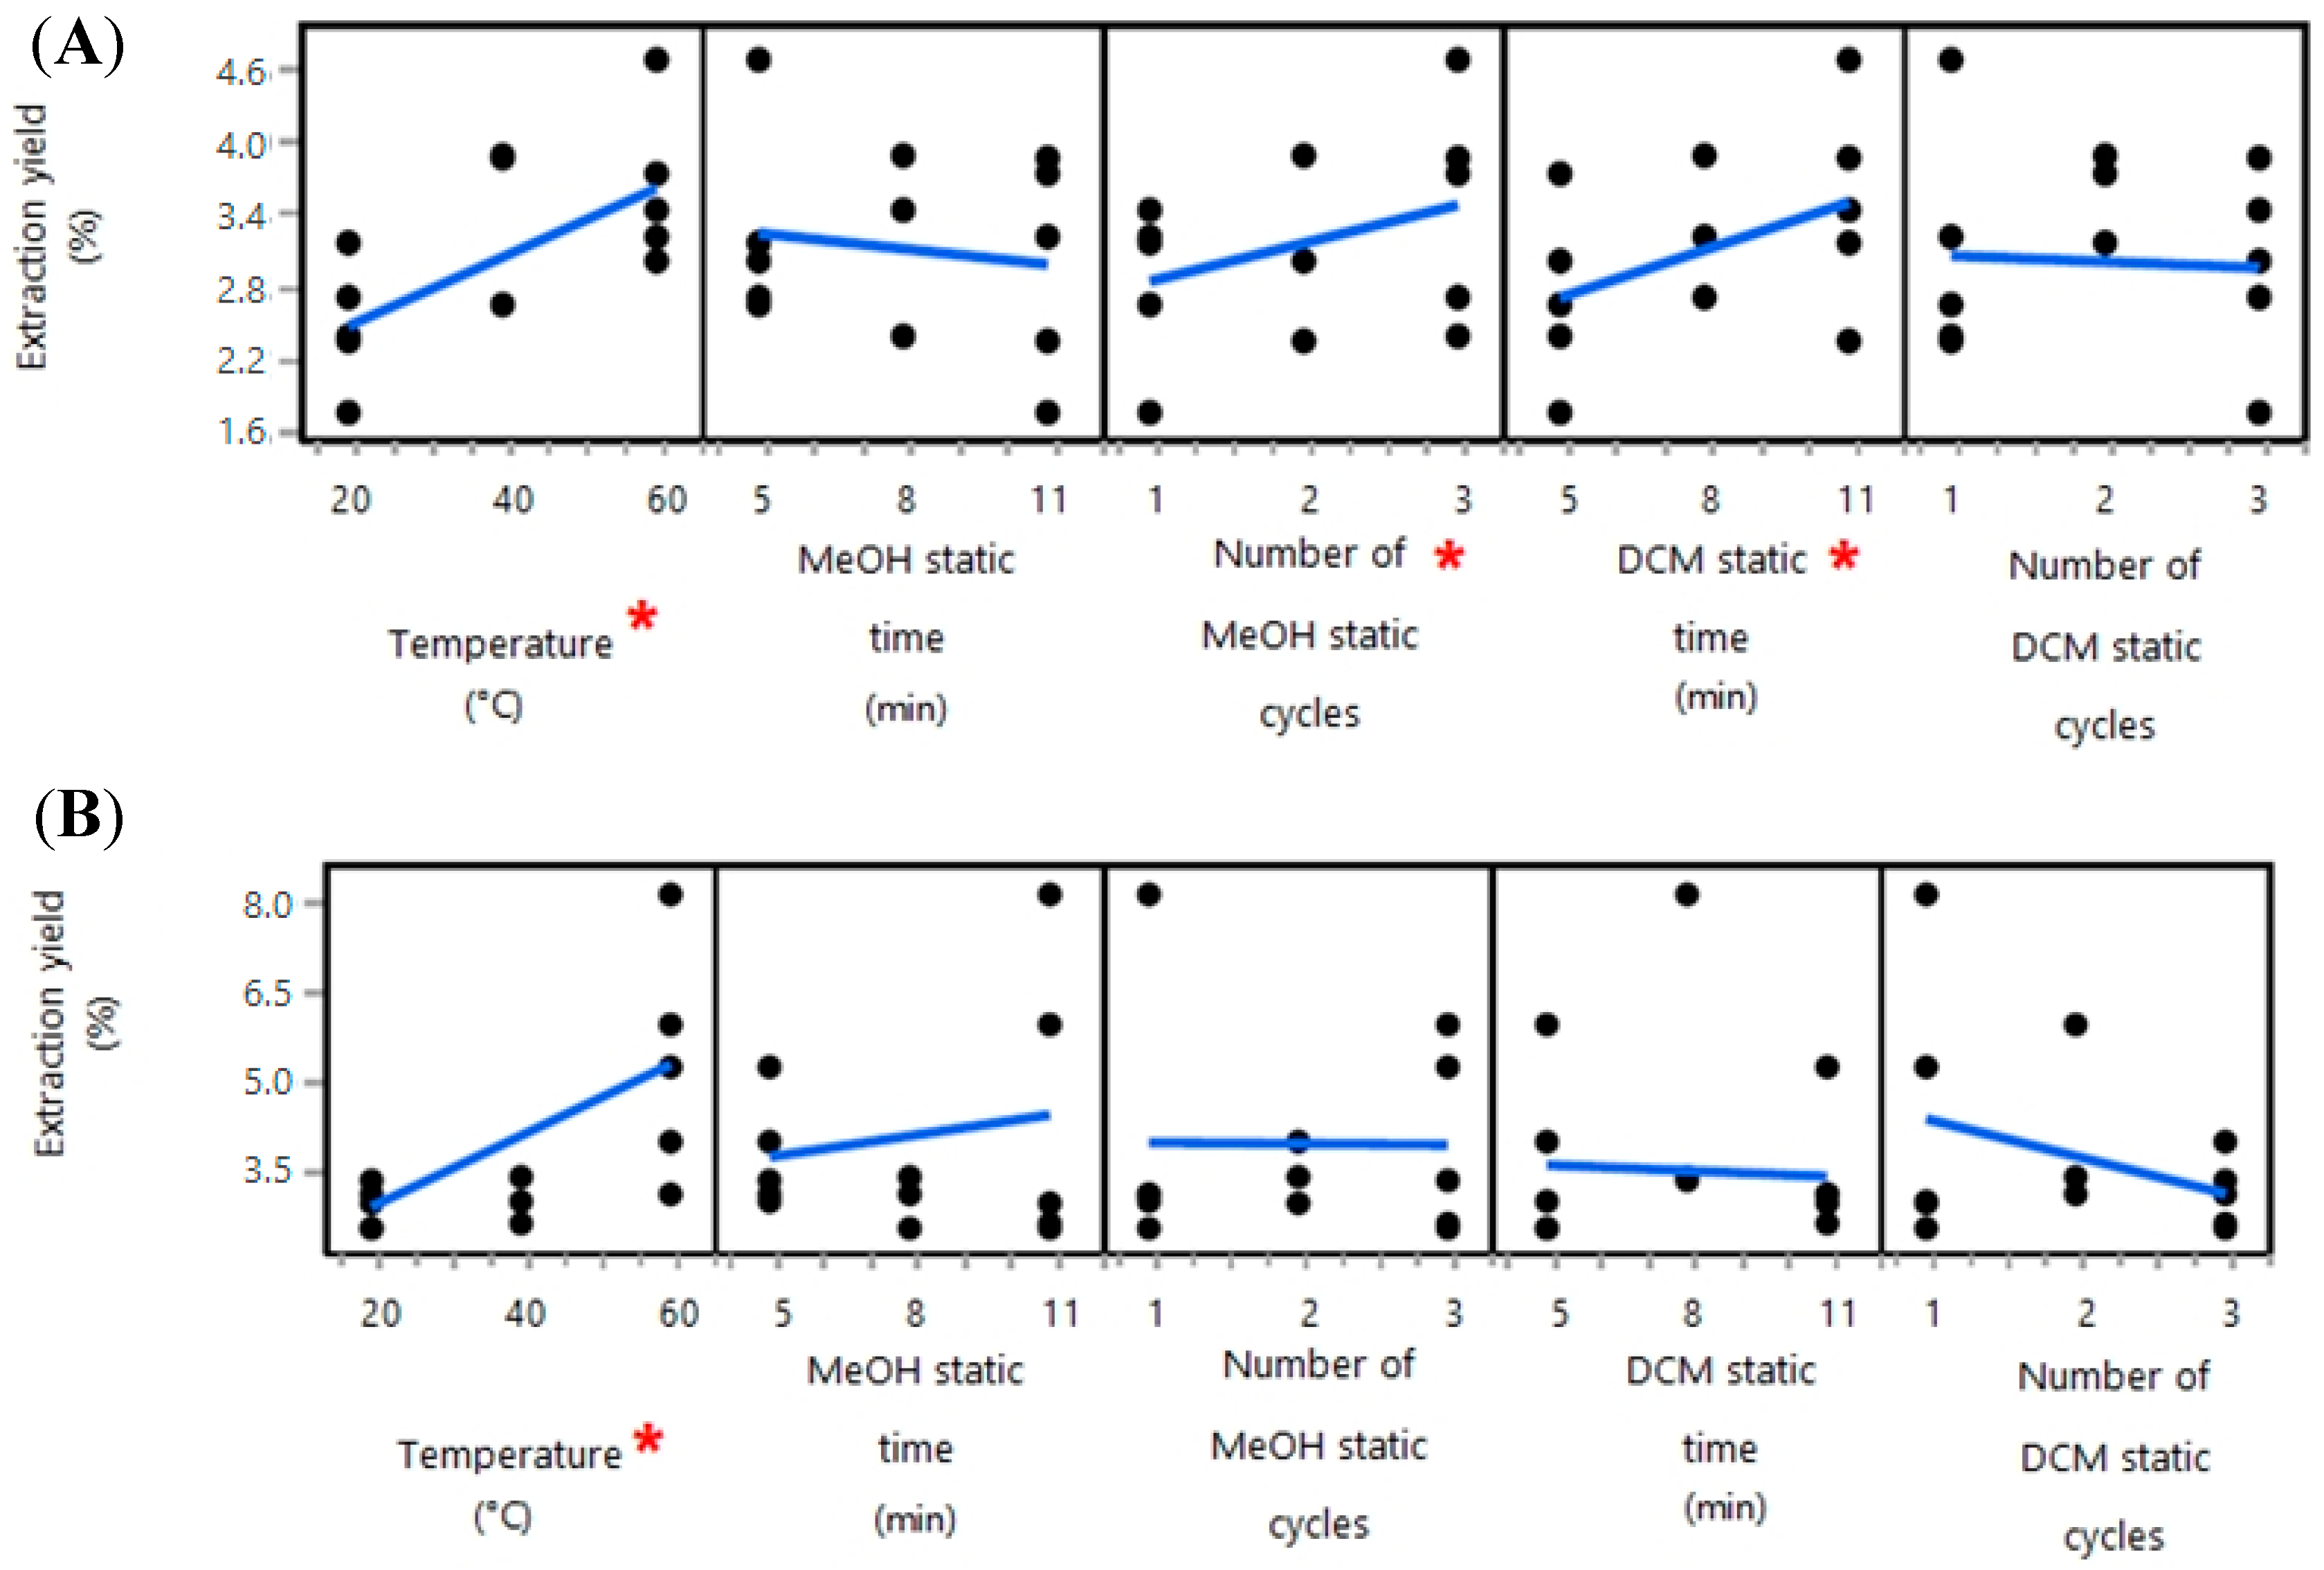
2.1.2. The Organic Solvent Extraction Step
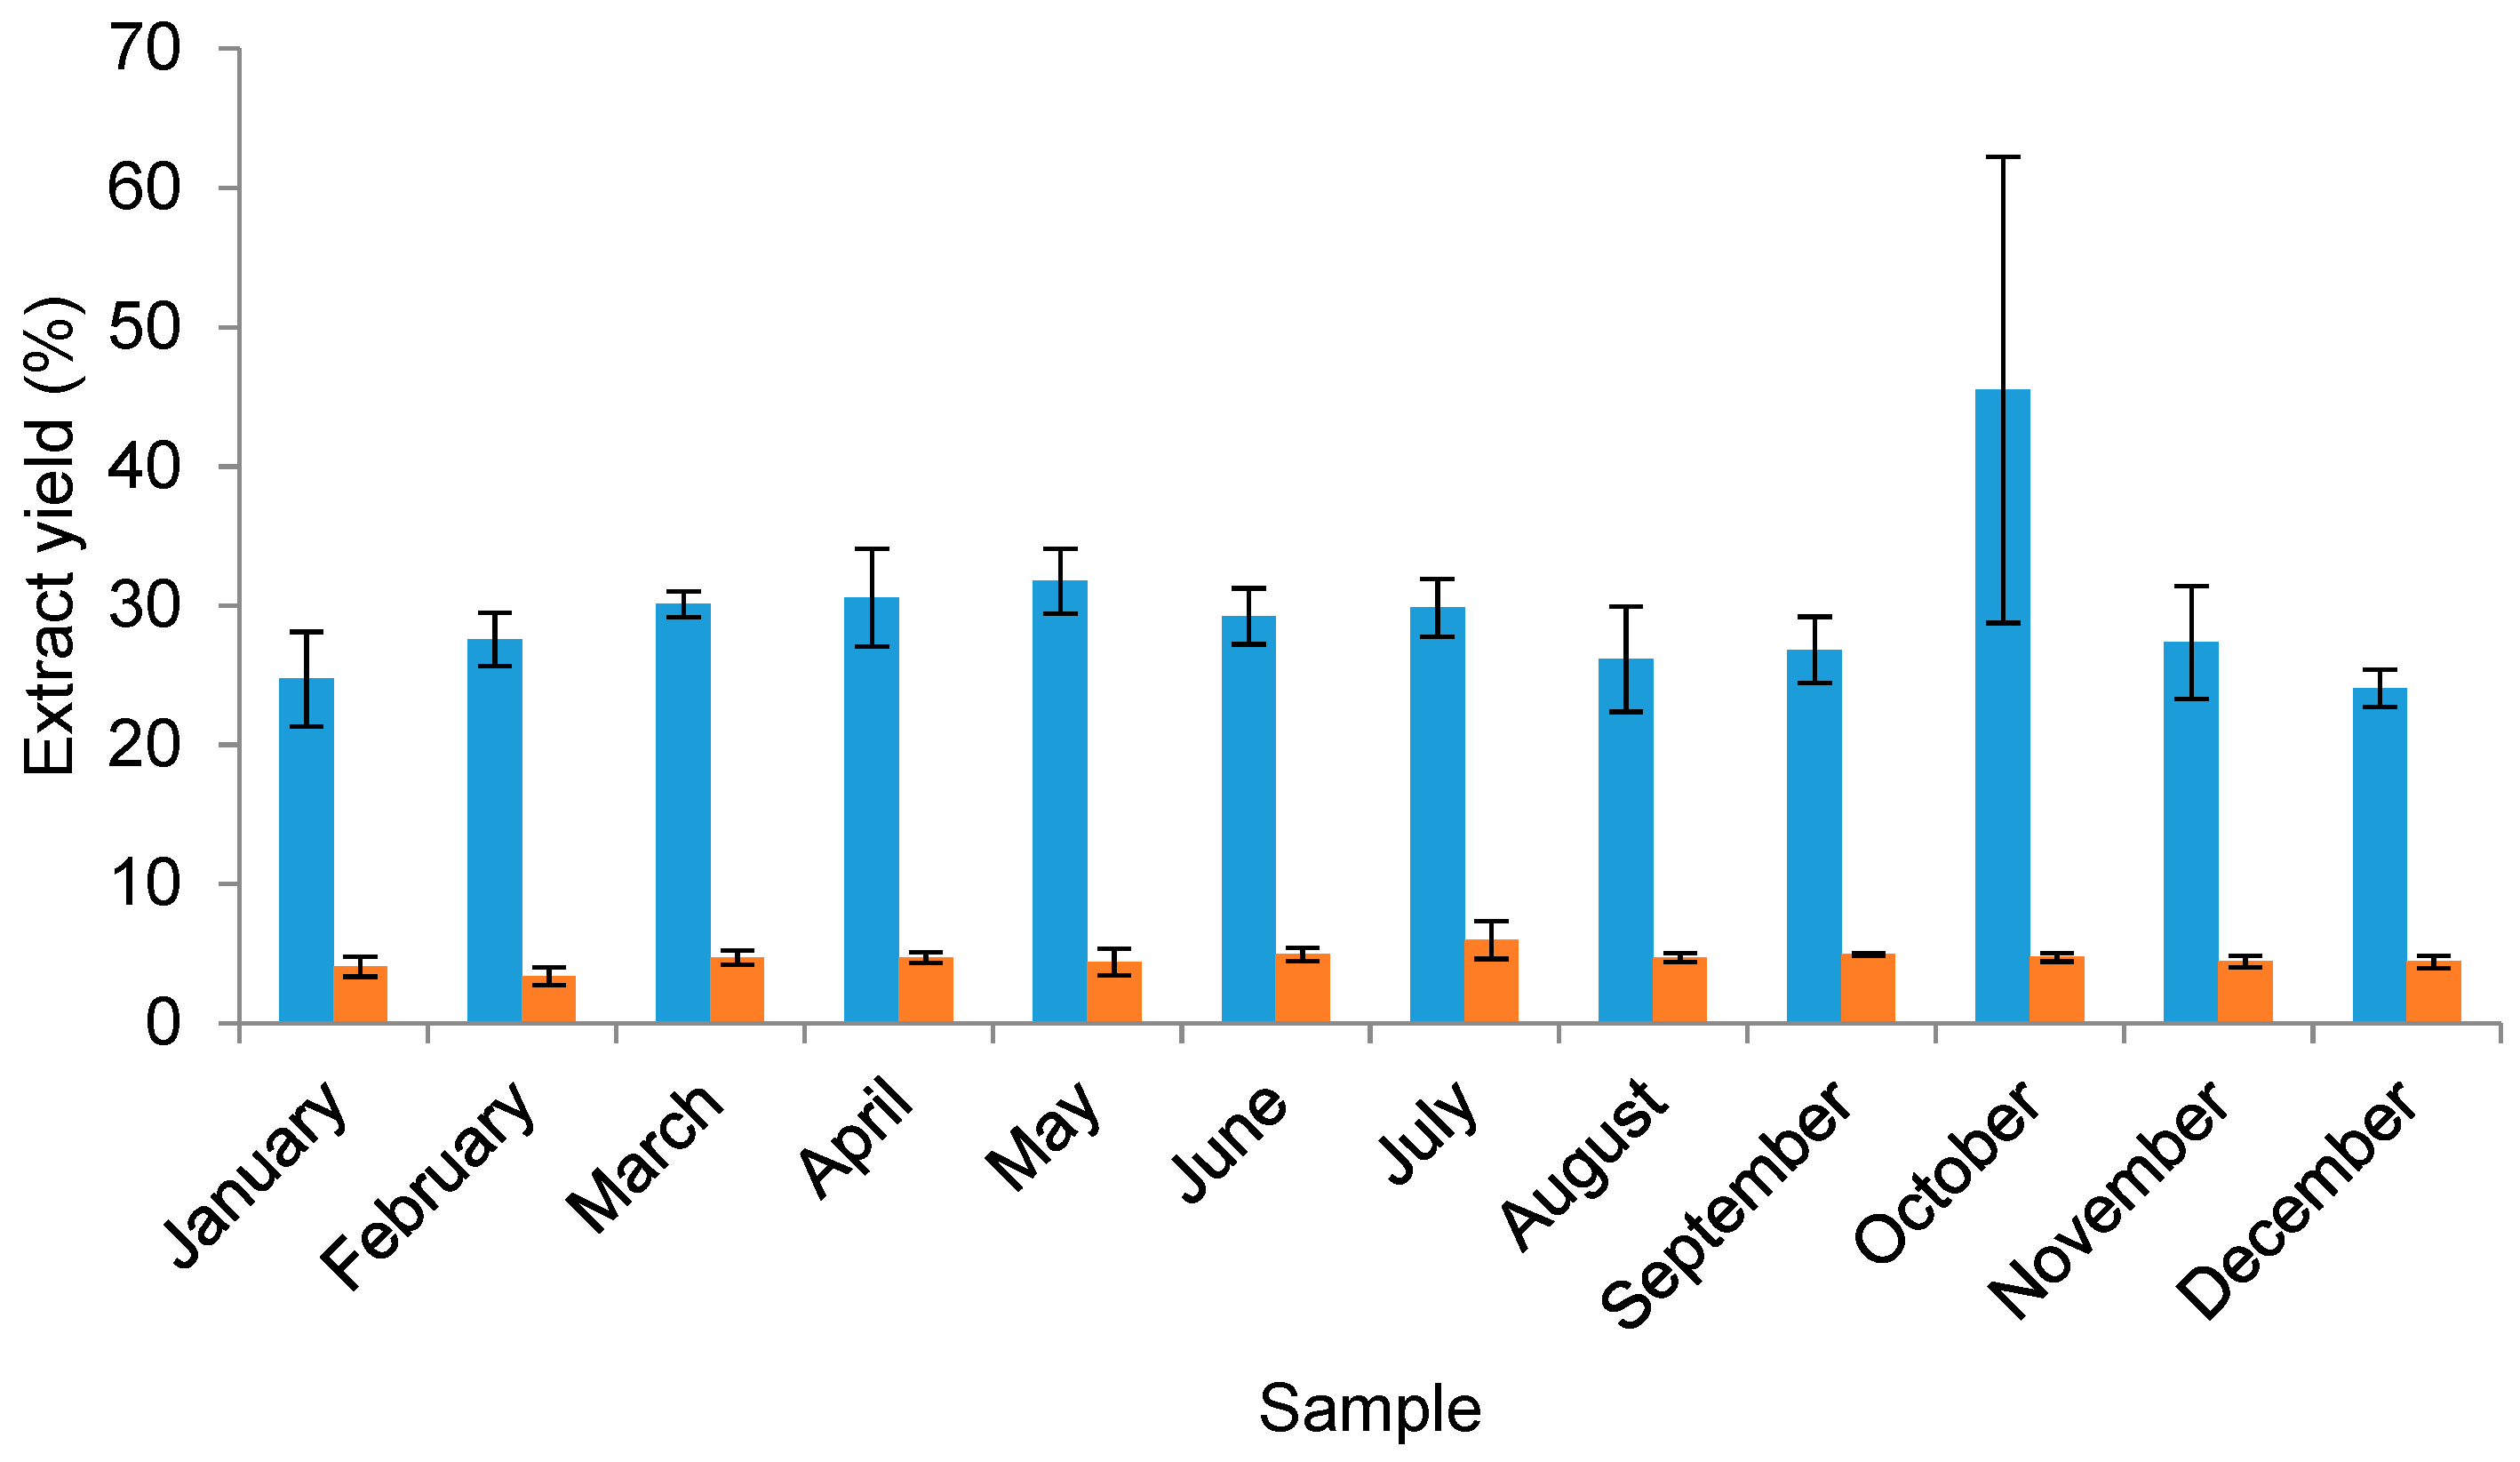
2.2. Analysis of the Monthly Extracts
2.2.1. The Yield of Water and Organic Solvent Extracts
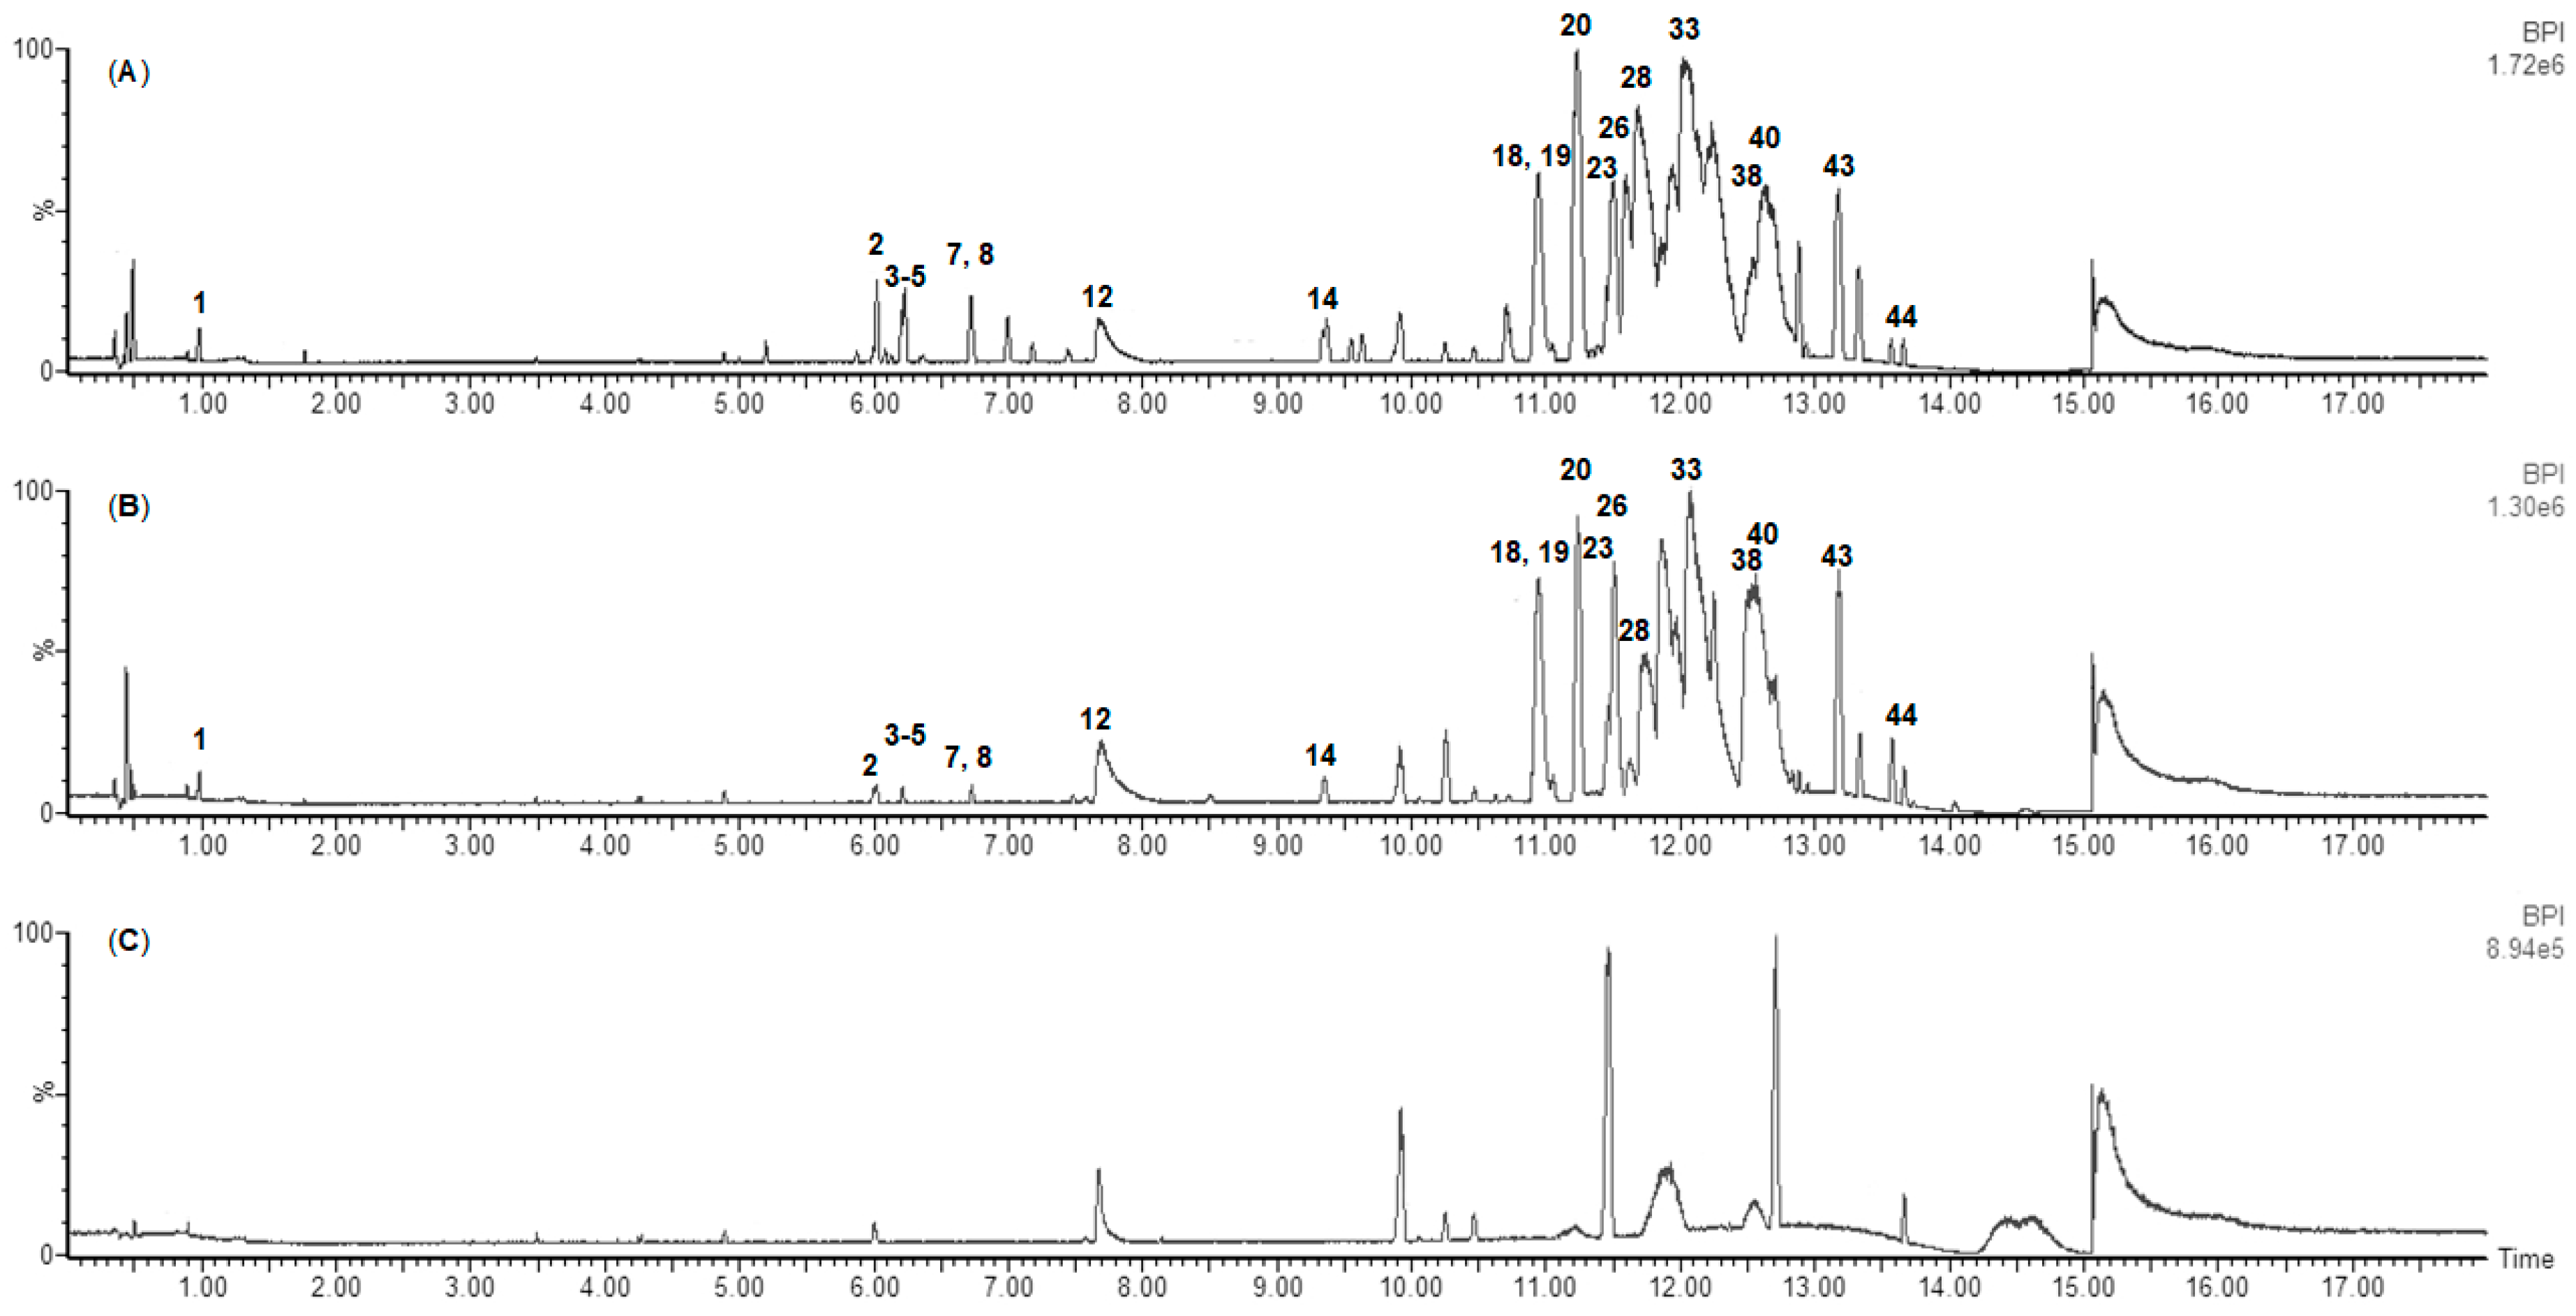
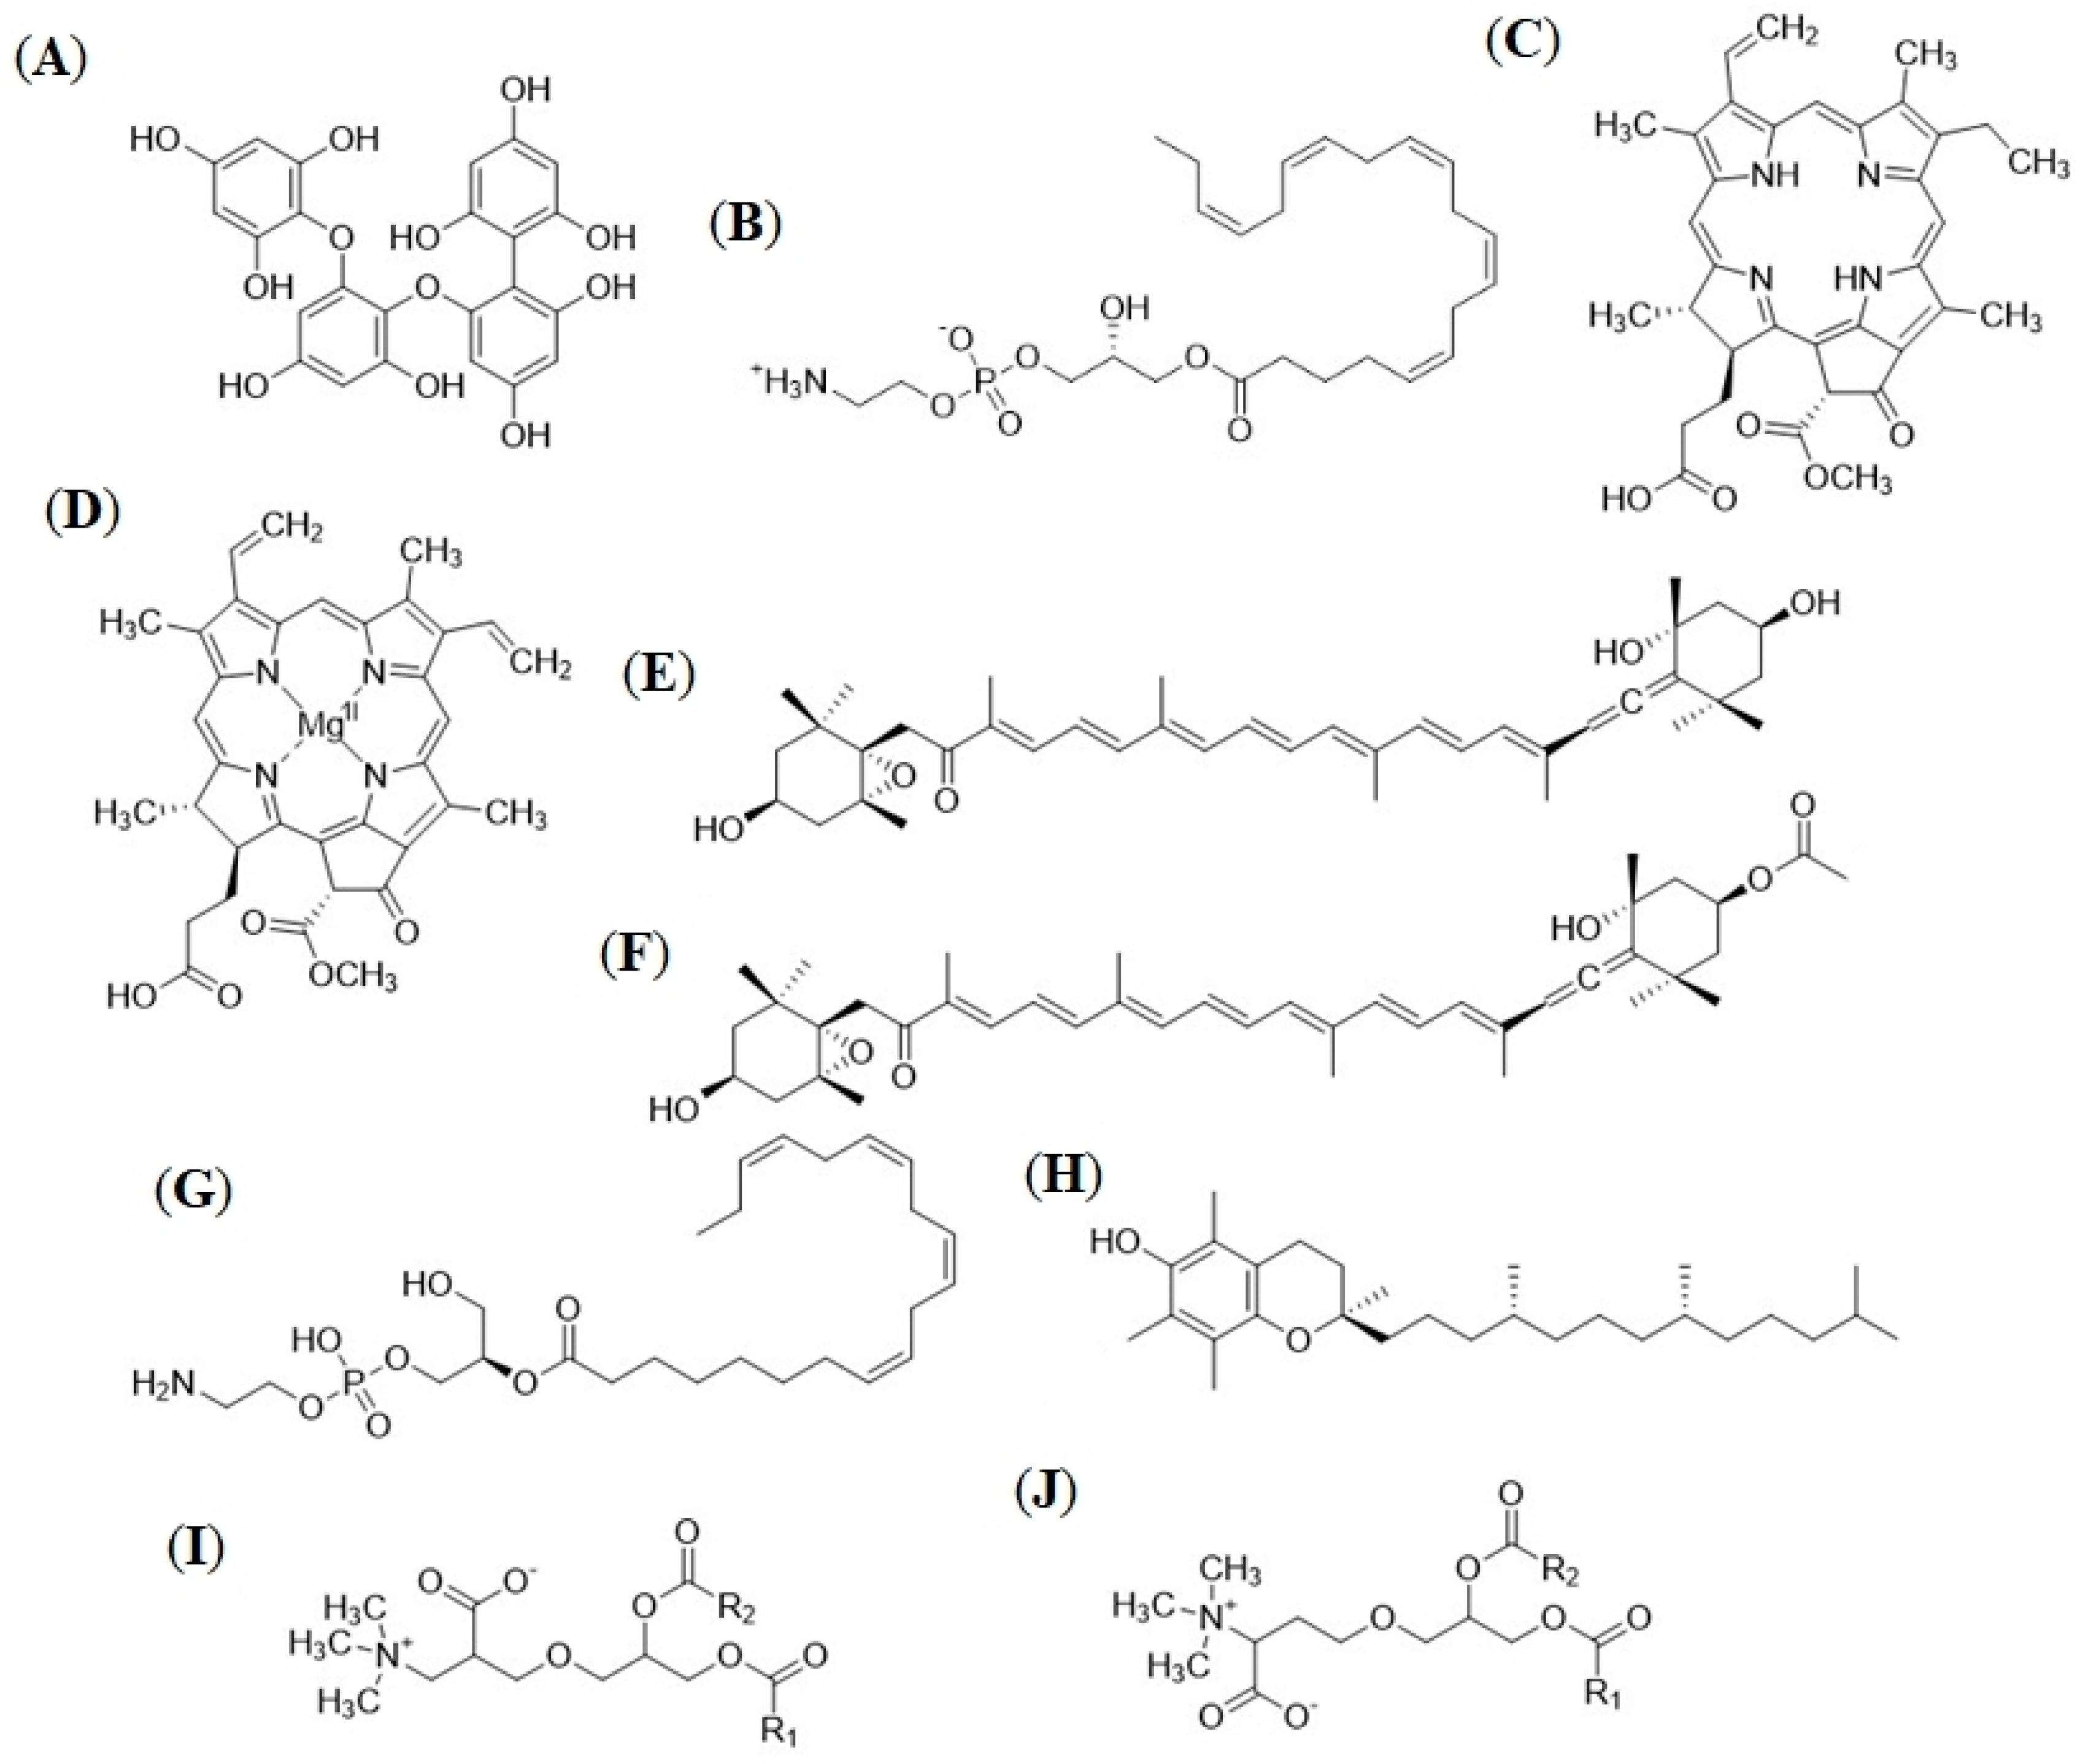
2.2.2. Metabolome Profiling of the F. vesiculosus Organic Solvent Extracts
2.2.3. Seasonally Varying Compounds in the F. vesiculosus Extracts
2.3. Bioactivity Screening
2.3.1. Effect of Organic Extracts on Pathogenic Microorganisms
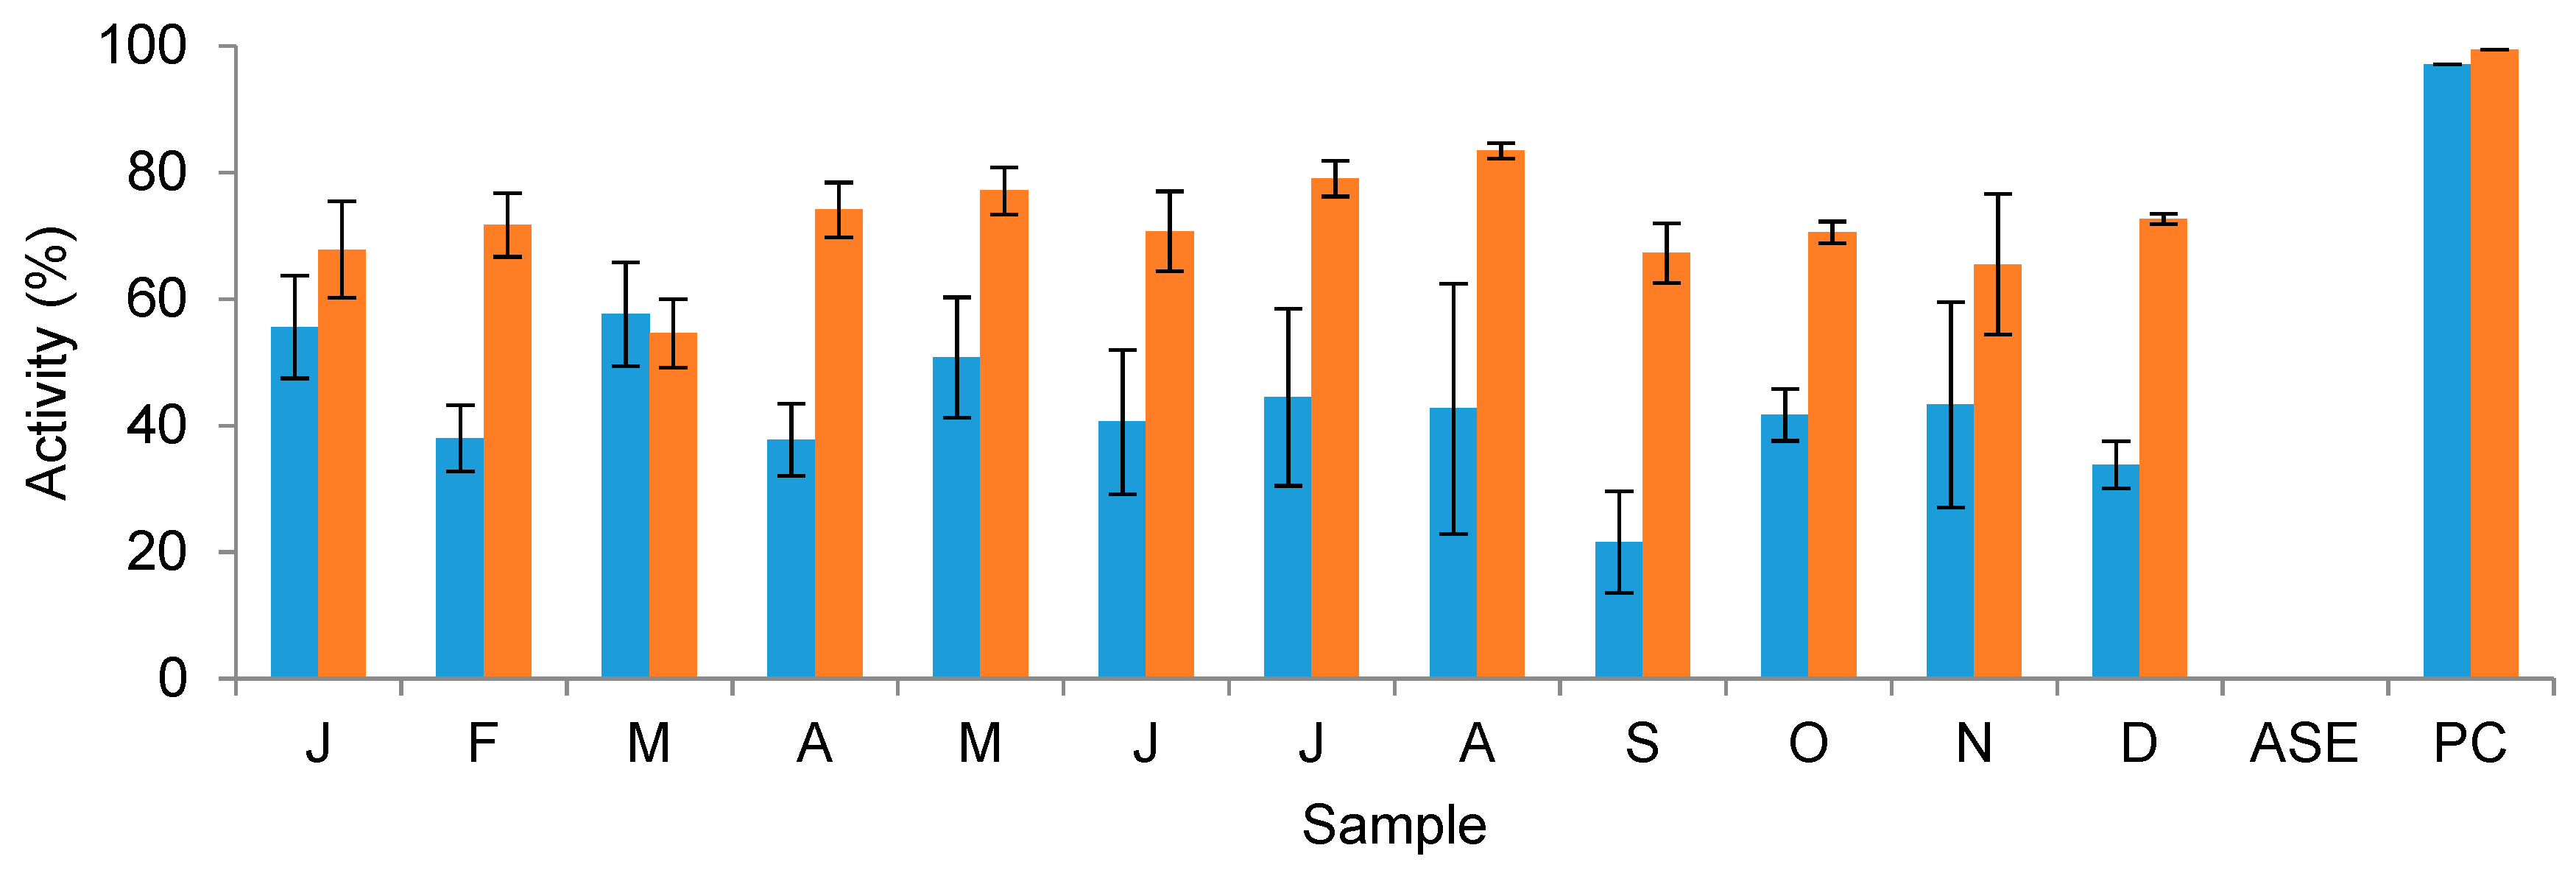
2.3.2. DPPH Free Radical Scavenging Activity
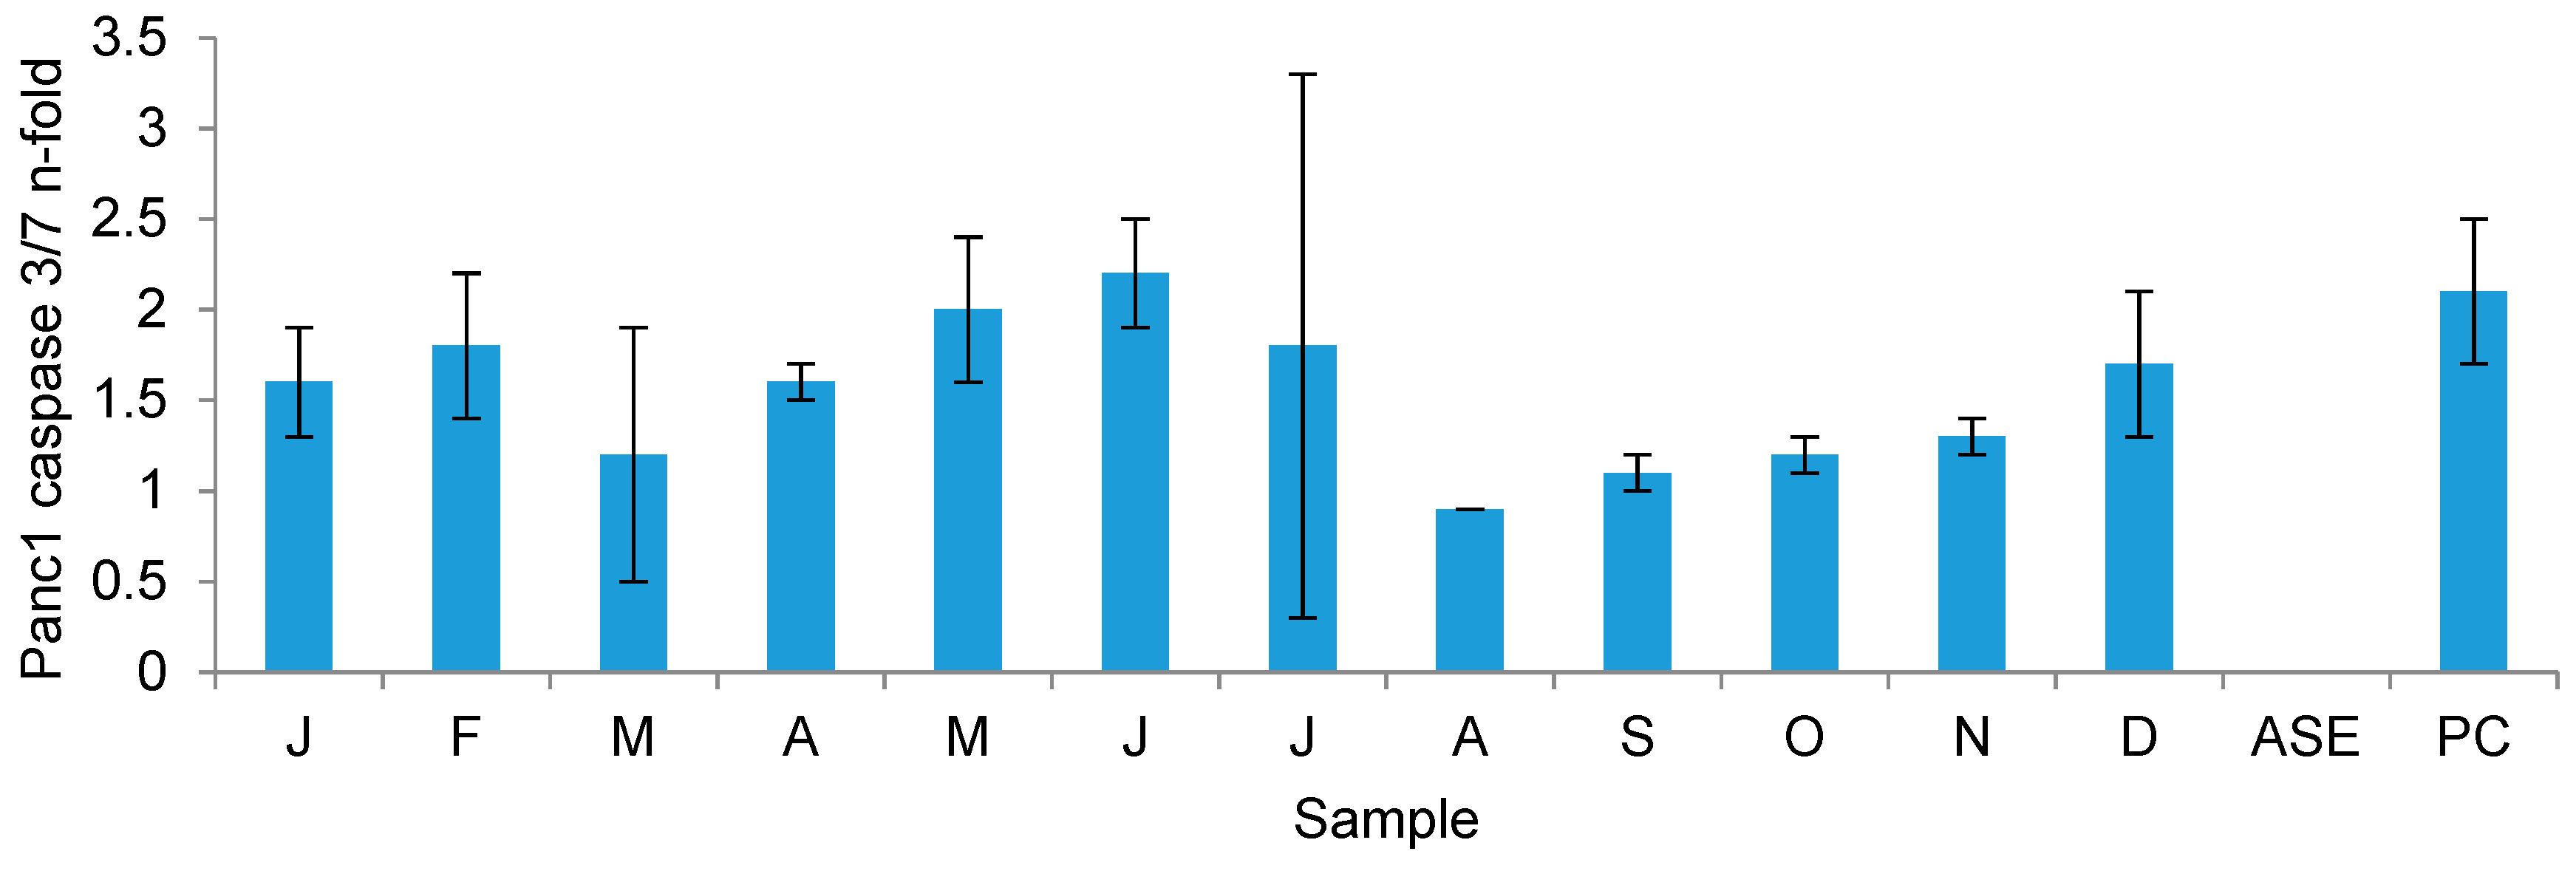
2.3.3. Growth Inhibitory Activity on Cancer Cell Lines
3. Discussion
3.1. Optimisation of a PLE Protocol for F. vesiculosus
3.2. In-Depth Untargeted Metabolomics of F. vesiculosus Extracts
3.3. Seasonal Changes in the Overall Metabolic Profile of F. vesiculosus
3.4. Seasonal Changes in the Bioactivity of F. vesiculosus Extracts
4. Materials and Methods
4.1. Algal Material
4.2. Pressurised Liquid Extraction
4.3. Determination of Optimal Extraction Conditions
4.3.1. Definitive Screening Design
4.3.2. The Water Extraction Step
4.3.3. The Organic Solvent Extraction Step
4.3.4. Determination of the Optimum Extraction Conditions and Analysis of Monthly Extracts
HPLC-PDA-ELSD
UPLC-PDA-ESI-QTOF-MSn
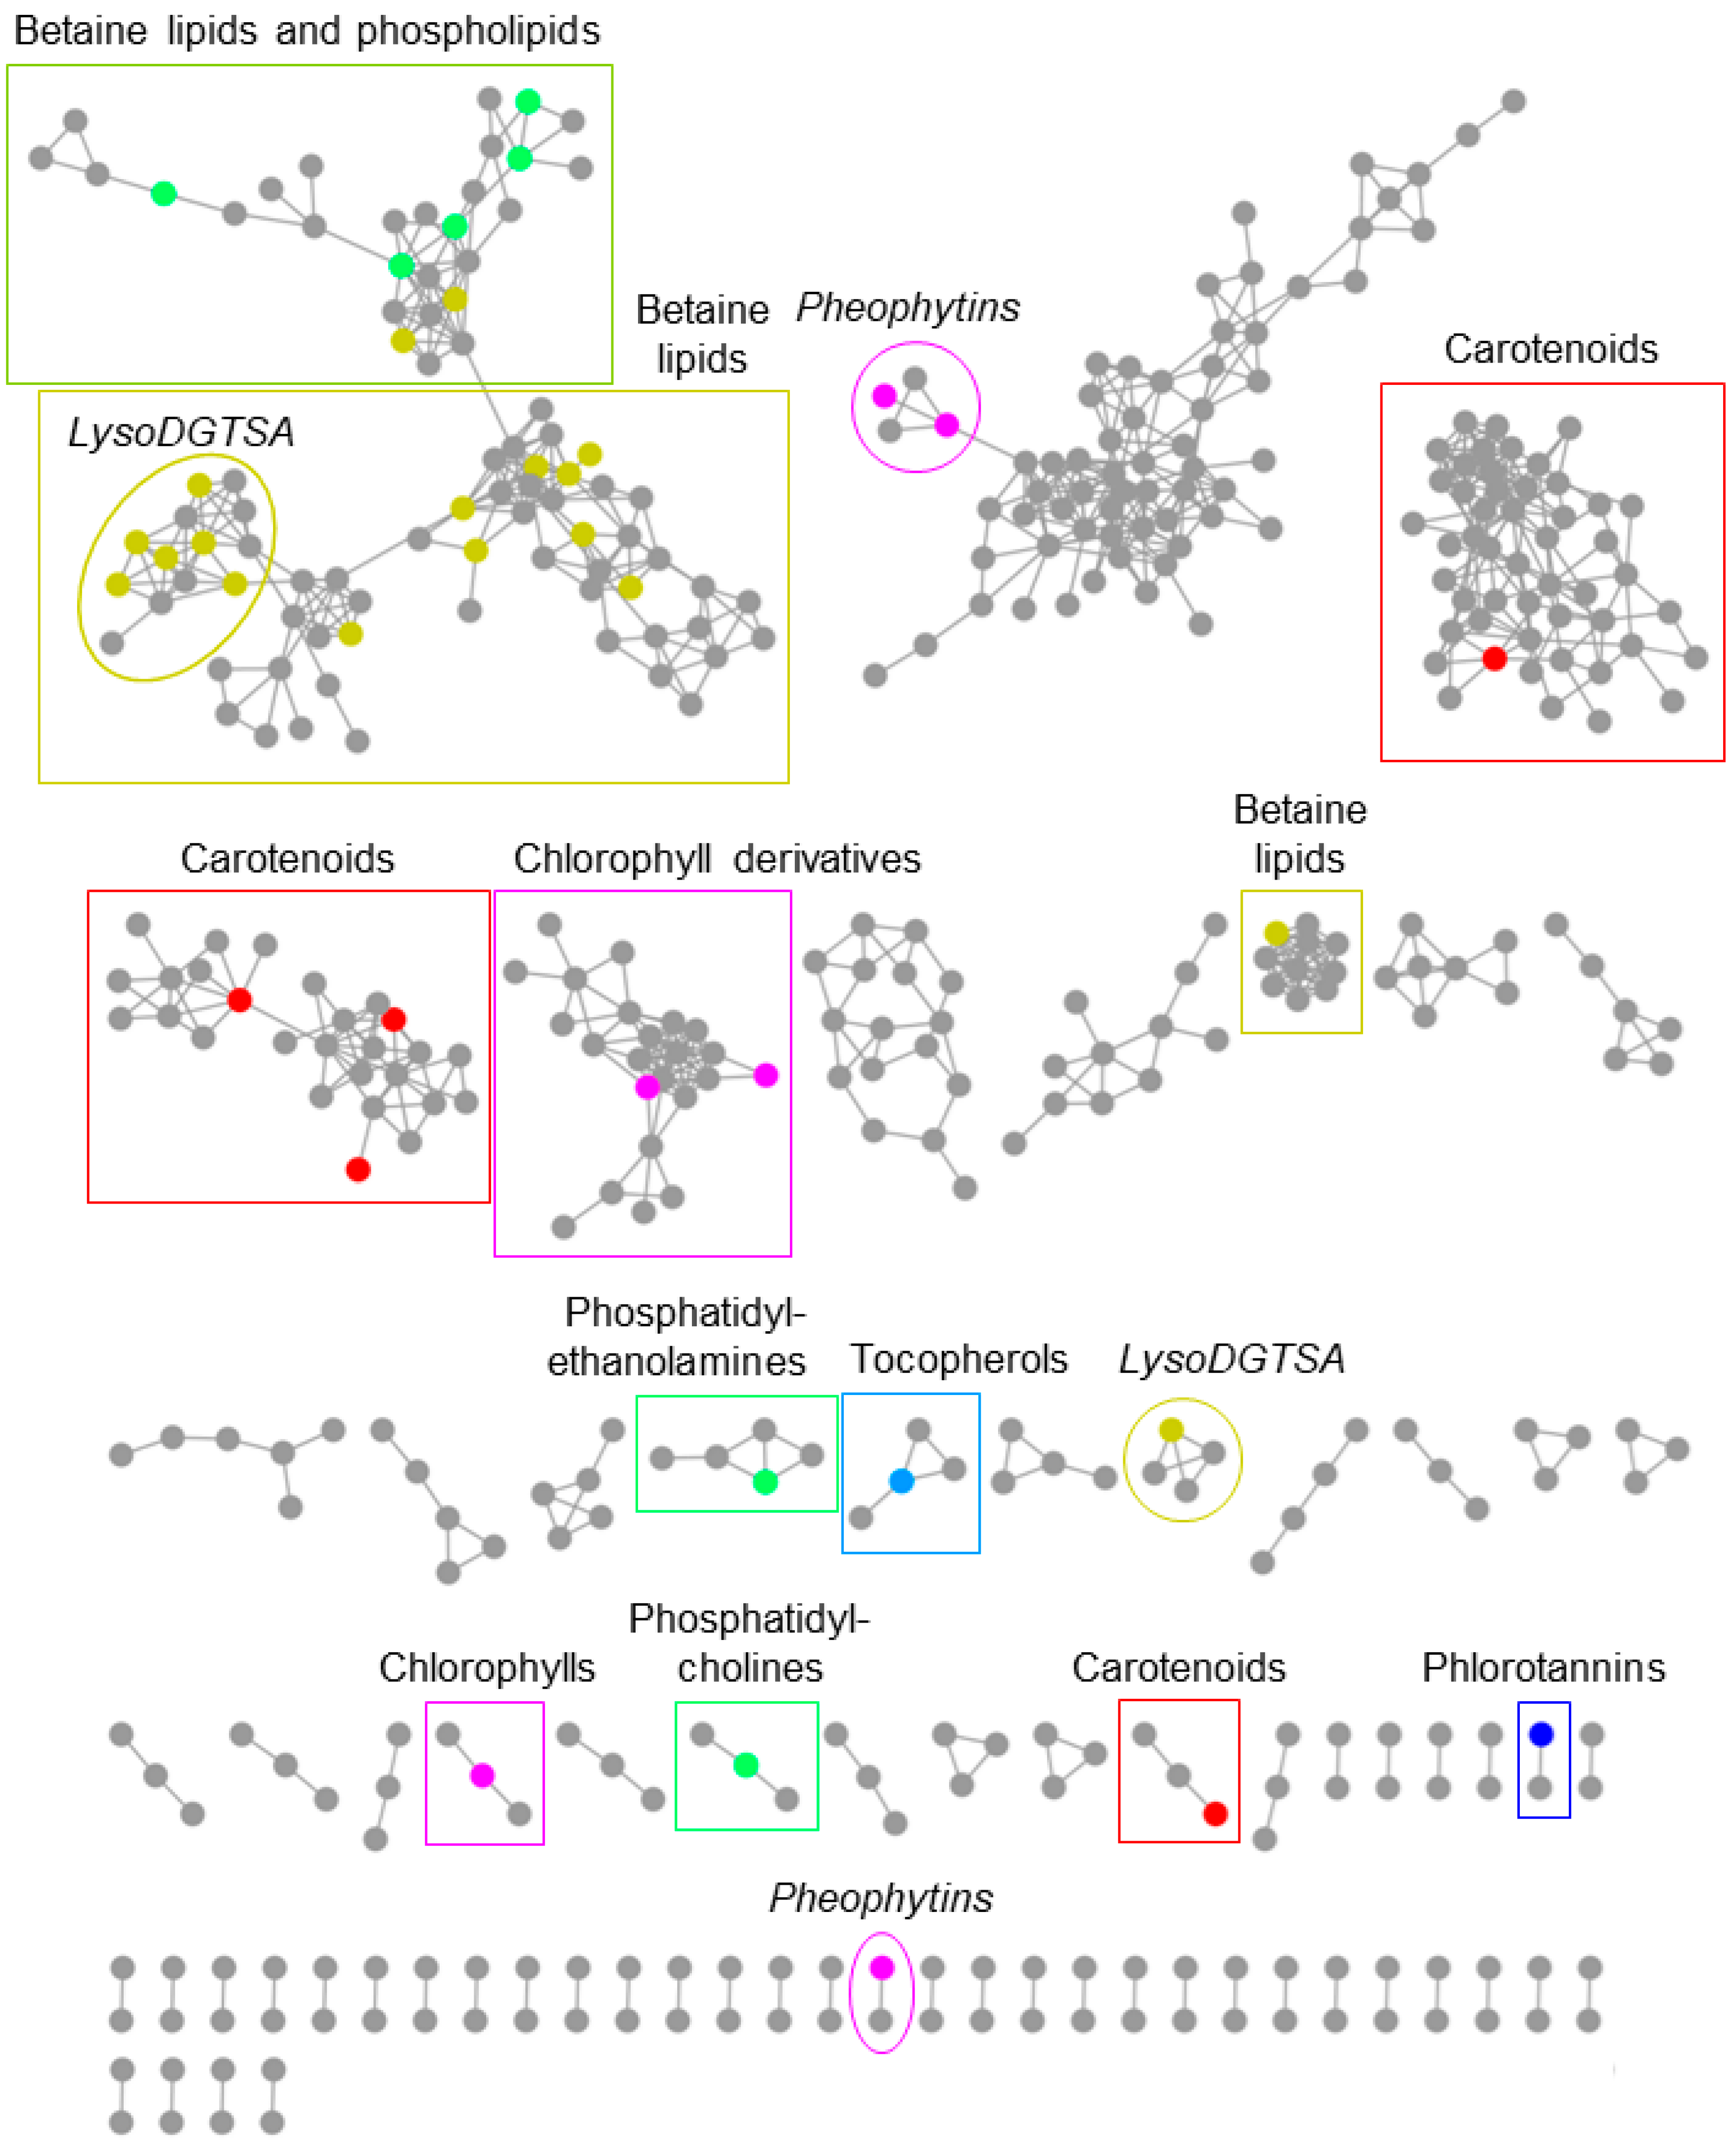
Molecular Networking
4.4. Bioassays
4.4.1. Antimicrobial Activity
4.4.2. Free Radical Scavenging Capacity
4.4.3. Anticancer and Cytotoxic Activity
5. Conclusions
Supplementary Materials
Author Contributions
Funding
Acknowledgments
Conflicts of Interest
References
- Egan, S.; Harder, T.; Burke, C.; Steinberg, P.; Kjelleberg, S.; Thomas, T. The seaweed holobiont: understanding seaweed-bacteria interactions. FEMS Microbiol. Rev. 2013, 37, 462–476. [Google Scholar] [CrossRef] [PubMed]
- Saha, M.; Wahl, M. Seasonal variation in the antifouling defence of the temperate brown alga Fucus vesiculosus. Biofouling 2013, 29, 661–668. [Google Scholar] [CrossRef] [PubMed]
- Pérez, M.; Falqué, E.; Domínguez, H. Antimicrobial action of compounds from marine seaweed. Mar. Drugs 2016, 14, 52. [Google Scholar] [CrossRef] [PubMed]
- Sanjeewa, K.K.A.; Lee, J.-S.; Kim, W.-S.; Jeon, Y.-J. The potential of brown-algae polysaccharides for the development of anticancer agents: An update on anticancer effects reported for fucoidan and laminaran. Carbohydr. Polym. 2017, 177, 451–459. [Google Scholar] [CrossRef] [PubMed]
- Jones, B.; Nachtsheim, C.J. A class of three-level designs for definitive screening in the presence of second-order effects. J. Qual. Technol. 2011, 43, 1–15. [Google Scholar] [CrossRef]
- Hecht, E.S.; McCord, J.P.; Muddiman, D.C. Definitive screening design optimization of mass spectrometry parameters for sensitive comparison of filter and solid phase extraction purified, INLIGHT plasma N-glycans. Anal. Chem. 2015, 87, 7305–7312. [Google Scholar] [CrossRef] [PubMed]
- Erler, A.; Mas, N.D.; Ramsey, P.; Henderson, G. Efficient biological process characterization by definitive-screening designs: The formaldehyde treatment of a therapeutic protein as a case study. Biotechnol. Lett. 2012, 35, 323–329. [Google Scholar] [CrossRef] [PubMed]
- Tai, M.; Ly, A.; Leung, I.; Nayar, G. Efficient high-throughput biological process characterization: Definitive screening design with the Ambr250 bioreactor system. Biotechnol. Prog. 2015, 31, 1388–1395. [Google Scholar] [CrossRef] [PubMed]
- Li, Y.; Fu, X.; Duan, D.; Liu, X.; Xu, J.; Gao, X. Extraction and identification of phlorotannins from the brown alga, Sargassum fusiforme (Harvey) Setchell. Mar. Drugs 2017, 15, 49. [Google Scholar] [CrossRef] [PubMed]
- Leyton, A.; Pezoa-Conte, R.; Barriga, A.; Buschmann, A.H.; Mäki-Arvela, P.; Mikkola, J.-P.; Lienqueo, M.E. Identification and efficient extraction method of phlorotannins from the brown seaweed Macrocystis pyrifera using an orthogonal experimental design. Algal Res. 2016, 16, 201–208. [Google Scholar] [CrossRef]
- Heffernan, N.; Smyth, T.J.; FitzGerald, R.J.; Vila-Soler, A.; Mendiola, J.; Ibáñez, E.; Brunton, N.P. Comparison of extraction methods for selected carotenoids from macroalgae and the assessment of their seasonal/spatial variation. Innov. Food Sci. Emerg. Technol. 2016, 37, 221–228. [Google Scholar] [CrossRef] [Green Version]
- Kumagai, M.; Nishikawa, K.; Matsuura, H.; Umezawa, T.; Matsuda, F.; Okino, T. Antioxidants from the brown alga Dictyopteris undulata. Molecules 2018, 23, 1214. [Google Scholar] [CrossRef] [PubMed]
- Wang, T.; Jonsdottir, R.; Liu, H.; Gu, L.; Kristinsson, H.G.; Raghavan, S.; Olafsdottir, G. Antioxidant capacities of phlorotannins extracted from the brown algae Fucus vesiculosus. J. Agric. Food Chem. 2012, 60, 5874–5883. [Google Scholar] [CrossRef] [PubMed]
- Treyvaud Amiguet, V.; Jewell, L.E.; Mao, H.; Sharma, M.; Hudson, J.B.; Durst, T.; Allard, M.; Rochefort, G.; Arnason, J.T. Antibacterial properties of a glycolipid-rich extract and active principle from Nunavik collections of the macroalgae Fucus evanescens C. Agardh (Fucaceae). Can. J. Microbiol. 2011, 57, 745–749. [Google Scholar] [CrossRef]
- Tierney, M.S.; Smyth, T.J.; Rai, D.K.; Soler-Vila, A.; Croft, A.K.; Brunton, N. Enrichment of polyphenol contents and antioxidant activities of Irish brown macroalgae using food-friendly techniques based on polarity and molecular size. Food Chem. 2013, 139, 753–761. [Google Scholar] [CrossRef] [PubMed]
- Grosso, C.; Valentão, P.; Ferreres, F.; Andrade, P.B. Alternative and efficient extraction methods for marine-derived compounds. Mar. Drugs 2015, 13, 3182–3230. [Google Scholar] [CrossRef] [PubMed]
- Shang, Y.F.; Kim, S.M.; Lee, W.J.; Um, B.-H. Pressurized liquid method for fucoxanthin extraction from Eisenia bicyclis (Kjellman) Setchell. J. Biosci. Bioeng. 2011, 111, 237–241. [Google Scholar] [CrossRef] [PubMed]
- Otero, P.; Quintana, S.; Reglero, G.; Fornari, T.; García-Risco, M.; Otero, P.; Quintana, S.E.; Reglero, G.; Fornari, T.; García-Risco, M.R. Pressurized liquid extraction (PLE) as an innovative green technology for the effective enrichment of galician algae extracts with high quality fatty acids and antimicrobial and antioxidant properties. Mar. Drugs 2018, 16, 156. [Google Scholar] [CrossRef]
- Catarino, M.; Silva, A.; Cardoso, S.; Catarino, M.D.; Silva, A.M.S.; Cardoso, S.M. Phycochemical constituents and biological activities of Fucus spp. Mar. Drugs 2018, 16, 249. [Google Scholar] [CrossRef]
- Li, Y.-X.; Wijesekara, I.; Li, Y.; Kim, S.-K. Phlorotannins as bioactive agents from brown algae. Process Biochem. 2011, 46, 2219–2224. [Google Scholar] [CrossRef]
- Pavia, H.; Cervin, G.; Lindgren, A.; Åberg, P. Effects of UV-B radiation and simulated herbivory on phlorotannins in the brown alga Ascophyllum nodosum. Mar. Ecol. Prog. Ser. 1997, 157, 139–146. [Google Scholar] [CrossRef]
- Eom, S.-H.; Kim, Y.-M.; Kim, S.-K. Antimicrobial effect of phlorotannins from marine brown algae. Food Chem. Toxicol. 2012, 50, 3251–3255. [Google Scholar] [CrossRef] [PubMed]
- Sathya, R.; Kanaga, N.; Sankar, P.; Jeeva, S. Antioxidant properties of phlorotannins from brown seaweed Cystoseira trinodis (Forsskål) C. Agardh. Arab. J. Chem. 2017, 10, S2608–S2614. [Google Scholar] [CrossRef]
- Peng, J.; Yuan, J.-P.; Wu, C.-F.; Wang, J.-H. Fucoxanthin, a marine carotenoid present in brown seaweeds and diatoms: Metabolism and bioactivities relevant to human health. Mar. Drugs 2011, 9, 1806–1828. [Google Scholar] [CrossRef]
- Hosokawa, M.; Wanezaki, S.; Miyauchi, K.; Kurihara, H.; Kohno, H.; Kawabata, J.; Odashima, S.; Takahashi, K. Apoptosis-inducing effect of fucoxanthin on human leukemia cell line HL-60. Food Sci. Technol. Res. 1999, 5, 243–246. [Google Scholar] [CrossRef]
- Maeda, H.; Hosokawa, M.; Sashima, T.; Murakami-Funayama, K.; Miyashita, K. Anti-obesity and anti-diabetic effects of fucoxanthin on diet-induced obesity conditions in a murine model. Mol. Med. Rep. 2009, 2, 897–902. [Google Scholar] [CrossRef] [PubMed]
- Afolayan, A.F.; Bolton, J.J.; Lategan, C.A.; Smith, P.J.; Beukes, D.R. Fucoxanthin, tetraprenylated toluquinone and toluhydroquinone metabolites from Sargassum heterophyllum inhibit the in vitro growth of the malaria parasite Plasmodium falciparum. Z. Naturforschung C J. Biosci. 2008, 63, 848–852. [Google Scholar] [CrossRef]
- Silva, T.H.; Alves, A.; Popa, E.G.; Reys, L.L.; Gomes, M.E.; Sousa, R.A.; Silva, S.S.; Mano, J.F.; Reis, R.L. Marine algae sulfated polysaccharides for tissue engineering and drug delivery approaches. Biomatter 2012, 2, 278–289. [Google Scholar] [CrossRef] [PubMed] [Green Version]
- Ngo, D.-H.; Kim, S.-K. Sulfated polysaccharides as bioactive agents from marine algae. Int. J. Biol. Macromol. 2013, 62, 70–75. [Google Scholar] [CrossRef] [PubMed]
- de Jesus Raposo, M.F.; de Morais, A.M.B.; de Morais, R.M.S.C. Marine polysaccharides from algae with potential biomedical applications. Mar. Drugs 2015, 13, 2967–3028. [Google Scholar] [CrossRef]
- Skriptsova, A.V. Seasonal variations in the fucoidan content of brown algae from Peter the Great Bay, Sea of Japan. Russ. J. Mar. Biol. 203316, 42, 351–356. [Google Scholar] [CrossRef]
- Fletcher, H.R.; Biller, P.; Ross, A.B.; Adams, J.M.M. The seasonal variation of fucoidan within three species of brown macroalgae. Algal Res. 2017, 22, 79–86. [Google Scholar] [CrossRef]
- Rickert, E.; Wahl, M.; Link, H.; Richter, H.; Pohnert, G. Seasonal variations in surface metabolite composition of Fucus vesiculosus and Fucus serratus from the Baltic Sea. PLoS ONE 2016, 11, e0168196. [Google Scholar] [CrossRef] [PubMed]
- Hermund, D.B.; Plaza, M.; Turner, C.; Jónsdóttir, R.; Kristinsson, H.G.; Jacobsen, C.; Nielsen, K.F. Structure dependent antioxidant capacity of phlorotannins from Icelandic Fucus vesiculosus by UHPLC-DAD-ECD-QTOFMS. Food Chem. 2018, 240, 904–909. [Google Scholar] [CrossRef] [PubMed]
- Geisen, U.; Zenthoefer, M.; Peipp, M.; Kerber, J.; Plenge, J.; Manago, A.; Fuhrmann, M.; Geyer, R.; Hennig, S.; Adam, D.; et al. Molecular mechanisms by which a Fucus vesiculosus extract mediates cell cycle inhibition and cell death in pancreatic cancer cells. Mar. Drugs 2015, 13, 4470–4491. [Google Scholar] [CrossRef] [PubMed]
- Zenthoefer, M.; Geisen, U.; Hofmann-Peiker, K.; Fuhrmann, M.; Kerber, J.; Kirchhöfer, R.; Hennig, S.; Peipp, M.; Geyer, R.; Piker, L.; et al. Isolation of polyphenols with anticancer activity from the Baltic Sea brown seaweed Fucus vesiculosus using bioassay-guided fractionation. J. Appl. Phycol. 2017, 29, 2021–2037. [Google Scholar] [CrossRef]
- Smyrniotopoulos, V.; Merten, C.; Kaiser, M.; Tasdemir, D. Bifurcatriol, a new antiprotozoal acyclic diterpene from the brown alga Bifurcaria bifurcata. Mar. Drugs 2017, 15, 245. [Google Scholar] [CrossRef] [PubMed]
- Demirel, Z.; Yilmaz-Koz, F.; Karabay-Yavasoglu, U.; Özdemir, G.; Sukatar, A. Antimicrobial and antioxidant activity of brown algae from the Aegean Sea. J. Serbian Chem. Soc. 2009, 74, 619–628. [Google Scholar] [CrossRef]
- Wang, M.; Carver, J.J.; Phelan, V.V.; Sanchez, L.M.; Garg, N.; Peng, Y.; Nguyen, D.D.; Watrous, J.; Kapono, C.A.; Luzzatto-Knaan, T.; et al. Sharing and community curation of mass spectrometry data with Global Natural Products Social Molecular Networking. Nat. Biotechnol. 2016, 34, 828–837. [Google Scholar] [CrossRef] [Green Version]
- Tautenhahn, R.; Patti, G.J.; Rinehart, D.; Siuzdak, G. XCMS Online: A web-based platform to process untargeted metabolomic data. Anal. Chem. 2012, 84, 5035–5039. [Google Scholar] [CrossRef]
- Runnqvist, H.; Bak, S.A.; Hansen, M.; Styrishave, B.; Halling-Sørensen, B.; Björklund, E. Determination of pharmaceuticals in environmental and biological matrices using pressurised liquid extraction—Are we developing sound extraction methods? J. Chromatogr. A 2010, 1217, 2447–2470. [Google Scholar] [CrossRef] [PubMed]
- Gilbert-López, B.; Barranco, A.; Herrero, M.; Cifuentes, A.; Ibáñez, E. Development of new green processes for the recovery of bioactives from Phaeodactylum tricornutum. Food Res. Int. Ott. Ont 2017, 99, 1056–1065. [Google Scholar] [CrossRef] [PubMed]
- Heffernan, N.; Smyth, T.J.; FitzGerald, R.J.; Soler-Vila, A.; Brunton, N. Antioxidant activity and phenolic content of pressurised liquid and solid-liquid extracts from four Irish origin macroalgae. Int. J. Food Sci. Technol. 2014, 49, 1765–1772. [Google Scholar] [CrossRef]
- Tierney, M.S.; Smyth, T.J.; Hayes, M.; Soler-Vila, A.; Croft, A.K.; Brunton, N. Influence of pressurised liquid extraction and solid-liquid extraction methods on the phenolic content and antioxidant activities of Irish macroalgae. Int. J. Food Sci. Technol. 2013, 48, 860–869. [Google Scholar] [CrossRef]
- Saravana, P.S.; Cho, Y.-J.; Park, Y.-B.; Woo, H.-C.; Chun, B.-S. Structural, antioxidant, and emulsifying activities of fucoidan from Saccharina japonica using pressurized liquid extraction. Carbohydr. Polym. 2016, 153, 518–525. [Google Scholar] [CrossRef] [PubMed]
- Goto, M.; Kanda, H.; Wahyudiono; Machmudah, S. Extraction of carotenoids and lipids from algae by supercritical CO2 and subcritical dimethyl ether. J. Supercrit. Fluids 2015, 96, 245–251. [Google Scholar] [CrossRef]
- Zaibunnisa, A.H.; Norashikin, S.; Mamot, S.; Osman, H. An experimental design approach for the extraction of volatile compounds from turmeric leaves (Curcuma domestica) using pressurised liquid extraction (PLE). LWT Food Sci. Technol. 2009, 42, 233–238. [Google Scholar] [CrossRef]
- Baugros, J.-B.; Cren-Olivé, C.; Giroud, B.; Gauvrit, J.-Y.; Lantéri, P.; Grenier-Loustalot, M.-F. Optimisation of pressurised liquid extraction by experimental design for quantification of pesticides and alkyl phenols in sludge, suspended materials and atmospheric fallout by liquid chromatography–tandem mass spectrometry. J. Chromatogr. A 2009, 1216, 4941–4949. [Google Scholar] [CrossRef]
- Ain, A.H.N.; Zaibunnisa, A.H.; Zahrah, M.S.H.; Norashikin, S. An experimental design approach for the extraction of lemongrass (Cymbopogon citratus) oleoresin using pressurised liquid extraction (PLE). Int. Food Res. J. 2013, 20, 451–455. [Google Scholar]
- Lu, J.; Feng, X.; Han, Y.; Xue, C. Optimization of subcritical fluid extraction of carotenoids and chlorophyll a from Laminaria japonica Aresch by response surface methodology. J. Sci. Food Agric. 2014, 94, 139–145. [Google Scholar] [CrossRef]
- Lopes, G.; Barbosa, M.; Vallejo, F.; Gil-Izquierdo, Á.; Andrade, P.B.; Valentão, P.; Pereira, D.M.; Ferreres, F. Profiling phlorotannins from Fucus spp. of the Northern Portuguese coastline: Chemical approach by HPLC-DAD-ESI/MSn and UPLC-ESI-QTOF/MS. Algal Res. 2018, 29, 113–120. [Google Scholar] [CrossRef]
- Koivikko, R.; Loponen, J.; Honkanen, T.; Jormalainen, V. Contents of soluble, cell-wall-bound and exuded phlorotannins in the brown alga Fucus vesiculosus, with implications on their ecological functions. J. Chem. Ecol. 2005, 31, 195–212. [Google Scholar] [CrossRef] [PubMed]
- Ponce, N.M.A.; Pujol, C.A.; Damonte, E.B.; Flores, M.L.; Stortz, C.A. Fucoidans from the brown seaweed Adenocystis utricularis: Extraction methods, antiviral activity and structural studies. Carbohydr. Res. 2003, 338, 153–165. [Google Scholar] [CrossRef]
- Boettcher, A.A.; Targett, N.M. Role of polyphenolic molecular size in reduction of assimilation efficiency in Xiphister mucosus. Ecology 1993, 74, 891–903. [Google Scholar] [CrossRef]
- André Haugan, J.; Liaaen-Jensen, S. Improved isolation procedure for fucoxanthin. Phytochemistry 1989, 28, 2797–2798. [Google Scholar] [CrossRef]
- Gaysinski, M.; Ortalo-Magné, A.; Thomas, O.P.; Culioli, G. Extraction, purification, and NMR analysis of terpenes from brown algae. In Natural Products from Marine Algae; Stengel, D.B., Connan, S., Eds.; Springer New York: New York, NY, USA, 2015; Volume 1308, pp. 207–223. ISBN 978-1-4939-2683-1. [Google Scholar]
- Najdek, M.; Iveša, L.; Paliaga, P.; Blažina, M.; Čelig, A. Changes in the fatty acid composition of Fucus virsoides J. Agardh in response to the type of substratum. Acta Adriat. Int. J. Mar. Sci. 2014, 55, 19–30. [Google Scholar]
- Lorenzo, J.M.; Agregán, R.; Munekata, P.E.S.; Franco, D.; Carballo, J.; Şahin, S.; Lacomba, R.; Barba, F.J. Proximate composition and nutritional value of three macroalgae: Ascophyllum nodosum, Fucus vesiculosus and Bifurcaria bifurcata. Mar. Drugs 2017, 15. [Google Scholar] [CrossRef]
- Cabrita, M.T.; Vale, C.; Rauter, A.P. Halogenated compounds from marine algae. Mar. Drugs 2010, 8, 2301–2317. [Google Scholar] [CrossRef]
- Kendel, M.; Wielgosz-Collin, G.; Bertrand, S.; Roussakis, C.; Bourgougnon, N.; Bedoux, G. Lipid composition, fatty acids and sterols in the seaweeds Ulva armoricana, and Solieria chordalis from Brittany (France): An analysis from nutritional, chemotaxonomic, and antiproliferative activity perspectives. Mar. Drugs 2015, 13, 5606–5628. [Google Scholar] [CrossRef]
- Eichenberger, W.; Araki, S.; Müller, D.G. Betaine lipids and phospholipids in brown algae. Phytochemistry 1993, 34, 1323–1333. [Google Scholar] [CrossRef]
- Leblond, J.; Dahmen, J. Editorial: Recent advances and technologies in algal lipid biology. Front. Plant Sci. 2016, 7. [Google Scholar] [CrossRef] [PubMed]
- Maciel, E.; Leal, M.C.; Lillebø, A.I.; Domingues, P.; Domingues, M.R.; Calado, R. Bioprospecting of marine macrophytes using MS-based lipidomics as a new approach. Mar. Drugs 2016, 14, 49. [Google Scholar] [CrossRef] [PubMed]
- Müller, D.G.; Eichenberger, W. Betaine lipid content and species delimitation in Ectocarpus, Feldmannia and Hincksia (Ectocarpales, Phaeophyceae). Eur. J. Phycol. 1994, 29, 219–225. [Google Scholar] [CrossRef]
- Jones, A.L.; Harwood, J.L. Lipid composition of the brown algae Fucus vesiculosus and Ascophyllum nodosum. Phytochemistry 1992, 31, 3397–3403. [Google Scholar] [CrossRef]
- Skinner, W.A.; Sturm, P.A. Investigation of algae and yeast for α-tocopherol and α-tocopherolquinone content. Phytochemistry 1968, 7, 1893–1896. [Google Scholar] [CrossRef]
- Maehre, H.K.; Malde, M.K.; Eilertsen, K.-E.; Elvevoll, E.O. Characterization of protein, lipid and mineral contents in common Norwegian seaweeds and evaluation of their potential as food and feed: Biochemical composition of marine macroalgae. J. Sci. Food Agric. 2014, 94, 3281–3290. [Google Scholar] [CrossRef] [PubMed]
- Ruokolahti, C.; Rönnberg, O. Seasonal variation in chlorophyll α content of Fucus vesiculosus in a Northern Baltic archipelago. Ann. Bot. Fenn. 1988, 25, 385–388. [Google Scholar]
- Rohde, S.; Hiebenthal, C.; Wahl, M.; Karez, R.; Bischof, K. Decreased depth distribution of Fucus vesiculosus (Phaeophyceae) in the Western Baltic: effects of light deficiency and epibionts on growth and photosynthesis. Eur. J. Phycol. 2008, 43, 143–150. [Google Scholar] [CrossRef]
- Nomura, M.; Kamogawa, H.; Susanto, E.; Kawagoe, C.; Yasui, H.; Saga, N.; Hosokawa, M.; Miyashita, K. Seasonal variations of total lipids, fatty acid composition, and fucoxanthin contents of Sargassum horneri (Turner) and Cystoseira hakodatensis (Yendo) from the northern seashore of Japan. J. Appl. Phycol. 2013, 25, 1159–1169. [Google Scholar] [CrossRef]
- Shannon, E.; Abu-Ghannam, N. Optimisation of fucoxanthin extraction from Irish seaweeds by response surface methodology. J. Appl. Phycol. 2017, 29, 1027–1036. [Google Scholar] [CrossRef]
- Fariman, G.A.; Shastan, S.J.; Zahedi, M.M. Seasonal variation of total lipid, fatty acids, fucoxanthin content, and antioxidant properties of two tropical brown algae (Nizamuddinia zanardinii and Cystoseira indica) from Iran. J. Appl. Phycol. 2016, 28, 1323–1331. [Google Scholar] [CrossRef]
- Terasaki, M.; Kawagoe, C.; Ito, A.; Kumon, H.; Narayan, B.; Hosokawa, M.; Miyashita, K. Spatial and seasonal variations in the biofunctional lipid substances (fucoxanthin and fucosterol) of the laboratory-grown edible Japanese seaweed (Sargassum horneri Turner) cultured in the open sea. Saudi J. Biol. Sci. 2017, 24, 1475–1482. [Google Scholar] [CrossRef] [PubMed]
- MacKinnon, S.L.; Hiltz, D.; Ugarte, R.; Craft, C.A. Improved methods of analysis for betaines in Ascophyllum nodosum and its commercial seaweed extracts. J. Appl. Phycol. 2010, 22, 489–494. [Google Scholar] [CrossRef]
- Blunden, G.; Morse, P.F.; Mathe, I.; Hohmann, J.; Critchleye, A.T.; Morrell, S. Betaine yields from marine algal species utilized in the preparation of seaweed extracts used in agriculture. Nat. Prod. Commun. 2010, 5, 581–585. [Google Scholar] [PubMed]
- Parys, S.; Kehraus, S.; Krick, A.; Glombitza, K.-W.; Carmeli, S.; Klimo, K.; Gerhäuser, C.; König, G.M. In vitro chemopreventive potential of fucophlorethols from the brown alga Fucus vesiculosus L. by anti-oxidant activity and inhibition of selected cytochrome P450 enzymes. Phytochemistry 2010, 71, 221–229. [Google Scholar] [CrossRef] [PubMed]
- Connan, S.; Goulard, F.; Stiger, V.; Deslandes, E.; Ar, G.E. Interspecific and temporal variation in phlorotannin levels in an assemblage of brown algae. Bot. Mar. 2005, 47, 410–416. [Google Scholar] [CrossRef]
- Jormalainen, V.; Honkanen, T.; Koivikko, R.; Eränen, J. Induction of phlorotannin production in a brown alga: defense or resource dynamics? Oikos 2003, 103, 640–650. [Google Scholar] [CrossRef] [Green Version]
- Jormalainen, V.; Honkanen, T. Variation in natural selection for growth and phlorotannins in the brown alga Fucus vesiculosus. J. Evol. Biol. 2004, 17, 807–820. [Google Scholar] [CrossRef] [PubMed]
- Ale, M.T.; Maruyama, H.; Tamauchi, H.; Mikkelsen, J.D.; Meyer, A.S. Fucoidan from Sargassum sp. and Fucus vesiculosus reduces cell viability of lung carcinoma and melanoma cells in vitro and activates natural killer cells in mice in vivo. Int. J. Biol. Macromol. 2011, 49, 331–336. [Google Scholar] [CrossRef] [PubMed]
- Zaragoza, M.C.; Lopez, D.; Saiz, M.P.; Poquet, M.; Perez, J.; Puig-Parellada, P.; Marmol, F.; Simonetti, P.; Gardana, C.; Lerat, Y.; et al. Toxicity and antioxidant activity in vitro and in vivo of two Fucus vesiculosus extracts. J. Agric. Food Chem. 2008, 56, 7773–7780. [Google Scholar] [CrossRef] [PubMed]
- Weidig, B. Niedrigwasser vom 14.09.2017. Available online: https://www.bsh.de/DE/THEMEN/Wasserstand_und_Gezeiten/Sturmfluten/_Anlagen/Downloads/Ostsee_Niedrigwasser_20170914.pdf?__blob=publicationFile&v=3 (accessed on 21 October 2018).
- Rahelivao, M.P.; Gruner, M.; Andriamanantoanina, H.; Bauer, I.; Knölker, H.-J. Brown algae (Phaeophyceae) from the coast of Madagascar: Preliminary bioactivity studies and isolation of natural products. Nat. Prod. Bioprospecting 2015, 5, 223–235. [Google Scholar] [CrossRef] [PubMed]
- Eom, S.-H.; Kang, Y.-M.; Park, J.-H.; Yu, D.-U.; Jeong, E.-T.; Lee, M.-S.; Kim, Y.-M. Enhancement of polyphenol content and antioxidant activity of brown alga Eisenia bicyclis extract by microbial fermentation. Fish. Aquat. Sci. 2011, 14, 192–197. [Google Scholar] [CrossRef]
- Choi, S.-M.; Jang, E.-J.; Cha, J.-D. Synergistic effect between fucoidan and antibiotics against clinic methicillin-resistant Staphylococcus aureus. Adv. Biosci. Biotechnol. 2015, 06, 275. [Google Scholar] [CrossRef]
- Richter, B.E.; Jones, B.A.; Ezzell, J.L.; Porter, N.L.; Avdalovic, N.; Pohl, C. Accelerated solvent extraction: A technique for sample preparation. Anal. Chem. 1996, 68, 1033–1039. [Google Scholar] [CrossRef]
- Gu, J.; Gui, Y.; Chen, L.; Yuan, G.; Lu, H.-Z.; Xu, X. Use of natural products as chemical library for drug discovery and network pharmacology. PLoS ONE 2013, 8, e62839. [Google Scholar] [CrossRef] [PubMed]


| DSD Run | Temp. (°C) | Sample Weight (g) | Ratio Sand:Fucus | Static Time (min) | No. of Static Cycles | Rinse Volume (% of Cell) |
|---|---|---|---|---|---|---|
| 1 | 20 | 0.5 | 10:1 | 11 | 2 | 120 |
| 2 | 20 | 0.5 | 20:1 | 8 | 3 | 30 |
| 3 | 20 | 1.0 | 10:1 | 5 | 1 | 120 |
| 4 | 20 | 1.5 | 20:1 | 5 | 3 | 75 |
| 5 | 20 | 1.5 | 10:1 | 11 | 1 | 30 |
| 6 | 40 | 0.5 | 15:1 | 5 | 1 | 30 |
| 7 | 40 | 1.0 | 10:1 | 8 | 2 | 75 |
| 8 | 40 | 1.5 | 15:1 | 11 | 3 | 120 |
| 9 | 60 | 0.5 | 20:1 | 5 | 3 | 120 |
| 10 | 60 | 0.5 | 20:1 | 11 | 1 | 75 |
| 11 | 60 | 1.0 | 15:1 | 11 | 3 | 30 |
| 12 | 60 | 1.5 | 20:1 | 8 | 1 | 120 |
| 13 | 60 | 1.5 | 10:1 | 5 | 2 | 30 |
| Run | Temp. (°C) | MeOH Static Time (min) | No. of MeOH Static Cycles | DCM Static Time (min) | No. of DCM Static Cycles |
|---|---|---|---|---|---|
| 1 | 20 | 5 | 1 | 11 | 2 |
| 2 | 20 | 5 | 3 | 8 | 3 |
| 3 | 20 | 8 | 3 | 5 | 1 |
| 4 | 20 | 11 | 1 | 5 | 3 |
| 5 | 20 | 11 | 2 | 11 | 1 |
| 6 | 40 | 5 | 1 | 5 | 1 |
| 7 | 40 | 8 | 2 | 8 | 2 |
| 8 | 40 | 11 | 3 | 11 | 3 |
| 9 | 60 | 5 | 2 | 5 | 3 |
| 10 | 60 | 5 | 3 | 11 | 1 |
| 11 | 60 | 8 | 1 | 11 | 3 |
| 12 | 60 | 11 | 1 | 8 | 1 |
| 13 | 60 | 11 | 3 | 5 | 2 |
© 2018 by the authors. Licensee MDPI, Basel, Switzerland. This article is an open access article distributed under the terms and conditions of the Creative Commons Attribution (CC BY) license (http://creativecommons.org/licenses/by/4.0/).
Share and Cite
Heavisides, E.; Rouger, C.; Reichel, A.F.; Ulrich, C.; Wenzel-Storjohann, A.; Sebens, S.; Tasdemir, D. Seasonal Variations in the Metabolome and Bioactivity Profile of Fucus vesiculosus Extracted by an Optimised, Pressurised Liquid Extraction Protocol. Mar. Drugs 2018, 16, 503. https://doi.org/10.3390/md16120503
Heavisides E, Rouger C, Reichel AF, Ulrich C, Wenzel-Storjohann A, Sebens S, Tasdemir D. Seasonal Variations in the Metabolome and Bioactivity Profile of Fucus vesiculosus Extracted by an Optimised, Pressurised Liquid Extraction Protocol. Marine Drugs. 2018; 16(12):503. https://doi.org/10.3390/md16120503
Chicago/Turabian StyleHeavisides, Edwin, Caroline Rouger, Anna F. Reichel, Cornelia Ulrich, Arlette Wenzel-Storjohann, Susanne Sebens, and Deniz Tasdemir. 2018. "Seasonal Variations in the Metabolome and Bioactivity Profile of Fucus vesiculosus Extracted by an Optimised, Pressurised Liquid Extraction Protocol" Marine Drugs 16, no. 12: 503. https://doi.org/10.3390/md16120503