Article

Total Mass Flux in the Northern Humboldt Current System: Rates and Contribution Sources from Central Peru (12° S)

1
Dirección General de Investigaciones Oceanográficas y Cambio Climático, Instituto del Mar del Perú (IMARPE), Esquina Gamarra y General Valle S/N Chucuito, Callao 07021, Peru
2
Facultad de Ciencias Biológicas, Universidad Nacional Mayor de San Marcos (UNMSM), Av. Carlos Germán Amézaga 375, Lima 15081, Peru
3
Facultad de Ciencias Veterinarias y Biológicas, Universidad Científica del Sur (UCSUR), Panamericana sur km. 19, Chorrillos 15842, Peru
4
Division of Biological Oceanography, GEOMAR Helmholtz Centre for the Ocean Research Kiel, 24148 Kiel, Germany
*
Authors to whom correspondence should be addressed.
Hydrobiology 2023, 2(4), 521-536; https://doi.org/10.3390/hydrobiology2040035
Submission received: 27 July 2023 / Revised: 22 September 2023 / Accepted: 26 September 2023 / Published: 28 September 2023

Abstract

:
The total mass flux (TMF) of particulate organic matter (POM) is key for understanding the energetic transfer within the “biological pump” (i.e., involving the carbon cycle), reflecting a critical connection between the surface and the bottom. A fixed multi-sediment trap was installed at 30 m depth in Callao Bay, central Peru from March to December 2020. After recovery, samples were dried and weighed to calculate the TMF and pellet flux. The average TMF was 601.9 mg·m−2·day−1, with 70.2 and 860 mg·m−2·day−1 as the lowest and highest values during “normal conditions”. Zooplankton fecal pellets (ZFP) were found in ovoid (e.g., larvae) and cylindrical (e.g., adult copepods) shapes and their flux contribution to TMF was low, ranging from 0.17 to 85.59 mg·m−2·day−1. In contrast with ZFP, fish fecal pellets (FFP) were found in fragments with a cylindrical shape, and their contribution to the TMF was higher than ZFP, ranging from 1 to 92.56 mg·m−2·day−1. Mean sinking velocities were 4.63 ± 3.47 m·day−1 (ZFP) and 432.27 ± 294.26 m·day−1 (FFP). There is a considerable difference between the ZFP and FFP contributions to TMFs. We discuss the implications of these results regarding a still poorly understood process controlling the POM flux off the Peruvian coast.

1. Introduction

Surface-produced organic matter and its ulterior exportation to the seabed is a crucial metabolic process for the functioning of marine ecosystems and the survival of many species depends on these supplies [1,2]. Carbon dioxide uptake by phytoplankton and secondary consumption by zooplankton represent key mechanisms in the early stages of the pelagic-benthic coupling; this vertical transfer of energy through sinking particulate material (e.g., total mass flux; hereafter, TMF) and possible burial is a fundamental process in marine ecosystems, particularly for different trophic levels in benthic communities involved in the final carbon pathways [3,4].
Carbon-based supplies to the bottom exhibit variability depending on several factors such as spatial constraints, seasonality, bathymetric setting, and even the oxygen regime can modulate these processes [3,5,6,7,8]. However, the biological contribution to the TMF also depends on the local occurrence of fish schools and massive zooplankton swarms. Despite this, export rates and specific contributions of these sources remain poorly described for coastal upwelling areas, hindering our ability to analyze the episodic influence of these events on the TMF and its signal in the water column and the bottom [4,9,10].
The Humboldt Current System domain extends from southern Chile (~42° S), where the West Wind Drift intersects the South American continent, to northern Peru (~5° S), where cool upwelled waters collide with warm tropical waters forming a transitional front. The domain encompasses three well-defined upwelling subsystems: (1) a productive seasonal upwelling system in central-southern Chile; (2) a lower productivity and rather large “upwelling shadow” in northern Chile and southern Peru and (3) the highly productive year-round Peru upwelling system [11,12]. The third subsystem named the Northern Humboldt Current System (NHCS) is characterized by high levels of production, partially reflected in a large biomass of small pelagic fish (e.g., as occurring in the Peruvian anchovy population). The NHCS offers the opportunity to analyze the components of pelagic-benthic processes in depth. As wind-driven upwelling tongues along this region positively foster the formation of large hotspots of organic conglomerates in the surface and intermediate waters, the accumulation and ulterior decomposition of this organic material triggers the recurrent depletion of dissolved oxygen affecting both shelf and slope habitats [7,13,14].
The NHCS euphotic waters are characterized by large amounts of primary producers continually fixing and pumping carbon-based compounds to the water column and beyond [15,16]. However, despite episodes of high variability in this region (e.g., during El Niño events, EN) the sinking particles and burial mechanisms involved in this quasi-permanent pelagic-benthic flux in shelf environments of the NHCS have rarely been characterized.
Central areas of the NHCS tend to exhibit large amounts of production year-round and host one of the most severe oxygen minimum zones in the region [7,17]. Recent reports in these areas indicate that shelf environments can be rapidly impacted by terrigenous material during anomalous events, such as El Niño, plus the influence of local production [18]. However, descriptions of the pathway of carbon to the benthos are unknown, and the characteristics and rate of the TMF reaching the bottom are unclear, because there are no previous descriptions; therefore, the impact on benthic organisms lacks enough information [19]. This study aims to contribute to the characterization of the TMF and identify the contribution sources of the particulate organic matter in a representative and highly productive central area of the NHCS. This study is performed under the working hypothesis that fish fecal pellets have a remarkable contribution to the TMF, particularly considering the high dominance of dense anchovy (Engraulis ringens) schools in central Peru.

2. Materials and Methods

2.1. Study Area

In the framework of the Coastal Upwelling System in a Changing Ocean (CUSCO) project, a research campaign was carried out at Callao Bay (central Peru, 12° S) (see Figure 1), which is a representative upwelling-fueled area in the NHCS, characterized by a nutrient-rich environment and supporting high levels of primary production year-round [20,21]. Primary producers in central areas of the NHCS such as Callao Bay are strongly dominated by diatoms, sedimentological studies confirm these characteristics in the composition of the organically-rich local surface sediments [22,23].

2.2. Automatic Sediment Trap Deployment and Recovery

A 320 mm diameter Saarso-type cylindrical sediment trap (Hydro-Bios Multi Sediment Trap MST6 444 101) was deployed within a mooring array at 30 m depth (Figure 2). The trap has a rotating base, controlled by a programmable system, that can hold up to six bottles (250 mL). Before deployment, the trap was programmed to make each bottle collect POM for 10 days, every bottle was filled with a solution of 5% formalin (buffered with sodium tetraborate at pH 8) using pre-filtered (0.2 µm) seawater, taken at the same depth.
After the array deployment, the verticality of the trap was in situ checked. The experiment was originally planned to last 60 days, but a mechanical issue in the fifth bottle produced a longer collection time until the moment of recovery, which due to restrictions during the COVID-19 pandemic, lasted 279 days from 14 March to 18 December 2020 (Table 1). It allowed us to analyze the TMF over a comparatively longer period and contrast it with 1–4 bottles (bottle 6 did not open, therefore, it could not capture material) (Table 1). The sediment trap was recovered by releasing the line from the ballast and then detaching all bottles (hereafter “samples”) to be stored in a polystyrene box with frozen gel packs (4 °C), and finally transported to the laboratory for processing.

2.3. Samples Splitting

All samples were transported to the Marine Geology Laboratory at the Instituto del Mar del Perú (IMARPE), and stored at 4 °C to avoid their degradation. The samples were later split into four aliquots, namely “A” (for TMF estimates), and “B” (for fecal pellet flux and characterization). Aliquots “C” and “D” were stored for other analyses. The splitting was performed using a Folsom Splitter. This equipment was tested using samples from the same study area, sediment trap, and resolution of days, obtaining an acceptable coefficient of variation (0.07%), compared to the value calculated (6%) under similar conditions [24,25].

2.3.1. Aliquot “A”

Zooplankton Picking

Since zooplankton are not considered part of the passive TMF, they were removed [26,27,28,29]. Although there is no consensus on how to remove them (whether or not to use a stereomicroscope in the process), it was decided to carry out a complete analysis, observing the organisms through a stereomicroscope and removing them with acupuncture needles by gathering them and then collecting them on one of the needles with the help of the other as they are removed from the sample’s liquid. For this case, several aliquots were analyzed in Petri dishes using a Nikon-SMZ18 stereomicroscope.

Filtering and Weighing of Particulate Matter

The POM was filtered and dried, using a Millipore filtration kit and Whatman GF/F glass fiber filters (47 mm). These filters were placed in porcelain crucibles and calcined at 450° C in a muffle for 6 h [26]. The filters were put on aluminum foil and then cooled inside a desiccator containing silica to avoid moisture retention. Once filters cooled down, they were weighed on a Sartorius microbalance (precision 0.0001 g) (initial weight). The filter was installed in the filtration kit connected to a suction pump with a pressure of 0.2 bar, to speed up the filtration process and avoid possible ruptures of the material being filtered [30,31]. The procedure implies pouring the POM into the filtration kit. The suction pump was turned on until all the water was filtered. Subsequently, the material was washed with deionized water (while the suction pump was still on) to remove the rest of the salt, and the filter with the material was uncoupled and dried in an oven at 75 °C for 1 h. The same process was repeated for all the samples. The filters were removed from the oven and placed in a desiccator to cool down for 1 h. Finally, the filters were weighed (final weight), being able to calculate the weight of the sedimentary material using Equation (1):
POM weight (mg) = Final weight (mg) − initial weight (mg)
The TMF estimates (mg·m−2·day−1) were calculated with Equation (2):
TMF = (SF × α)/(0.080384 m2 × γ),
where SF is the splitting factor used to split the sample into aliquots, α the POM weight (mg), 0.080384 m2 is the area of the mouth of the trap, and γ the days the bottle was capturing POM.
The mean TMF was calculated using Equation (3):
Mean TMF = ∑(S × γ1)/(β),
where S is the TMF of each sample (1–5), γ1 is the days each bottle was capturing POM, and β is the total days the trap was deployed during the experiment.

2.3.2. Aliquot “B”

Collection, Measurement, and Characterization of Fecal Pellets

The aliquot was placed in a Petri dish (14 cm Ø). Brushes and acupuncture needles were used to avoid damage to the fecal pellets. The removed pellets were placed in polysulfone flasks (70 mL) filled with 10 mL of 5% formalin stored at 4 °C for later correct measurement, counting, and characterization using a Nikon-SMZ18 stereomicroscope and the NIS-Elements software. Fecal pellets (entire or fragmented) were grouped inside a Petri dish and observed under a stereomicroscope, using the NIS-Elements software to take the photographs. These photographs were used to count the fecal pellets and also to characterize them, observing the color but mainly their shape, to identify the possible producers following specific suggestions [32]. Subsequently, the software was also used to measure the pellets using the photographs previously taken, one by one manually. The length and width of the fecal pellets were measured to obtain an average of total sizes and to be able to calculate the volume that they contribute to their respective samples. The volume of fecal pellets was calculated using the following equations, regarding their shape, for cylindrical pellets we used Equation (4):
Volume = πhr2,
where h and r are the height and radius of the cylindrical fecal pellet, respectively.
For ovoid fecal pellets, we used Equation (5):
Volume = (4/3)πar2,
where a and r are the length and radius of the ovoid fecal pellets, respectively.
The count and volume of fecal pellets were multiplied by the splitting factor to estimate the results. To obtain the dry weights and flux of all fecal pellets from each sample aliquot, we employed the same procedure used to obtain POM weight and flux, using Equations (1)–(3), just replacing the POM for fecal pellets.

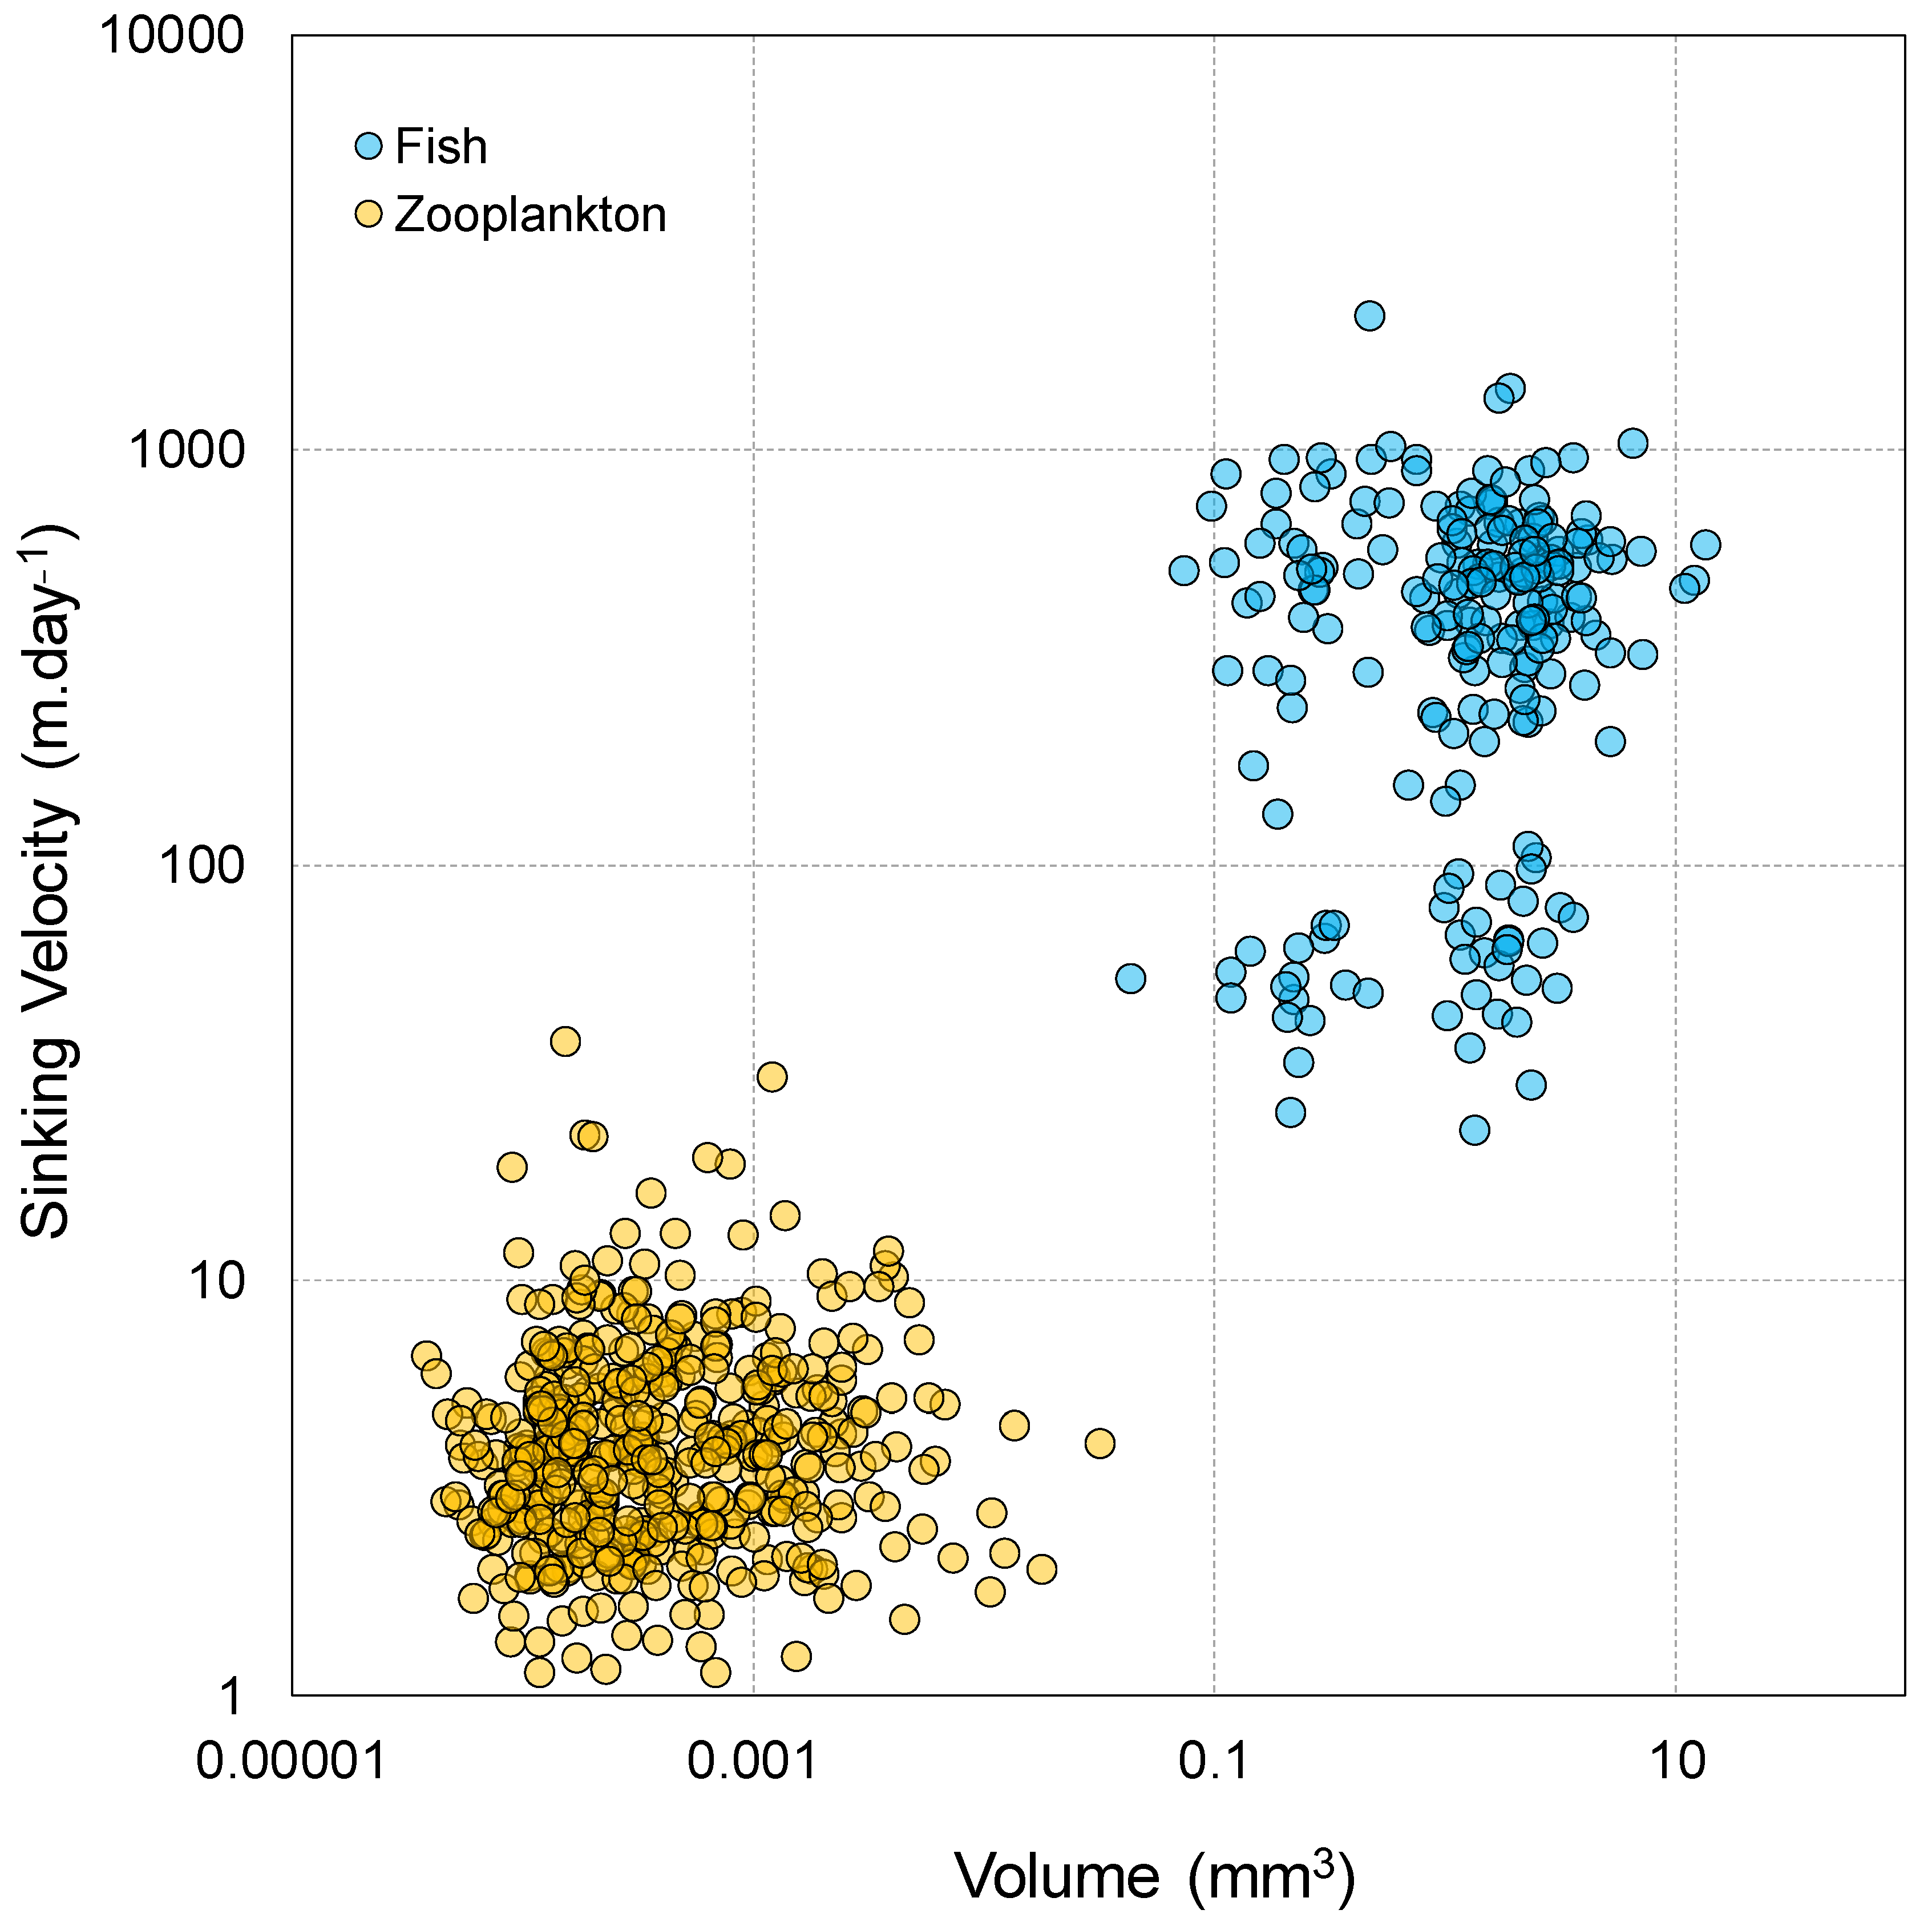
2.4. Sinking Velocity

Using the pool of pellets previously measured (fish and zooplankton), the sinking velocity was calculated [33]. To calculate the sinking velocity of all the ovoid as well as cylindrical fecal pellets from each sample aliquot, we employ Equation (6) and the suggestions indicated there.
Ws = 1/8 × 1/µ (ps − p) g × Dn2 × E0.380,
where Ws is the sinking velocity, µ is the seawater viscosity (0.001139 Ns·m−2), ps is the particle density (1.19 g·cm−3) [34,35], p is the water density in situ estimated (1.0258747 g·cm−3) in a surface profile (<1.34 m depth), g is the acceleration of gravity (981 cm·s−2), Dn is the nominal diameter of the particle, E is a measure of shape [36] as expressed in Equation (7).
E = Ds (Ds2 + Di2 + D12)−1/2,
where Ds, Di, and D1 are the smallest, intermediate, and longest axial diameters of the ovoid. In the case of cylinders, D1 = L and Ds = Di = cylinder diameter.

3. Results

3.1. Fecal Pellets Count, Sources, and Contribution to TMF

ZFP total count was 4396, and the highest number of pellets was in sample 5 (3360). The sorted fecal pellets exhibited two shapes: ovoid and cylindrical (Figure 3), indicating they were possibly produced by larvae and adult copepods, respectively. The predominant shape in all the samples was the ovoid (Table 2). The apparent colors of the pellets were brown and light brown. The only shape found for FFP was cylindrical and unlike ZFP, which were found complete, they were found mostly in fragments (Figure 3).
The total count for FFP was lower than the one found for ZFP (1960 vs. 4396). The volume of FFP was 28 272 times greater than the volume of ZFP, the latter representing <1% of the total fecal pellet volume per sample, having 0.12 mm3 as the lowest value (sample 2) and 5.44 mm3 as the highest (sample 5).
Remarkable differences were found between ZFP and FFP sizes (Figure 4, Table A1). ZFP presented a wide length range of 0.068–0.611 mm, the average length of all the samples analyzed was 0.19 ± 0.08 mm. The width range from all samples was 0.038–0.279 mm and the mean width was 0.08 ± 0.03 mm. FFP had a length and width greater than ZFP values, with a length and width size range of 1.71–6.07 mm and 0.26–2.80 mm, respectively (Table A1).
Regarding weight contribution per sample, FFP accounted for an average dry weight of 26.72 ± 26.42 mg, and only sample 2 presented a very low dry weight of 0.8 mg. ZFP dry weight mean was 15.6 ± 26.61 mg with all values <4 mg except for sample 1, whose result was 68.8 mg (Table A2).

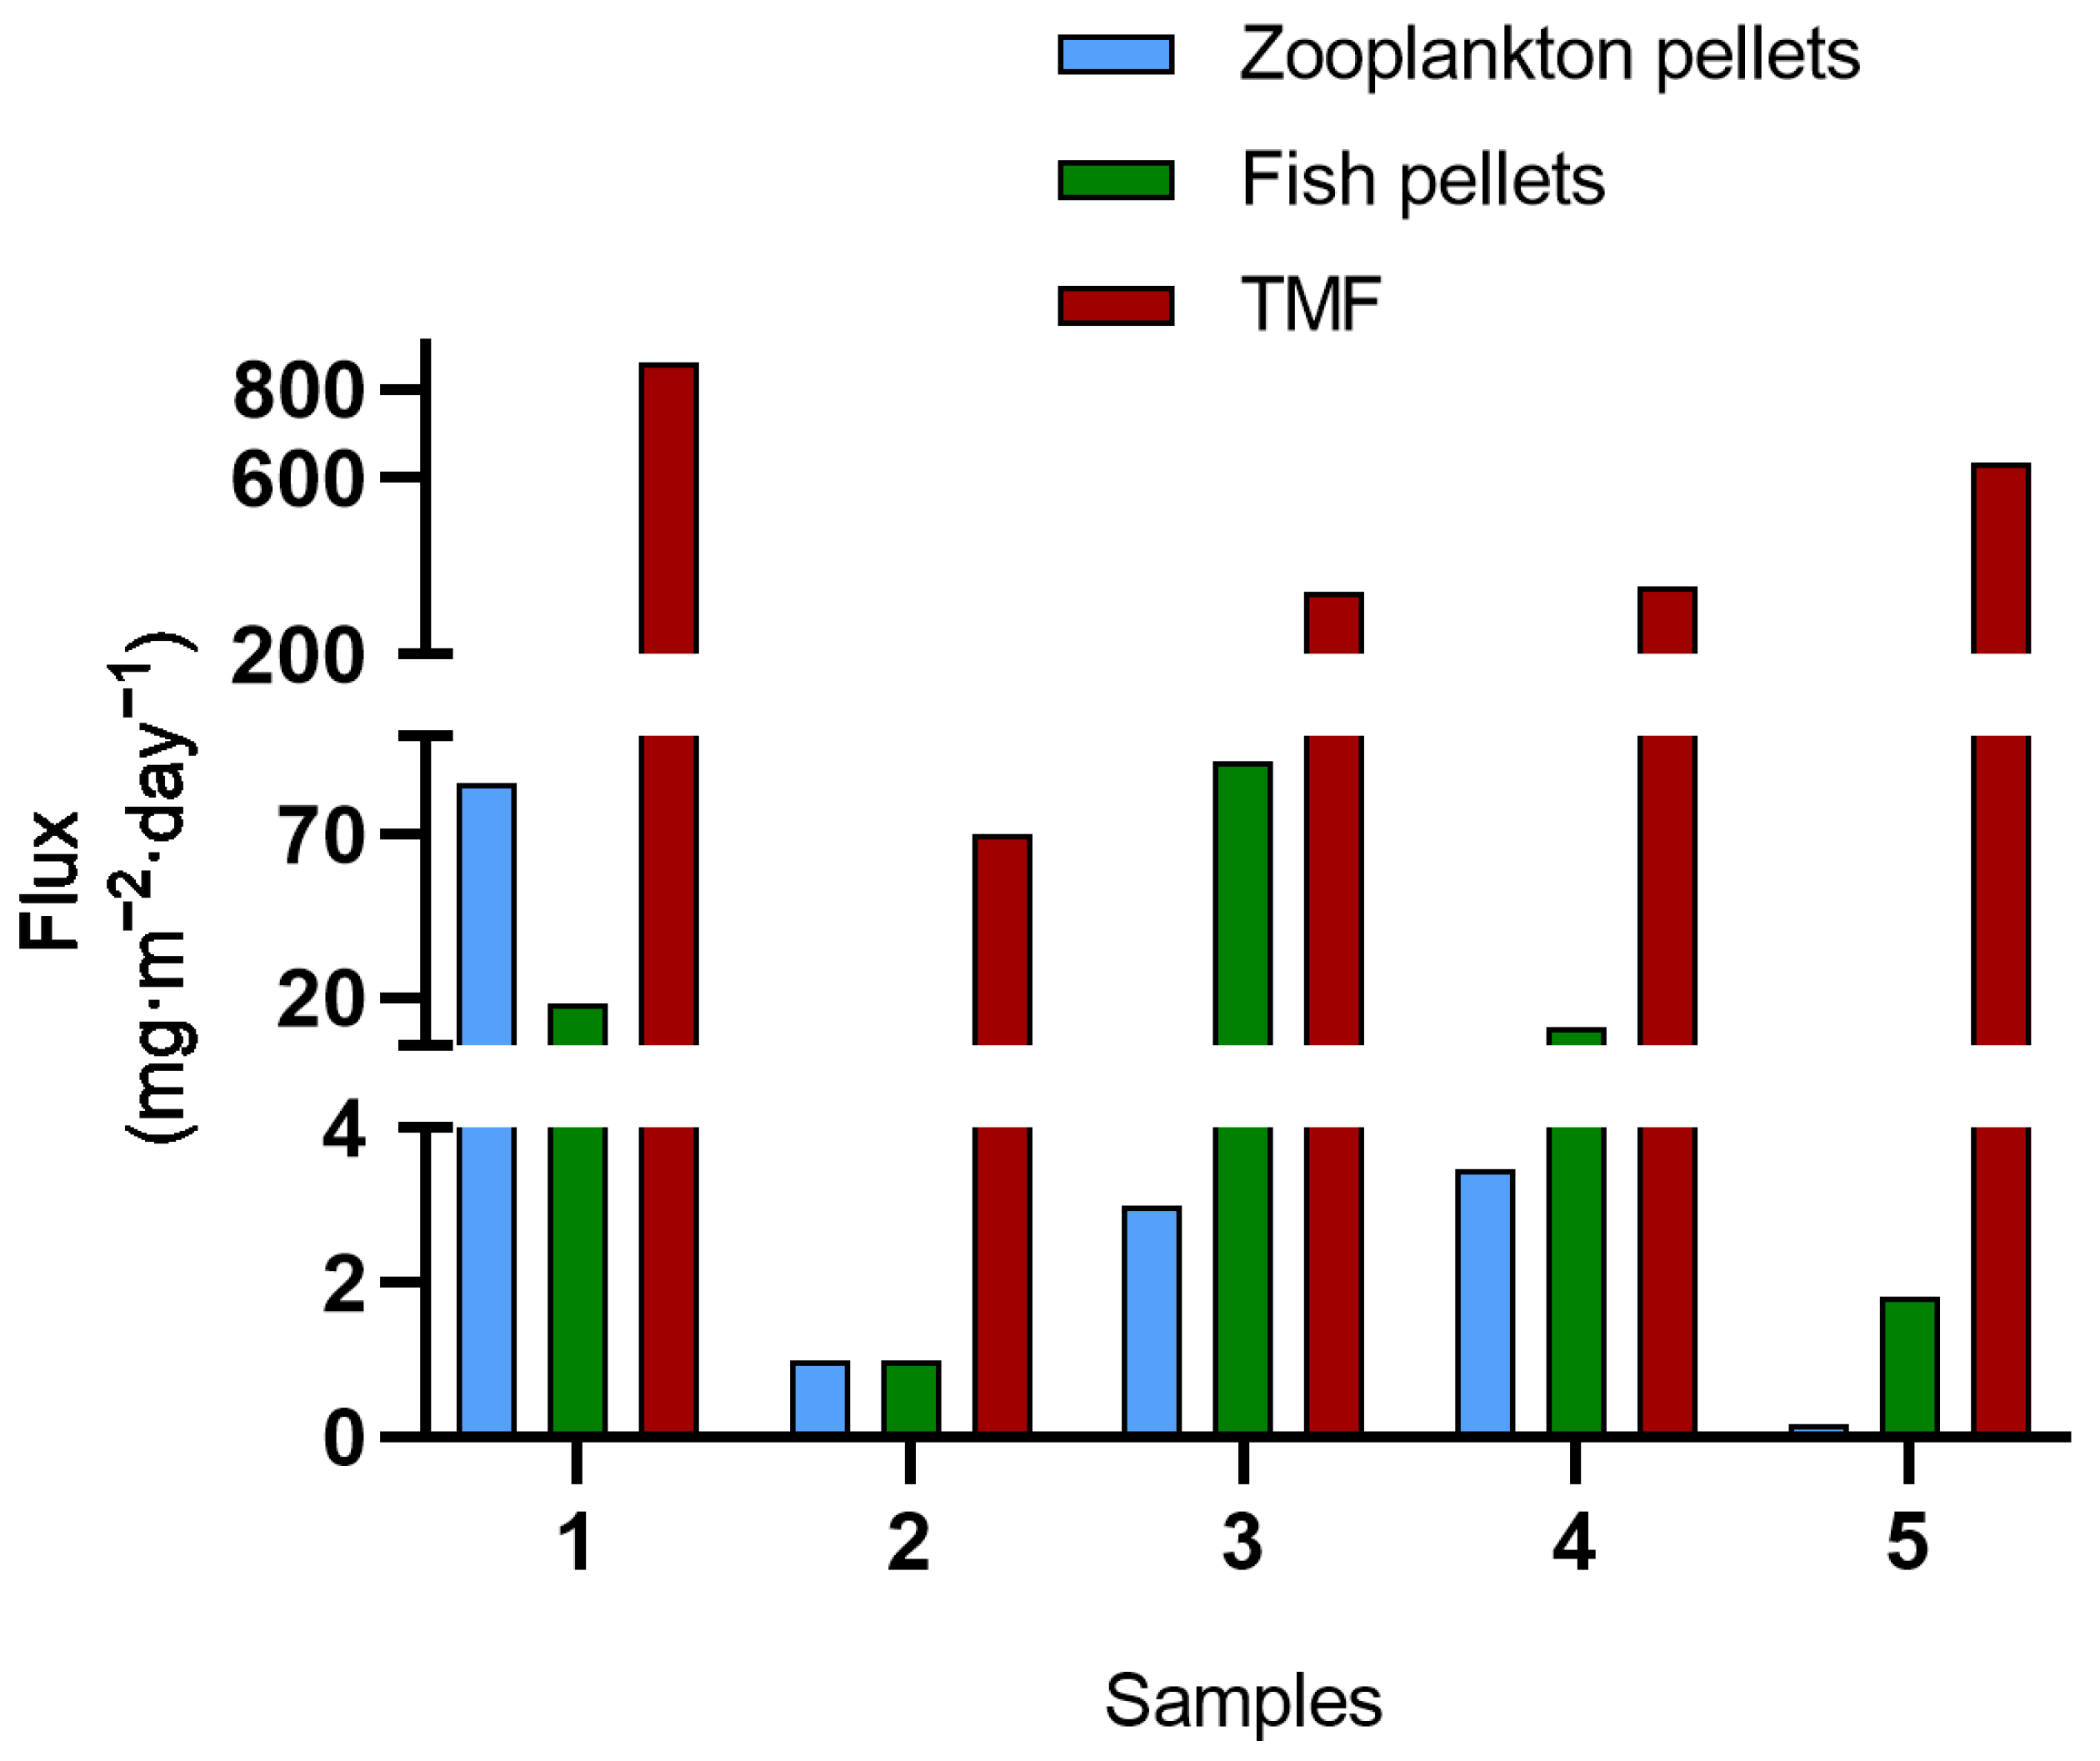
3.2. TMFs, Fecal Pellets Flux, and Sinking Velocities

The mean TMF during the study was 601.9 mg·m−2·day−1 with a maximum of 860 mg·m−2·day−1. The most striking TMF difference was for sample 2, (Figure 5), which had a very low result (70.2 mg·m−2·day−1) (Table A3). The mean ZFP and FFP flux was 3.89 mg·m−2·day−1 and 5.95 mg·m−2·day−1, respectively. The contributions of fecal pellets from each sample to the TMF was <27%, ranging from 0.03% to 26.95% (Table A4).
The estimated sinking velocities presented a variation depending on the type of fecal pellets, showing a directly proportional relation with their volume (Figure 6). For ZFP, the velocity range of all samples was 0.92 to 37.7 m·day−1, having a mean of 4.66 ± 3.47 m·day−1. FFP values were directly proportional to a higher volume, and presented a higher sinking velocity, with a range of 23.08 to 2104.43 m·day−1. The mean FFP among samples was 432.27 ± 294.36 m·day−1, showing comparatively faster carbon transport to the seabed.

4. Discussion

4.1. Contrasting TMF Estimates

A study carried out in 2013 from January to March (austral summer) off the Peruvian central coast (12° S) at the same depth (34 m) and with a sampling resolution of 7 days, showed not distant results from this study (427 mg·m−2·day−1 vs. 601.9 mg·m−2·day−1, respectively) [37]. They resumed the sampling from June to November (austral winter-spring) with a sampling resolution of 11 days, where they obtained a higher mean flux (986 ± 1422 mg·m−2·day−1). The system presented a La Niña (LN) event, but the similarities in results from the austral summer period might be given because LN conditions in 2013 started in March, which was the last month when the trap sampled sediments, suggesting that LN conditions led to a higher result in the austral winter-spring period (Table 3).
Coastal marine areas along the margins tend to be more productive in terms of POM in the surface and water column [1,45]. Overall, oceanographically similar areas such as northern (Mejillones, ~26° S) and central (Concepción, ~36° S) Chile are similar in terms of production and vertical flux within an order of magnitude but can exhibit particularly high variability during the impact of anomalous events like EN, or even cold periods [38,46]. The TMF results of this study are lower compared to other studies carried out under a similar setting in the Humboldt Current but are higher compared to oligotrophic areas such as the Northern Bahamas or Alaska (Table 3), where both the distance of the coast and depth of the moored trap likely play a crucial effect. Previous observations in central Peru are coherent with the results presented here; however, they differ in terms of depth setting and study period.
A special case in this study was sample 5, which collected POM for a longer period (239 days) compared to the other four samples (10 days). However, its TMF per day (634.5 mg·m−2·day−1) did not present a considerable variation, even being inferior to the one found for sample 1 (860.9 mg·m−2·day−1). This has to be studied with more detail as 2020 was a year with normal conditions, not presenting LN or EN events [47]. These events have the opposite impact on physico-biogeochemical variables in the ocean, being EN about twice as strong as LN impact (either positive or negative anomalies) [48]. Hence, an EN event, which represents a decrease in upwelling terms, should present a lower sediment flux than during normal or LN conditions; however, comparing observations during the 2017 coastal EN in the same bay, the estimated flux was ~7 times higher than calculated in this study, due to the indirect impact of massive terrigenous discharges received from the Rimac river in that period of heavy rainfalls [18]. This suggests that the Rimac River was a remarkable factor influencing the flux in the first sample during summer–fall, which may have had a stronger impact on the studied area regarding particulate matter input.
Studies off the Chilean coast (Concepcion Bay) [39] at the same depth (30 m) showed the average downward flux was 4600 ± 300 mg·m−2·day−1, being similar to mass flux results reported in central Peru [18]. Nevertheless, these observations on the Chilean coast were not executed under EN conditions, these similar results may have occurred due to factors such as the south-western wind seasonal variability and discharges from different spatially near places (Rocuant Salt Marsh and Andalien River).
Investigations in the oligotrophic system of the northern Bahamas at 500 m depth found an average TMF of 59 mg·m−2·day−1, which is considerably lower than our estimates [43]. The disparity in outcomes can be likely attributed to variations in the sampling depth when compared with the findings of this study, suggesting that the depth of the sediment trap plays a pivotal role in the observed diminished fluxes. Deeper installations exhibit progressively lower flux rates, indicating an inverse relationship between sediment flux and trap depth.

4.2. TMF Rates and Fecal Pellets Contribution

According to one study off the Peruvian coast (12° S) [37], during austral summer sampling (January–March) and the first half of austral winter-spring sampling (June–September), the contribution of fecal pellets to TMF was 60–70%. These values are much higher than ours (0.16–26.95%) (Table A4). This might be given because, unlike this study, theirs was carried out under the LN event, resulting in a nutrient-rich system that could contribute to the growth of the zooplankton and fish communities, enhancing fecal pellet production.
Several factors can influence particle dynamics and fluxes, such as the pelagic ecosystems and environmental conditions, including seasonal changes, geographical location, and temperature. The influence of these factors becomes apparent when examining other studies conducted in different regions and at varying depths. For instance, in the California Current at 100 m depth [49] a ZFP contribution of up to 94% to the TMF has been reported. Similarly, in the Sargasso Sea at 150 m depth, approximately 89% corresponds to ZFP [50]. In contrast, at the same location but at a 3200 m depth, a much lower contribution of only 8% has been observed [51], while in the Bahamas (Atlantic Ocean) fecal pellets accounted for 3% of the TMF [43]. These findings align with the general trend of decreasing TMF as the sampling depth increases.
Zooplankton contributions to the fecal pellets are varied [52]. In some instances, it was found to be ≤10% (at the Iberian Shelf (50–200 m depth), i.e., at the Sargasso Sea (500 m), at the Bay of Calvi (36 m), and Central Artic Ocean (30–200 m) a fecal pellet contribution of 0.3–6.7%, 0.4–10%, <6% and <2%, respectively) was found [51,53,54,55]. These findings demonstrate a certain similarity with the results obtained in the present study, where the range of ZFP contribution within the TMF was also below 5%.
In the context of the present study, FFP emerged as the most significant contributor in terms of volume and percentage within the TMF. This observation aligns with the general trend observed in upwelling areas [52]. However, it should be noted that limited research exists on this particular topic. The relative contribution of fecal pellets to the TMF is influenced by various factors, including productivity variations, biomass levels, sedimentation rates, zooplankton size responsible for pellet production, pellet composition, EN events, zooplankton vertical migrations, among others [52]. Overall, these findings emphasize the complexity and multifaceted nature of fecal pellet dynamics in marine ecosystems. Further investigation is warranted to explore the specific mechanisms and ecological drivers that govern the contribution of fecal pellets to the TMF, particularly in upwelling regions like the NHCS.

4.3. Fecal Pellets Quantification and Attributes

FFPs were consistently detected as fragments in all samples analyzed, indicating their presence throughout the study area. The maximum number of pellet fragments observed was 61, which contrasts with the findings in Ica (Southern Peru, 15° S), where a higher maximum value of 2569 fragments was reported [40]. However, it should be noted that in their study, no fragments were found in certain stations, which was attributed to lower primary productivity conditions deemed atypical. These findings suggest that the number and distribution of FFP can vary spatially and may be influenced by local productivity dynamics.
ZFP exhibited two distinct shapes: cylindrical and ovoid. In the North Pacific Ocean, four forms of fecal pellets were reported: spherical, ovoid, cylindrical, and amorphous [56]. Different colors were reported as well: brown, light brown, transparent, red, and white. The present study found only brown, light brown, and somewhat whitish ZFP. The last two types can be attributed to bacterial decomposition, the addition of formaldehyde to the sample, and feeding on detritus or transparent flagellates [57,58]. Among the possible producers of ZFP, both in mesotrophic and oligotrophic systems, they could be large copepods or euphausiids, depending on their shape [56]. Studies on zooplankton communities in the same period and area of this work, suggest a potential connection between pellets produced locally and species occurring in the area [59]. The study found specimens from copepod groups such as Acartia, Hemicyclops, Harpacticoida, Oithona, Oncaea, and Paracalanus, as well as specimens from the Polychaeta group (not species defined). These findings propose that these would be the producers of the ZFP.
The estimated particle sinking velocities were relatively similar if compared with outer shelf estimations (based on large Euphausiids) (50–150 m·day−1), under comparatively reduced organic matter concentrations in the water column [60]. Macrozooplankton analysis (copepods and euphausiids > 500 µm) indicates 116.1 ± 55.9 m·day−1 for oligotrophic and mesotrophic waters [30]. The morphologic characteristics of pellets in these studies seem to better explain differences in sinking velocities, especially in cases such as rectangular pellets of salps and large copepods that tend to sink rapidly while smaller less-dense particles of copepods descend more slowly. Fish-produced pellets are particularly important in coastal areas where small engraulid schools generate massive dense pellets (most of them cylindrical) descending rapidly (e.g., 787 m·day−1) to the bottom [61]. Our findings indicate that FFP largely surpasses ZFP sinking velocities and has implications for the primary source of food reaching the seabed. A likely reason why FFP sinking velocity is lower than estimations in other study areas could be the seasonal occurrence of juvenile anchovy schools in the bay and along the entire Peruvian coast [13], partially explaining the size of pellets. However, the actual sinking velocity depends on particle properties, the study area and its circulation patterns, the amount of locally-produced organic material, and the activity of mobile consumers (e.g., plankters), among other factors [60,61].
The results of this study contribute to the understanding of FFP (better explained likely by E. ringens schools) and ZFP in the study area, highlighting the variability in pellet characteristics and potential sources. However, further investigations (e.g., including long-term observations addressing the EN and LN influence) are needed to elucidate the specific species-level contributions and ecological implications of these pellets within the local marine ecosystem. Such research can provide valuable insights into the dynamics of pellet production, their role in nutrient cycling, and their interactions with other components of the food web.

5. Conclusions

As discussed, high variability when contrasting TMF values in the same geographical area suggests the influence of the environmental scenario and the complexity of the ecological process. The 2017 coastal EN has been identified as a significant triggering factor of this variability. Indirect impacts on the vertical fluxes during these anomalous events seem to significantly increase TMFs; for instance, ten times greater than those observed under non-EN conditions in the present study. Furthermore, the presence of external sediment sources, such as rivers or marshes, can introduce sediments into the marine environment, potentially altering the characteristics of the water column and affecting the sinking and transport of fecal pellets. The interaction between these external sediment sources and the prevailing oceanographic conditions in the study area may contribute to the considerable variability in flux measurements.
It is important to note that factors not explicitly addressed in this study, such as variations in primary productivity, nutrient availability, zooplankton composition, and hydrodynamic conditions, can also influence the production and sinking of fecal pellets. Future research should strive to incorporate these additional factors to better understand the complex interplay of processes governing fecal pellet fluxes in the marine ecosystem. The variability in TMF results highlights the need for a comprehensive approach to studying fecal pellet dynamics, to produce an accurate diagnosis of the ecological significance of these processes in marine ecosystems. Most fecal pellets observed, likely originating from E. ringens, emerged as the primary contributors to the pellet flux input to the TMF in the study area; this is coherent with the role of anchovy schools in contributing to the downward transfer of nutrients in shallow waters as previously hypothesized. However, while FFPs were the primary contributors to the TMF, further investigations are necessary to fully understand the precise contribution of fecal pellets to the overall mass flux and its changes over time.

Author Contributions

Conceptualization, B.L., V.A. and U.M.; Data curation, B.L.; Formal analysis, B.L. and V.A.; Funding acquisition, U.M. and Michelle Graco; Investigation, B.L. and U.M.; Methodology, B.L., U.M., V.A., F.V., P.A. and E.F.; Project administration, U.M. and P.A.; Resources, V.A., U.M. and P.A.; Software, B.L.; Supervision, V.A. and U.M.; Validation, B.L., V.A. and R.K.; Visualization, B.L. and V.A.; Writing—original draft, B.L.; Writing—review & editing, B.L., V.A., U.M., R.K., P.A., E.F. and M.G. All authors have read and agreed to the published version of the manuscript.

Funding

This project was funded by the Collaborative Research Centre SFB 754 Climate-Biogeochemistry Interactions in the Tropical Ocean financed by the German Research Foundation (DFG). Additional funding was provided by the EU project AQUACOSM and the Leibniz Award 2012 granted to Ulf Riebesell and funding was provided by GEOMAR Helmholz Center for Ocean Research Kiel.

Institutional Review Board Statement

Not applicable.

Informed Consent Statement

Not applicable.

Data Availability Statement

The datasets will be available on the GEOMAR data repository via https://portal.geomar.de/kdmi#_48_INSTANCE_5P8d_=metadata%2F (accessed on 25 September 2023).

Acknowledgments

We thank Luis Vásquez, head of the General Direction of Research in Oceanography and Climate Change at the Marine Research Institute of Peru (IMARPE), and the scientists of the Laboratory of Marine Hydrochemistry, particularly the CHEM Wilson Carhuapoma, Jesus Ledesma and Kevin Diaz. The captains and crews of IMARPE VI are gratefully acknowledged for their support during the deployment and recovery of the sediment trap. This work is a contribution to the framework of the Cooperation agreement between the IMARPE and GEOMAR through the German Ministry for Education and Research (BMBF) CUSCO project in the framework of the research program “MARE:N—Küsten-, Meeres- und Polarforschung” (FONA3) under the specific call “Bedeutung von Klimaänderungen in küstennahen Auftriebsgebieten” and the national project Integrated Study of the Upwelling System off Peru developed by the Direction of Oceanography and Climate Change of IMARPE, PPR 137 CONCYTEC.

Conflicts of Interest

The authors declare no conflict of interest.

Appendix A

Table A1. Range and mean ± standard deviation of fecal pellets measurements.
SampleLength Range (mm)Length Mean (mm)Width Range (mm)Width Mean (mm)
Zooplankton fecal pellets
10.068–0.5300.17 ± 0.080.038–0.2070.08 ± 0.03
20.080–0.3660.16 ± 0.070.039–0.1430.08 ± 0.03
30.088–0.4400.17 ± 0.070.045–0.1500.08 ± 0.02
40.112–0.6110.24 ± 0.090.045–0.1890.09 ± 0.03
50.090–0.5690.19 ± 0.080.042–0.2790.09 ± 0.03
Fish fecal pellets
10.628–2.7991.54 ± 0.610.43–1.7950.93 ± 0.42
21.170–3.4982.33 ± 1.650.544–1.5431.04 ± 0.71
30.738–6.0701.76 ± 0.850.345–1.8361.04 ± 0.37
40.814–5.2271.63 ± 0.850.260–1.6010.64 ± 0.38
50.808–4.0991.51 ± 0.490.643–2.7961.32 ± 0.33
Table A2. Weight of fecal pellets from fish and zooplankton.
SampleProducerWeight (Aliquot)
(mg)
Weight (Sample)
(mg)
1Zooplankton68.883.2
Fish14.4
2Zooplankton0.81.6
Fish0.8
3Zooplankton2.476.8
Fish74.4
4Zooplankton2.811.6
Fish8.8
5Zooplankton3.238.4
Fish35.2
Table A3. Total mass flux (TMF) of the five samples with corresponding mean flux.
SamplesTotal Mass Flux (mg·m−2·day−1)
1860.9
270.2
3343.4
4354.8
5634.5
Mean flux601.9
Table A4. Fecal pellet flux and their contribution (%) to the total mass flux (TMF).
SampleSourcePellets Mass Flux (mg·m−2·day−1)Contribution to TMF (%)
1Zooplankton85.599.94
1Fish17.912.08
2Zooplankton11.42
2Fish11.42
3Zooplankton2.990.87
3Fish92.5626.95
4Zooplankton3.480.98
4Fish10.953.09
5Zooplankton0.170.03
5Fish1.830.29

References

  1. Karl, D.M.; Knauer, G.A.; Martin, J.H. Downward flux of particulate organic matter in the ocean: A particle decomposition paradox. Nature 1988, 332, 438–441. [Google Scholar] [CrossRef]
  2. Dale, A.W.; Graco, M.; Wallmann, K. Strong and Dynamic Benthic-Pelagic Coupling and Feedbacks in a Coastal Upwelling System (Peruvian Shelf). Front. Mar. Sci. 2017, 4, 29. [Google Scholar] [CrossRef]
  3. Giordani, P.; Helder, W.; Koning, E.; Miserocchi, S.; Danovaro, R.; Malaguti, A. Gradients of benthic–pelagic coupling and carbon budgets in the Adriatic and Northern Ionian Sea. J. Mar. Syst. 2002, 33–34, 365–387. [Google Scholar] [CrossRef]
  4. Griffiths, J.R.; Kadin, M.; Nascimento, F.J.A.; Tamelander, T.; Törnroos, A.; Bonaglia, S.; Bonsdorff, E.; Brüchert, V.; Gårdmark, A.; Järnström, M.; et al. The importance of benthic-pelagic coupling for marine ecosystem functioning in a changing world. Glob. Change Biol. 2017, 23, 2179–2196. [Google Scholar] [CrossRef]
  5. Echevin, V.; Aumont, O.; Ledesma, J.; Flores, G. The seasonal cycle of surface chlorophyll in the Peruvian upwelling system: A modelling study. Prog. Oceanogr. 2008, 79, 167–176. [Google Scholar] [CrossRef]
  6. Górska, B.; Soltwedel, T.; Schewe, I.; Włodarska-Kowalczuk, M. Bathymetric trends in biomass size spectra, carbon demand, and production of Arctic benthos (76-5561 m, Fram Strait). Prog. Oceanogr. 2020, 186, 102370. [Google Scholar] [CrossRef]
  7. Levin, L.A. Oxygen minimum zone benthos: Adaptation and community response to hypoxia. In Oceanography and Marine Biology; Gibson, R.N., Atkinson, R.J.A., Eds.; CRC Press: London, UK, 2003; Volume 41, pp. 1–45. [Google Scholar]
  8. Kalvelage, T.; Lavik, G.; Lam, P.; Contreras, S.; Arteaga, L.; Löscher, C.R.; Oschlies, A.; Paulmier, A.; Stramma, L.; Kuypers, M.M. Nitrogen cycling driven by organic matter export in the South Pacific oxygen minimum zone. Nat. Geosci. 2013, 6, 228–234. [Google Scholar] [CrossRef]
  9. van der Heijden, L.H.; Niquil, N.; Haraldsson, M.; Asmus, R.M.; Pacella, S.R.; Graeve, M.; Rzeznik-Orignac, J.; Asmus, H.; Saint-Béat, B.; Lebreton, B. Quantitative food web modeling unravels the importance of the microphytobenthos-meiofauna pathway for a high trophic transfer by meiofauna in soft-bottom intertidal food webs. Ecol. Model. 2020, 430, 109129. [Google Scholar] [CrossRef]
  10. Schukat, A.; Hagen, W.; Dorschner, S.; Correa, J.; Pinedo, E.L.; Ayón, P.; Auel, H. Zooplankton ecological traits maximize the trophic transfer efficiency of the Humboldt Current upwelling system. Prog. Oceanogr. 2021, 193, 102551. [Google Scholar] [CrossRef]
  11. Karstensen, J.; Ulloa, O. Peru-Chile current system. Earth Syst. Environ. Sci. 2009, 3, 437–444. [Google Scholar] [CrossRef]
  12. Chaigneau, A.; Dominguez, N.; Eldin, G.; Vasquez, L.; Flores, R.; Grados, C.; Echevin, V. Near-coastal circulation in the Northern Humboldt Current System from shipboard ADCP data. J. Geophys. Res. 2013, 118, 5251–5266. [Google Scholar] [CrossRef]
  13. Gutiérrez, M.; Swartzman, G.; Bertrand, A.; Bertrand, S. Anchovy (Engraulis ringens) and sardine (Sardinops sagax) spatial dynamics and aggregation patterns in the Humboldt Current ecosystem, Peru, from 1983–2003. Fish. Oceanogr. 2007, 16, 155–168. [Google Scholar] [CrossRef]
  14. Carr, M.E.; Kearns, E.J. Production regimes in four Eastern Boundary Current systems. Deep-Sea Res. Part II Top. Stud. Oceanogr. 2003, 50, 3199–3221. [Google Scholar] [CrossRef]
  15. Spinrad, R.W.; Glover, H.; Ward, B.B.; Codispoti, L.A.; Kullenberg, G. Suspended particle and bacterial maxima in Peruvian coastal waters during a cold water anomaly. Deep-Sea Res. Part Oceanogr. Res. Pap. 1989, 36, 715–733. [Google Scholar] [CrossRef]
  16. Ochoa, N.; Taylor, M.H.; Purca, S.; Ramos, E. Intra- and interannual variability of nearshore phytoplankton biovolume and community changes in the northern Humboldt Current system. J. Plankton Res. 2010, 32, 843–855. [Google Scholar] [CrossRef]
  17. Ledesma, J.; Tam, J.; Graco, M.; León, V.; Gonzáles, G.F.; Morón, O. Caracterización de la Zona de Mínimo de Oxígeno (ZMO) frente a la costa peruana entre 3° N y 14° S, 1999–2009. Bol. Inst. Mar Perú 2011, 26, 49–57. [Google Scholar]
  18. Velazco, F.; Mendoza, U.; Solís, J.; Fernandez, E.; Caquineau, S.; Sifeddine, A.; Graco, M.; Bouloubassi, I.; Turcq, B.; Leigh, B.; et al. Flujos de material particulado y formación de una lámina de sedimentos en la plataforma continental interna frente al Callao durante El Niño Costero 2017. Bol. Inst. Mar Perú. 2021, 36, 441. [Google Scholar] [CrossRef]
  19. Aramayo, V.; Romero, D.; Quipúzcoa, L.; Graco, M.; Marquina, R.; Solís, J.; and Velazco, F. Respuestas del bentos marino frente a El Niño costero 2017 en la plataforma continental de Perú central (Callao, 12° S). Bol. Inst. Mar. Perú 2021, 36, 476–509. [Google Scholar] [CrossRef]
  20. Tarazona, J.; Arntz, W. The Peruvian Coastal Upwelling System. In Coastal Marine Ecosystems of Latin America; Seeliger, U., Kjerfve, B., Eds.; Springer: Berlin, Germany, 2001; Volume 144, pp. 229–244. [Google Scholar] [CrossRef]
  21. Graco, M.; Anculle, T.; Aramayo, V.; Bernales, A.; Carhuapoma, W.; Correa, D.; Fernández, E.; Díaz, W.; Ledesma, J.; Marquina, R.; et al. Análisis de las condiciones oceanográficas y biológicas del afloramiento costero frente a Callao en períodos contrastantes durante el 2018. Bol. Inst. Mar Perú 2019, 34, 519–543. [Google Scholar]
  22. Velazco, F. Sedimentos marinos superficiales en la bahía del Callao, Perú. 1997. Bol. Inst. Mar Perú 2011, 26, 75–82. [Google Scholar]
  23. Velazco, F.; Solís, J.; Delgado, C.; Gomero, R. Sedimentos superficiales y morfología de la plataforma y talud continental superior entre 3°30′ S y 15°30′ S, Perú. Bol. Inst. Mar Perú. 2015, 42, 526–537. [Google Scholar]
  24. Mendoza, U.; Ayón, P.; Leigh, B.; Oyola, W.; Bach, L.; Caquineau, S.; Bouloubassi, I.; Velazco, F.; Turck, B.; Sifeddine, A.; et al. Procedimientos para división y retirada de nadadorespellets fecales de muestras de trampa de sedimento colectadas en el sistema de afloramiento del norte de la Corriente de Humboldt. Inf. Inst. Mar Perú. 2022, 49, 315–322. [Google Scholar]
  25. Chiarini, F.; Capotondi, L.; Giglio, F.; Dunbar, R.; Giglio, F.; Mammì, I.; Mucciarone, D.; Ravaioli, M.; Tesi, T.; Langone, L. A revised sediment trap splitting procedure for samples collected in the Antarctic Sea. Methods Ocean. 2013, 8, 14–22. [Google Scholar] [CrossRef]
  26. Conte, M.H.; Ralph, N.; Ross, E.H. Seasonal and interannual variability in deep ocean particle fluxes at the Oceanic Flux Program (OFP)/Bermuda Atlantic Time Series (BATS) site in the western Sargasso Sea near Bermuda. Deep-Sea Res. Part II Top. Stud. Oceanogr. 2001, 48, 1471–1505. [Google Scholar] [CrossRef]
  27. Honjo, S.; Manganini, S.J. Annual biogenic particle fluxes to the interior of the North Atlantic Ocean; studied at 34° N 21° W and 48° N 21° W. Deep-Sea Res. Part II Top. Stud. Oceanogr. 1993, 40, 587–607. [Google Scholar] [CrossRef]
  28. Miquel, J.C.; Fowler, S.W.; La Rosa, J.; Buat-Menard, P. Dynamics of the downward flux of particles and carbon in the open northwestern Mediterranean Sea. Deep-Sea Res. Part I Oceanogr. Res. Pap. 1994, 41, 243–261. [Google Scholar] [CrossRef]
  29. Karl, D.M.; Christian, J.R.; Dore, J.E.; Hebel, D.V.; Letelier, R.M.; Tupas, L.M.; Winn, C.D. Seasonal and interannual variability in primary production and particle flux at station ALOHA. Deep-Sea Res. Part II Top. Stud. Oceanogr. 1996, 43, 539–568. [Google Scholar] [CrossRef]
  30. Boxhammer, T.; Bach, L.T.; Czerny, J.; Riebesell, U. Technical note: Sampling and processing of mesocosm sediment trap material for quantitative biogeochemical analysis. Biogeosciences 2016, 13, 2849–2858. [Google Scholar] [CrossRef]
  31. Ehrhardt, M.; Koeve, W. Determination of particulate organic carbon and nitrogen. In Methods of Seawater Analysis; Grasshoff, K., Kremling, K., Ehrhardt, M., Eds.; Wiley: Weinheim, Germany, 1999; Volume 3, pp. 437–444. [Google Scholar]
  32. Yoon, W.; Kim, S.; Han, K. Morphology and sinking velocities of fecal pellets of copepod, molluscan, euphausiid, and salp taxa in the northeastern tropical Atlantic. Mar. Biol. 2001, 139, 923–928. [Google Scholar] [CrossRef]
  33. Komar, P.D.; Morse, A.P.; Small, L.F.; Fowler, S. An analysis of sinking rates of natural copepod and euphausiid fecal pellets. Limnol. Oceanogr. 1981, 26, 172–180. [Google Scholar] [CrossRef]
  34. Dillon, W.P. Flotation techniques for separating fecal pellets and small organisms from sand. Limnol. Oceanogr. 1964, 4, 467–614. [Google Scholar] [CrossRef]
  35. Urban, J.L.; Deibel, D.; Schwinghamer, P. Seasonal variations in the densities of fecal pellets produced by Oikopleura vanhoeffeni (C. Larvacea) and Calanus finmarchicus (C. Copepoda). Mari. Biol. 1993, 117, 607–613. [Google Scholar] [CrossRef]
  36. Janke, N.C. Effect of shape upon the settling velocity of regular convex geometric particles. J. Sediment. Petrol. 1966, 36, 370–376. [Google Scholar] [CrossRef]
  37. Bretagnon, M.; Paulmier, A.; Garçon, V.; Dewitte, B.; Illig, S.; Leblond, N.; Coppola, L.; Campos, F.; Velazco, F.; Panagiotopoulos, C.; et al. Modulation of the vertical particle transfer efficiency in the oxygen minimum zone off Peru. Biogeosciences 2018, 15, 5093–5111. [Google Scholar] [CrossRef]
  38. Cerda, M.; Knoppers, B.; Valdés, J.; Fettah Siffedine, A.; Ortlieb, L.; Sabadini-Santos, E. Variación espacial y temporal de las masas de agua, nutrientes y sedimentación de la materia orgánica e inorgánica en la bahía Mejillones del sur (23° S), Chile. Rev. Chilena Hist. Nat. 2010, 83, 402–409. [Google Scholar] [CrossRef]
  39. Farías, L.; Chuecas, L.; Salamanca, M. Effect of coastal upwelling on nitrogen regeneration from sediments and ammonium supply to the water column in Concepcion Bay, Chile. Estuar. Coast. Shelf Sci. 1996, 43, 137–155. [Google Scholar] [CrossRef]
  40. Staresinic, N.; Farrington, J.; Gagosian, R.B.; Clifford, C.H.; Hulburt, E.M. Downward Transport of Particulate Matter in the Peru Coastal Upwelling: Role of the Anchoveta, Engraulis ringens. In Coastal Upwelling Its Sediment Record: Part A: Responses of the Sedimentary Regime to Present Coastal Upwelling; Suess, E., Thiede, J., Eds.; Springer: New York, NY, USA, 1983; pp. 225–240. [Google Scholar] [CrossRef]
  41. Rowe, G.T. Benthic production and processes off Baja California, Northwest Africa and Peru: A classification of benthic subsystems in upwelling ecosystems. Int. Symp. Upw. W Afr. Inst. Inv. Pesq. 1985, 2, 589–612. Available online: https://tamug-ir.tdl.org/handle/1969.3/28322 (accessed on 7 August 2023).
  42. Rodier, M.; Le Borgne, R. Export flux of particles at the equator in the western and central Pacific ocean. Deep. Sea Res. Part II Top. Stud. Oceanogr. 1997, 44, 2085–2113. [Google Scholar] [CrossRef]
  43. Pilskaln, C.; Neumann, S.; Bane, J. Periplatform flux in the northern Bahamas. Deep-Sea Res. 1989, 36, 1391–1406. [Google Scholar] [CrossRef]
  44. Estapa, M.; Buesseler, K.; Durkin, C.A.; Omand, M.; Benitez-Nelson, C.R.; Roca-Martí, M.; Breves, E.; Kelly, R.P.; Pike, S. Biogenic sinking particle fluxes and sediment trap collection efficiency at Ocean Station Papa. Elem. Sci. Anthr. 2021, 9, 122. [Google Scholar] [CrossRef]
  45. Daneri, G.; Dellarossa, V.; Quiñones, R.; Jacob, B.; Montero, P.; Ulloa, O. Primary production and community respiration in the Humboldt Current System off Chile and associated oceanic areas. Mar. Ecol. Prog. Ser. 2000, 197, 41–49. [Google Scholar] [CrossRef]
  46. Contreras, S.; Pantoja, S.; Neira, C.; Lange, C.B. Biogeochemistry of surface sediments off Concepción (∼36° S), Chile: El Niño vs. non-El Niño conditions. Prog. Oceanogr. 2007, 75, 576–585. [Google Scholar] [CrossRef]
  47. ENFEN Report. Available online: http://met.igp.gob.pe/elnino/lista_eventos.html (accessed on 10 April 2023).
  48. Espinoza-Morriberon, D.; Echevin, V.; Colas, F.; Tam, J.; Ledesma, J.; Vasquez, L.; Graco, M. Impacts of El Nino events on the Peruvian upwelling system productivity. J. Geophys. Res. Oceans. 2017, 122, 5423–5444. [Google Scholar] [CrossRef]
  49. Stukel, M.; Ohman, M.; Benitez-Nelson, C.; Landry, M. Contributions of mesozooplankton to vertical carbon export in a coastal upwelling system. Mar. Ecol. Prog. Ser. 2013, 491, 47–65. [Google Scholar] [CrossRef]
  50. Steinberg, D.; Lomas, M.; Cope, J. Long-term increase in mesozooplankton biomass in the Sargasso Sea: Linkage to climate and implications for food web dynamics and biogeochemical cycling. Glob. Biogeochem. Cycles 2012, 26, 1004. [Google Scholar] [CrossRef]
  51. Shatova, O.; Koweek, D.; Conte, M.; Weber, J. Contribution of zooplankton fecal pellets to deep ocean particle flux in the Sargasso Sea assessed using quantitative image analysis. J. Plankton Res. 2012, 34, 905–921. [Google Scholar] [CrossRef]
  52. Turner, J. Zooplankton Fecal Pellets, Marine Snow, Phytodetritus and the Ocean’s Biological Pump. Prog. Oceanogr. 2014, 13, 205–248. [Google Scholar] [CrossRef]
  53. Wexels, C.; Wassmann, P.; Olli, K.; Pasternak, A.; Arashkevich, E. Seasonal variation in production, retention, and export of zooplankton faecal pellets in the marginal ice zone and central Barents Sea. J. Mar. Syst. 2002, 38, 175–188. [Google Scholar] [CrossRef]
  54. Frangoulis, C.; Skliris, N.; Lepoint, G.; Elkalay, K.; Goffart, A.; Pinnegar, J.K.; Hecq, J.-H. Importance of copepod carcasses versus fecal pellets in the upper water column of an oligotrophic area. Estuar. Coast. Shelf Sci. 2011, 92, 456–463. [Google Scholar] [CrossRef]
  55. Olli, K.; Wassmann, P.; Reigstad, M.; Ratkova, T.N.; Arashkevich, E.; Pasternak, A.; Matrai, P.A.; Knulst, J.; Tranvik, L.; Klais, R.; et al. The fate of production in the central Arctic Ocean—Top-down regulation by zooplankton expatriates? Prog. Oceanogr. 2007, 72, 84–113. [Google Scholar] [CrossRef]
  56. Wilson, S.; Steinberg, D.; Buesseler, K. Changes in fecal pellet characteristics with depth as indicators of zooplankton repackaging of particles in the mesopelagic zone of the subtropical and subarctic North Pacific Ocean. Deep-Sea Res. Part II Top. Stud. Oceanogr. 2008, 55, 1636–1647. [Google Scholar] [CrossRef]
  57. Urrére, M.; Knauer, G. Zooplankton fecal pellet flaxes and vertical transport of participate organic material in the pelagic environment. J. Plankton Res. 1981, 3, 369–387. [Google Scholar] [CrossRef]
  58. Noji, T.; Estep, K.; MacIntyre, F.; Norrbin, F. Image analysis of faecal material grazed upon by three species of copepods: Evidence for coprohexy, coprophagy, and coprochaly. J. Mar. Biol. Assoc. 1991, 71, 465–480. [Google Scholar] [CrossRef]
  59. Ayón, P.; Pinedo, E.; Schukat, A.; Taucher, J.; Kiko, R.; Hauss, H.; Dorschner, S.; Hagen, W.; Segura-Noguera, M.; Lischka, S. Zooplankton community succession and trophic links during a mesocosm experiment in the coastal upwelling off Callao Bay (Peru). Biogeosciences 2023, 20, 945–969. [Google Scholar] [CrossRef]
  60. McDonnell, A.M.P.; Buesseler, K.O. Variability in the average sinking velocity of marine particles. Limnol. Oceanogr. 2010, 55, 2085–2096. [Google Scholar] [CrossRef]
  61. Saba, G.K.; Steinberg, D.K. Abundance, Composition and Sinking Rates of Fish Fecal Pellets in the Santa Barbara Channel. Sci. Rep. 2012, 2, 716. [Google Scholar] [CrossRef]
Figure 1. Study area (central Peru, 12° S) indicating the deployment site for the sediment trap (black circle).
Hydrobiology 02 00035 g001
Figure 2. (a) Mooring array scheme with tethered automatic sediment trap (not drawn to scale), (b) previous setup of the sediment trap, (c) preparation and checking on board, and (d) sample reception.
Hydrobiology 02 00035 g002
Figure 3. (a) Zooplankton fecal pellets presenting different shapes (cylindrical and ovoid), sizes, and colors. (b) Fish fecal pellets (cylindrical shape only, all as fragments).
Hydrobiology 02 00035 g003
Figure 4. Length and width of (a,b) ZFP, and (c,d) FFP.
Hydrobiology 02 00035 g004
Figure 5. TMF, zooplankton, and fish fecal pellets flux comparison.
Hydrobiology 02 00035 g005
Figure 6. Estimated sinking velocities for fish and zooplankton pellets. Axes in logarithmic scale.
Hydrobiology 02 00035 g006
Table 1. Sampling dates of the sampling bottles attached to the multi-sediment trap.
Bottles NumberSampling Start DateSampling End DatePeriod
114 March 202023 March 202010 days
224 March 20202 April 202010 days
33 April 202012 April 202010 days
413 April 202022 April 202010 days
523 April 202018 December 2020239 days
Table 2. Fecal pellet shapes, count, types, and volume from samples 1–5.
ParameterSampleType of Pellet
12345
Count3841122083323360Zooplankton
Cylindrical shape (%)36.517.913.533.716.2
Ovoid shape (%)63.582.186.566.383.8
Volume (mm3)0.30.10.10.43.2
Count14882161161472Fish
Volume (mm3)205.627.2406.276.13392.6
Total count5321204244484832
Total volume (mm3)206.127.4406.476.93398.1
Table 3. TMF and fecal pellets contribution from other studies.
Study AreaDepth (m)Sampling DateEl Niño EventTMF (mg·m−2·day−1)Fecal Pellets Contribution (%)Study
Callao Bay—Peru30March–December 2020 601.90.03–26.95%This study
Callao Bay—Peru30January–April 20172017 coastal El Niño4502 ± 1892 [18]
Mejillones Bay—Chile30January–February 2004 1100 ± 400 [38]
Concepcion Bay—Chile30January 1993 4600 ± 300 [39]
Punta Santa Ana—Peru501978 0–17%[40]
~50 km off Lima, Peru34January–March 2013 427 ± 21760–70%[37]
June–November 2013 986 ± 1422
Callao Bay—Peru301976–1978 16,800 [41]
Central Pacific, Ecuador105September–October 1994El Niño973 ± 72 [42]
125 277 ± 81
155 639 ± 264
175 297 ± 77
Northern Bahamas—USA (Atlantic Ocean)500February–June 1985 593%[43]
Ocean Station Papa—USA (Alaska)96August 2018 89 ± 3.8 [44]
97 83.5 ± 14.8
Disclaimer/Publisher’s Note: The statements, opinions and data contained in all publications are solely those of the individual author(s) and contributor(s) and not of MDPI and/or the editor(s). MDPI and/or the editor(s) disclaim responsibility for any injury to people or property resulting from any ideas, methods, instructions or products referred to in the content.

