Phytoplankton Blooms, Red Tides and Mucilaginous Aggregates in the Urban Thessaloniki Bay, Eastern Mediterranean


1
Department of Botany, School of Biology, Aristotle University of Thessaloniki, 54124 Thessaloniki, Greece
2
School of Economics, Business Administration and Legal Studies, International Hellenic University, 57001 Thermi, Greece
3
Geomar Helmholtz Centre for Ocean Research Kiel, 24105 Kiel, Germany
*
Author to whom correspondence should be addressed.
Diversity 2019, 11(8), 136; https://doi.org/10.3390/d11080136
Submission received: 5 July 2019
/
Accepted: 12 August 2019
/
Published: 14 August 2019
(This article belongs to the Special Issue Biodiversity of Marine Microbes)
Abstract
:We investigated the plankton community composition and abundance in the urban marine environment of Thessaloniki Bay. We collected water samples weekly from March 2017 to February 2018 at the coastal front of Thessaloniki city center and monthly samples from three other inshore sites along the urban front of the bay. During the study period, conspicuous and successive phytoplankton blooms, dominated by known mucilage-producing diatoms alternated with red tide events formed by the dinoflagellates Noctiluca scintillans and Spatulodinium pseudonoctiluca, and an extensive mucilage aggregate phenomenon, which appeared in late June 2017. At least 11 known harmful algae were identified throughout the study, with the increase in the abundance of the known harmful dinoflagellate Dinophysis cf. acuminata occurring in October and November 2017. Finally, a red tide caused by the photosynthetic ciliate Mesodinium rubrum on December 2017 was conspicuous throughout the sampling sites. The above-mentioned harmful blooms and red tides were linked to high nutrient concentrations and eutrophication. This paper provides an overview of eutrophication impacts on the response of the unicellular eukaryotic plankton organisms and their impact on water quality and ecosystem services.
1. Introduction
On a global scale, the rate of coastal urbanization will increase rapidly in the next decades, and in combination with climate change is projected to result in an increased risk of coastal eutrophication [1,2]. Sewage inputs from coastal cities that are transported directly to coastal waters can act synergistically with land-based sources and river run-off causing high levels of nutrients [3,4]. Consequently, the global Indicator for Coastal Eutrophication Potential (ICEP) analyses indicate that the potential for coastal eutrophication continuously grows worldwide [2]. Worldwide eutrophication has led to phytoplankton abundance and biomass increase [5,6,7], while more coastal harmful algal blooms (HABs), with more toxic species, have been linked with eutrophication phenomena [8,9]. Numerous examples of linkages between nutrient loading and coastal phytoplankton blooms and mucilagine aggregate phenomena [10,11] include the involvement of harmful species, i.e., the diatom Pseudonitzschia spp. in the Gulf of Mexico [12], the dinoflagellates Prorocentrum sp., and Karenia mikimotoi along the coast of China [13], and the red tide-forming heterotrophic dinoflagellate Noctiluca scintillans [14,15,16].
A large volume of domestic and industrial wastes from the city of Thessaloniki has been directed for decades to the Thermaikos Gulf and especially its inner part, Thessaloniki Bay. In the 20th century, these wastes were discharged in the Bay without treatment, causing the eutrophication of the system. Since 2001, wastewater treatment has been implemented, decreasing the effects of anthropogenic eutrophication [17]. Although it is generally accepted in the public that the water quality in the Thermaikos Gulf has been improved compared to 20–30 years ago [18,19], the urban front of the Thessaloniki Bay, with restricted water circulation and shallowness, still exhibits apparent red tides and algal blooms. These events are usually the cause of irritation to the public, often mentioned in the Greek media, with subsequent socio-economic consequences to the city of Thessaloniki, especially the touristic center. Despite the growing concerns of the citizens and authorities on the water quality of the Bay and particularly of the urban front, only scarce and isolated studies have been published on the abundance and dynamics of plankton community (both phyto- and protozooplankton) in the urban part of the Gulf [20,21]. On the other hand, several studies in the broader Thermaikos Gulf have focused on phytoplankton [18,22,23] and the occurrence of HABs [24,25]. However, comprehensive studies on red tides and mucilage aggregate phenomena are lacking for the Thermaikos Gulf.
According to the related legislation for the ecological water quality based on nutrient pressures and the phytoplankton quality element (Water Framework Directive; WFD, 2000/60/EC) there is a need for systematic and frequent monitoring of coastal waters. Furthermore, similar to the WFD objectives are those of Marine Strategy Framework Directive (MSFD, 2008/56/EC) for achieving good environmental status of EU marine waters by 2020. The MSFD eutrophication quality descriptor (D5) refers to the adverse effects of eutrophication including harmful algae blooms [26].
The aim of this paper was to examine the shift in the protagonists of the conspicuous and successive algal blooms, red tides and mucilage aggregations in the urban marine environment of the Thessaloniki Bay, by investigating the temporal and spatial changes of the unicellular eukaryotic plankton community attributes (species diversity, dominance, and abundance). This is the first study concerning the phyto- and protozoo-plankton species succession at an annual time scale with weekly samplings, with conspicuous phytoplankton blooms, red tides and a mucilage aggregate phenomenon, in the urban coastal front of the Thessaloniki Bay (Thermaikos Gulf). The present work focuses on the zone linking the terrestrial and the coastal environments heavily affected by, and influencing various human activities, such as the harbor, tourism, industry, mussel cultures, and sewage effluents.
2. Materials and Methods
2.1. Sampling Sites and Sample Collection
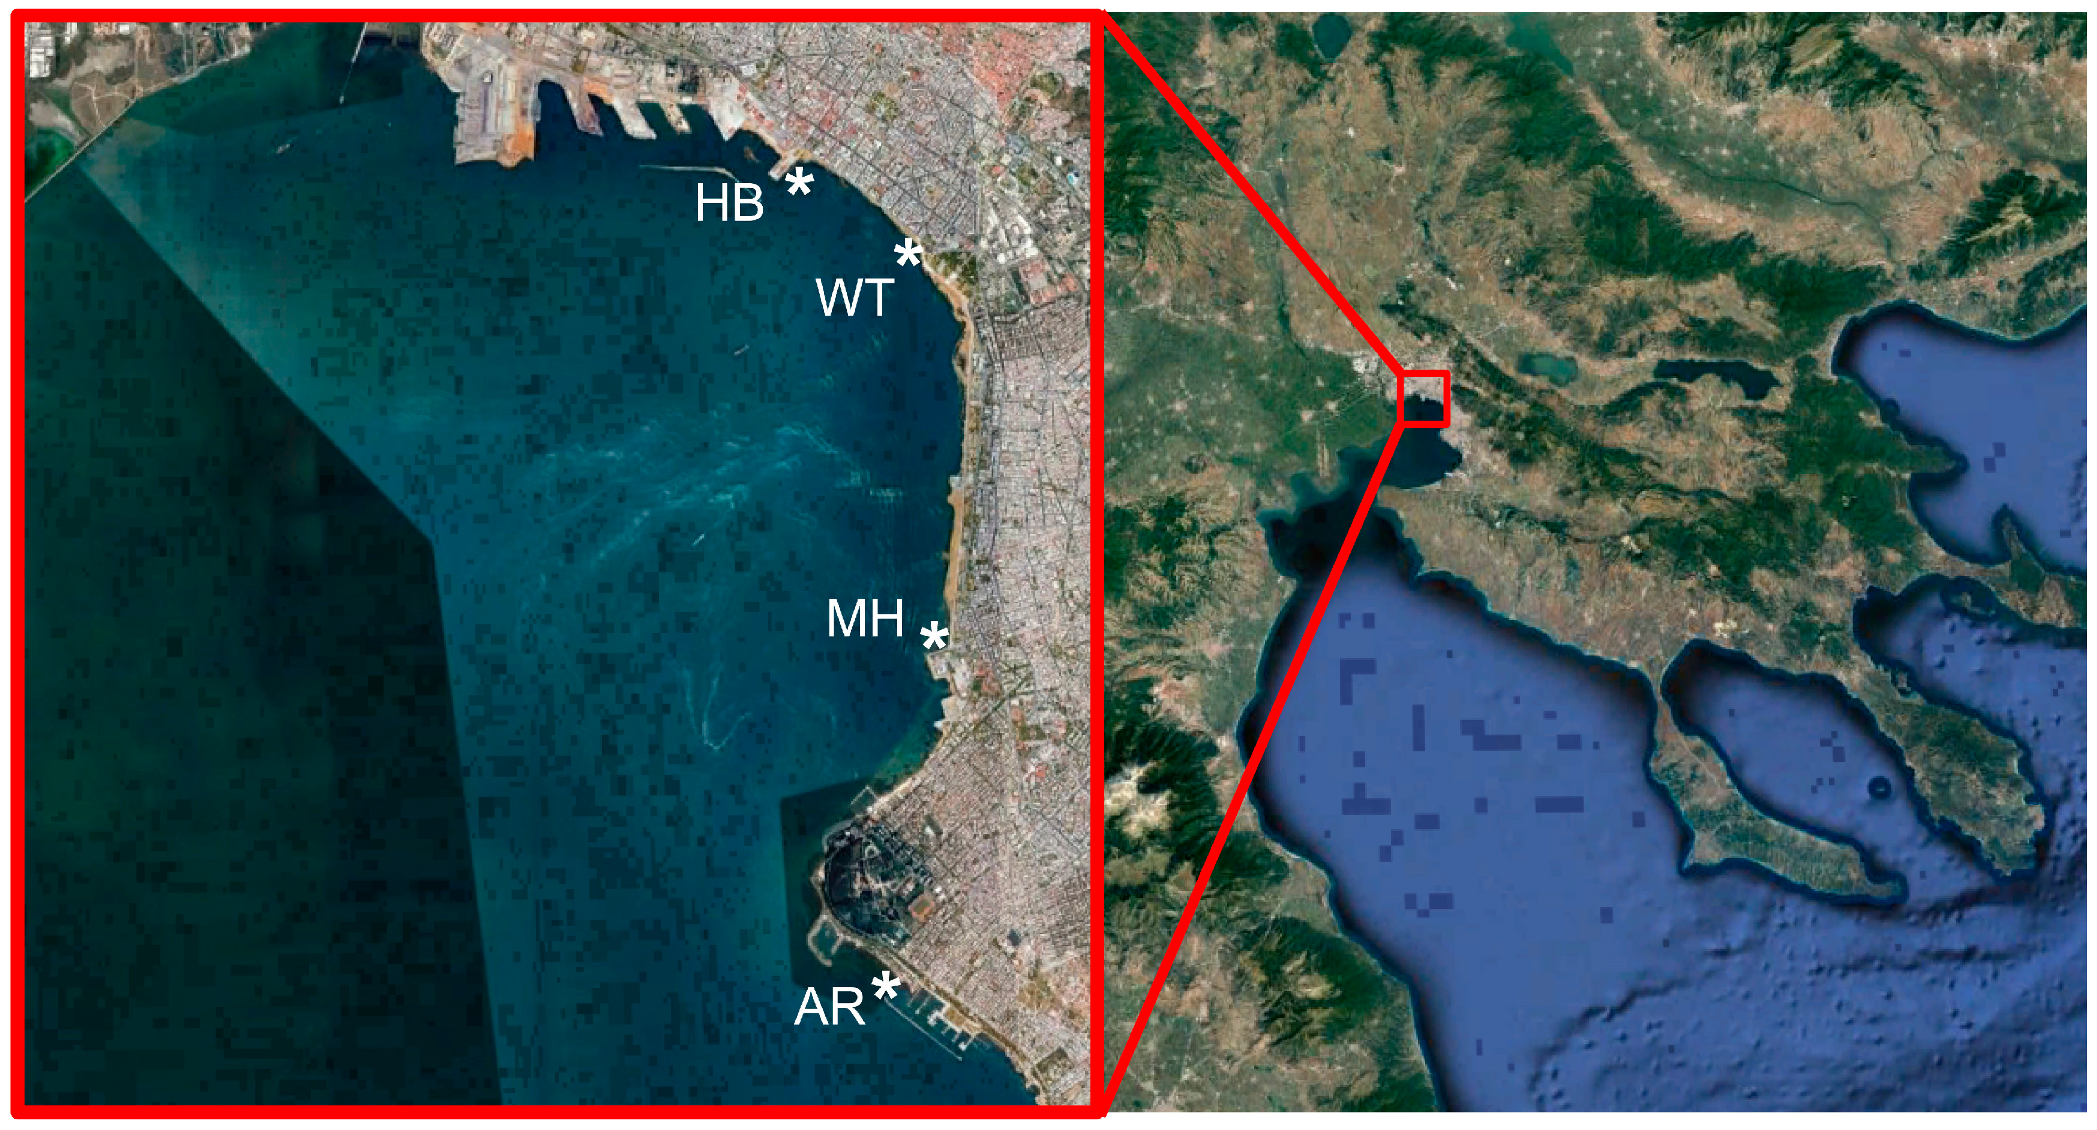
Samples were collected weekly from March 2017 to February 2018, from a coastal inshore sampling site in the White Tower (WT) in the center of the city of Thessaloniki (Table 1; Figure 1). During the same period, every month, additional samples were collected from three other inshore sites along the urban front of the Bay, namely at Aretsou Beach (AR), Music Hall coast (MH), and harbor (HB) (Table 1; Figure 1). In total, 47 samples were collected from WT and 12 from each other site (Table 1). All sampling sites had a maximal depth of 4 m.
During all samplings, in situ measurements of water temperature and conductivity were made with the use of the YSI Pro 1030 instrument (YSI Inc., Yellow Springs, OH, USA). Conductivity was transformed to salinity based on the equation in Weyl [27]. Water samples of 2 L were collected from the surface layer of 1 m, and separated as follows: (i) a subsample of 0.5 L was used for immediate microscopic observation of the living microbial eukaryotic community; (ii) a subsample of 0.5 L was preserved in Lugol’s solution and kept in the dark in room temperature for microscopic analysis within the next few days; (iii) subsamples of 100–250 mL (depending on plankton and particulate matter density) were immediately filtered onto 0.7 μm pre-washed (in 5–10% HCl) and pre-combusted (6 h, 550 °C) Whatman GF/F filters, and the filters were stored in −20 °C until future particulate organic phosphorus and chlorophyll a (Chl a) measurements; (iv) a subsample of 50 mL was filtered through 0.2 μm cellulose acetate filters (Sartorius) and the filtered water aliquots were kept in −20 °C until future dissolved inorganic nutrient measurements.
2.2. Chl a and Nutrient Measurements
Chl a content was estimated according to Jeffrey and Humphrey [28]. Prior to the photochemical measurements (HITACHI, U2900) filters were put into 8 mL acetone (90%) for 24 h in the dark at 6 °C.
Particulate organic phosphorus (POP) was measured colorimetrically by an element analyzer (Thermo Scientific Flash 2000) at 882 nm, following the protocol by Hansen and Koroleff [29]. Nitrate and nitrite (NO3− and NO2−), ammonium (NH4+), silicate (SiO4−), and phosphate (PO4−) were, also, measured according to Hansen and Koroleff [29].
Furthermore, the Eutrophication Index (E.I.) of Primpas et al. [30] was used in order to assess the eutrophication status of Thessaloniki Bay. The formula takes into consideration the NO3− and NO2−, ammonium, PO4−, and Chl α concentrations resulting in three distinct ranges describing oligotrophy (0.04–0.38), mesotrophy (0.37–0.87), and eutrophication (0.83–1.51). The ranges are further divided into a five-scale scheme according to the WFD requirements, in order to assess the water quality status, as follows:
- High ecological water quality: <0.04
- Good: 0.04–0.38
- Moderate: 0.38–0.85
- Poor: 0.85–1.51
- Bad: >1.51
The E.I. was calculated according to the following equation:
E.I. = 0.279 × PO4 + 0.261 × NO3 + 0.296 × NO2 + 0.275 × NH3 + 0.214 × Chl a
2.3. Microscopic Analysis
Planktonic unicellular eukaryotes were examined in sedimentation chambers using an inverted epi-fluorescence microscope (Nikon Eclipse TE 2000-S, Melville, USA), with phase contrast. Taxa were identified based on taxonomic keys and relevant papers [31,32,33]. Light and phase-contrast micrographs of live and Lugol-preserved cells were taken using a digital microscope camera (Nikon DS-L1, Melville, USA). Plankton counts (cells and colonies) were performed using the inverted microscope method [34]. At least 400 individuals in total, and 100 individuals of the most abundant taxa, were counted per sample in sedimentation chambers. Taxa comprising of > 10% of the total plankton abundance per sample were arbitrarily considered to be dominant for that particular sample. Population density of 1000 cells mL−1 for a particular phytoplankton taxon in a sample was considered as a baseline bloom density in this urban coastal environment. This threshold is based on the Greek eutrophication scale and the total phytoplankton abundance (960 cells mL−1) given as an indicator of bad water quality or eutrophic coastal waters [35]. Potentially harmful plankton taxa identified during the study, were acknowledged according to the IOC-UNESCO Taxonomic Reference List of Harmful Microalgae.
2.4. Data Analysis
Alpha-diversity estimators (the Simpson, Shannon, Evenness, Equitability, and Berger–Parker indices) were calculated with the PAST 2.17c software [36] in all samples. These indices have been reported to better describe general properties of the communities [37] and reflect anthropogenic or environmental variability effects on ecosystem functions [38]. Paired t-tests were applied in PAST 2.17c software to compare the (i) physical and chemical variables and (ii), richness, abundance, and the alpha-diversity estimators between the four sampling sites. The p-values < 0.05 indicated significant differences between pairwise comparisons. Furthermore, pairwise comparisons of sampling sites, based on the relative abundance of individual taxa, were implemented with the Kolmogorov–Smirnov test in the PAST 2.17c software.
The plankton assemblages of the different samplings were compared using the Plymouth routines in the multivariate ecological research software package PRIMER v.6 [39]. The Jaccard coefficients were calculated to develop the matrix based on taxa abundance in order to identify interrelationships between samples and construct cluster and MDS (multi-dimensional scaling) plots. The similarity profile (SIMPROF) permutation test was conducted to determine the significance of the dendrogram branches resulting from cluster analysis.
Network analysis was performed in order to explore strong relationships among plankton taxa, and between plankton taxa and environmental parameters in all samplings. The relationships were characterized through MINE (maximal information-based nonparametric exploration) statistics by computing the maximal information coefficient (MIC) between each pair of taxa, and pairs of taxa and environmental parameters [40], considering abundance values for each taxon. MIC is a non-parametric method which captures associations (linear or non-linear) between data pairs. It provides a score that represents the strength of the relationship. The matrix of MIC values corresponding to p-values < 0.01, based on pre-computed p-values of various MIC scores at different sample sizes, was used to visualize the networks of associations with Cytoscape 3.5.1 [41]. Furthermore, correlation analysis was conducted in order to investigate the relationships between the plankton taxonomic groups and the E.I., and the inorganic nutrient molar ratios (N:P, Si:N, Si:P).
3. Results
3.1. Environmental Parameters
Seawater temperature recorded in the WT sampling site during the period of the study ranged from 9.60 to 29.7 °C and salinity from 32.8 to 38.8 (Table 2), mean 37.2. The concentrations of inorganic nutrients (SiO4, PO4, NO3, NO2, NH4), and particulate organic phosphorus (POP) all exhibited strong fluctuations throughout the entire study period, with some extreme high values recorded in all sites, especially in WT (Supplementary Figure S1). In particular, remarkably high values were recorded for all nutrients on 22 March 2017 in the WT, (SiO4: 10.17 μmol L−1; PO4: 9.54 μmol L−1; NO2: 0.77 μmol L−1; NO3 and NO2: 7.53 μmol L−1; NH4: 160.3 μmol L−1; POP: 42.1 μmol L−1), followed by high values of most nutrients during the sampling on 28 June 2017 in WT and MH, 20 September 2017 in all sites, and 10 January 2018 in WT. Additionally, the highest value of NH4 (32.86 μmol L−1) was recorded on 18 October 2017 in HB. The annual means of Chl a for each station were as follows: WT: 2.62 μg L−1, AR: 3.11 μg L−1, MH: 1.43 μg L−1 and HB: 3.15 μg L−1. Furthermore, Chl a showed marked variability, ranging from 0.27 μg L−1 on 27 December 2017 in WT, to 17.28 μg L−1 on 13 December 2017 in WT. The mean inorganic nutrient ratios were 25.1 for N:P, 0.70 for Si:N and 18.4 for Si:P. The maximum N:P (71.9) and Si:P (76.6) ratios in WT was measured on 28 June 2017 while the minimum N:P ratio (10.1) on 13 December 2017 and the minimum Si:P ratio (1) on 22 March 2017. In the rest of the sites, the maximum N:P and Si:P ratios were recorded in August samples and the minimum in November (HB) and December samples (AR, MH). The calculated Si:N ratios were relatively low (< 2) in all samples with maximum values coinciding with diatom blooms. All the calculated E.I. values exceeded the value 0.83 in all samples (data not shown), thus were indicative for eutrophication, reaching the highest value during the 22 March 2017 red tide event (49.5).
Considering the common sampling dates conducted in the different sampling sites, no significant differences were found in almost all paired comparisons of environmental parameters, based on t-tests (for a visualization of mean values of environmental parameters in each sampling site, see Supplementary Figure S2). Significant differences were found between sites for NO2 (with AR > MH), for NO3 and NO2 (WT > MH; AR > MH), and for POP (WT > MH; MH < HB) (Supplementary Table S1). Furthermore, higher ammonia (NH4) concentrations were recorded at HB (Table 2), even though no statistically significant differences between sites were found.
3.2. Plankton Diversity and Abundance
A total of 117 plankton morphospecies were identified in all four sampling sites during the study period (Supplementary Table S2). The taxonomic group of Bacillariophyta (diatoms) had the highest overall species richness as 44% of the total number of taxa belonged to this group, and was followed by Dinophyta (including also mixotrophic and heterotrophic dinoflagellates) (37% of the total number of taxa), Cryptophyta (5%), Haptophyta (3%), Chlorophyta (2%), Dictyochophyta (2%), and Euglenozoa (2%), while other groups (Cercozoa, Chrysophyceae, Telonemida, Xanthophyceae, and Ciliophora) contributed with < 2% of the total number of taxa (Supplementary Figure S3). In the four sampling sites, dinoflagellates were more diverse in terms of species richness during March 2017–November 2017, while diatoms appeared to be more diverse, in all sites, during December 2017–February 2018 (Supplementary Figure S3). The other taxonomic groups had a more or less consistent representation that altogether did not exceed in any case 40% of the total number of taxa in a sample.
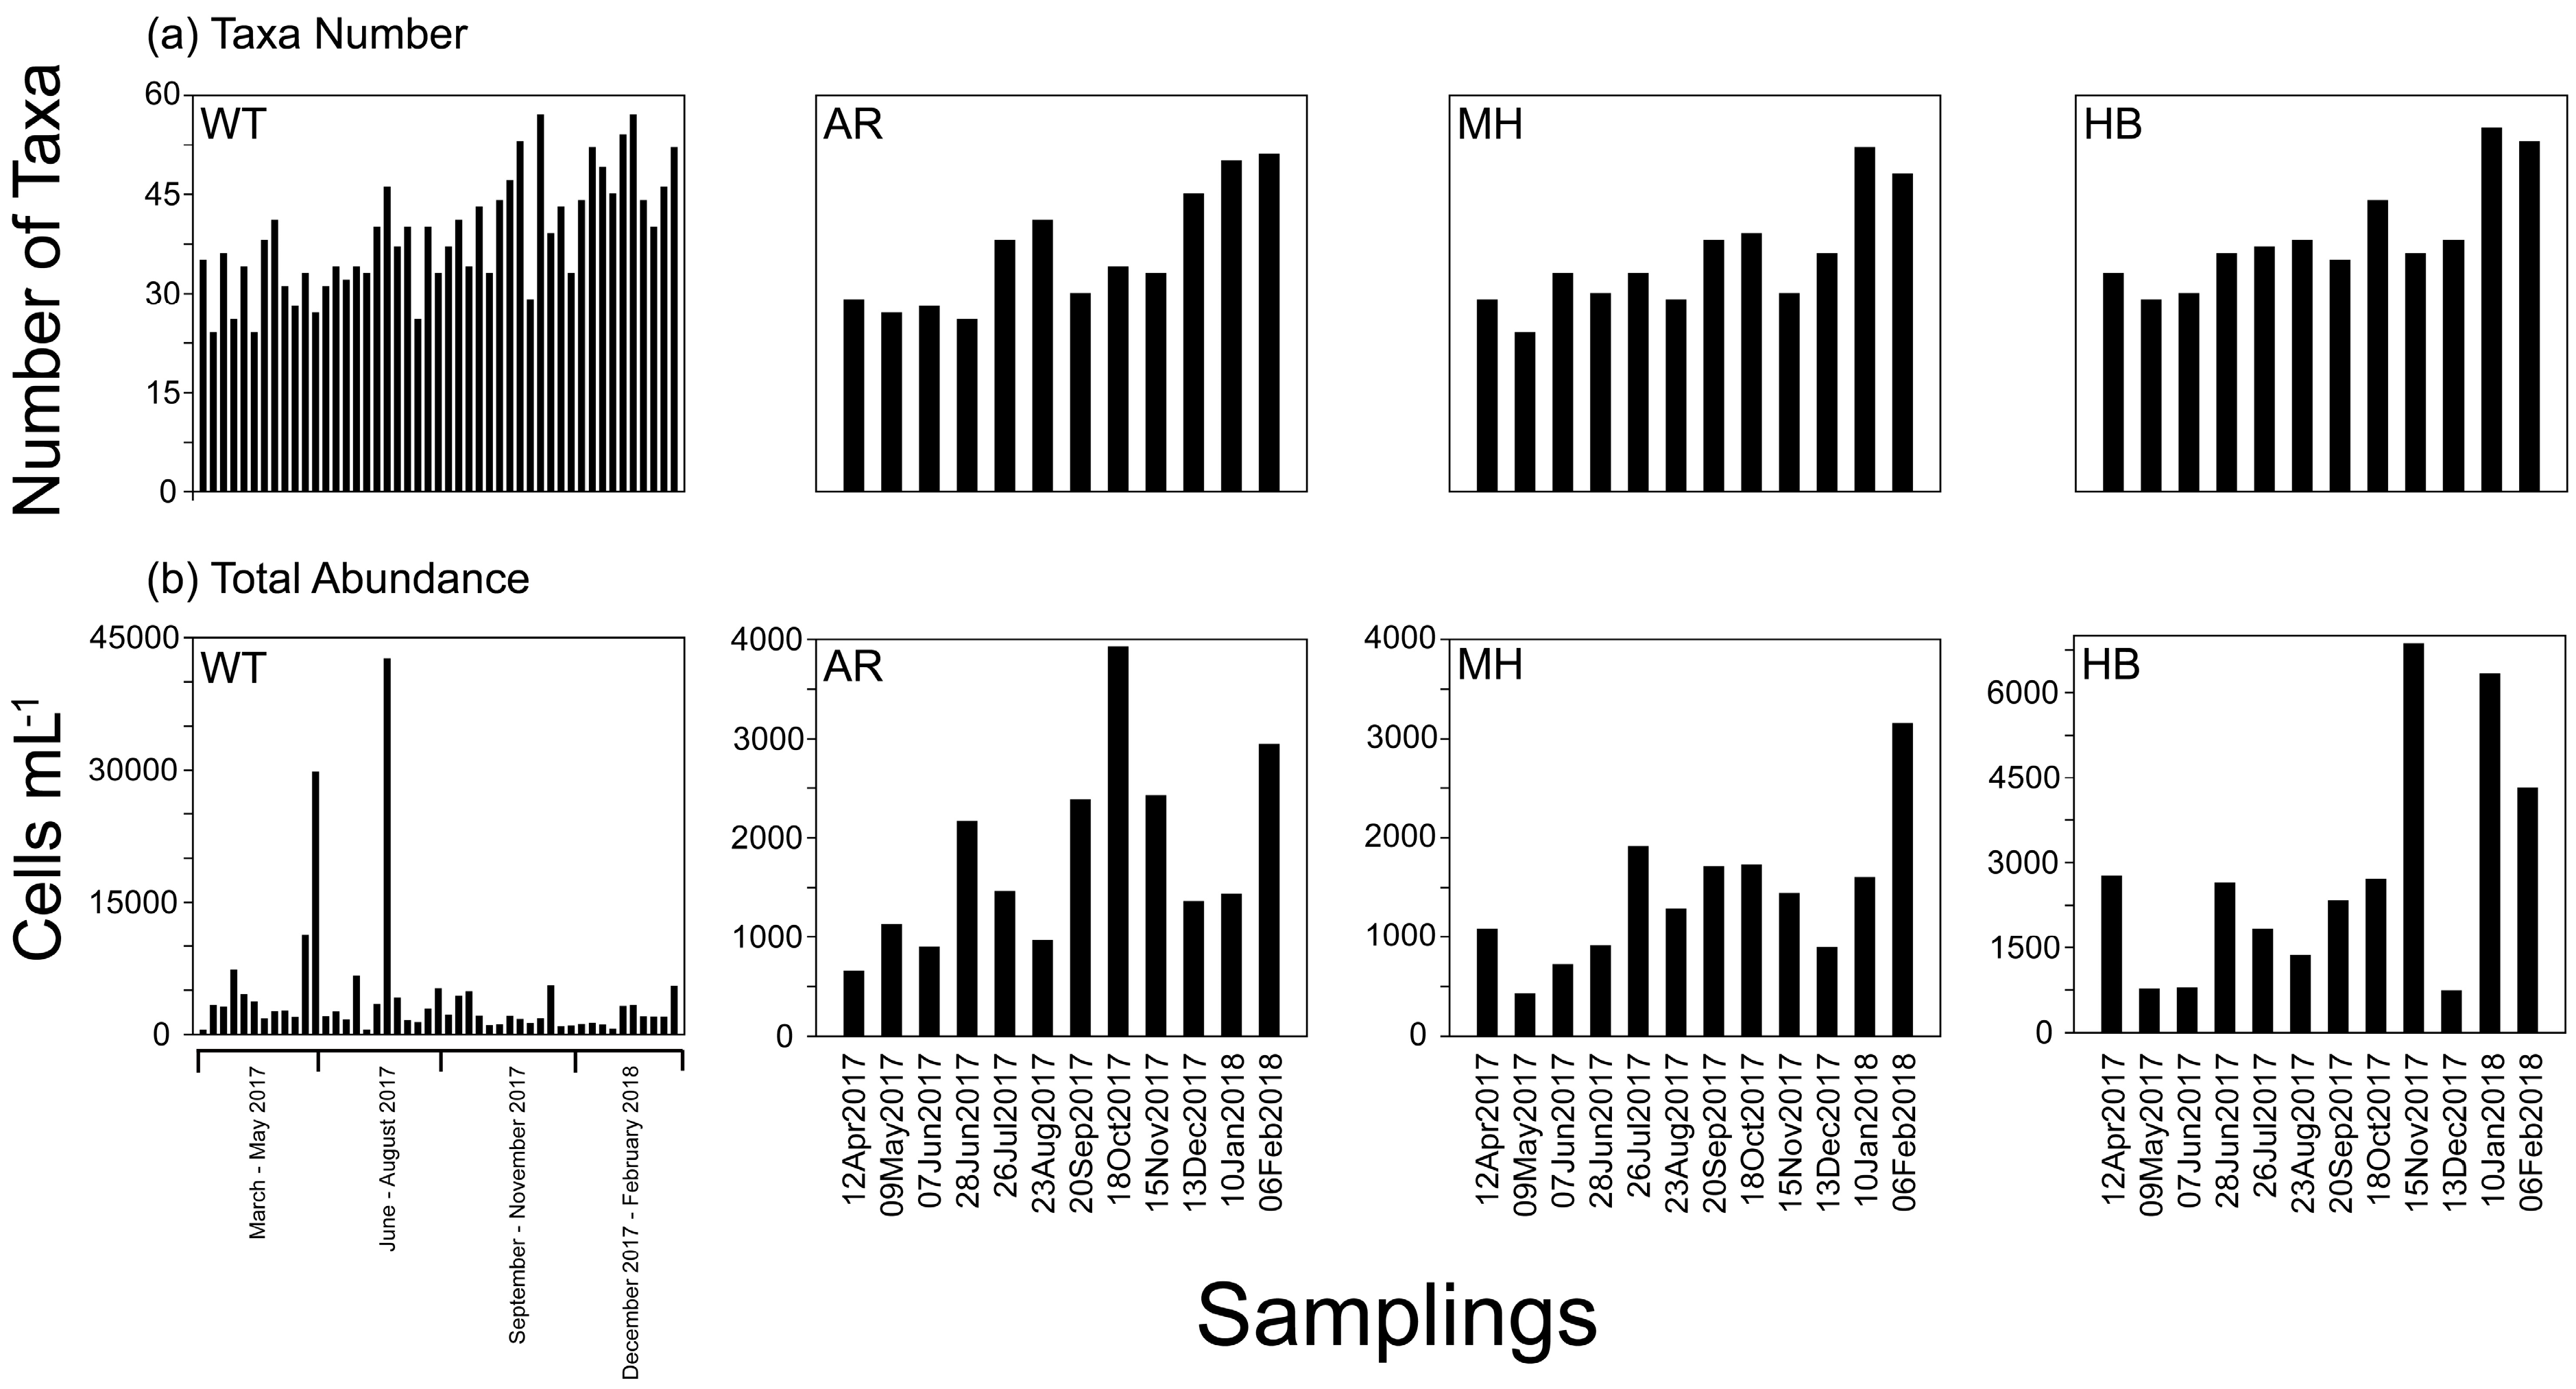
The number of identified taxa varied among samples between 24 (22 March and 19 April in WT, and 9 May 2017 in MH) and 57 taxa on 8 November 2017 in WT (Supplementary Table S3), with the highest values in December–February when the measured water temperature was lower than 15 °C (Figure 2a). High variability was recorded in total cell abundance of phytoplankton reaching a maximum of 42,000 cells mL−1 on 19 July 2017 in WT, dominated by the diatom Skeletonema costatum (see Figure 2b). Heterotrophic dinoflagellates dominated by red tide forming N. scintillans exhibited highest values on 22 March 2017 in WT (>3250 cells mL−1). The mean total taxa number and abundance were the only a-diversity estimators that were found significantly different in some paired comparisons between the different sites, based on t-tests; in particular: WT > AR, WT > MH and MH < HB (Supplementary Table S4; for a visualization of mean values of taxa number and abundance values in each sampling site, see Supplementary Figure S4). However, no significant differences in the distribution of the taxa relative abundances between sites were detected according to the Kolmogorov-Smirnov test (p > 0.05). The other a-diversity estimators calculated (Simpson, Shannon, Equitability, Evenness, and Berger–Parker), fluctuated during the study, and showed sometimes relatively low values, reflecting high dominance by one (or few) taxa, and high variation between taxa abundances within the community. In particular, the sampling dates with the low Simpson index (1-D) were: 22 March 2017 (0.10 in WT), 5 April 2017 (0.43 in WT), 31 May 2017 (0.22 in WT) and 18 October 2017 (0.29 in AR) (Supplementary Table S3).
3.3. Phytoplankton Blooms, Red Tides, and a Mucilage Aggregate Phenomenon
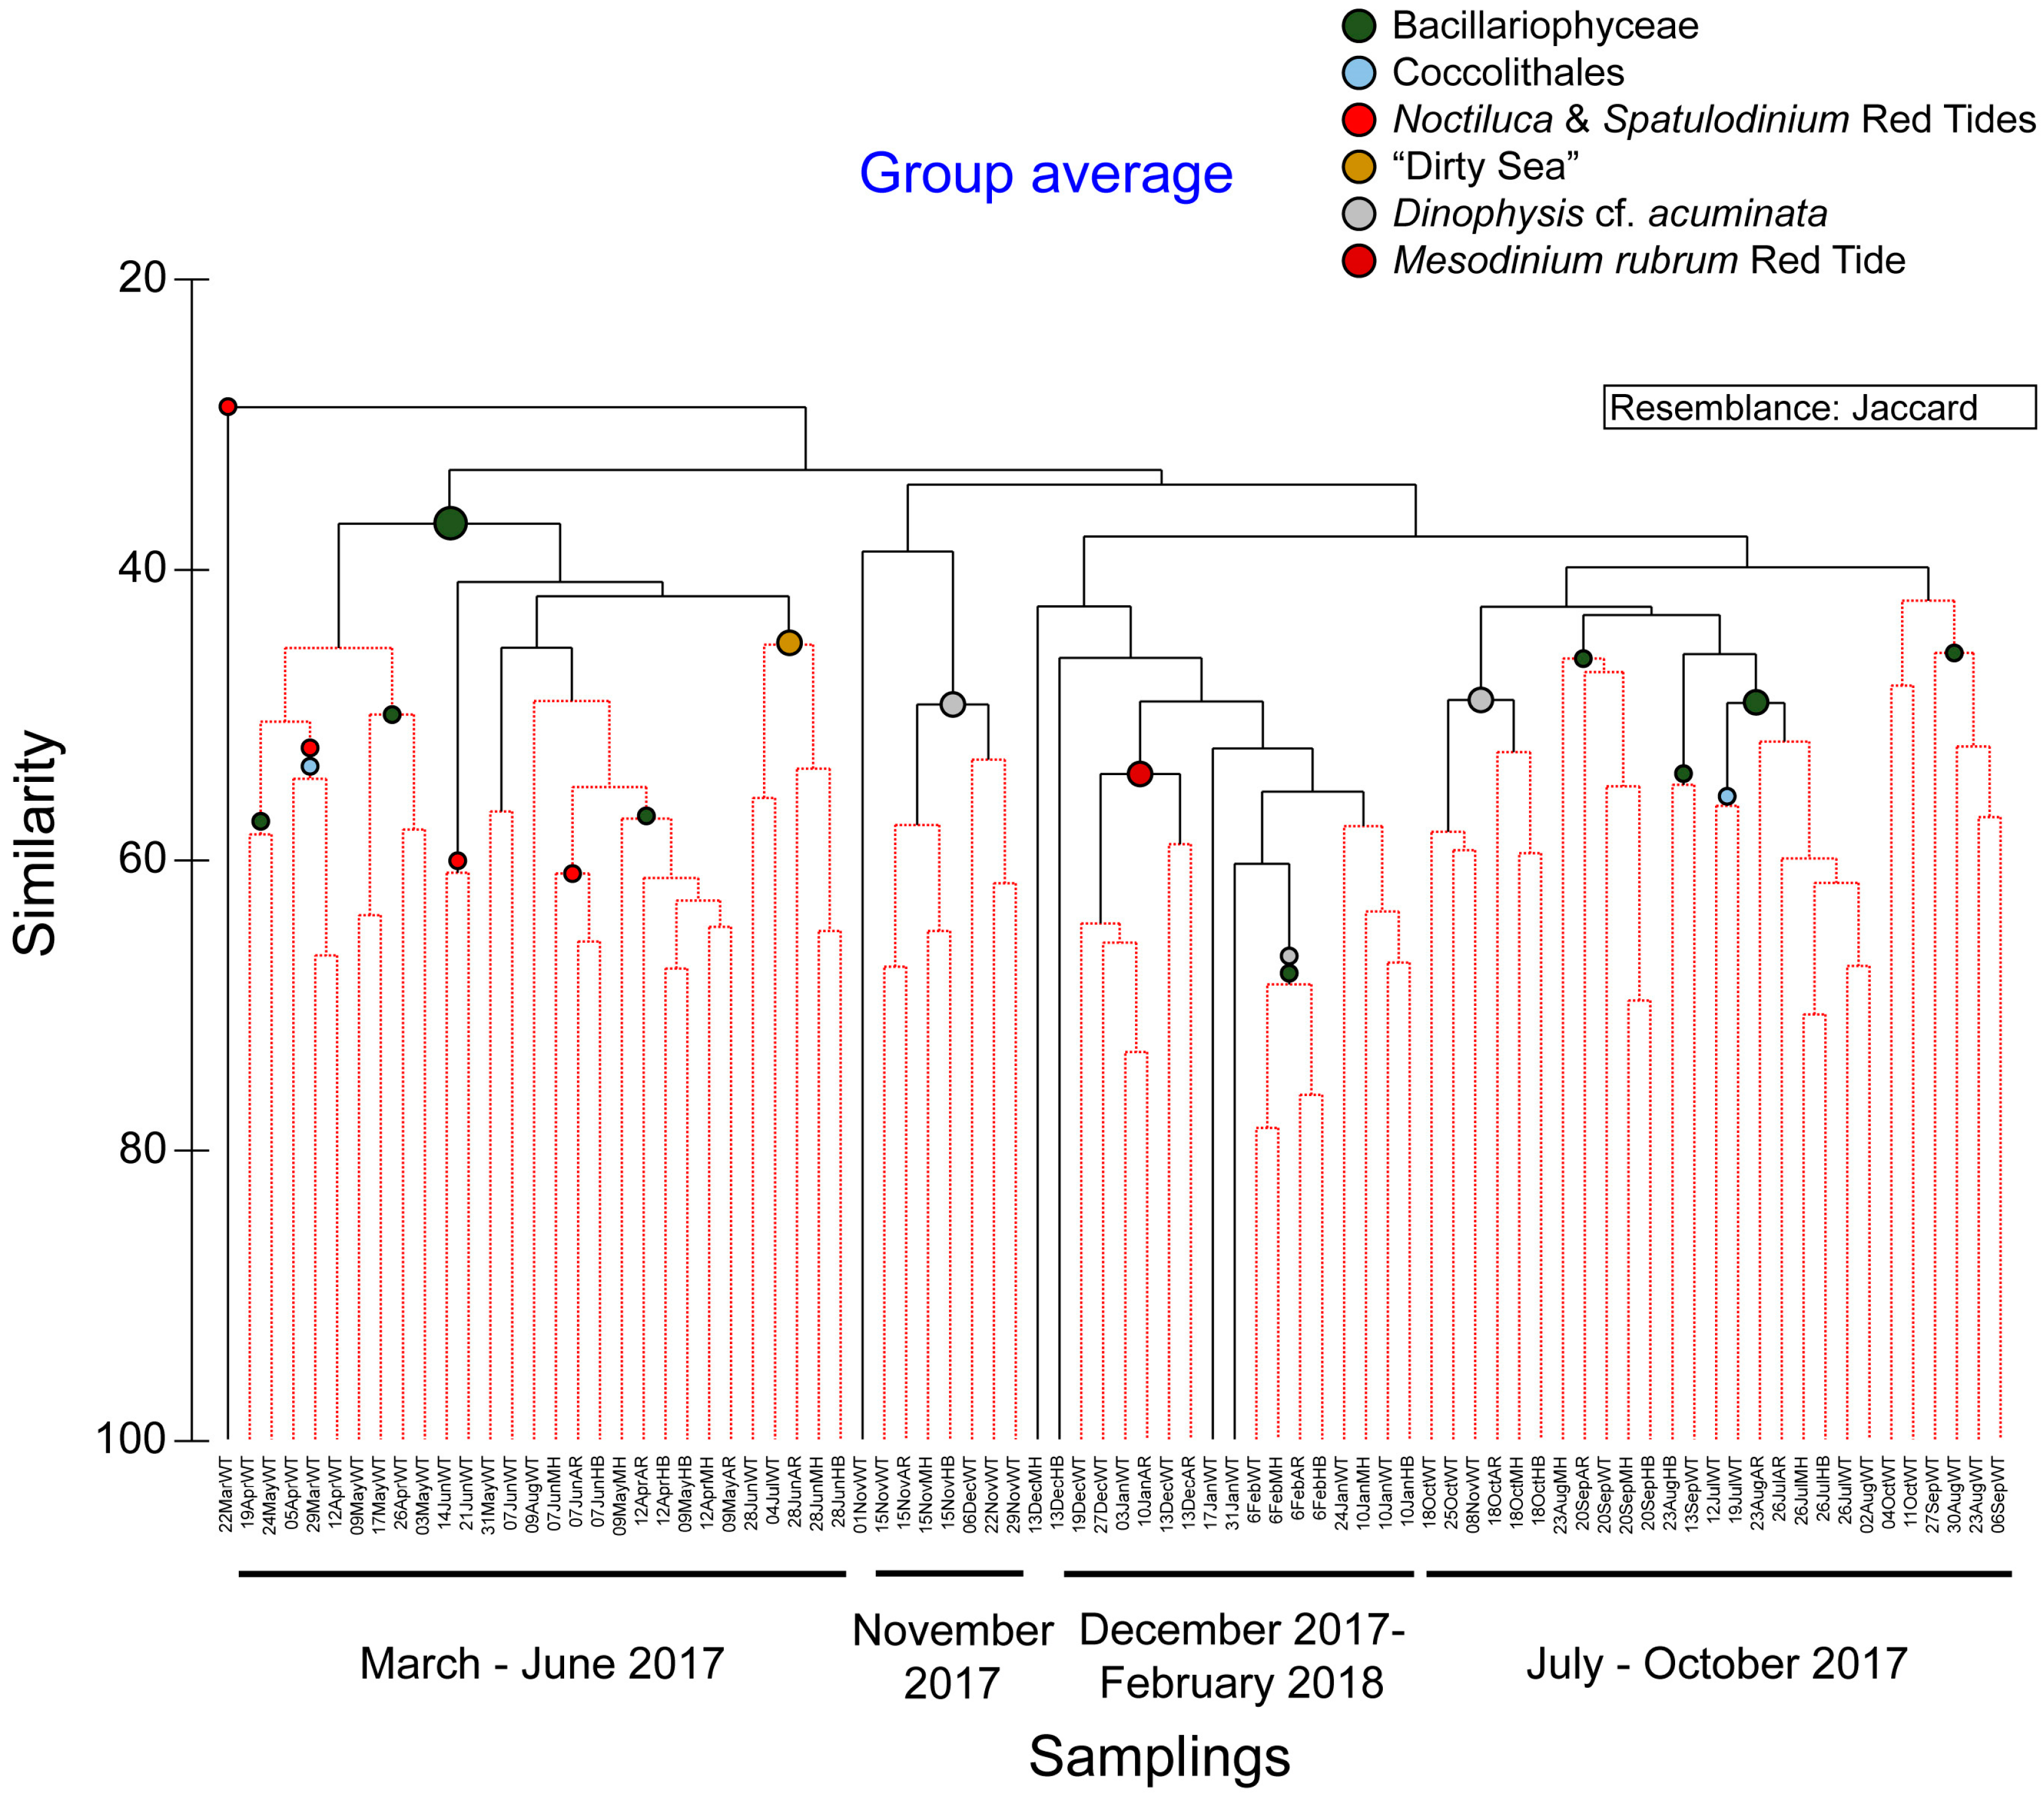
Based on the plankton community composition and abundance during the study period, four major clusters were identified at a similarity level ~ 35% (Figure 3) grouping together the samplings irrespectively of the sample collection site, according to the sampling dates: March–June 2017 (Cluster I); July–October 2017 (Cluster II); November 2017 (Cluster III); and December 2017–February 2018 (Cluster IV). This is in accordance with the results of the t-test paired comparisons of a-diversity indices between sites that showed no significant differences in most occasions. The samples in each cluster were further grouped together based on higher similarity levels (>40% similarity). These groupings included a small number of samples taken in close dates and were characterized by phytoplankton blooms (>1000 cells mL−1) of a taxonomic group or a single species, or/and red tides (Figure 3).
During the period March–June 2017 a persistent diatom bloom was detected at the White Tower (WT) site, due to the high abundances recorded throughout for the taxa of Leptocylindrus danicus (max: >7000 cells mL−1 on 24 May) and Leptocylindrus minimus (max abundance: >26000 cells mL−1 on 31 May). In specific samplings, i.e., on 24 May 2017, the taxon S. costatum additionally showed high concentrations reaching > 1000 cells mL−1. The diatom bloom was accompanied by a Coccolithales bloom between 5 and 12 April 2017 (>5300 cells mL−1).
On the other hand, conspicuous red tides, macroscopically visible, appeared in the front of the Bay at three occasions, during this period, making the water viscous. The red tides were detected at 22 March, 12 April, and 14–21 June 2017, and mainly consisted of the known red tide forming dinoflagellates N. scintillans and its close relative Spatulodinium pseudonoctiluca. Especially on 22 March 2017, the event was so intense that the sample consisted entirely of N. scintillans cells, reaching 3250 cells mL−1, comprising > 99% of the total abundance. The co-occurrence of these species with bloom-forming, mucilage-producing diatoms, e.g., Cylindrotheca closterium, Chaetoceros spp., L. minimus, L. danicus, S. costatum, the haptophyte Phaeocystis sp. and the dinoflagellate Gonyaulax cf. fragilis, were observed. They were producing or being embedded in mucilage, before and during the development of an extreme aggregation of mucilage, between 28 June and 4 July 2017. N. scintillans was observed to feed on diatoms, and most commonly on Chaetoceros spp.
During the period July–October, diatoms remained in high numbers, dominated by the taxa Chaetoceros spp. (max: >6000 cells mL−1 on 19 July), and more rarely C. closterium (max: >1800 cells mL−1 on 20 September). On 19 July and 13 September 2017, the taxon S. costatum, additionally showed high abundances reaching > 25,000 and > 1500 cells mL−1, respectively.
The diatom bloom was followed by an increase in the abundance of the harmful dinoflagellate Dinophysis cf. acuminata, during November 2017 (Figure 3). In particular, on 8 November 2017, D. cf. acuminata reached 120 cells mL−1, in WT, while up to 350 cells mL−1 of this species were recorded at HB on the 15th November 2017.
The high abundances of D. cf. acuminata in November 2017 were followed by a red tide in all sampling sites during the period December 2017–February 2018. This bloom was dominated by the photosynthetic ciliate Mesodinium rubrum, first appearing in the Bay on 29 November 2017, and peaking from 13 December 2017 till 10 January 2018, reaching > 1000 cells mL−1 on 13 December. The period January–February 2018 was characterized by diatom dominance, i.e., the taxa Chaetoceros tenuissimus (max abundance > 2000 cells mL−1 on 6 February, WT), and S. costatum (reaching 1000 cells mL−1 on 3 January, WT).
Based on the IOC-UNESCO Taxonomic Reference List of Harmful Microalgae it can be stated that at least 11 out of 117 plankton taxa found in the present study have been reported as harmful. These taxa are the diatoms Pseudonitzschia cf. delicatissima, Pseudonitzschia cf. multistriata, Pseudonitzschia cf. pseudodelicatissima, and Pseudonitzschia cf. pungens, the dictyochophycean Vicicitus globosus, the haptophyte Phaeocystis sp. and the dinoflagellates D. cf. acuminata, Dinophysis caudata, Karenia brevis, Karlodinium spp., and the epiphytic Prorocentrum cf. lima. In particular, the diatoms P. cf. delicatissima, P. cf. pseudodelicatissima, and P. cf. pungens were detected in concentrations > 500 cells mL−1 at the White Tower (WT) site on 19 July 2017, just after the mucilage aggregate phenomenon. Relatively high abundances (270 cells mL−1) were recorded for K. brevis at WT on the 28 June, right in the middle of the mucilage aggregate phenomenon. An extremely high bloom (>10,500 cells mL−1) was observed at the same sampling point one year later (unpublished data).
3.4. Links of Environmental Parameters and Plankton Bloom, Red Tide, and Mucilaginous Aggregate-Forming Taxa
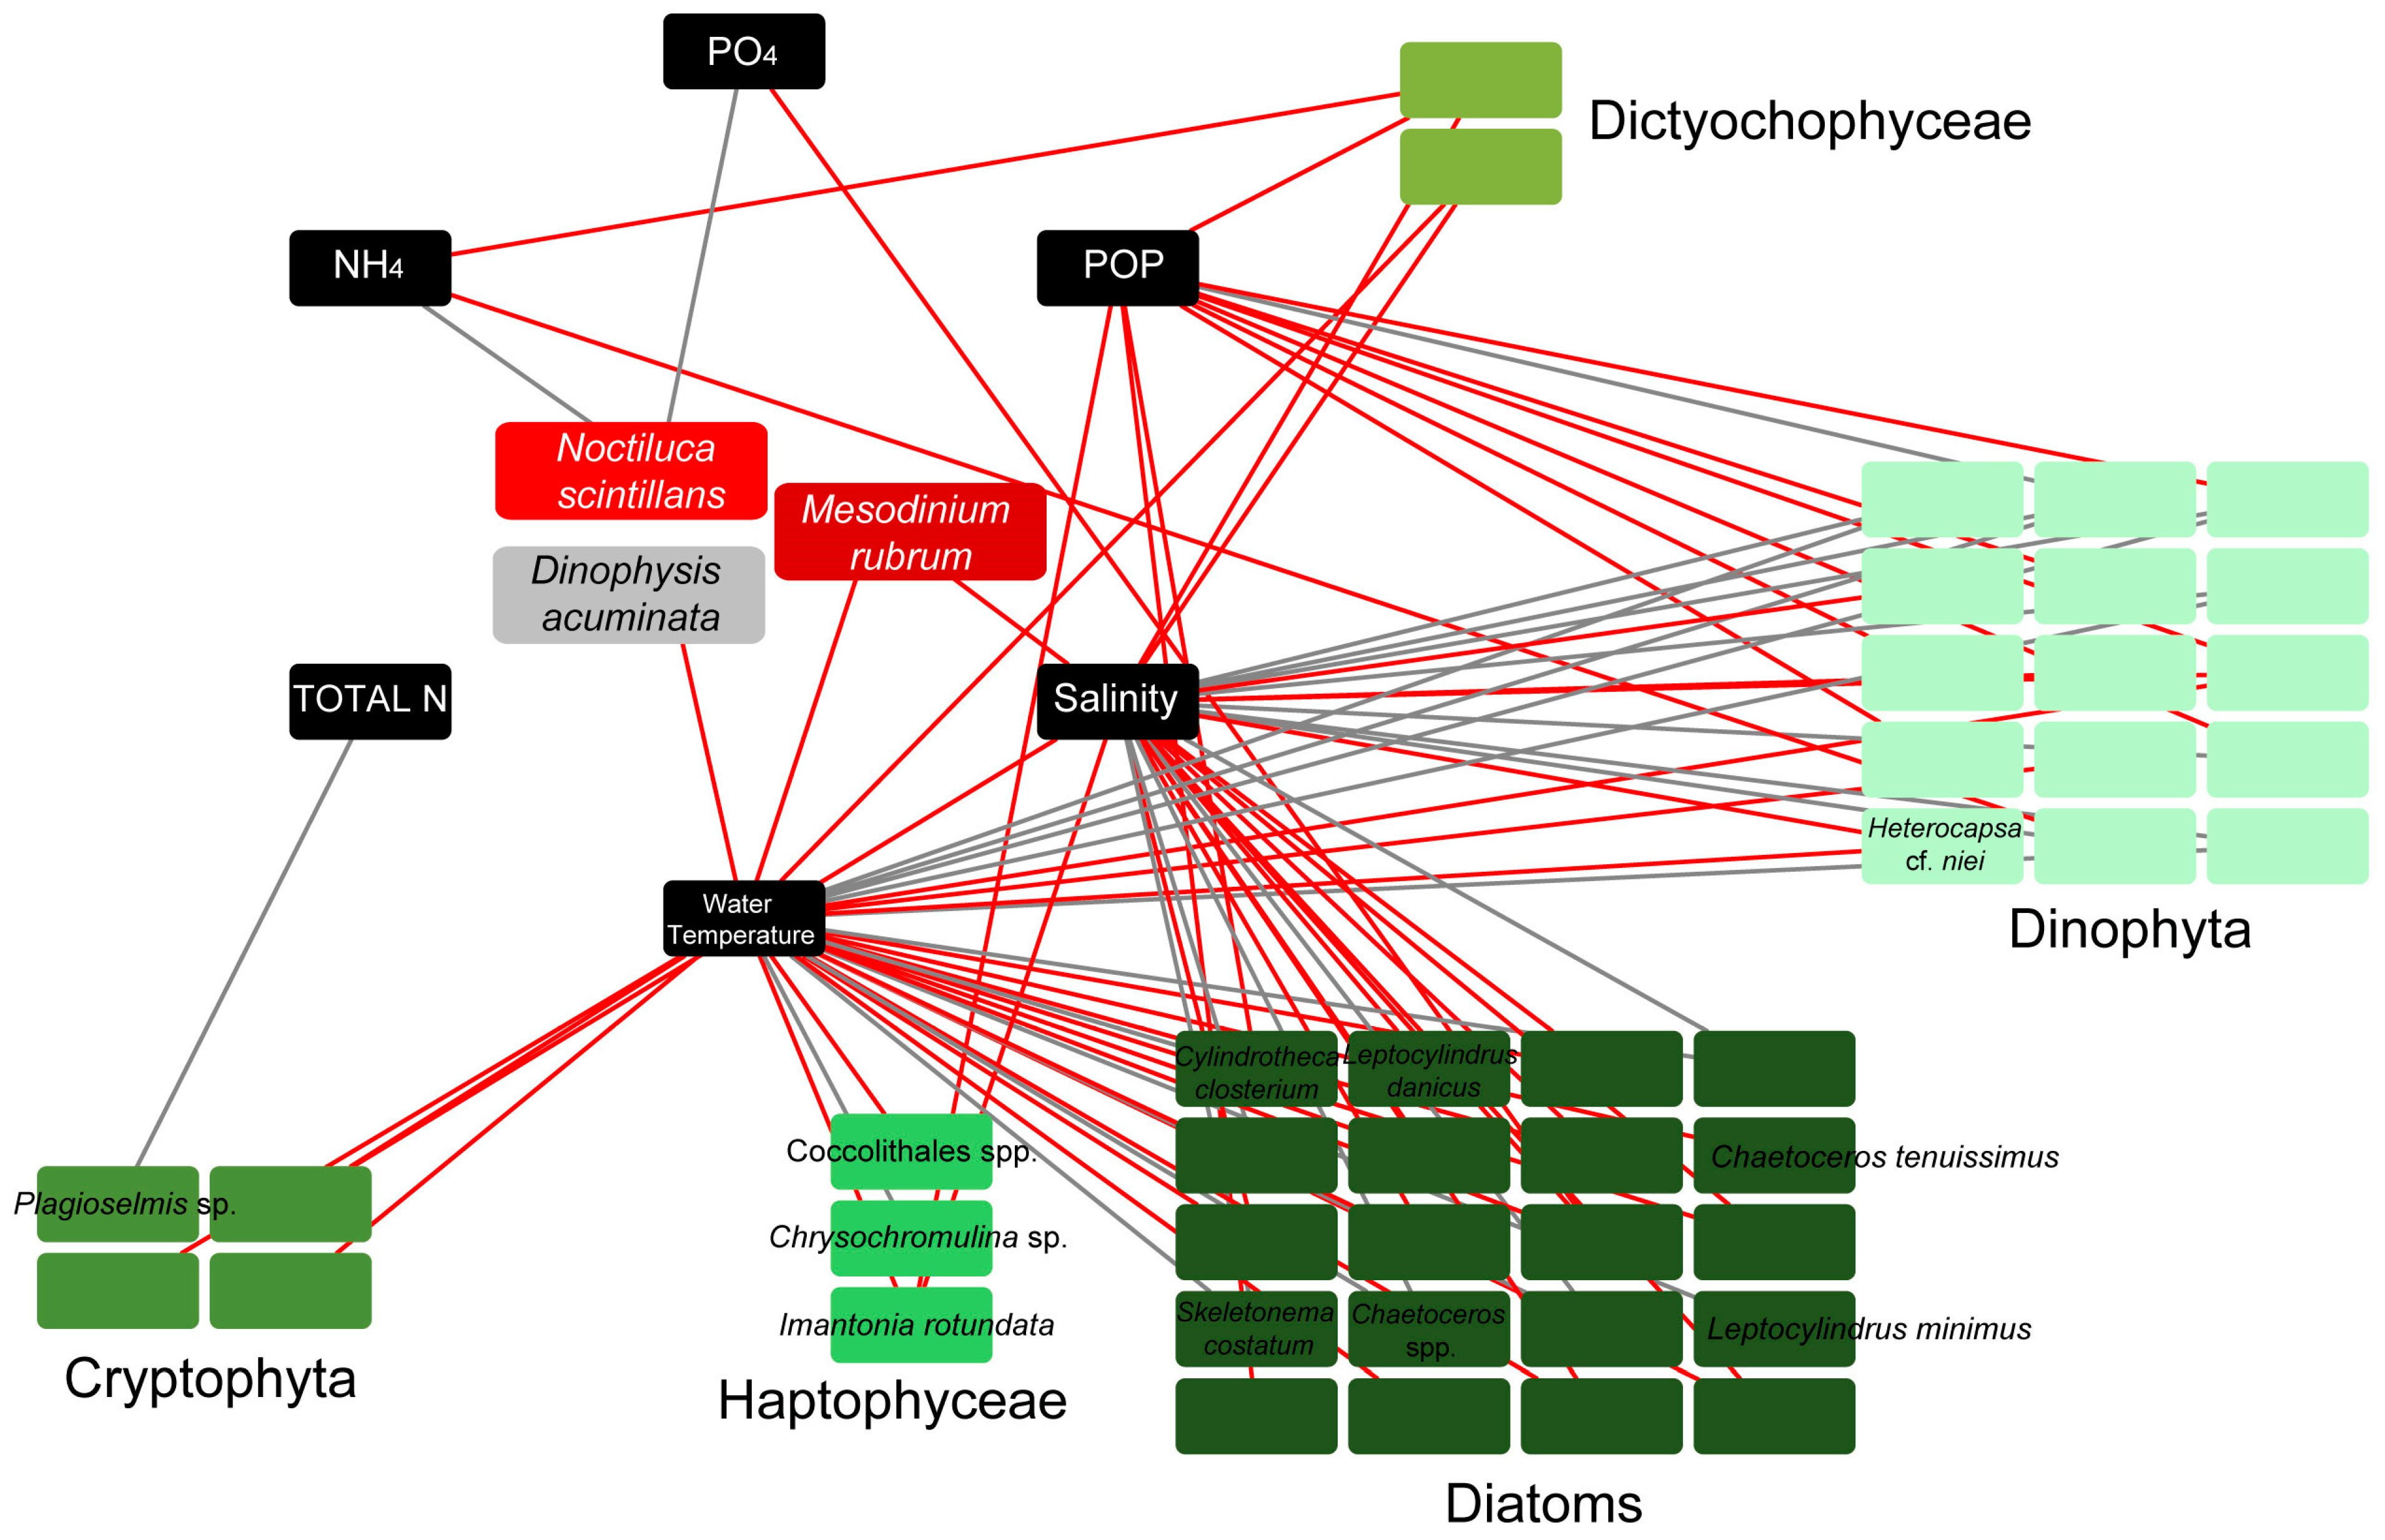
Connections between all detected taxa, including all phytoplankters and red tide/bloom-forming taxa, were investigated according to the MIC correlation coefficient. Only the strong connections between phytoplankters/red tide forming species and environmental parameters were visualized in network analysis (Figure 4). The strong connections represented MIC values corresponding to pre-calculated p-values (with p < 0.01), based on the total number of samples. Network analysis showed negative connections between salinity/water temperature and the majority of diatom taxa included in the network, and all Cryptophyta and Dictyochophyceae. However, the diatoms Chaetoceros spp., S. costatum, and L. minimus, all mucilage producers, were positively connected with salinity/water temperature. Dinophyta, on the other hand, showed mostly positive strong connections with salinity/water temperature and negative with POP (Figure 4). To note, the red tide forming N. scintillans showed strong positive connections with NH4 and PO4, while the other red tide forming species, M. rubrum, exhibited negative connections with salinity and water temperature. Finally, the harmful alga D. cf. acuminata displayed negative connection with water temperature (Figure 4).
Dinoflagellates were found to be significantly positively correlated with E.I. (p < 0.001, r = 0.64), N:P (p < 0.01, r = 0.31) and Si:P (p < 0.05, r = 0.26), while Cryptophyceae were significantly negatively correlated with Si:N (p < 0.01, r = −0.31) and Si:P (p < 0.05, r = −0.22).
4. Discussion
The reason for our focus on plankton community weekly dynamics of the urban marine system in the Thessaloniki Bay’s front was motivated by the lack of relevant data in this particular system in eutrophication studies of Thermaikos Gulf, despite the recurrent phenomena of harmful algal blooms (HABs) and conspicuous mucilage phenomena. These phenomena are of great ecological importance for the coastal system and have significant socio-economic impact to the city’s residents. After discussing nutrient pressure in the system, species diversity will be discussed, dominance of blooms and red tide forming species, and the key species which were the cause of the mucilage phenomenon verifying results of the marine eutrophication research and the related eutrophication symptoms [26].
4.1. Environmental Conditions
In the study area, a heavily modified marine water body according to WFD, annual mean salinity was 37.2 and close to the highest threshold value (37.5) for type IIA of the Mediterranean coastal water types that have been intercalibrated (applicable for phytoplankton) according to Commission Decision 2018/229/UE. This type of coastal water is considered moderately influenced by freshwater inputs, while the annual salinity average value is close to the boundary value (37.5) for type IIIE. Phytoplankton metrics have been intercalibrated only for type IIIE in Greece [35].
Throughout the study, nutrients (N and P) which are indication of eutrophication exhibited high values and were among the highest values reported for nutrient-rich coastal areas of the Mediterranean Sea [42,43,44]. In a recent comprehensive study on various coastal areas of Greece (1995–2007) influenced by anthropogenic activities, mainly by sewage and riverine outflows [45], the Thessaloniki Bay which is one of the most polluted coastal areas of Greece, exhibited the highest PO4 (max 6.50 μmol L−1) and NH4 concentrations (max 15 μmol L−1). Comparing to the highest values of nutrients during 1995–2007 [45], the values in this study (max 9.50 μmol L−1 and 160 μmol L−1 for PO4 and NH4, respectively) were even higher [45]. On the other hand, the highest NO3 value (21.09 μmol L−1) in the urban front of Thessaloniki Bay during our survey was slightly lower than the highest measured NO3 value (23.5 μmol L−1) during the period April–May 2012 [46]. Even so, both of them are extremely high for coastal sites, and are indicative of nitrogen pollution due to anthropogenic activities [47]. These outliers can be used as a sensitive tool for assessing water quality in coastal management studies according to Karydis [48], who showed that outliers are more sensitive in characterizing pollution/eutrophication levels than whole datasets, which usually include a large number of low values. The average N:P ratio in this study was higher (mean 25) compared to the N:P ratio (6.40) of the period 1995–2007 [45]. The high N:P ratio during the present study, in combination with the extreme NH4 concentrations, may be linked to the relatively high contribution of dinoflagellates, such as N. scintillans and S. pseudonoctiluca, to plankton community biomass [49]. The much higher NH4 values in 2017–2018 in combination with the high N:P ratio indicated nitrogen pollution, an increasing global problem [50]. Agriculture is the largest source of nitrogen pollution to many of the planet’s coastal marine ecosystems [51].
In addition to high nutrient concentrations and ratios, the annual mean values of Chl a for all stations were higher than the values measured in the same area in 2012 [47]. Based on our data, ecological water quality can be classified as bad according to Simboura et al. [47]. Low Chl a values coincided both with low and high cell abundances in WT and HB. In most samples of WT the low Chl a coincided with high cell densities in spring and summer under high irradiance/day-length and temperature when L. danicus and L. minimus were the dominant species. These results may reflect the physiological state of these diatoms on their Chl a content due to the effect of temperature and irradiance [52,53]. Similarly, low Chl a was measured simultaneously with high Leptocylindrus densities in HB.
In addition to the evaluation of the eutrophication and the nitrogen pollution of the study area, based on the individual nutrient variations and their extreme values (outliers), the multimetric eutrophication index E.I. [30] is of great interest for coastal management. In our samples, the E.I. values were always > 0.83 (mean 2.56 after excluding outliers) indicating a heavily eutrophic system reflecting bad environmental status according to Pavlidou et al. [46]. The poor to bad water quality of Thessaloniki Bay according to the phytoplankton-based indices and the E.I. index used, is indicative of both nitrogen and phosphorus enrichment. There is evidence for Greek coastal waters that phytoplankton-based indices are highly sensitive to nitrogen enrichment while the E.I. index is highly sensitive to phosphorus enrichment [43]. It is noteworthy that according to Pavlidou et al. [46] the E.I. reflected the integral eutrophication status of a water body as a whole and has been proposed as a reliable tool regarding the assessment of eutrophication status, and the implementation of nutrient management strategies under the EU WFD and the EU MSFD.
4.2. Diversity and Composition of the Plankton Community
Various a-diversity indices have been used (Shannon, Simpson, Equitability, Evenness, Berger-Parker) to describe the structure of the community in terms of its species diversity, dominance and evenness. The species pool of the unicellular eukaryotic plankton community reflected by the a-diversity indices [54] was found similar in the four sampling sites, according to pairwise comparisons with t-test (see Table S4 for a-diversity pairwise comparisons). Additionally, the Kolmogorov–Smirnov test showed no significant differences on the distribution of taxa between sampling sites. A seed bank of the local pool, persistent or transient according to Partel et al. [54] and the plankton life history traits [55] contributed to maintain relatively high biodiversity in this urban degraded marine environment. Even though a-diversity indices showed no significant differences between sites, when considering only the mean number of species identified in this study, significantly lower mean values were found in HB, a site with the highest ammonia and nitrite nitrogen pollution (Table 2), and a generally stressed area because of the harbor daily activity. The lower species diversity might be explained by environmental change consisting of several stressors, which can cause stress-induced community sensitivity [56]. The impacts of environmental stress on biodiversity are well known [57].
Diatoms were the most diverse taxonomic group with the highest species numbers in all sites during the period of December 2017–February 2018 in contrast to dinoflagellates that were more diverse during the period of March 2017–November 2017 (Supplementary Figure S3). The different temporal pattern of diatom and dinoflagellate species richness, as also shown by their contrasting relationships to water temperature and salinity, might be explained by their different response to vertical water mixing versus stratification conditions [58]. However, very few diatoms are strictly restricted to the periods of deep mixing, while sinking is an important factor for the growth and bloom formation only for large, sinking diatoms and large, non-sinking dinoflagellates [55].
4.3. Phytoplankton Blooms
During the study, at least one taxon per sample was recorded in bloom abundances, dominating the plankton community. The taxa that were detected in bloom abundances mainly belonged to diatoms, mainly Chaetoceros spp., C. closterium, L. minimus, L. danicus, and S. costatum. The persistent growth and bloom formations by these diatoms under various turbulent and stratification conditions can be explained by their small cell size in combination with mucilage production [55,58,59].
These species with extended blooms were the most important constituents of Thermaikos Gulf phytoplankton 30 years ago, when untreated sewage entered the Gulf [18]. Even though no connections were found between them and nutrient concentrations according to network analysis in the present study, it is well known that under P-limited conditions, certain diatoms become increasingly dominant with increasing Si:P ratios [60]. The most persistent diatoms blooms during our survey coincided with the highest Si:P ratios (>20). Dense diatom blooms in marine ecosystems suffering from eutrophication can generate highly dominant diatom communities within phytoplankton assemblages [61]. Nevertheless, apart from the proved impacts of nutrient concentration and ratios on the occurrence of algal blooms [62], in many cases it seems that algal bloom proliferation is more complicated, and the quantity and the ratio of inorganic nutrients alone cannot sufficiently explain high abundance blooms of extended duration [8].
The known harmful species D. cf. acuminata, P. cf. delicatissima, P. cf. multistriata, P. cf. pseudodelicatissima, P. cf. pungens, D. caudata, K. brevis, Karlodinium spp., and the epiphytic P. cf. lima, with worldwide distribution, were detected in relatively high abundances, but not exceeding bloom densities during individual sampling dates. Furthermore, the known harmful alga V. globosus was recorded occasionally in live water samples taken during the sampling period, but its cells usually could not be preserved with Lugol’s solution. These plankton species have been previously reported in the Thermaikos Gulf [18,21,63] indicating a persistent seed bank of the local pool [64]. Previous studies reported evidence for a diverse cyst bank, with high recorded abundance of cysts even in periods when the corresponding species were absent from the water column [65]. These cysts were associated with the formation of dense algal blooms in the water column and a high risk of HABs, as could be the case of the Dinophysis bloom observed in the present study during the period October–November 2017, and a short-term excessive Karenia bloom of extreme densities that was observed in spring 2018 (unpublished data). The urban Thessaloniki Bay exhibits the sustained increases in algal blooms and in HABs in accordance with high nutrient levels, similar to reports in other coastal areas of Mediterranean Sea and the Black Sea [23,66].
4.4. Red Tides
Several occasions of macroscopically visible red tides were documented over a temperature range of 10 to 25 °C, and a salinity range of 36 to 38.5. They were attributed to the known red tide forming dinoflagellates of N. scintillans together with its close taxonomic relative S. pseudonoctiluca, and the photosynthetic ciliate M. rubrum.
Noctiluca scintillans is one of the most important red tide forming dinoflagellate worldwide in the water temperature range of 10–25 °C, and salinity range of 28 to 36 in eutrophic areas dominated by diatoms [15,67], similar to our study area. Noctiluca red tides have been linked to eutrophication in several areas of the world and especially in the Black Sea, the Sea of Marmara [68,69,70], the Aegean Sea [71], and Adriatic Sea [72]. In contrast, S. pseudonoctiluca has been reported rarely, although new records from many areas suggest a cosmopolitan distribution. Its distribution has been underestimated due to its complex life cycle, morphological variability, and taxonomic issues in its identification [73]. In the Mediterranean Sea among these red tide forming species, another species of Spatulodinium has been found based on DNA analysis [73]. In the Mediterranean Sea, Spatulodinium showes a wide range of temperature preference, similar to the temperature range (19–30 °C) reported in the Mexican Pacific [74]. Both N. scintillans and S. pseudonoctiluca have been considered exclusively heterotrophic and inclusion of diatoms, dinoflagellates, and dictyochophytes have been observed in their cells [74].
The red tide forming N. scintillans terminated its growth in our study area by the increase of water temperature above 25 °C, as in many other studies, but temperature did not correlate with the start of its growth ([67] and references therein). A rich food supply of a broad spectrum of food items (from bacteria to fish eggs) is needed to start massive growth and formation of red tides, while availability of phytoplankton as a prey is a key factor [67,75]. Particularly, Noctiluca red tides are known to coincide or follow diatom blooms [16,67,76]. A strong temporal overlapping of N. scintillans and diatoms blooms has been also observed in the present study. High numbers of N. scintillans (>400 cells mL−1) coincided with high numbers of Chaetoceros spp., L. minimus, S. costatum, and C. closterium cells. Different species of diatoms (mostly Chaetoceros spp.) have been observed in food vacuoles of N. scintillans in agreement with other studies [77,78]. Additionally, N. scintillans was feeding on harmful Dinophysis spp. Noctiluca scintillans containing toxigenic Dinophysis and Pseudonitzschia species may act as a vector of toxigenic algae to higher trophic levels or transport to shellfish aquaculture [79]. On the other hand, grazing pressure by N. scintillans on the growth of other toxigenic dinoflagellates should be considered as a potential regulator of phytoplankton toxins production [80]. This is of particularly interest in our study area, due to its close vicinity to the biggest mussel culture of Greece, where a harvest ban is often implemented due to Dinophysis spp. abundance > 1 cell mL−1 [81].
Accumulation of N. scintillans cells in the surface water, forming a red tide, was observed under calm weather days (generally with daily mean wind speed < 3 m s−1) in this urban front of the bay protected from intense water circulation [82]. It is established that meteorological conditions and topography are crucial factors for red tide formation [75]. In Thessaloniki Bay, N. scintillans appeared to prefer higher salinity (>36) relative to those found in other studies [16,67,70]. Based on our results and N. scintillans abundance dynamics during spring-early summer in the Black Sea and the Northern Adriatic Sea, it is suggested that weather forecasts, and in particular wind speed projections, can be used for medium-term prediction of red tides [83].
A strong positive connection between N. scintillans cell abundance and NH4 and PO4 in our study area might indicate nutrient regeneration by this heterotrophic dinoflagellate and contribution to the local nutrient pool. The significant role of N. scintillans as a nutrient regenerator and an efficient recycler of nitrogen has been linked to extremely high concentrations of nitrogen in its cells and excretion regulated by nutrient quality of its food items. Nutrient liberation of senescent cells would stimulate the phytoplankton growth near the red tide patches while improving the food quality for N. scintillans [78]. NH4 regeneration by N. scintillans in coastal seas has been reported by Montani et al. [84] whereas high ammonia concentrations released from Noctiluca cells during the decay process of the red tide were also shown by Schaumann et al. [85]. NH4 also increases during decline bloom phase indicating release of intracellular NH4 accumulated through Noctiluca grazing according to Baliarsingh et al. [86]. Direct toxicity to fish by ammonium/ammonia is possible although at seawater pH, approximately 5% of total ammonia is unionized NH3 [87].
Mesodinium rubrum is a globally distributed photosynthetic ciliate that sometimes causes red tides in coastal waters [88]. M. rubrum is a marine plankton of great cytological, physiological, and evolutionary interest, which has an exceptional type of cellular organization not realized by other species, supported by organelle robbery [89]. M. rubrum and its accompanying cryptophytes showed a strong positive correlation (p < 0.001, r = 0.59), according to correlation analysis in the present study. M. rubrum reached high numbers (>700 cells mL−1) in December (temperature range from 11.1 to 13.3 °C, and salinity range from 37.3 to 38.0), just after the drop of the D. cf. acuminata maxima at all sites. The red tide formed was spatially extended and the abundance of M. rubrum was found negatively correlated with both temperature and salinity. An important factor for M. rubrum seasonal dynamics and its short-lived bloom in the study area seems to be the persistent occurrence of Dinophysis spp. and several common heterotrophic dinoflagellates, which it is known to feed [90,91].
4.5. Mucilage Aggregates
Noctiluca red tides have been linked to mucilage phenomena, either as a shift from red tides to these events [92] or an overlapping that could be observed in Lapseki coastal area of the Dardanelles in early summer where gelatinous surface layers were recorded [16]. In Thessaloniki Bay, mucilage aggregates appeared on 22 June 2017, characterized by creamy whitish-brownish and gelatinous surface layers [93], which became progressively darker with age. Before the appearance of the phenomenon in Thessaloniki Bay, the plankton community consisted of known mucilage producing species such as the common diatoms in the bay C. closterium, L. minimus, L. danicus, S. costatum, the dinoflagellate G. cf. fragilis and the slime producing red tide dinoflagellates N. scintillans, and S. pseudonoctiluca and the foam forming Phaeocystis sp. Many studies have been published that relate diatom extracellular polymer production with the well-known phenomenon of marine mucilage in the Adriatic Sea, in particular the diatom species C. closterium [94]. This species has been regularly observed as dominant in the mucilage macroaggregates and it has been demonstrated experimentally that polysaccharides from it can form a gel network similar to the macroscopic gel phase occurring in the northern Adriatic Sea irrespective of any bacterial mediation or interaction with inorganic particles [95]. In our study, C. closterium has been observed abundant before, during and after the mucilage phenomenon, within abundant transparent freshly formed mucilage, whereas Chaetoceros spp. and S. costatum chains were also embedded in the mucilage. The dinoflagellate G. cf. fragilis was observed actively producing mucilage in the samples from June 2017 similarly as in the Emilia-Romagna coast (Northern Adriatic Sea) by Pompei et al. [96]. The same phytoplankton mucilage producers, i.e., G. cf. fragilis, S. costatum, and C. closterium were identified as abundant species also in a mucilage phenomenon in the Sea of Marmara [97]. The well-known foam-forming Phaeocystis pouchetii caused mucilage problems in the Evoikos Gulf [98].
Small mucilage aggregates were observed both by active and decaying N. scintillans cells during red tide formation and termination. Decaying N. scintillans cells contribute high amounts of organic matter to the local pool while active cells excrete mucus for trapping food items [78]. The aggregates formed by decaying N. scintillans sampled in the Northern Adriatic Sea presented a similar chemical - biochemical composition to the different typologies of mucilage aggregates in the same area [94]. This showed that the organic matter of N. scintillans could form a part of the mucilage organic matter in the Adriatic Sea. The accumulation of excess autochthonous organic material (dead and alive material) from the preceding red tides and phytoplankton blooms producing mucilage (from late March to June) and the mucilage they produce, in combination with the hydrodynamic conditions in the Bay (initiation of thermal stratification in May) [82] are suggested as main factors for the formation of the creamy and gelatinous surface layer in the urban Thessaloniki Bay. Our results agree with Umani et al. [10] study on the microbial community of a coastal area in the northern Adriatic Sea with frequent reports of mucilage aggregates, suggesting that mucilage is derived from accumulated slow-to-degrade dissolved organic matter. The months preceding the mucilage events (March–May) in the Northern Adriatic Sea were assumed to be an ‘incubation’ period. Mucilage was the consequence of a coupling between the accumulation of organic matter and the temporal pattern of meteorological and oceanographic conditions [99] similar to our observations. Strong north winds (>10 m s−1) in the beginning of July 2017 were successful to degrade the gelatinous surface layer suddenly and disperse it as small mucilage aggregates. After a week, microscopic aggregates were observed concentrated above the pycnocline (5 m) in deeper areas in the Thermaikos Gulf [82].
5. Conclusions
During the study period, analysis of the weekly water samples from the urban coastal frontal zone of Thessaloniki Bay (Thermaikos Gulf) provided an outlook of the effects of eutrophication in this Mediterranean urban environment with further implications on marine eutrophication research and coastal management. In the majority of the samples, phytoplankton abundance, and nutrient concentrations indicated high eutrophic conditions and bad environmental status according to the implementation of the EU WFD and the EU MSFD. In addition, in all samples, the Eutrophication Index (E.I.) indicated a heavily eutrophic system, which was characterized by persistent phytoplankton blooms and conspicuous red tides. The phytoplankton blooms were dominated by the diatom species Cylindrotheca closterium, Chaetoceros spp., Leptocylindrus minimus, Leptocylindrus danicus, and Skeletonema costatum reaching high abundances during the spring-summer 2017, while the species Chaetoceros tenuissimus and S. costatum formed blooms during January–February 2018. Red tides of the species Noctiluca scintillans accompanied with Spatulodinium pseudonoctiluca in March 2017, and the species Mesodinium rubrum in December 2017 were observed in the Bay, while a mucilage aggregate phenomenon formed by the mucilage-producers C. closterium, Chaetoceros spp., L. minimus, L. danicus, S. costatum, Phaeocystis sp., and Gonyaulax cf. fragilis was observed in June 2017. These mucilage producers were linked to high temperatures/low salinity, while, on the other hand, red tide forming N. scintillans was linked to high nitrogen and phosphorus concentrations and higher salinities. These harmful events, along with the occurrence of several harmful algae, such as the known toxin-producer Dinophysis cf. acuminata, illustrate the need for continuous monitoring of target indicators of nutrient pollution, ecological water quality and environmental status in the Bay. In the prism of climate change and the increase of eutrophication conditions in coastal areas, this study sounds the alarm and highlights the need to reduce the causes contributing to the bad environmental status and the development of the described phenomena causing severe socio-economic impacts to the public.
Supplementary Materials
The following are available online at https://www.mdpi.com/1424-2818/11/8/136/s1; Figure S1. Environmental parameters examined in the four sampling sites; Figure S2. Annual mean values of the environmental parameters examined in the four sampling sites; Figure S3. Pie chart: Relative number of taxa belonging to major high-level unicellular eukaryotic taxonomic groups in all samplings; Figure S4. Bars showing the mean values of the number of taxa and abundance (cells mL−1) in the four sampling sites; Table S1. Differences in physical and chemical parameters among the different sites; Table S2. Species list of unicellular eukaryotes found in Thessaloniki’s Bay during the study period; Table S3. Species number, total cell abundance, and alpha diversity measurements per sample; Table S4. Differences in taxa number, cell abundance, and the diversity indices among the different sites.
Author Contributions
Conceptualization: S.G. and M.M.-G.; methodology: S.G., N.S. and M.M.-G.; validation: S.G., N.S. and M.M.-G.; formal analysis: S.G., and M.M.-G.; investigation: S.G. and N.S.; resources: U.S. and M.M.-G.; data curation: S.G. and N.S.; writing–original draft preparation: S.G., N.S., and M.M.-G.; writing–review and editing: S.G., U.S., and M.M.-G.; visualization: S.G.; supervision: M.M.-G.; funding acquisition: S.G., U.S., and M.M.-G.
Funding
This research is implemented through IKY scholarships programme and co-financed by the European Union (European Social Fund - ESF) and Greek national funds through the action entitled “Reinforcement of Postdoctoral Researchers”, in the framework of the Operational Programme “Human Resources Development Program, Education and Lifelong Learning” of the National Strategic Reference Framework (NSRF) 2014–2020.
Conflicts of Interest
The authors declare no conflict of interest.
References
- Rabalais, N.N.; Turner, R.E.; Díaz, R.J.; Justić, D. Global change and eutrophication of coastal waters. ICES J. Mar. Sci. 2009, 66, 1528–1537. [Google Scholar] [CrossRef]
- Garnier, J.; Beusen, A.; Thieu, V.; Billen, G.; Bouwman, L. N:P:Si nutrient export ratios and ecological consequences in coastal seas evaluated by the ICEP approach. Glob. Biogeochem. Cycl. 2010, 24. [Google Scholar] [CrossRef]
- Kroeze, C.; Hofstra, N.; Ivens, W.; Löhr, A.; Strokal, M.; van Wijnen, J. The links between global carbon, water and nutrient cycles in an urbanizing world-the case of coastal eutrophication. Curr. Opin. Environ. Sustain. 2013, 55, 566–572. [Google Scholar] [CrossRef]
- Cardona, Y.; Bracco, A.; Villareal, T.A.; Subramaniam, A.; Weber, S.C.; Montoya, J.P. Highly variable nutrient concentrations in the Northern Gulf of Mexico. Deep-Sea Res. Pt. II 2016, 129, 20–30. [Google Scholar] [CrossRef] [Green Version]
- Smith, V.H. Eutrophication of freshwater and coastal marine ecosystems: A global problem. Environ. Sci. Pollut. Res. 2003, 10, 126–139. [Google Scholar] [CrossRef]
- Turkoglu, M.; Erdogan, Y. Diurnal variations of summer phytoplankton and interactions with some physicochemical characteristics under eutrophication of surface water in the Dardanelles (Çanakkale Strait, Turkey). Turk. J. Biol. 2010, 34, 211–225. [Google Scholar]
- Turkoglu, M. Temporal variations of surface phytoplankton, nutrients and chlorophyll-a in the Dardanelles (Turkish Straits System): A coastal station sample in weekly time intervals. Turk. J. Biol. 2010, 34, 319–333. [Google Scholar]
- Heisler, J.; Glibert, P.M.; Burkholder, J.M.; Anderson, D.M.; Cochlan, W.; Dennison, W.C.; Gobler, C.; Dortch, Q.; Heil, C.; Humphries, E.; et al. Eutrophication and harmful algal blooms: A scientific consensus. Harmful Algae 2008, 8, 3–13. [Google Scholar] [CrossRef] [PubMed] [Green Version]
- Anderson, D.M.; Cembella, A.D.; Hallegraeff, G.M. Progress in understanding harmful algal blooms: Paradigm shifts and new technologies for research, monitoring, and management. Annu. Rev. Mar. Sci. 2012, 4, 143–176. [Google Scholar] [CrossRef]
- Umani, S.F.; Del Negro, P.; Larato, C.; De Vittor, C.; Cabrini, M.; Celio, M.; Bingol, K.; Falconi, C.; Tamberlich, F.; Azam, F. Major inter-annual variations in microbial dynamics in the Gulf of Trieste (northern Adriatic Sea) and their ecosystem implications. Aquat. Microb. Ecol. 2007, 46, 163–175. [Google Scholar] [CrossRef]
- Cibic, T.; Cerino, F.; Karuza, A.; Fornasaro, D.; Comici, C.; Cabrini, M. Structural and functional response of phytoplankton to reduced river inputs and anomalous physical-chemical conditions in the Gulf of Trieste (northern Adriatic Sea). Sci. Total Environ. 2018, 636, 838–853. [Google Scholar] [CrossRef] [PubMed]
- Parsons, M.L.; Dortch, Q. Sedimentological evidence of an increase in Pseudo-nitzschia (Bacillariophyceae) abundance in response to coastal eutrophication. Limnol. Oceanogr. 2002, 47, 551–558. [Google Scholar] [CrossRef]
- Li, J.; Gilbert, P.M.; Zhou, M. Temporal and spatial variability in nitrogen uptake kinetics during harmful dinoflagellate blooms in the East China Sea. Harmful Algae 2010, 9, 531–539. [Google Scholar] [CrossRef]
- Dela-Cruz, J.; Middleton, J.H.; Suthers, I.M. The influence of upwelling, coastal nutrients and water temperature on the distribution of the red tide dinoflagellate, Noctiluca scintillans, along the east coast of Australia. Hydrobiologia 2008, 598, 59–75. [Google Scholar] [CrossRef]
- Harrison, P.J.; Furuya, K.; Glibert, P.M.; Xu, J.; Liu, H.B.; Yin, K.; Lee, J.H.W.; Anderson, D.M.; Gowen, R.; Al-Azri, A.R.; et al. Geographical distribution of red and green Noctiluca scintillans. Chin. J. Oceanol. Limnol. 2011, 29, 807–831. [Google Scholar] [CrossRef]
- Turkoglu, M. Red tides of the dinoflagellate Noctiluca scintillans associated with eutrophication in the Sea of Marmara (the Dardanelles, Turkey). Oceanologia 2013, 55, 709–732. [Google Scholar] [CrossRef]
- Krestenitis, Y.N.; Kombiadou, K.D.; Androulidakis, Y.S. Interannual variability of the physical characteristics of North Thermaikos Gulf (NW Aegean Sea). J. Mar. Syst. 2012, 96, 132–151. [Google Scholar] [CrossRef]
- Nikolaidis, G.; Moustaka-Gouni, M. The structure and dynamics of phytoplankton assemblages from the inner part of the Thermaikos Gulf, Greece. I. Phytoplankton composition and biomass from May 1988 to April 1989. Hegol. Mar. Res. 1990, 44, 487. [Google Scholar] [CrossRef]
- Karageorgis, A.P.; Skourtos, M.S.; Kapsimalis, V.; Kontogianni, A.D.; Skoulikidis, N.T.; Pagou, K.; Nikolaidis, N.P.; Drakopoulou, P.; Zanou, B.; Karamanos, H.; et al. An integrated approach to watershed management within the DPSIR framework: Axios River catchment and Thermaikos Gulf. Reg. Environ. Chang. 2005, 5, 138–160. [Google Scholar] [CrossRef]
- Mihalatou, H.M.; Moustaka-Gouni, M. Pico-, nano-, microplankton abundance and primary productivity in a eutrophic coastal area of the Aegean Sea, Mediterranean. Int. Rev. Hydrobiol. 2002, 87, 439–456. [Google Scholar] [CrossRef]
- Genitsaris, S.; Kormas, K.A.; Moustaka-Gouni, M. Airborne algae and cyanobacteria: Occurrence and related health effects. Front. Biosci. 2011, 3, 772–787. [Google Scholar]
- Friligos, N.; Kondylakis, J.C.; Psyllidou-Giouranovits, R.; Georgakopoulou-Gregoriadou, E. Eutrophication and phytoplankton abundance in the Thermaikos Gulf, Greece. Fresenius Environ. Bull. 1997, 6, 27–31. [Google Scholar]
- Moncheva, S.; Gotsis-Skretas, O.; Pagou, K.; Krastev, A. Phytoplankton blooms in Black Sea and Mediterranean coastal ecosystems subjected to anthropogenic eutrophication: Similarities and differences. Estuar. Coastal Shelf Sci. 2001, 53, 281–295. [Google Scholar] [CrossRef]
- Koukaras, K.; Nikolaidis, G. Dinophysis blooms in Greek coastal waters (Thermaikos Gulf, NW Aegean Sea). J. Plankton Res. 2004, 26, 445–457. [Google Scholar] [CrossRef] [Green Version]
- Reizopoulou, S.; Strogyloudi, E.; Giannakourou, A.; Pagou, K.; Hatzianestis, I.; Pyrgaki, C.; Granéli, E. Okadaic acid accumulation in macrofilter feeders subjected to natural blooms of Dinophysis acuminata. Harmful Algae 2008, 7, 228–234. [Google Scholar] [CrossRef]
- Ferreira, J.G.; Andersen, J.H.; Borja, A.; Bricker, S.B.; Camp, J.; Cardoso da Silva, M.; Garcés, E.; Heiskanen, A.S.; Humborg, C.; Ignatiades, L.; et al. Overview of eutrophication indicators to assess environmental status within the European Marine Strategy Framework Directive. Estuar. Coast. Shelf Sci. 2011, 93, 117–131. [Google Scholar] [CrossRef] [Green Version]
- Weyl, P.K. On the change in electrical conductance of seawater with temperature. Limnol. Oceanogr. 1964, 9, 75–78. [Google Scholar] [CrossRef]
- Jeffrey, S.W.; Humphrey, G.F. New spectrophotometric equation for determining chlorophyll a, b, c1 and c2. Biochem. Physiol. Pflanz. 1975, 167, 194–204. [Google Scholar]
- Hansen, H.P.; Koroleff, F. Determination of nutrients. In Methods of Seawater Analysis, 3rd ed.; Grasshoff, K., Kremling, K., Ehrhardt, M., Eds.; Wiley VCH: Weinheim, Germany, 1999; pp. 159–228. [Google Scholar]
- Primpas, I.; Tsirtsis, G.; Karydis, M.; Kokkoris, G.D. Principal component analysis: Development of a multivariate index for assessing eutrophication according to the European water framework directive. Ecol. Indic. 2010, 10, 178–183. [Google Scholar] [CrossRef]
- Hasle, G.R.; Syvertsen, E.E.; Steidinger, K.A.; Tangen, K.; Tomas, C.R. Identifying Marine Diatoms and Dinoflagellates; Academic Press: Cambridge, MA, USA, 1996; p. 613. [Google Scholar]
- Hasle, G.R.; Syvertsen, E.E.; Throndsen, J.; Steidinger, K.A.; Tangen, K.; Heimdal, B.R. Identifying Marine Phytoplankton; Academic Press: Cambridge, MA, USA, 1997; p. 858. [Google Scholar]
- Gómez, F.; Furuya, K. Kofoidinium, Spatulodinium and other Kofoidiniaceans (Noctilucales, Dinophyceae) in the Pacific Ocean. Eur. J. Protistol. 2007, 43, 115–124. [Google Scholar]
- Utermöhl, H. Zur Vervollkommnung der quantitativen Phytoplankton-Methodik. Mitt. Int. Ver. Theor. Angew. Limnol. 1958, 9, 1–38. [Google Scholar]
- Integrated Monitoring and Assessment Programme of the Mediterranean Sea and Coast and Related Assessment Criteria. Available online: https://wedocs.unep.org/handle/20.500.11822/10947 (accessed on 12 August 2019).
- Hammer, Ø.; Harper, D.A.T.; Ryan, P.D. PAST: Paleontological statistics software package for education and data analysis. Paleontol. Electron. 2001, 4, 9. [Google Scholar]
- Morris, E.K.; Caruso, T.; Buscot, F.; Fischer, M.; Hancock, C.; Maier, T.S.; Meiners, T.; Müller, C.; Obermaier, E.; Prati, D.; et al. Choosing and using diversity indices: Insights for ecological applications from the German Biodiversity Exploratories. Ecol. Evol. 2014, 4, 3514–3524. [Google Scholar] [CrossRef] [PubMed]
- Hillebrand, H.; Bennett, D.M.; Cadotte, M.W. Consequences of dominance: A review of evenness effects on local and regional ecosystem processes. Ecology 2008, 89, 1510–1520. [Google Scholar] [CrossRef] [PubMed]
- Primer v6: User Manual/Tutorial. PRIMER-E Plymouth. Available online: https://www.researchgate.net/publication/285668711_PRIMER_v6_user_manualtutorial_PRIMER-E_Plymouth (accessed on 31 January 2006).
- Reshef, D.N.; Reshef, Y.A.; Finucane, H.K.; Grossman, S.R.; McVean, G.; Turnbaugh, P.J.; Lander, E.S.; Mitzenmacher, M.; Sabeti, P.C. Detecting novel associations in large data sets. Science 2011, 334, 1518–1524. [Google Scholar] [CrossRef] [PubMed]
- Smoot, M.E.; Ono, K.; Ruscheinski, J.; Wang, P.-L.; Ideker, T. Cytoscape 2.8: New features for data integration and network visualization. Bioinformatics 2011, 27, 431–432. [Google Scholar] [CrossRef] [PubMed]
- Kontas, A.; Kucuksezgin, F.; Altay, O.; Uluturhan, E. Monitoring of eutrophication and nutrient limitation in the Izmir Bay (Turkey) before and after Wastewater Treatment Plant. Environ. Int. 2004, 29, 1057–1062. [Google Scholar] [CrossRef]
- Simboura, N.; Pavlidou, A.; Bald, J.; Tsapakis, M.; Pagou, K.; Zeri, C.; Androni, A.; Panayotidis, P. Response of ecological indices to nutrient and chemical contaminant stress factors in Eastern Mediterranean coastal waters. Ecol. Indic. 2016, 70, 89–105. [Google Scholar] [CrossRef]
- Tugrul, S.; Ozhan, K.; Akcay, I. Assessment of trophic status of the northeastern Mediterranean coastal waters: Eutrophication classification tools revisited. Environ. Sci. Pollut. Res. Int. 2018, 26, 14742–14754. [Google Scholar] [CrossRef]
- Pavlidou, A. Nutrient distribution in selected coastal areas of Aegean Sea (East Mediterranean Sea). J. Environ. 2012, 1, 78–88. [Google Scholar]
- Pavlidou, A.; Simboura, N.; Rousselaki, E.; Tsapakis, M.; Pagou, K.; Drakopoulou, P.; Assimakopoulou, G.; Kontoyiannis, H.; Panayotidis, P. Methods of eutrophication assessment in the context of the water framework directive: Examples from the Eastern Mediterranean coastal areas. Cont. Shelf Res. 2015, 108, 156–168. [Google Scholar] [CrossRef]
- Simboura, N.; Tsapakis, M.; Pavlidou, A.; Asimakopoulou, G.; Pagou, K.; Kontoyiannis, H.; Zeri, C.; Krasakopoulou, E.; Rousselaki, E.; Katsiaras, N.; et al. Assessment of the environmental status in the Hellenic coastal waters (Eastern Mediterranean): from the Water Framework Directive to the Marine Strategy Framework Directive. Mediterr. Mar. Sci. 2015, 16, 46–64. [Google Scholar] [CrossRef]
- Karydis, M. Environmental quality assessment based on the analysis of extreme values: A practical approach for evaluating eutrophication. J. Environ. Sci. Heal. 1994, 29, 775–791. [Google Scholar] [CrossRef]
- Xiao, W.; Liu, X.; Irwin, A.J.; Laws, E.A.; Wang, L.; Chen, B.; Zeng, Y.; Huang, B. Warming and eutrophication combine to restructure diatoms and dinoflagellates. Water Res. 2018, 128, 206–216. [Google Scholar] [CrossRef] [PubMed]
- Howarth, R.; Paerl, H.W. Coastal marine eutrophication: Control of both nitrogen and phosphorus is necessary. Proc. Natl. Acad. Sci. USA 2008, 105, E103. [Google Scholar] [CrossRef] [PubMed]
- Howarth, R.W. Coastal nitrogen pollution: A review of sources and trends globally and regionally. Harmful Algae 2008, 8, 14–20. [Google Scholar] [CrossRef]
- Verity, P.G. Effects of temperature, irradiance, and daylength on the marine diatom Leptocylindrus danicus Cleve. II. excretion. J. Exp. Mar. Biol. Ecol. 1981, 55, 159–169. [Google Scholar] [CrossRef]
- Geider, R.J. Light and temperature dependence of the carbon to chlorophyll a ratio in microalgae and cyanobacteria: Implications for physiology and growth of phytoplankton. New Phytol. 1987, 106, 1–34. [Google Scholar] [CrossRef]
- Partel, M.; Zobel, M.; Zobel, K.; Van Der Maarel, E. The species pool and its relation to species richness: Evidence from Estonian plant communities. Oikos 1996, 75, 111–117. [Google Scholar] [CrossRef]
- Sommer, U.; Charalampous, E.; Genitsaris, S.; Moustaka-Gouni, M. Benefits, costs and taxonomic distribution of marine phytoplankton body size. J. Plankton Res. 2017, 39, 494–508. [Google Scholar] [CrossRef]
- Stefanidou, N.; Genitsaris, S.; Lopez-Bautista, J.; Sommer, U.; Moustaka-Gouni, M. Effects of heat shock and salinity changes on coastal Mediterranean phytoplankton in a mesocosm experiment. Mar. Biol. 2018, 165, 154. [Google Scholar] [CrossRef]
- Hillebrand, H.; Matthiessen, B. Biodiversity in a complex world: Consolidation and progress in functional biodiversity research. Ecol. Lett. 2009, 12, 1405–1419. [Google Scholar] [CrossRef] [PubMed]
- Margalef, R. Turbulence and marine life. Sci. Mar. 1997, 61, 109–123. [Google Scholar]
- Passow, U.; Alldredge, A.L. Aggregation of a diatom bloom in a mesocosm: the role of transparent exopolymer particles (TEP). Deep-Sea Res. Pt. II 1995, 42, 99–109. [Google Scholar] [CrossRef]
- Sommer, U. Nutrient competition experiments with periphyton from the Baltic Sea. Mar. Ecol. Prog. Ser. 1996, 140, 161–167. [Google Scholar] [CrossRef]
- Le Moal, M.; Gascuel-Odoux, C.; Ménesguen, A.; Souchon, Y.; Étrillard, C.; Levain, A.; Moatar, F.; Pannard, A.; Souchu, P.; Lefebvre, A.; et al. Eutrophication: A new wine in an old bottle? Sci. Total Environ. 2019, 651, 1–11. [Google Scholar] [CrossRef] [PubMed]
- Smayda, T.J.; Reynolds, C.S. Strategies of marine dinoflagellate survival and some rules of assembly. J. Sea Res. 2003, 49, 95–106. [Google Scholar] [CrossRef]
- Nikolaidis, G.; Koukaras, K.; Aligizaki, K.; Heracleous, A.; Kalopesa, E.; Moschandreou, K.; Tsolaki, E.; Mantoudis, A. Harmful microalgal episodes in Greek coastal waters. J. Biol. Res. 2005, 3, 77–85. [Google Scholar]
- Spatharis, S.; Dolopsakis, N.P.; Economou-Amilli, A.; Tsirtsis, G.; Danielidis, D.B. Dynamics of potentially harmful microalgae in a confined Mediterranean Gulf-Assessing the risk of bloom formation. Harmful Algae 2009, 8, 736–743. [Google Scholar] [CrossRef]
- Giannakourou, A.; Orlova, T.Y.; Assimakopoulou, G.; Pagou, K. Dinoflagellate cysts in recent marine sediments from Thermaikos Gulf, Greece: Effects of resuspension events on vertical cyst distribution. Cont. Shelf Res. 2005, 25, 2585–2596. [Google Scholar] [CrossRef]
- Bodenau, N. Microbial blooms in the Romanian area of the Black Sea and contemporary eutrophication conditions. In Toxic Phytoplankton Blooms in the Sea; Smayda, T.J., Shimizu, Y., Eds.; Elsevier: Amsterdam, The Netherland, 1993; pp. 203–209. [Google Scholar]
- Tsai, S.-F.; Wu, L.-Y.; Chou, W.-C.; Chiang, K.-P. The dynamics of a dominant dinoflagellate, Noctiluca scintillans, in the subtropical coastal waters of the Matsu archipelago. Mar. Pollut. Bull. 2018, 127, 553–558. [Google Scholar] [CrossRef] [PubMed]
- Turkoglu, M.; Koray, T. Phytoplankton species succession and nutrients in the Southern Black Sea (Bay of Sinop). Turk. J. Bot. 2002, 26, 235–252. [Google Scholar]
- Turkoglu, M.; Koray, T. Algal blooms in surface waters of the Sinop Bay in the Black Sea, Turkey. Pak. J. Biol. Sci. 2004, 7, 1577–1585. [Google Scholar]
- Kopuz, U.; Feyzioglu, A.M.; Valente, A. An unusual red-tide event of Noctiluca scintillans (Macartney) in the southeastern Black Sea. Turk. J. Fish. Aquat. Sci. 2014, 14, 261–268. [Google Scholar] [CrossRef]
- Koray, T.; Buyukisik, B.; Parlak, H.; Gokpinar, S. Final reports on research projects dealing with eutrophication and heavy metal accumulation. In Eutrophication Processes and Algal Blooms (Red-Tides) in Izmir Bay; UNEP: Athens, Greece, 1996; Volume 104, pp. 1–26. [Google Scholar]
- Umani, S.F.; Beran, A.; Parlato, S.; Virgilio, D.; Zollet, T.; De Olazabal, A.; Lazzarini, B.; Cabrini, M. Noctiluca scintillans Macartney in the Northern Adriatic Sea: Long-term dynamics, relationships with temperature and eutrophication, and role in the food web. J. Plankton Res. 2004, 26, 545–561. [Google Scholar] [CrossRef]
- Gómez, F. Diversity and distribution of noctilucoid dinoflagellates (Noctilucales, Dinophyceae) in the open Mediterranean Sea. Acta Protozool. 2010, 49, 365–372. [Google Scholar]
- Gárate-Lizárraga, I.; García-Domínguez, F.; Pérez-Cruz, B.; Díaz-Ortiz, J.A. First record of Cochlodinium convoltum and C. helicoides (Gymnodiniales: Dinophyceae) in the Gulf of California. Rev. Biol. Mar. Oceanog. 2011, 46, 495–498. [Google Scholar] [CrossRef]
- Miyaguchi, H.; Fujiki, T.; Kikuchi, T.; Kuwahara, V.S.; Toda, T. Relationship between the bloom of Noctiluca scintillans and environmental factors in the coastal waters of Sagami Bay, Japan. J. Plankton Res. 2006, 28, 313–324. [Google Scholar] [CrossRef]
- Dela-Cruz, J.; Ajani, P.; Lee, R.; Pritchard, T.; Suthers, I. Temporal abundance patterns of the red tide dinoflagellate Noctiluca scintillans along the southeast coast of Australia. Mar. Ecol. Prog. Ser. 2002, 236, 75–88. [Google Scholar] [CrossRef]
- Tiselius, P.; Kiørboe, T. Colonization of diatom aggregates by the dinoflagellate Noctiluca scintillans. Limnol. Oceanogr. 1998, 43, 154–159. [Google Scholar] [CrossRef]
- Zhang, S.; Liu, H.; Ke, Y.; Li, B. Effect of the silica content of diatoms on protozoan grazing. Front. Mar. Sci. 2017, 4, 202. [Google Scholar] [CrossRef]
- Escalera, L.; Pazos, Y.; Morono, A.; Reguera, B. Noctiluca scintillans may act as a vector of toxigenic microalgae. Harmful Algae 2007, 6, 317–320. [Google Scholar] [CrossRef]
- Frangópulos, M.; Spyrakos, E.; Guisande, C. Ingestion and clearance rates of the red Noctiluca scintillans fed on the toxic dinoflagellate Alexandrium minutum (Halim). Harmful Algae 2011, 10, 304–309. [Google Scholar] [CrossRef]
- Vlamis, A.; Katikou, P. Climate influence on Dinophysis spp. spatial and temporal distributions in Greek coastal water. Plankton Benthos Res. 2014, 9, 15–31. [Google Scholar] [CrossRef]
- Monitoring the Marine Environment of Thermaikos Gulf. Available online: https://www.researchgate.net/publication/326292943_Monitoring_the_marine_environment_of_Thermaikos_Gulf/link/5b4441c40f7e9bb59b1b265a/download (accessed on 10 July 2019).
- Mikaelyan, A.S.; Malej, A.; Shiganova, T.A.; Turk, V.; Sivkovitch, A.E.; Musaeva, E.I.; Kogovšek, T.; Lukasheva, T.A. Populations of the red tide forming dinoflagellate Noctiluca scintillans (Macartney): A comparison between the Black Sea and the northern Adriatic Sea. Harmful Algae 2014, 33, 29–40. [Google Scholar] [CrossRef]
- Montani, S.; Pithakpol, S.; Tada, K. Nutrient regeneration in coastal seas by Noctiluca scintillans, a red tide-causing dinoflagellate. J. Mar. Biotechnol. 1998, 6, 224–228. [Google Scholar]
- Schaumann, K.; Gerdes, D.; Hesse, K. Hydrographic and biological characteristics of a Noctiluca scintillans red tide in the German Bight, 1984. Meeresforschung 1988, 32, 77–91. [Google Scholar]
- Baliarsingh, S.K.; Lotliker, A.A.; Trainer, V.L.; Wells, M.L.; Parida, C.; Sahu, B.K.; Srichandan, S.; Sahu, K.C.; Kumar, T.S. Environmental dynamics of red Noctiluca scintillans bloom in tropical coastal waters. Mar. Pollut. Bull. 2016, 111, 277–286. [Google Scholar] [CrossRef]
- Millero, F.J.; Graham, T.B.; Huang, F.; Bustos-Serrano, H.; Pierrot, D. Dissociation constants of carbonic acid in seawater as a function of salinity and temperature. Mar. Chem. 2006, 100, 80–94. [Google Scholar] [CrossRef]
- Kang, N.S.; Lee, K.H.; Jeong, H.J.; Yoo, Y.D.; Seong, K.A.; Potvin, E.; Hwanga, Y.J.; Yoond, E.Y. Red tides in Shiwha Bay, western Korea: A huge dike and tidal power plant established in a semi-enclosed embayment system. Harmful Algae 2013, 30, S114–S130. [Google Scholar] [CrossRef]
- Gustafson, D.E., Jr.; Stoesker, D.K.; Johnson, M.D.; Van Heukelem, W.F.; Sneider, K. Cryptophte algae are robbed of their organelles by the marine Mesodinium rubrum. Nature 2000, 405, 1049–1052. [Google Scholar] [CrossRef] [PubMed]
- Park, M.G.; Kim, S.; Kim, H.S.; Myung, G.; Kang, Y.G.; Yih, W. First successful culture of the marine dinoflagellate Dinophysis acuminata. Aquat. Microb. Ecol. 2006, 45, 101–106. [Google Scholar] [CrossRef]
- Lee, K.H.; Jeong, H.J.; Yoon, E.Y.; Jang, S.H.; Kim, H.S.; Yih, W. Feeding by common heterotrophic dinoflagellates and a ciliate on the red-tide ciliate Mesodinium rubrum. Algae 2014, 29, 153–163. [Google Scholar] [CrossRef]
- Degobbis, D.; Umani, S.F.; Franco, P.; Malej, A.; Precali, R.; Smodlaka, N. Changes in the northern Adriatic ecosystem and the hypertrophic appearance of gelatinous aggregates. Sci. Total Environ. 1995, 165, 43–58. [Google Scholar] [CrossRef]
- Precali, R.; Giani, M.; Marini, M.; Grilli, F.; Ferrari, C.R.; Pečar, O.; Paschini, E. Mucilaginous aggregates in the northern Adriatic in the period 1999–2002: Typology and distribution. Sci. Total Environ. 2005, 353, 10–23. [Google Scholar] [CrossRef] [PubMed]
- Giani, M.; Berto, D.; Zangrando, V.; Castelli, S.; Sist, P.; Urbani, R. Chemical characterization of different typologies of mucilaginous aggregates in the Northern Adriatic Sea. Sci. Total Environ. 2005, 353, 232–246. [Google Scholar] [CrossRef]
- Svetličić, V.; Žutić, V.; Radić, T.M.; Pletikapić, G.; Zimmermann, A.H.; Urbani, R. Polymer networks produced by marine diatoms in the Northern Adriatic Sea. Mar. Drugs 2011, 9, 666–679. [Google Scholar] [CrossRef]
- Pompei, M.; Mazziotti, C.; Guerrini, F.; Cangini, M.; Pigozzi, S.; Benzi, M.; Palamidesi, S.; Boni, L.; Pistocchi, R. Correlation between the presence of Gonyaulax fragilis (Dinophyceae) and the mucilage phenomena of the Emilia-Romagna coast (northern Adriatic Sea). Harmful Algae 2003, 2, 301–316. [Google Scholar] [CrossRef]
- Tüfekçi, V.; Balkis, N.; Beken, C.P.; Ediger, D.; Mantikçi, M. Phytoplankton composition and environmental conditions of a mucilage event in the Sea of Marmara. Turk. J. Biol. 2010, 34, 199–210. [Google Scholar]
- Ignatiades, L.; Gotsis-Skretas, O. A review on toxic and harmful algae in Greek coastal waters (E. Mediterranean Sea). Toxins 2010, 2, 1019–1037. [Google Scholar] [CrossRef]
- De Lazzari, A.; Berto, D.; Cassin, D.; Boldrin, A.; Giani, M. Influence of winds and oceanographic conditions on the mucilage aggregation in the Northern Adriatic Sea in 2003–2006. Mar. Ecol. 2008, 29, 469–482. [Google Scholar] [CrossRef]
Figure 1.
Study area in Thermaikos Bay, indicating the location of the four sampling sites (*). WT: White Tower, AR: Aretsou, MH: Music Hall, HB: Harbor.
Figure 1.
Study area in Thermaikos Bay, indicating the location of the four sampling sites (*). WT: White Tower, AR: Aretsou, MH: Music Hall, HB: Harbor.

Figure 2.
Number of taxa (a), and total abundance (b) in White Tower (WT), Aretsou (AR), Music Hall (MH), and Harbor (HB). For sampling codes, see also Table 2.
Figure 2.
Number of taxa (a), and total abundance (b) in White Tower (WT), Aretsou (AR), Music Hall (MH), and Harbor (HB). For sampling codes, see also Table 2.

Figure 3.
Cluster diagram according to Jaccard resemblance, calculated based on the non-transformed abundance (cells mL−1) of taxa during the study. Red clades in the dendrogram indicate sections of the plot where the observed profile corresponds to similarities that are larger than those expected under null conditions (>99% of the confidence envelope), suggesting the presence of true structure within the data. The nodes represent the dominant taxa blooming during the period covered by the corresponding clades.

Figure 4.
Network diagrams of highly significant connections (p-values < 0.01) based on the maximal information coefficient (MIC) scores between dominant taxa (comprising of > 10% of the total plankton abundance in at least one sample) and environmental parameters. Boxes (nodes) with indicated taxa names, represent bloom (detected with abundances > 1000 cells mL−1 in at least one sample throughout the samplings), and red tide forming taxa. To facilitate reading only bloom and red tide forming taxa are indicated. Black lines (edges) depict positive connections, and red edges depict negative connections.


Table 1.
Sampling sites and total number of samples collected.
| Sampling Sites | Latitude | Longitude | Number of Samples |
|---|---|---|---|
| White Tower (WT) | 40°37′34 N | 22°56′51 E | 47 |
| Aretsou Beach (AR) | 40°34′29 N | 22°56′38 E | 12 |
| Music Hall coast (MH) | 40°35′57 N | 22°56′53 E | 12 |
| Harbor (HB) | 40°37′55 N | 22°56′09 E | 12 |
Table 2.
Sample dates, sites and coding, and values of abiotic parameters (water temperature, salinity, SiO4, PO4, NO2, NO3 and NO2, NH4, POP – Particulate Organic Phosphorus, Chl a). All nutrient concentration values are given in μmol L−1. The sampling sites are shown in Figure 1.
Table 2.
Sample dates, sites and coding, and values of abiotic parameters (water temperature, salinity, SiO4, PO4, NO2, NO3 and NO2, NH4, POP – Particulate Organic Phosphorus, Chl a). All nutrient concentration values are given in μmol L−1. The sampling sites are shown in Figure 1.
| Sample Date and Site | Sample Code | Temperature of Water (°C) | Salinity | SiO4 | PO4 | NO2 | NO3 & NO2 | NH4 | POP | Chl a (μg L−1) |
|---|---|---|---|---|---|---|---|---|---|---|
| 1. 15 March 2017–W. Tower | 15MarWT | 12.1 | 38.8 | 3.85 | 0.75 | 0.37 | 3.59 | 7.59 | 0.20 | 0.60 |
| 2. 22 March 2017–W. Tower | 22MarWT | 14 | 38.6 | 10.17 | 9.54 | 0.77 | 7.53 | 160.3 | 42.1 | 3.54 |
| 3. 29 March 2017–W. Tower | 29MarWT | 14.1 | 37.2 | 4.98 | 0.42 | 0.09 | 1.72 | 3.55 | 0.46 | 1.67 |
| 4. 05 April 2017–W. Tower | 05AprWT | 16.4 | 37.3 | 6.33 | 0.41 | 0.40 | 2.28 | 6.71 | 0.85 | 2.42 |
| 5. 12 April 2017–W. Tower | 12AprWT | 15.5 | 37.7 | 8.49 | 0.78 | 0.08 | 8.36 | 11.2 | 2.81 | 2.76 |
| 6. 12 April 2017–Aretsou | 12AprAR | 16.1 | 37.3 | 3.79 | 0.27 | 0.20 | 2.52 | 4.48 | 0.48 | 1.39 |
| 7. 12 April 2017–Music Hall | 12AprMH | 15.4 | 38.3 | 3.94 | 0.30 | 0.06 | 1.00 | 3.04 | 0.30 | 1.29 |
| 8. 12 April 2017–Harbour | 12AprHB | 15.5 | 38.2 | 4.52 | 0.25 | 0.16 | 1.39 | 3.55 | 0.78 | 2.79 |
| 9. 19 April 2017–W. Tower | 19AprWT | 15.8 | 38 | 2.59 | 0.19 | 0.04 | 0.54 | 1.99 | 0.21 | 0.60 |
| 10. 26 April 2017–W. Tower | 26AprWT | 15.1 | 38.2 | 3.36 | 0.35 | 0.10 | 1.82 | 4.36 | 0.28 | 0.78 |
| 11. 03 May 2017–W. Tower | 03MayWT | 19 | 37.3 | 3.63 | 0.22 | 0.19 | 2.69 | 3.53 | 0.38 | 1.14 |
| 12. 09 May 2017–W. Tower | 09MayWT | 18.6 | 37.8 | 4.76 | 0.20 | 0.15 | 7.36 | 4.61 | 0.25 | 0.95 |
| 13. 09 May 2017–Aretsou | 09MayAR | 19.5 | 38 | 4.10 | 0.18 | 0.21 | 2.26 | 4.63 | 0.22 | 1.10 |
| 14. 09 May 2017–Music Hall | 09MayMH | 19 | 38.1 | 2.37 | 0.30 | 0.13 | 1.71 | 4.45 | 0.14 | 0.48 |
| 15. 09 May 2017–Harbour | 09MayHB | 18.3 | 38.1 | 2.50 | 0.16 | 0.15 | 1.54 | 3.73 | 0.23 | 0.71 |
| 16. 17 May 2017–W. Tower | 17MayWT | 20.1 | 37.1 | 6.34 | 0.49 | 0.19 | 7.08 | 5.32 | 0.97 | 2.77 |
| 17. 24 May 2017–W. Tower | 24MayWT | 22 | 32.8 | 2.95 | 0.15 | 0.18 | 1.97 | 2.67 | 0.49 | 3.63 |
| 18. 31 May 2017–W. Tower | 31MayWT | 22.7 | 37.4 | 2.55 | 0.18 | 0.21 | 5.03 | 2.03 | 0.62 | 4.70 |
| 19. 07 June 2017–W. Tower | 07JunWT | 25.4 | 36.7 | 3.44 | 0.57 | 0.27 | 2.36 | 8.08 | 0.55 | 1.40 |
| 20. 07 June 2017–Aretsou | 07JunAR | 25.7 | 36.3 | 5.93 | 0.20 | 0.14 | 4.70 | 2.96 | 0.51 | 2.17 |
| 21. 07 June 2017–Music Hall | 07JunMH | 24.9 | 36.7 | 4.13 | 0.43 | 0.10 | 0.89 | 4.36 | 0.48 | 1.04 |
| 22. 07 June 2017–Harbour | 07JunHB | 25.9 | 36.5 | 4.87 | 0.48 | 0.21 | 3.11 | 6.01 | 0.49 | 1.14 |
| 23. 14 June 2017–W. Tower | 14JunWT | 25.5 | 36.7 | 6.24 | 0.40 | 0.33 | 3.91 | 7.53 | 0.54 | 1.74 |
| 24. 21 June 2017–W. Tower | 21JunWT | 23.1 | 36.2 | 4.13 | 0.27 | 0.26 | 2.55 | 5.10 | 0.26 | 1.01 |
| 25. 28 June 2017–W. Tower | 28JunWT | 28 | 36.1 | 18.39 | 0.24 | 0.18 | 10.93 | 6.33 | 1.87 | 6.85 |
| 26. 28 June 2017–Aretsou | 28JunAR | 28.4 | 36.2 | 6.99 | 0.18 | 0.14 | 3.72 | 3.34 | 0.70 | 4.10 |
| 27. 28 June 2017–Music Hall | 28JunMH | 27.9 | 36 | 10.04 | 0.44 | 0.21 | 4.46 | 6.99 | 0.38 | 1.11 |
| 28. 28 June 2017–Harbour | 28JunHB | 28.7 | 36.4 | 9.44 | 0.14 | 0.07 | 2.48 | 2.37 | 0.86 | 4.44 |
| 29. 04 July 2017–W. Tower | 04JulWT | 20.5 | 35.7 | 6.79 | 0.49 | 0.16 | 2.43 | 7.68 | 0.23 | 1.21 |
| 30. 12 July 2017–W. Tower | 12JulWT | 28 | 36.7 | 4.69 | 0.19 | 0.07 | 1.98 | 4.24 | 0.41 | 2.56 |
| 31. 19 July 2017–W. Tower | 19JulWT | 23.4 | 35.3 | 5.24 | 0.15 | 0.09 | 1.32 | 2.13 | 0.91 | 9.90 |
| 32. 26 July 2017–W. Tower | 26JulWT | 28.8 | 35.9 | 6.42 | 0.14 | 0.07 | 1.58 | 2.36 | 0.56 | 1.98 |
| 33. 26 July 2017–Aretsou | 26JulAR | 28.1 | 36.4 | 5.47 | 0.12 | 0.20 | 3.34 | 2.47 | 0.58 | 1.75 |
| 34. 26 July 2017–Music Hall | 26JulMH | 29.3 | 36 | 5.25 | 0.13 | 0.10 | 0.72 | 1.93 | 0.79 | 2.14 |
| 35. 26 July 2017–Harbour | 26JulHB | 29 | 35.5 | 6.65 | 0.14 | 0.07 | 0.88 | 4.45 | 0.67 | 1.24 |
| 36. 02 August 2017–W. Tower | 02AugWT | 27.2 | 36.3 | 7.33 | 0.25 | 0.11 | 2.34 | 4.96 | 0.31 | 0.79 |
| 37. 09 August 2017–W. Tower | 09AugWT | 29.7 | 36.6 | 7.91 | 0.30 | 0.15 | 7.21 | 7.26 | 0.66 | 1.13 |
| 38. 23 August 2017–W. Tower | 23AugWT | 24.6 | 37.7 | 6.00 | 0.24 | 0.09 | 1.01 | 3.50 | 0.25 | 0.77 |
| 39. 23 August 2017–Aretsou | 23AugAR | 25 | 36.8 | 7.08 | 0.24 | 0.25 | 2.21 | 3.03 | 0.29 | 1.05 |
| 40. 23 August 2017–Music Hall | 23AugMH | 24.9 | 37.5 | 5.91 | 0.21 | 0.08 | 1.99 | 3.11 | 0.21 | 1.04 |
| 41. 23 August 2017–Harbour | 23AugHB | 24.6 | 37.7 | N/A | N/A | N/A | N/A | N/A | 0.20 | 0.77 |
| 42. 30 August 2017–W. Tower | 30AugWT | 24.9 | 36.3 | 6.03 | 0.63 | 0.40 | 6.29 | 9.63 | 0.74 | 1.86 |
| 43. 06 September 2017–W. Tower | 06SepWT | 24.8 | 37.6 | 8.70 | 0.30 | 0.19 | 3.53 | 6.00 | 0.78 | 1.23 |
| 44. 13 September 2017–W. Tower | 13SepWT | 26.2 | 37.2 | 3.10 | 0.17 | 0.16 | 1.27 | 3.51 | 0.43 | 1.81 |
| 45. 20 September 2017–W. Tower | 20SepWT | 26.6 | 37.3 | 11.83 | 0.25 | 0.19 | 3.80 | 6.64 | 0.84 | 1.66 |
| 46. 20 September 2017–Aretsou | 20SepAR | 26.4 | 37.3 | 10.08 | 0.16 | 0.46 | 5.75 | 5.68 | 0.40 | 2.25 |
| 47. 20 September 2017–Music Hall | 20SepMH | 26.8 | 37.4 | 13.37 | 0.34 | 0.20 | 2.54 | 8.54 | 0.66 | 1.50 |
| 48. 20 September 2017–Harbour | 20SepHB | 26.6 | 37.3 | 13.14 | 0.27 | 0.23 | 4.78 | 7.04 | 0.42 | 1.60 |
| 49. 27 September 2017–W. Tower | 27SepWT | 22.6 | 37.2 | 1.27 | 0.28 | 0.08 | 1.44 | 2.16 | 0.16 | 2.74 |
| 50. 04 October 2017–W. Tower | 04OctWT | 22.2 | 37.4 | 2.78 | 0.38 | 0.14 | 2.16 | 3.18 | 0.16 | 0.66 |
| 51. 11 October 2017–W. Tower | 11OctWT | 20.9 | 37.4 | 2.31 | 0.32 | 0.29 | 2.11 | 4.53 | 0.17 | 0.72 |
| 52. 18 October 2017–W. Tower | 18OctWT | 20.8 | 38.1 | 2.60 | 0.31 | 0.08 | 1.92 | 3.14 | 0.28 | 1.29 |
| 53. 18 October 2017–Aretsou | 18OctAR | 20.5 | 37.4 | 2.07 | 0.22 | 0.09 | 1.80 | 2.49 | 0.21 | 2.24 |
| 54. 18 October 2017–Music Hall | 18OctMH | 20.8 | 37.6 | 1.25 | 0.23 | 0.07 | 0.79 | 2.69 | 0.20 | 1.08 |
| 55. 18 October 2017–Harbour | 18OctHB | 20.8 | 37.7 | 2.66 | 3.71 | 0.19 | 2.03 | 32.86 | 1.12 | 1.50 |
| 56. 25 October 2017–W. Tower | 18OctWT | 19.8 | 36.7 | 2.39 | 0.32 | 0.11 | 4.41 | 3.40 | 0.17 | 0.98 |
| 57. 01 November 2017–W. Tower | 01NovWT | 17.4 | 37.6 | 2.94 | 0.35 | 0.19 | 2.10 | 3.29 | 0.17 | 0.71 |
| 58. 08 November 2017–W. Tower | 08NovWT | 16.7 | 37.6 | 1.35 | 0.30 | 0.10 | 1.02 | 2.92 | 0.39 | 0.94 |
| 59. 15 November 2017–W. Tower | 15NovWT | 16.7 | 37.5 | 2.98 | 0.30 | 0.18 | 3.82 | 6.38 | 0.77 | 6.58 |
| 60. 15 November 2017–Aretsou | 15NovAR | 16.9 | 37.7 | 2.50 | 0.31 | 0.21 | 2.92 | 3.54 | 0.19 | 1.10 |
| 61. 15 November 2017–Music Hall | 15NovMH | 16.8 | 37.8 | 2.77 | 0.23 | 0.11 | 1.85 | 3.09 | 0.08 | 1.34 |
| 62. 15 November 2017–Harbour | 15NovHB | 16.6 | 37.3 | 1.07 | 0.30 | 0.08 | 1.23 | 7.54 | 1.50 | 10.05 |
| 63. 22 November 2017–W. Tower | 22NovWT | 15.2 | 37.8 | 1.32 | 0.27 | 0.10 | 0.72 | 2.42 | 0.15 | 1.02 |
| 64. 29 November 2017–W. Tower | 29NovWT | 13.7 | 37.7 | 5.05 | 0.51 | 0.60 | 2.41 | 4.49 | 0.19 | 1.75 |
| 65. 06 December 2017–W. Tower | 06DecWT | 13.3 | 37.3 | 2.29 | 0.28 | 0.19 | 2.05 | 2.08 | 0.18 | 4.73 |
| 66. 13 December 2017–W. Tower | 13DecWT | 12.5 | 37.8 | 3.87 | 0.37 | 0.10 | 0.54 | 3.20 | 0.49 | 17.28 |
| 67. 13 December 2017–Aretsou | 13DecAR | 12.4 | 37.4 | 5.47 | 0.45 | 0.23 | 3.54 | 2.04 | 1.09 | 16.33 |
| 68. 13 December 2017–Music Hall | 13DecMH | 12.8 | 37.7 | 6.42 | 0.32 | 0.11 | 1.28 | 2.68 | 0.13 | 0.93 |
| 69. 13 December 2017–Harbour | 13DecHB | 12.5 | 37.8 | 6.29 | 0.46 | 0.41 | 2.42 | 4.49 | 0.23 | 1.91 |
| 70. 19 December 2017–W. Tower | 19DecWT | 11.7 | 37.7 | 6.03 | 0.33 | 0.09 | 2.14 | 3.21 | 0.22 | 1.95 |
| 71. 27 December 2017–W. Tower | 27DecWT | 11.1 | 37.9 | 4.84 | 0.37 | 0.11 | 1.69 | 5.75 | 0.08 | 0.27 |
| 72. 03 January 2018–W. Tower | 03JanWT | 11.1 | 38 | 2.63 | 0.22 | 0.06 | 2.38 | 2.08 | 0.20 | 2.52 |
| 73. 10 January 2018–W. Tower | 10JanWT | 10.6 | 36.6 | 9.62 | 1.58 | 0.35 | 21.46 | 17.81 | 1.06 | 1.79 |
| 74. 10 January 2018–Aretsou | 10JanAR | 10.7 | 38.1 | 5.06 | 0.26 | 0.15 | 3.63 | 2.74 | 0.18 | 0.92 |
| 75. 10 January 2018–Music Hall | 10JanMH | 10.7 | 37.8 | 2.72 | 0.54 | 0.16 | 3.81 | 4.58 | 0.25 | 2.95 |
| 76. 10 January 2018–Harbour | 10JanHB | 10.6 | 37.2 | 3.43 | 0.55 | 0.16 | 7.67 | 7.27 | 1.12 | 8.31 |
| 77. 17 January 2018–W. Tower | 17JanWT | 10.4 | 37.8 | 1.46 | 0.26 | 0.04 | 1.01 | 2.24 | 0.12 | 1.02 |
| 78. 24 January 2018–W. Tower | 24JanWT | 9.6 | 37.9 | 2.28 | 0.29 | 0.08 | 2.35 | 2.06 | 0.18 | 1.15 |
| 79. 31 January 2018–W. Tower | 31JanWT | 10.7 | 38.2 | 2.48 | 0.28 | 0.07 | 3.00 | 2.24 | 0.20 | 1.15 |
| 80. 06 February 2018–W. Tower | 06FebWT | 11.9 | 38.4 | 2.27 | 0.32 | 0.09 | 2.78 | 3.22 | 0.28 | 2.82 |
| 81. 06 February 2018–Aretsou | 06FebAR | 11.8 | 38.1 | 3.14 | 0.21 | 0.07 | 2.80 | 5.93 | 0.34 | 2.91 |
| 82. 06 February 2018–Music Hall | 06FebMH | 11.7 | 38.4 | 1.89 | 0.17 | 0.06 | 0.44 | 1.91 | 0.26 | 2.30 |
| 83. 06 February 2018–Harbour | 06FebHB | 11.9 | 38 | 3.96 | 0.29 | 0.08 | 3.97 | 4.02 | 0.60 | 3.36 |
© 2019 by the authors. Licensee MDPI, Basel, Switzerland. This article is an open access article distributed under the terms and conditions of the Creative Commons Attribution (CC BY) license (http://creativecommons.org/licenses/by/4.0/).
Share and Cite
MDPI and ACS Style
Genitsaris, S.; Stefanidou, N.; Sommer, U.; Moustaka-Gouni, M. Phytoplankton Blooms, Red Tides and Mucilaginous Aggregates in the Urban Thessaloniki Bay, Eastern Mediterranean. Diversity 2019, 11, 136. https://doi.org/10.3390/d11080136
AMA Style
Genitsaris S, Stefanidou N, Sommer U, Moustaka-Gouni M. Phytoplankton Blooms, Red Tides and Mucilaginous Aggregates in the Urban Thessaloniki Bay, Eastern Mediterranean. Diversity. 2019; 11(8):136. https://doi.org/10.3390/d11080136
Chicago/Turabian StyleGenitsaris, Savvas, Natassa Stefanidou, Ulrich Sommer, and Maria Moustaka-Gouni. 2019. "Phytoplankton Blooms, Red Tides and Mucilaginous Aggregates in the Urban Thessaloniki Bay, Eastern Mediterranean" Diversity 11, no. 8: 136. https://doi.org/10.3390/d11080136
Note that from the first issue of 2016, this journal uses article numbers instead of page numbers. See further details here.