 Alexander Heuser
 Petra Frings-Meuthen2
 Jörn Rittweger
 Stephen J. G. Galer
- 1Steinmann-Institut für Geologie, Mineralogie und Paläontologie, Universität Bonn, Bonn, Germany
- 2Institute of Aerospace Medicine, German Aerospace Center (DLR), Cologne, Germany
- 3Department of Pediatrics and Adolescent Medicine, University of Cologne, Cologne, Germany
- 4Max-Planck-Institut für Chemie, Abteilung Klimageochemie, Mainz, Germany
The calcium (Ca) isotopic composition in urine during bed rest has been demonstrated to be systematically light, indicating a negative bone mineral balance (i.e., bone loss). Here we present new Ca isotope data on urine during the “nutritional countermeasures” (NUC) bed rest study. We analyzed the Ca isotopic composition of 24 h pooled urine samples from seven healthy male subjects during baseline data collection (BDC), head-down-tilt bed rest and recovery. Additionally, we analyzed urine from two follow-up examinations after the regeneration phase. We observed a change in Ca isotopic composition during the bed rest phase, indicative of bone loss with a time delay of 10 to 21 days. We also observe that the Ca isotopic composition of urine is strongly dependent on the individual Ca metabolism and varies between subjects. We relate this individuality in Ca metabolism to differences in the amounts of Ca being recycled in the kidneys. Previous studies have shown that the more Ca is reabsorbed in the kidneys the more enriched the urine becomes in heavy isotopes of calcium. The Ca isotopic composition of urine is thus modified by more than one process and cannot be used in a straightforward manner to monitor net bone mineral balance. To overcome this problem, we propose a new baseline approach for using Ca isotopes, which effectively cancels out the effects of individual renal Ca reabsorption. This allows us to detect bone loss in patients without ambiguity by combining measurements of the Ca isotopic composition of urine and daily Ca excretion rate and comparing these to data collected on healthy individuals with a normal steady-state bone balance.
Introduction
Living under microgravity conditions in space leads to significant changes in the human body and affects human physiology. For example, body fluids are shifted toward the upper part of the body, and mechanical unloading of muscles and bones occurs in the lower extremities. The mechanical unloading of bones leads to bone loss, which is a critical issue for astronauts and especially for those on long-duration space flights. Many of the physiological effects of microgravity-induced changes can be simulated on Earth by a head-down-tilt bed rest study (HDTBR) – namely, a prolonged bed rest at a 6° head-down-tilt position (Rittweger et al., 2006). This is of great interest regarding calcium (Ca) metabolism, since HDTBR drives the net bone balance of the body out of equilibrium.
Calcium plays an important role in many physiological processes such as blood coagulation, synaptic transmission, muscle contraction and cell apoptosis. In order to maintain the functionality of physiological processes involving Ca, the Ca concentration in blood must be held constant within small limits (Ca homeostasis). Three organs play an important role in Ca exchange with the environment: (1) the gastrointestinal tract where Ca is absorbed from the diet, (2) the skeleton which is the main reversible Ca pool in the body, and (3) the kidneys, which regulate the excretion and recycling of calcium from blood. The interaction of these three organs is controlled by hormones (calcitriol, parathormone, and calcitonin) which are secreted in response to the Ca and phosphate concentrations in blood serum (Weaver and Heaney, 2006).
In the past few years, several studies have investigated the use of Ca isotopes as a non-invasive tool for detecting bone loss. During Ca transport in the body, Ca isotopes are fractionated. This was first shown in a pioneering study by Skulan and DePaolo (1999) who examined systematically the Ca isotopic composition of soft and mineralized tissues in vertebrates. One important result they found was that mineralized tissue is enriched in light isotopes of Ca (isotopically light Ca) compared to that of blood. During bone formation Ca in blood becomes depleted in light Ca isotopes while, conversely, isotopically light Ca is released during bone loss to the blood without further fractionation. Gordon et al. (2014) successfully used the Ca isotopic composition of blood serum to predict the active state of multiple myeloma (MM) disease in patients. During the active state of MM, bone is destructed and a lowering of δ44/42Cablood-serum was observed, as predicted. The Ca isotopic composition of blood is also transferred into urine via the kidneys, so changes in δ44/42Caurine can also be used to monitor net bone balance in the body (Skulan et al., 2007; Heuser and Eisenhauer, 2010; Morgan et al., 2012). All three of these studies reported that Ca in urine is strongly enriched in heavy Ca isotopes compared to that of bones and blood. According to Heuser and Eisenhauer (2010) this enrichment occurs during Ca reabsorption from primary urine in the kidney. The light Ca isotopes are preferentially reabsorbed from primary urine and thus lead to a relative enrichment of heavy Ca isotopes in secondary urine. For this reason, the use of δ44/42Caurine as marker for net bone balance is potentially hampered by fractionation of Ca isotopes during urine generation, which is strongly dependent on the fraction of Ca reabsorbed in the kidneys (Heuser and Eisenhauer, 2010; Heuser, 2016).
Here, we investigate the response of the Ca metabolism during simulated microgravity by analyzing the Ca isotopic composition of urine. We hypothesized that during HDTBR, Ca isotopes in urine are sensitive for detecting even small extents of bone loss. Additionally, the samples also allow us to gain further insight into Ca isotope fractionation during Ca transport in the human body under the controlled conditions of a clinical study.
Materials and Methods
Study Details and Collection of Biological Samples
Seven healthy, male, nonsmoking, test subjects participated in the “nutritional countermeasures” (NUC) bed rest study. Female subject were excluded due to a higher risk of venous trombosis during immobilization (Bleeker et al., 2004). This study was funded by the German Aerospace Center (Deutsches Zentrum für Luft-und Raumfahrt, DLR) and the European Space Agency. The subjects had mean age: 27.3 ± 3.4 years, mean body mass: 78.3 ± 6.6 kg, mean body mass index (BMI): 24.1 ± 1.9 kg/m2, and VO2max: 39.5 ± 5.4 ml/kg body mass/min. Approval for the study was obtained from the Ethical Committee of the “Ärztekammer Nordrhein” in Düsseldorf, Germany, and was conducted in accordance with the Declaration of Helsinki. Volunteers gave their written consent after receiving detailed information about the study protocol and the resulting risks. An extensive medical record for each subject was taken, while a routine medical examination and laboratory analyses were done to exclude chronic diseases. None of the subjects received any medication.
Subjects were confined to the bed rest facility of the DLR Institute of Aerospace Medicine, Cologne, Germany for two cross-over designed study campaigns, each consisting of 7 days of pre-bed rest (BDC-7 to BDC-1), 21-days of strict six-degree head down tilt bed rest (HDT1 to HDT21) and 6 days of post bed rest recovery (R + 0 to R + 5; phase R1). Additional follow-up visits took place after 14 (R + 14) and 28 days (R + 28) of bed rest (phase R2). During the 21-day bed rest period, subjects received potassium bicarbonate (3 × 30 mmol day-1) as a nutritional supplement aimed at preventing an increased bed rest induced bone resorption as the primary outcome of the study. We focussed upon measuring Ca isotopes in the second part of the overall HDTBR study, which involved four test subjects (B, D, F, and H) with dietary supplementation and three without (A, C, and G) during the bed rest period.
During the HDT period, the subjects stayed in bed 24 h a day and all activities (including showering, eating, and weighing) were performed in head-down-tilted-position, not allowing the subjects to raise their heads above 30° from normal. During the non-bed rest phases (adaptation and recovery), the subjects were allowed to walk around in the ward and to do some exercise tests.
Each volunteer received an individually tailored, weight-maintaining diet. The resting metabolic rate was computed by resting indirect calorimetry on the first day in the ward (Deltatrac II MBH 200 Metabolic Monitor). Energy intake was calculated from the resting metabolic rate and an assumed physical activity level of 1.4 for the non-bed rest phases and 1.1 for the bed rest phases. The total energy intake was augmented by 10% to account for diet-induced thermogenesis. Protein intake was 1.2 g/kg BM/day, 30% of calories were supplied as fat, and the remaining energy calories were from carbohydrates. Daily intakes of calcium (1000–1150 mg/day), fluid (50 ml/kg BM/day), sodium (2.8 mmol/kg BW/day) and potassium (100 mmol/day) were also predefined and strictly controlled during the stationary study period. Minerals and vitamins matched the minimum value for the dietary reference intake (DRI, National Academy of Sciences, Institute of Medicine; Food and Nutrition Board, United States). Because subjects were not exposed to the sun, the dietary intake of vitamin D3 was supplemented (1000 IU/day). No caffeine, or alcohol consumption was allowed. All foods were weighed exactly, and each volunteer was asked to consume the complete meal.
Twenty-four-hour urine collection was done during the whole stationary phase period. Continuous urine was collected daily on a void-by-void basis from 7:00 (±15 min) to 7:00 (±15 min) on the following day. Single voids were stored under darkened and cooled conditions and subsequently pooled to 24 h volumes. Several aliquots of the 24-h samples were stored in the freezer at -20°C for later analysis. Samples on day BDC-6, -2; HDT 2, 10, 21; R + 0, + 2, + 5, + 14, + 28 were processed for later analysis for Ca isotopes. After acidifying the urine sample with 2 mol/l HCl, the samples were aliquoted and frozen at -20°C.
Twenty-four-hour urinary bone resorption marker N-terminal telopeptide (UNTX) was determined with a commercially available assay (UNTX: Osteomark®, Wampole Laboratories, United States) in the in-house laboratory of the Institute of Aerospace Medicine (Cologne, Germany). Intra- and interassay-variation were as follows: Intra: NTX 1.3%; Inter: UNTX 4.9%.
Sample Preparation
Urine containing 25 μg of Ca was pipetted into PFA beakers and 1 ml high-purity concentrated HNO3 and 200 μl of H2O2 (Suprapure®, Merck KGaA, Darmstadt) were added. This mixture was placed on a hot plate at 120°C for more than 12 h. After chemical digestion, a small aliquot of the solution containing 2 μg of Ca was taken and an appropriate amount of 43Ca-46Ca double-spike tracer solution was added (Galer, 2007). Calcium was separated from the rest of the sample using standard cation exchange techniques utilizing quartz glass chromatographic columns containing ∼0.7 mL of Bio-Rad AG 50W-X8 (200–400 mesh) resin and 2.0 M HCl as eluent. The calcium fraction was dried, and a portion of about 1 μg Ca dissolved in 5 wt.% HNO3 and loaded onto pre-degassed single or double Re filaments. For single filaments, a Ta2O5-based activator was loaded as well, as described in Heuser et al. (2002). Loading onto double filaments was different: first, 1 μl of 0.01 M H3PO4 was placed onto the filament and dried down; then the sample solution was pipetted onto the filament and dried down; finally, the filament was raised to a current of 2.0 A for 30 s.
Mass Spectrometry and Data Reduction
Calcium isotopic compositions were measured at MPIC by thermal ionization mass spectrometry (TIMS, Thermo Fisher Scientific, Triton) in static multi-collection mode. All raw data were corrected for instrumental bias using the double-spike reduction algorithm assuming the exponential fractionation law (Galer, 2007).
All results are reported using the common δ notation for stable isotope variations (Eisenhauer et al., 2004; Coplen, 2011). δ44/42Ca values (in per mil, ‰) were expressed according to:
Here, the reference material used for “zero δ” is NIST SRM-915a, in common with other studies. Samples enriched in light Ca isotopes (isotopically “light”) compared to the reference material have negative δ while isotopically “heavy” samples (heavy isotope enriched) have positive δ-values. Note, that δ44/42Ca are a factor of ∼2 smaller than δ44/40Ca values, a notation often reported in previous work. δ44/42Ca can be converted to δ44/40Ca by multiplying by 2.05 (see Heuser et al., 2016).
Statistics
Statistical analysis and bivariate correlations were performed using the R programming language (The R Foundation for Statistical Computing)1. Means and single standard errors (1SE) are given throughout the text. P-values for correlations were calculated using a t-test approach and are regarded as significant when P < 0.05.
The primary aim of the study is to examine the temporal evolution of -6° head-down-tilt bed rest on Ca isotopes in urine. To evaluate trends with time we used a linear mixed effect (LME) statistical model. The statistical tests were performed with time as the fixed effect and the subjects as the random effect. Time was initially coded as an ordering factor, and the two BDC measurements from days BDC-6 and BDC-2 were lumped together into one BDC factor level. Homoscedasticity (homogeneity of variance) and normal distribution of residuals were evaluated using residual plots and quantile-quantile plots. Where significant effects of time were revealed by ANOVA, they were further studied by a-priori contrasts of the treatment type. Data are reported as best linear unbiased predictors (BLUP) and standard error (SE). The level of statistical significance was set to 0.05.
Results
Anthropometric data for the seven test subjects are listed in Table 1. Ca isotopic compositions and Ca concentrations of urine as well as the total Ca excreted per 24 h can be found in Table 2.
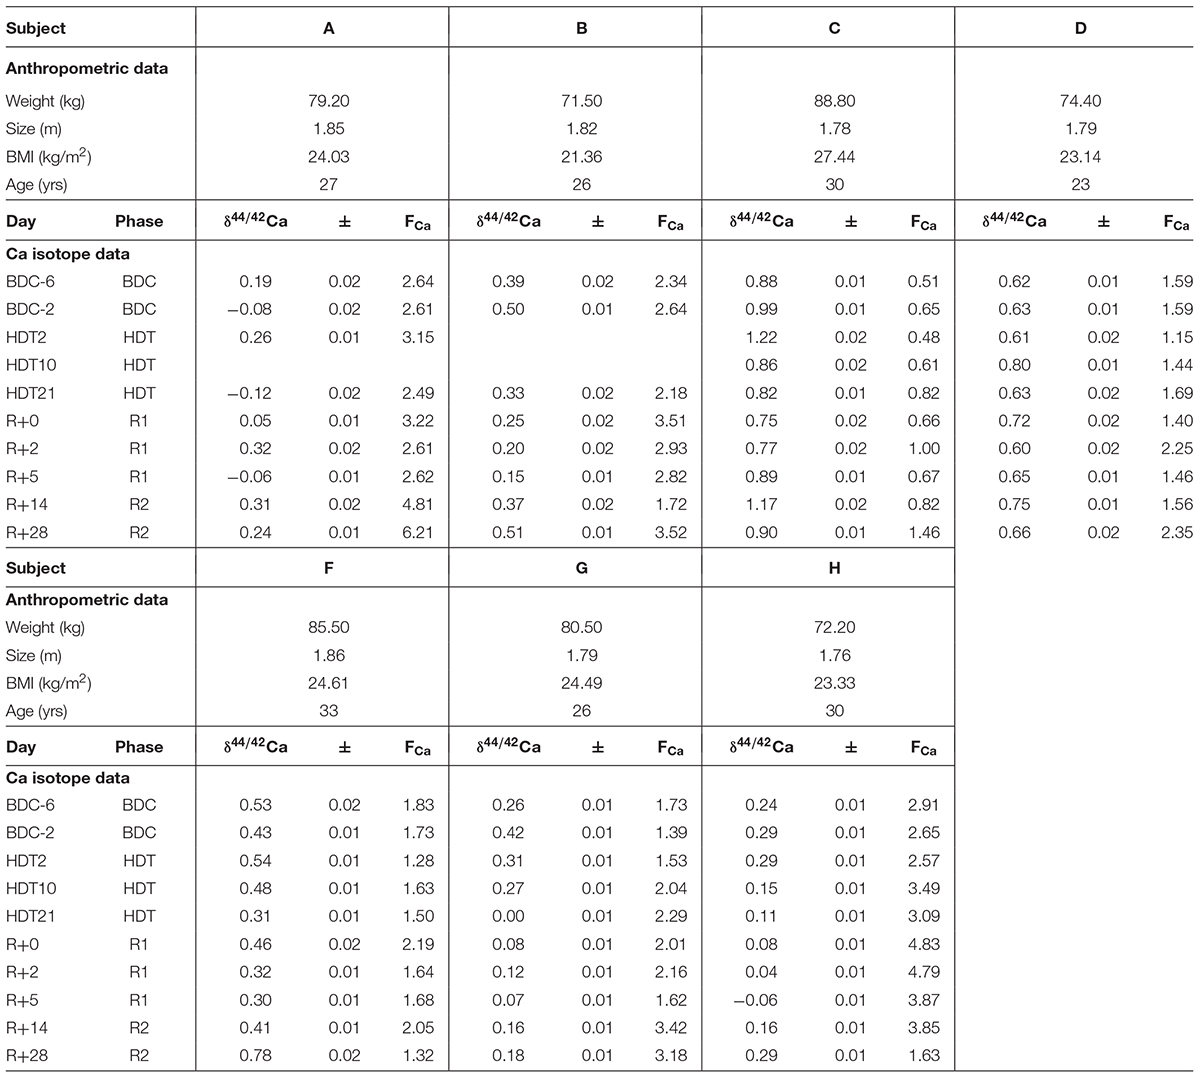
Table 1. Anthropometric data, δ44/42Ca (‰), errors (1SE), and Ca flux (mmol/d, FCa) of the subjects from the head-down-tilt bed rest study.
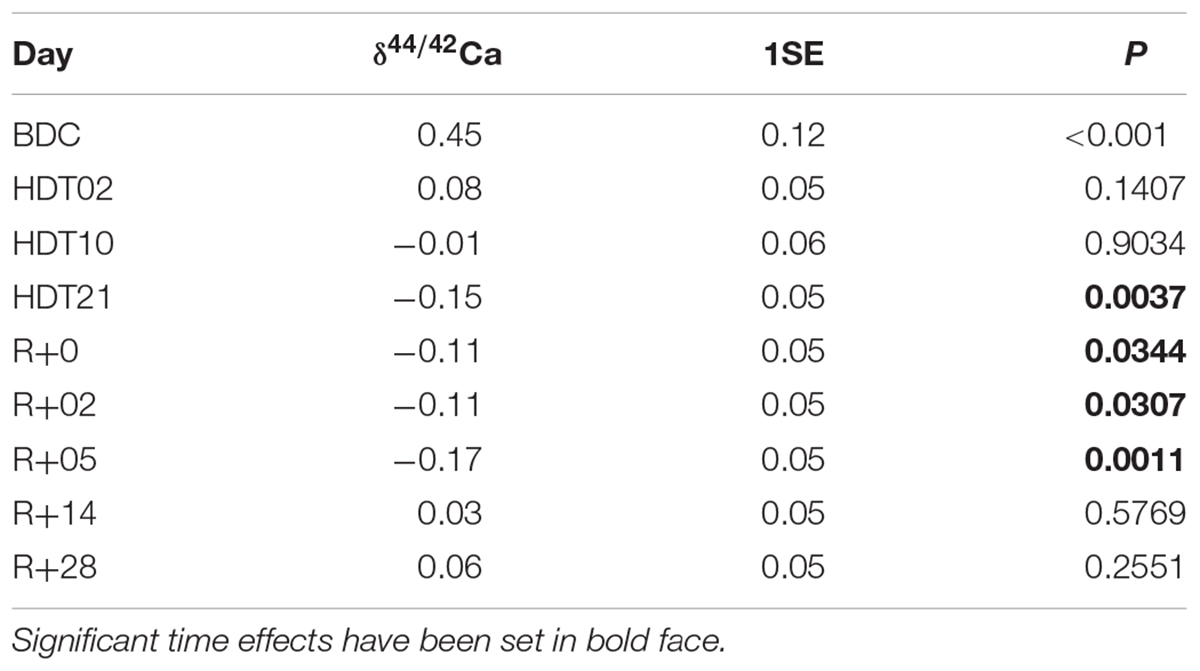
Table 2. Best linear unbiased predictors (and their standard errors) as obtained from the linear mixed effect model, and the P-levels for the a priori contrasts.
δ44/42Caurine values cover a wide range from +1.2‰ (subject C, HDT2) to -0.1‰ (subject A, HDT21) (cf. Figure 1). The dataset shows two remarkable features: (1) huge inter-individual differences of up to 0.8‰ exist in δ44/42Caurine (Figure 2) and these differences stay nearly constant throughout the study; (2) statistical testing (Table 2) shows that the secular variation in δ44/42Ca is statistically significant (P < 0.001). The initial δ44/42Ca at the start of the treatment period was 0.45 ± 0.12 (1SE) at BDC; this decreased systematically by 0.15 ± 0.05 (1SE) on HDT21 (P = 0.004), by 0.11 ± 0.05 (1SE) on R + 0 (P = 0.034), by 0.1711 ± 0.05 (1SE) on R + 2 (P = 0.031), and by 0.17 ± 0.05 on day R + 5 (P = 0.0011). Notably, no statistically significant change was observed on day HDT2 (P = 0.14) or on day HDT10 (P = 0.90).
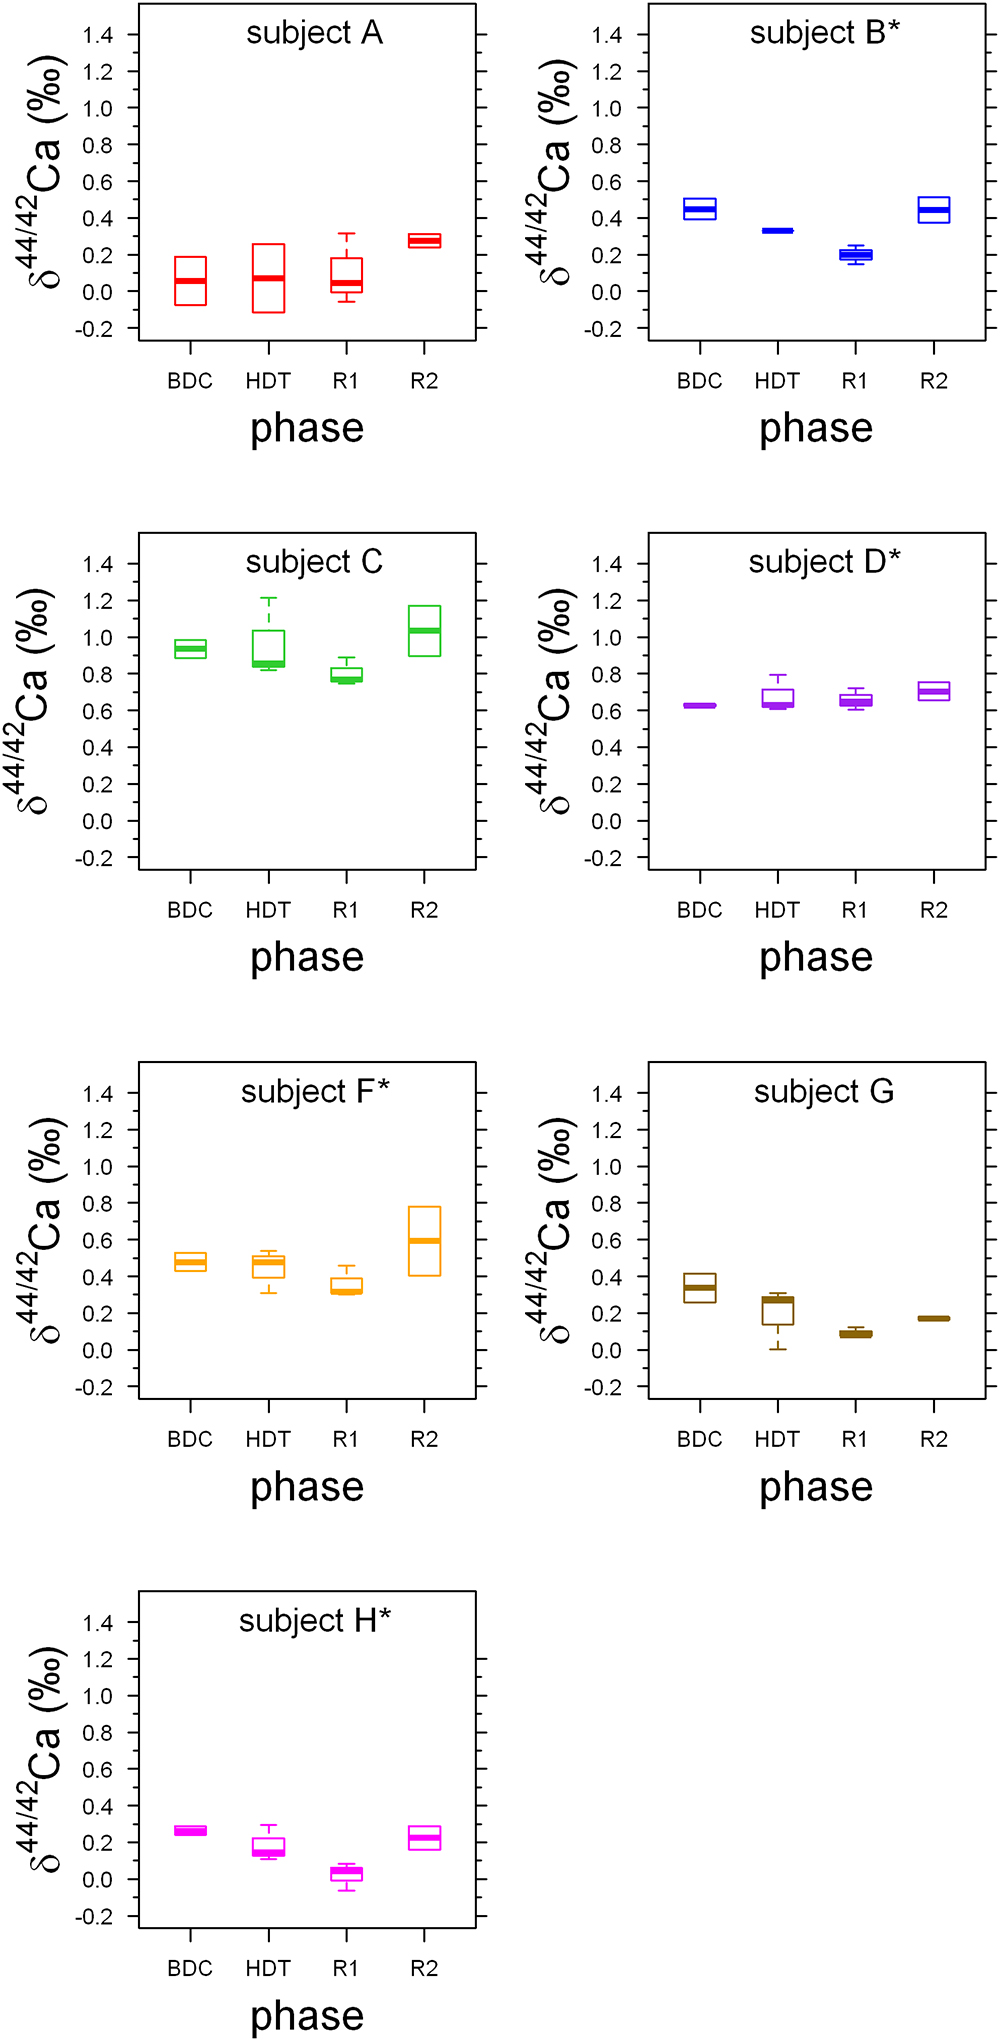
Figure 1. Boxplots of δ44/42Caurine values for each phase for the seven subjects A to H. Stars indicate subjects with KHCO3 supplementation. Phases are: BDC: pre-bed rest baseline data collection (BDC-6 and BDC-2), HDT: head down tilt bed rest (HDT2, HDT10, and HDT21), R1: post bed rest recovery (R + 0, R + 2, and R + 5) and R2: outpatient regeneration (follow-up examination; R + 14 and R + 28).
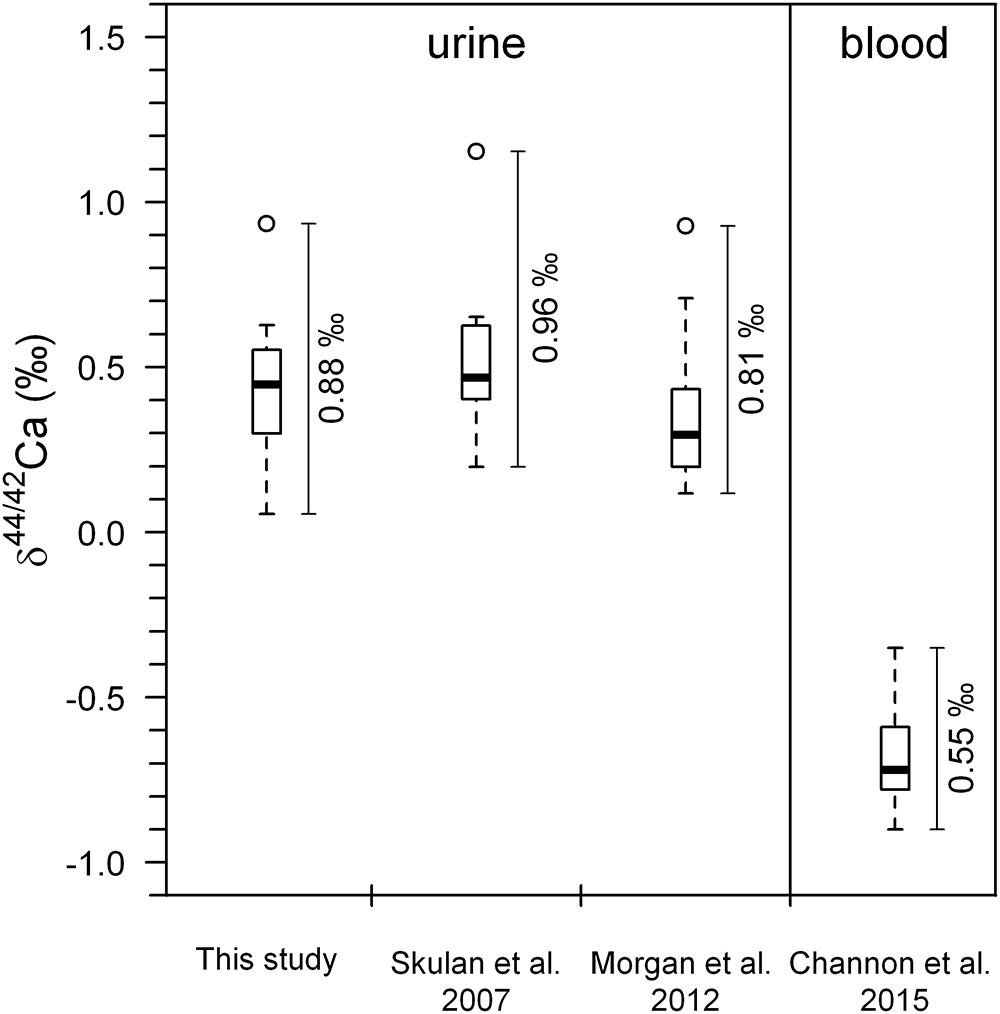
Figure 2. Boxplots of Ca isotopes showing pre-bed rest data (BDC) for all subjects combined from this study (n = 7), along with the studies of Skulan et al. (2007) (n = 9), Morgan et al. (2012) (n = 12), and Channon et al. (2015) (n = 12). Data from Channon et al. (2015) and Morgan et al. (2012) were obtained from identical subjects in the same bed rest study. Open circles represent statistical outliers. The span (max–min) in the δ44/42Caurine values is higher than the observed span in δ44/42Cablood values. The data from Skulan et al. (2007) have been recalculated from the original δ44/40Ca values. All literature data have been converted to conform to NIST SRM-915a reference material (see Section 3.2).
Discussion
Individuality of Ca Metabolism
Boxplots of the δ44/42Caurine for each of the subjects A to H (Figure 1) show that the urinary Ca isotopic compositions during pre-bed rest BDC span a wide range and are different for most of the subjects. The maximum difference of about 0.8‰ is observed between subjects A and C. Such huge inter-individual Ca isotope differences have been observed previously for urine and blood samples from other bed rest studies (Skulan et al., 2007; Morgan et al., 2012; Channon et al., 2015) as well as in archeological bones (Reynard et al., 2010). Figure 2 shows a comparison of the observed inter-individual ranges in δ44/42Caurine and δ44/42Cablood. The span of δ44/42Caurine in our dataset is the same order of magnitude as that already reported in the literature (Skulan et al., 2007; Morgan et al., 2012).
In their pilot study, Heuser and Eisenhauer (2010) analyzed δ44/40Caurine of a 63-year-old woman suffering from osteoporosis and a 4-year-old healthy boy. A difference of 1.1‰ in δ44/40Ca (0.55‰ in δ44/42Ca) was observed between their average urinary Ca isotopic compositions. This offset was attributed to differences in the net bone balance of the two subjects. While the woman had a negative bone balance (loss > gain) the opposite was true for the boy. It can be assumed that the subjects A to H of this bed rest study are not very different in their pre-bed rest net bone balance. Thus, it is unlikely that net bone balance could be the main cause of the inter-individual differences in δ44/42Ca observed in Figure 1.
The principal finding of this study is that δ44/42Ca is systematically lowered during bed rest. However, this lowering is occurring with a time delay of 10 to 21 days. After re-ambulation, δ44/42Ca returns back to baseline values again, after a time delay of 6 to 14 days. Similar time delays have been observed for biochemical markers of bone resorption at the onset and termination of bed rest (Armbrecht et al., 2010) Furthermore, bone mineral content of the tibia decreases for another 10 to 20 days after re-ambulation following bed rest (Rittweger et al., 2010) and after unilateral limb suspension (Rittweger et al., 2006).
Based upon the Ca isotope dataset of our study, we can establish that time delays in the bone’s response to disuse and re-ambulation are present on the levels of: (1) the organic matrix turn-over, (2) calcium trafficking between body fluids and bone, and (3) the anatomical bone structure. As hypothesized by Rittweger et al. (2016), we propose that differentiation and migration of osteoclast precursors and of osteoblasts provide the most likely explanation for the time delays observed. If so, this would imply that determination of bone precursor cells may be a more potent driver of bone’s mechanical adaptation than modulation of existing bone cells.
One also needs to consider that differences in dietary Ca isotopic composition (δ44/42Cadiet) could be the origin of the observed differences in the δ44/42Caurine. But since all test persons received a similar diet, inter-subject differences caused by δ44/42Cadiet should decrease during the course of our study. However, this is not observed (cf. Table 1); rather, the inter-individual differences stay nearly constant during the whole study period. In addition, it has been shown that the Ca isotopic composition of a diet that is dominated by dairy products (Chu et al., 2006; Heuser and Eisenhauer, 2010; Heuser, 2016) does not vary as much as the 0.8‰ range observed in our study. In summary, δ44/42Cadiet probably accounts for only a minor portion of the observed inter-individual differences of δ44/42Caurine.
The observed differences in average pre-bed rest δ44/42Caurine are also not correlated to age (r2 = 0.11, P = 0.858), weight (r2 = 0.21, P = 0.295), body height (r2 = 0.11, P = 0.467) or the BMI (r2 = 0.26, P = 0.239) of the subjects (Figure 3).
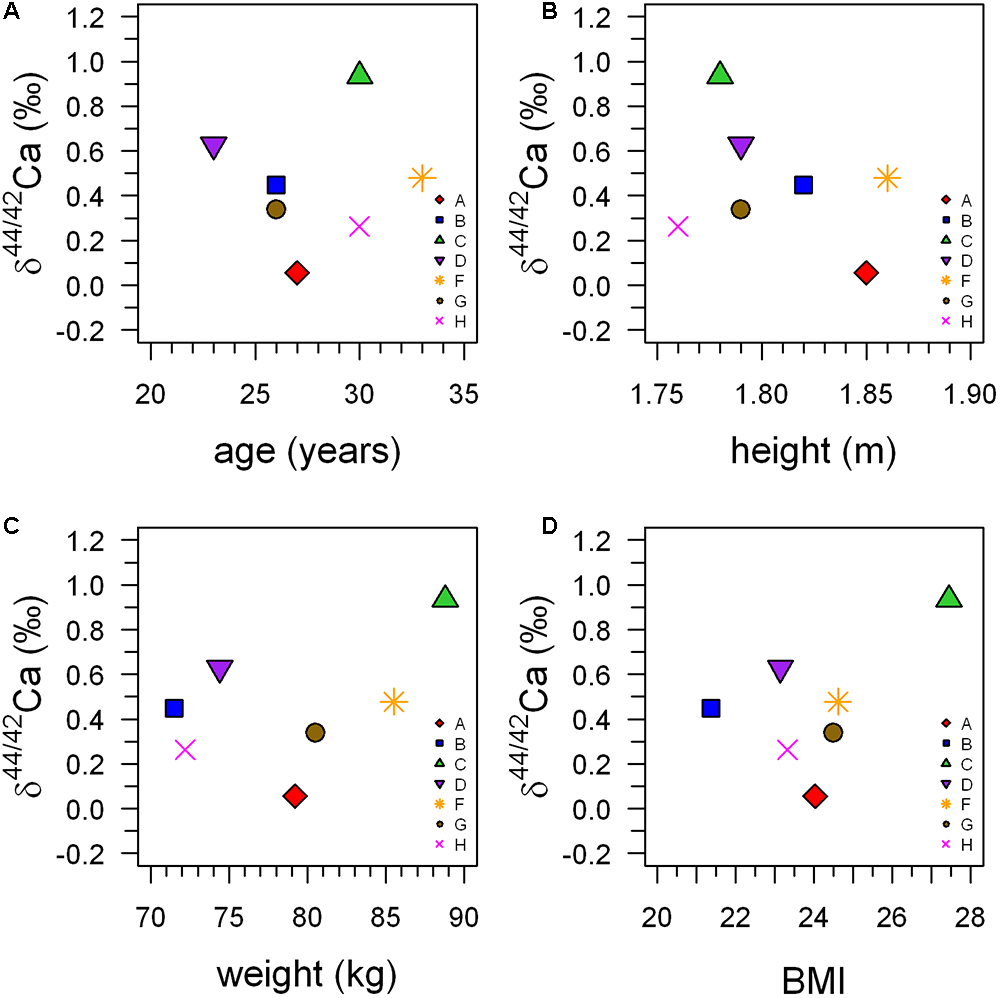
Figure 3. Average δ44/42Caurine during the pre-bed rest phase (BDC-6 and BDC-2) plotted against age (A), size (B), weight (C), and body mass index (BMI) (D) of the subjects. This illustrates that there are no statistically significant correlations between δ44/42Caurine and any of the anthropometric parameters.
It is possible to calculate δ44/42Caurine using a Rayleigh-type fractionation model (Heuser and Eisenhauer, 2010):
where α is the fractionation factor between primary and secondary urine, δ44/42Cablood is the input Ca isotopic composition of the blood and fexcreted is the percentage of Ca not reabsorbed in the kidneys, that is collected in the bladder and then excreted. The fractionation factor α is a measure for the amount of isotopic fractionation in an exchange reaction. Assuming the same fractionation factor α between subjects it can be seen from Equation (2) that differences in fexcreted between subjects have a major influence on δ44/42Caurine and should also be reflected in the amount of Ca excreted via urine. In particular, the more Ca that is reabsorbed from primary urine, the less total Ca that will be excreted, and the higher the δ44/42Caurine becomes. This can be tested since differences in the fraction of Ca being reabsorbed in the kidneys between subjects should be reflected in the amount of Ca excreted via the urine.
Indeed, a significant correlation (r2 = 0.93, P < 0.001) does exist between δ44/42Caurine and total excreted Ca (mmol/24 h), as can be seen in Figure 4. This correlation suggests that variable individual renal Ca reabsorption is the main cause of the observed inter-individual differences in δ44/42Caurine.
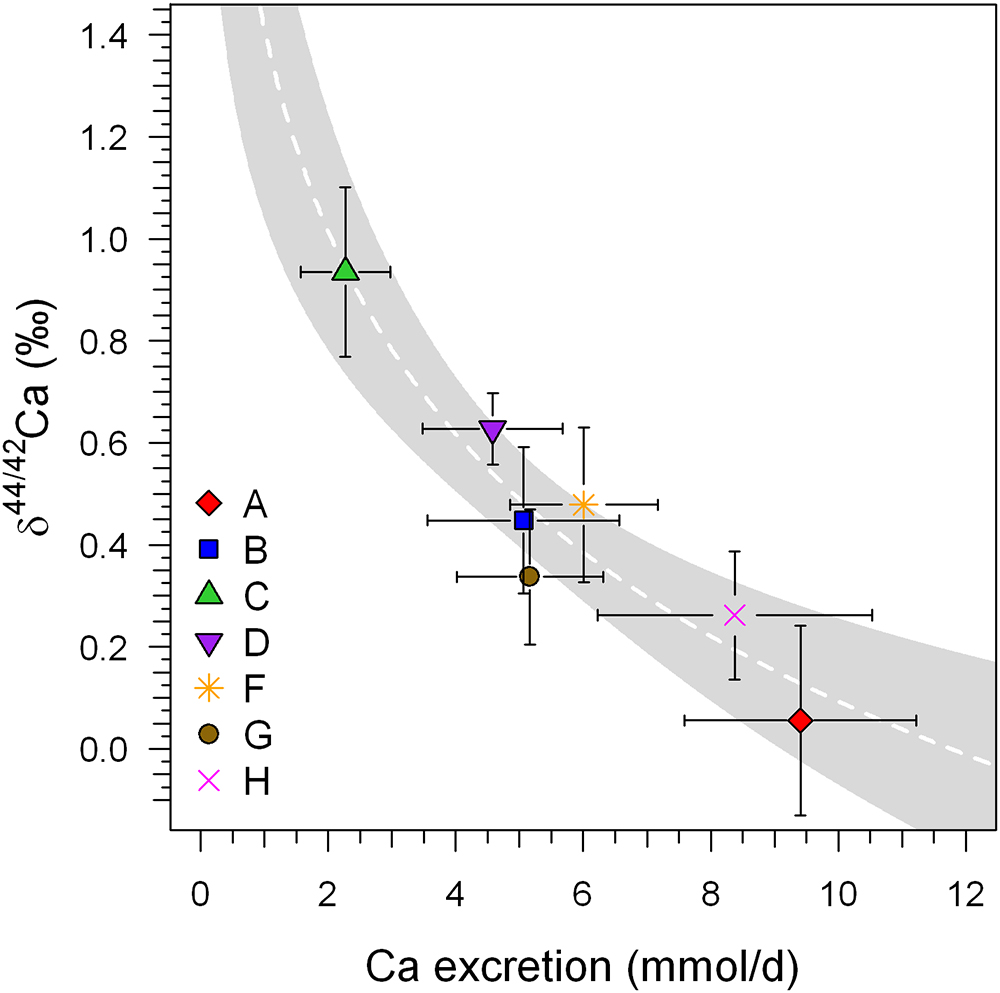
Figure 4. Mean δ44/42Caurine (±1SD) of the BDC (BDC-6 and BDC-2) phase of each subject plotted against the average excreted Ca per 24 h (±1SD). A significant logarithmic correlation exists that is statistically significant (r2 = 0.884, P < 0.001; white dashed line). Such a correlation is typical for Rayleigh-type fractionation such as might be expected during generation of secondary urine in the kidneys. These data were collected before and after the head-down-tilt bed rest period. The gray shaded area represents the 95% confidence band of the logarithmic regression trend.
Furthermore, the amount of renal Ca reabsorption is not directly linked to dietary Ca input. The dietary Ca intake between all test persons varied by a factor of 1.2, being only slightly lower than the amounts of individual excreted Ca (factors of 1.3 to 2.3). The differences in the excreted urinary Ca between the subjects varied by, on average, a factor of 4.3 ± 1.3 (1SD). This pattern of higher differences between subjects compared to differences over the course of study for an individual can also be observed in the δ44/42Caurine dataset, which shows smaller intra-individual variation than inter-individual differences.
A change in the fractionation factor during renal Ca reabsorption cannot be excluded. Such a fractionation factor change might plausibly be linked to the amount of cells being involved during transcellular and paracellular transport of Ca in the kidneys, which is ultimately controlled by different hormones (e.g., Mundy and Guise, 1999; Hoenderop et al., 2005; Peacock, 2010). Such a scenario might also change the fraction of Ca reabsorbed, with both effects combining and amplifying the net extent of Ca isotope fractionation in the urine.
Response of δ44/42Caurine to Bed Rest
In general, δ44/42Caurine decreases during the bed rest phase (Figure 5). This change in δ44/42Caurine is fully in accord with isotopically “light” Ca being released from bones during bone resorption and, indeed, the changes during bed rest in our study match those reported in the literature (Skulan et al., 2007; Morgan et al., 2012; Channon et al., 2015; see Figure 6). We found a change, on average, of about -0.15‰ over the time of bed rest, while Skulan et al. (2007) reported a change of -0.48‰ (control group, 17 weeks of bed rest) and, similarly, Morgan et al. (2012) found -0.2‰ (4 weeks of bed rest). The differences in δ44/42Caurine shifts during bed rest periods observed between studies can most likely be attributed to the different length of the bed rest phase in each case.
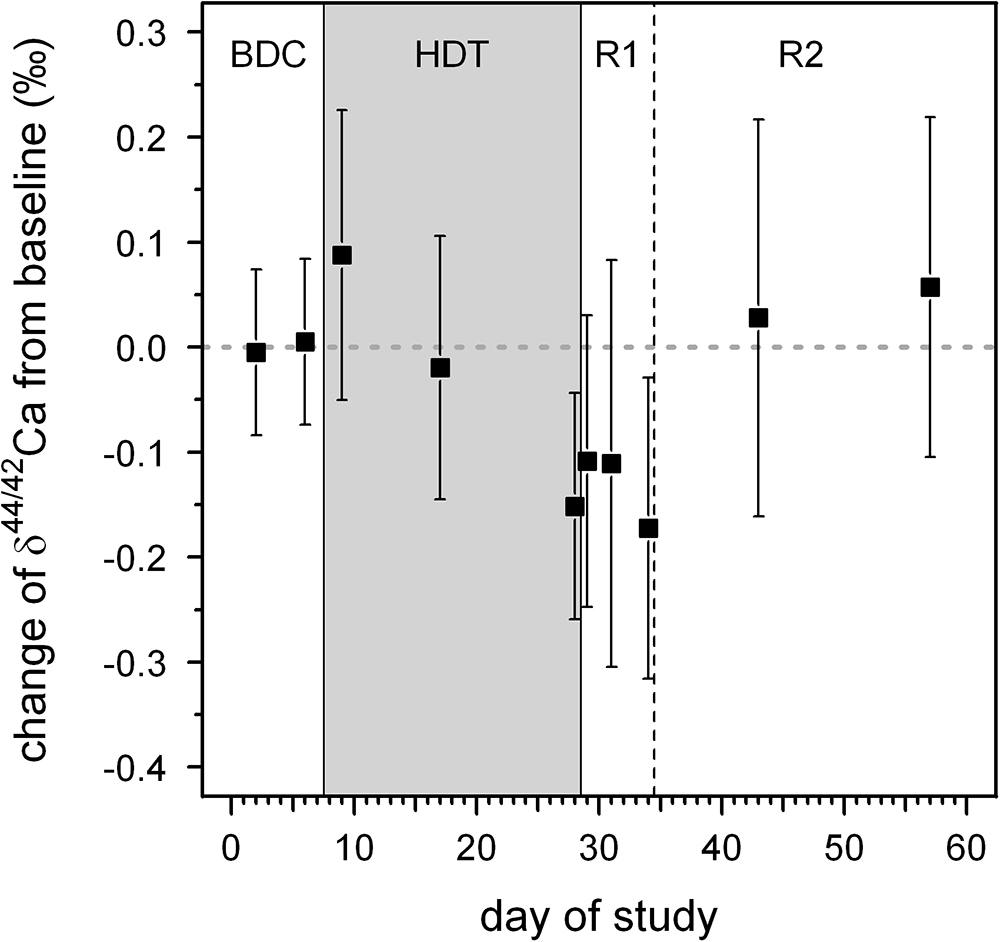
Figure 5. Average changes in δ44/42Ca from baseline values for all subjects as a function of day during our bed rest study. The baseline value is represented by the average δ44/42Ca of all subjects during the BDC period (BDC-6 and BDC-2). The phases of the study are: BDC: pre-bed rest baseline data collection, HDT: head-down-tilt bed rest, R1: inpatient regeneration and R2: outpatient regeneration (follow-up examinations).
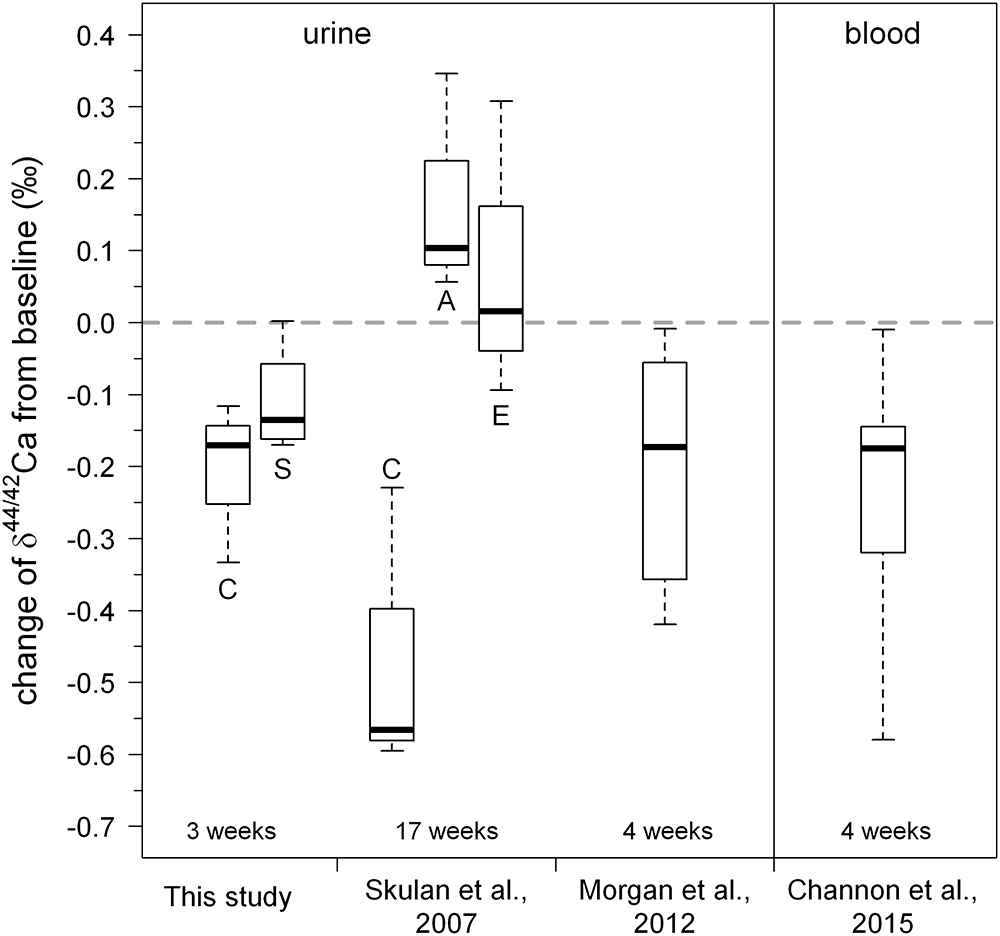
Figure 6. Boxplot of changes in urinary Ca isotopic composition obtained during our study. For comparison, the data of Skulan et al. (2007); Morgan et al. (2012), and Channon et al. (2015) are also shown. Overall, the changes observed in the study are in good agreement with those found in previous studies. A small but statistically insignificant difference between the control group (C) and the KHCO3 supplemented group (S) can be seen. Letters for the Skulan et al. dataset correspond to: (C) control group, (E) exercise group, and (A) alendronate supplemented group.
Our Ca isotope dataset shows a small difference between the group of subjects with and without supplement of potassium bicarbonate (KHCO3), although this is statistically not significant (Figure 6). Specifically, the mean change of δ44/42Caurine from baseline is -0.21‰ for subjects without KHCO3 supplement, while it is -0.11‰ for those who took the supplement.
Up to now, changes in δ44/42Caurine have been interpreted to be the consequence of bone resorption only. Support for this explanation comes from (1) the data of Channon et al. (2015) who, like in the present study, found a decrease in δ44/42Cablood during bed rest, and (2) from Skulan et al. (2007) who reported a correlation between δ44/42Caurine and changes in conventional serum biomarkers for bone resorption. Other physiological effects during bed rest that might lead to changes in δ44/42Caurine have not yet been fully investigated, however.
For example, assuming a constant amount of Ca transported from the intestine into blood along with prolonged bone resorption during bed rest, the Ca concentration in blood must increase and will be regulated by an increase in overall Ca excretion. But, in order to increase Ca excretion, the fraction of Ca that is reabsorbed in the kidneys (f) must decrease. In terms of Ca fractionation this will result in lower δ44/42Caurine as increased amounts of Ca are being excreted (cf. Figure 4). A decrease in the fraction of Ca being reabsorbed from 98 to 97% would cause a lowering of δ44/42Caurine by about -0.1‰. Thus, the shift in δ44/42Caurine during the bed rest phase can be explained by either the addition of isotopically “light” Ca from bones to the blood or, alternatively, by a change in the renal Ca excretion factor (f) or, more probably, the combined effect of both.
The observed inter-individual differences in δ44/42Caurine and corresponding δ44/42Cablood from the studies of Morgan et al. (2012) and Channon et al. (2015), respectively, support a changing excretion factor (f) during bed rest. While the inter-individual differences (max δ44/42Ca–min δ44/42Ca) are about 0.85‰ for δ44/42Caurine at the end of the bed rest phase, the reported shift in δ44/42Cablood is smaller (0.46‰).
On the other hand, an increase in the concentration of free Ca in the blood triggers a serum parathyroid hormone (PTH) concentration decrease (Mundy and Guise, 1999). Consequently, the decrease of PTH concentration then results in a decrease in intestinal Ca absorption and a lowered renal Ca reabsorption (Mundy and Guise, 1999).
Comparison of δ44/42Caurine With NTX
Serum NTX (n-telopeptide cross-links) is a frequently used biochemical marker for bone resorption (e.g., Iba et al., 2008). Skulan et al. (2007) reported changes in NTX alongside δ44/42Caurine in their samples. At first glance their data suggests a correlation between NTX and δ44/42Caurine since mean δ44/42Caurine decreases during bed rest as mean NTX increases. This qualitative correlation suggests that changes in δ44/42Caurine during bed rest are linked to increased bone resorption. Such a qualitative correlation between δ44/42Caurine and changes in NTX is also seen in our dataset. Relative to pre-bed rest values, the mean change in δ44/42Caurine post-bed rest is -0.10‰ while the corresponding change in NTX is 393 (nmol/d). But a closer look at the pooled data shows that there is in fact no statistically significant correlation between δ44/42Caurine and NTX (Figure 7; P > 0.99), nor for any of the subjects individually (cf. Table 2).
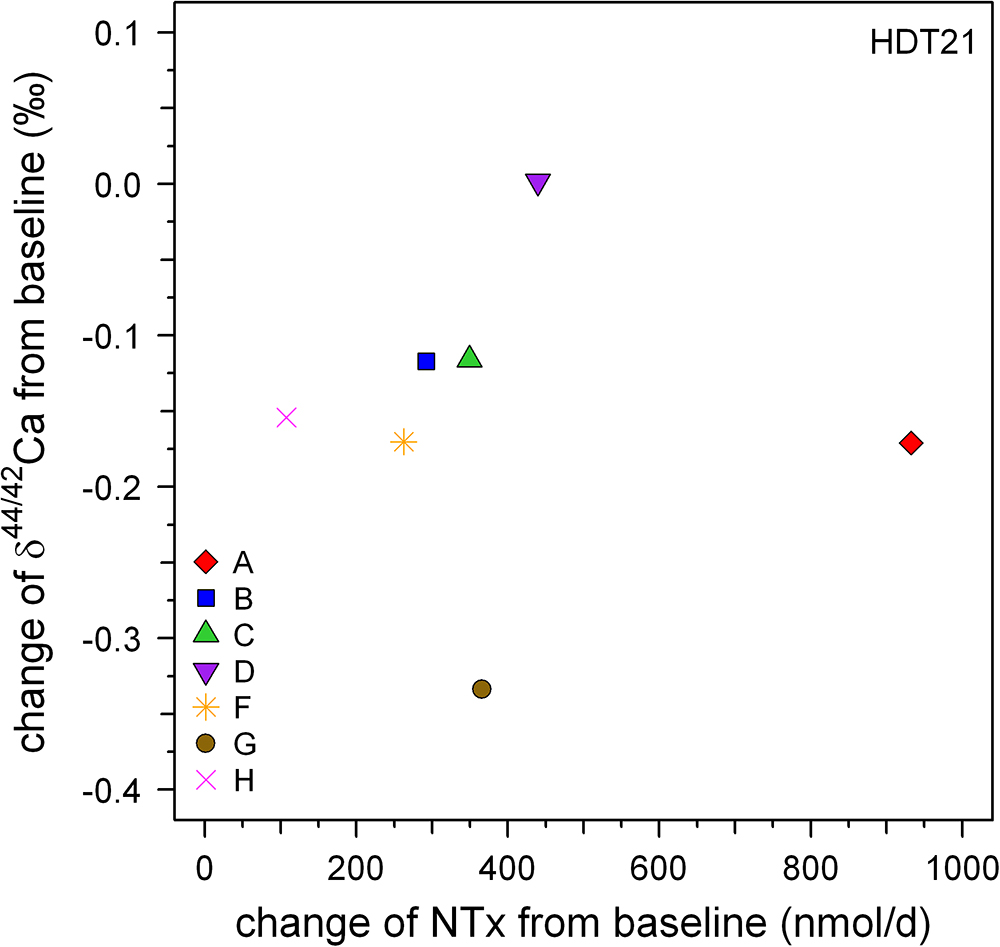
Figure 7. Plot of changes in Ca isotopic composition versus those in NTX excretion, both from relative to baseline at the end of the bed rest phase (HDT21). Qualitatively, both biomarkers show bone loss but there is no strong correlation evident between them.
A Promising New Baseline Approach
Based on our data and those from previous studies, bone loss cannot be detected unambiguously using δ44/42Caurine if the (steady state) pre-bone-loss baseline δ44/42Caurine of the patient is unknown. This hampers the easy application of δ44/42Caurine as a diagnostic tool for detecting disease related to bone loss, such as osteoporosis. Here, the main problem seem to be in the unknown amount of Ca being reabsorbed in the kidneys for each patient. But on the other hand, using δ44/42Caurine it should still be possible to monitor the success of an on-going osteoporosis therapy aimed at reducing bone resorption.
In order to overcome this problem we propose a new baseline approach intended to reduce the unknown renal Ca absorption effect on δ44/42Caurine. In a log-log plot of 44Ca/42Caurine versus the amount of excreted Ca per day (Figure 8) two different negatively sloped trends can be seen, for the adaption (BDC) and bed rest (R + 0, R + 2, R + 5) phase. The BDC samples follow a linear trend (r2 = 0.780, P < 0.001) with a slope of -5.38 × 10⁻⁴ and a y-axis intercept of 1.177, while the bed rest samples linear trend (r2 = 0.790, P < 0.001) has a slope of -5.43 × 10⁻⁴ and y-axis intercept of 1.176. Although both trends are not strictly parallel to one another, they remain basically parallel within the range of excreted Ca measured. The offset between the two trends seen in Figure 8 indicates that the Ca isotopic composition for any given Ca excretion rate is always isotopically “lighter” at the end of the bed rest relative to the BDC baseline.
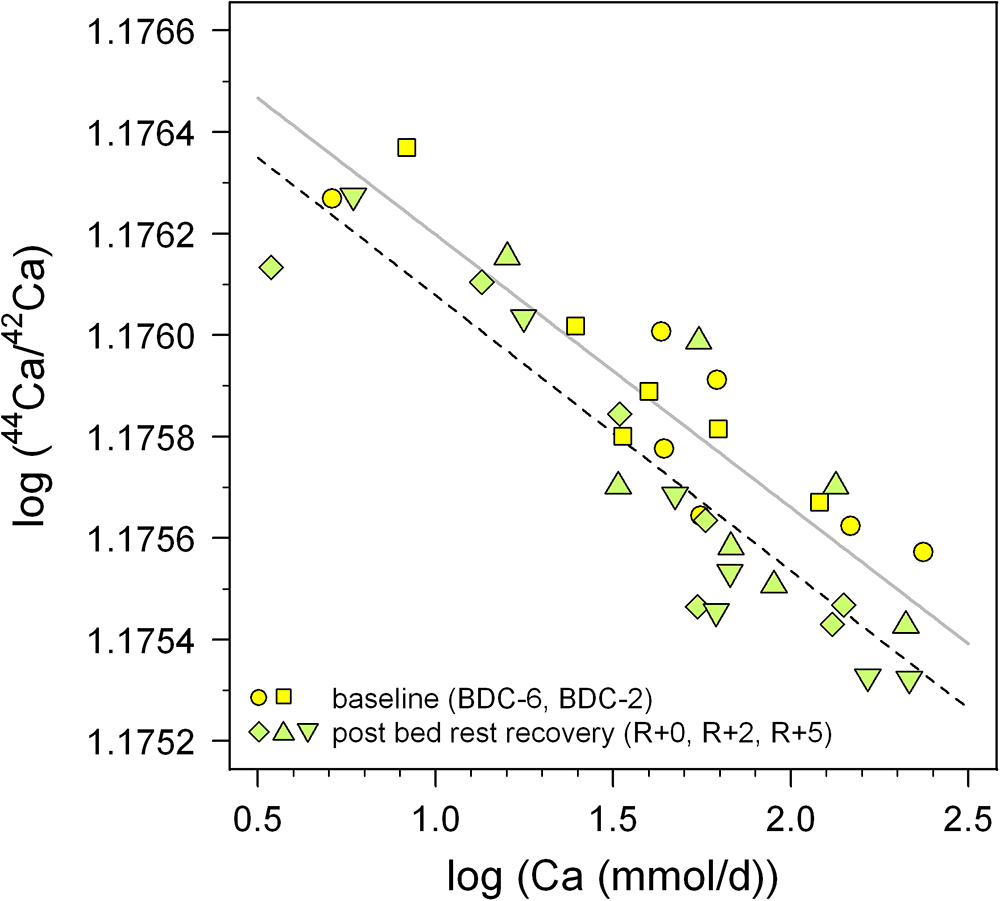
Figure 8. Log-log plot of 44Ca/42Ca in urine versus daily-excreted Ca (mmol/d) for the pre-bed rest BDC data (BDC-6 and BDC-2, yellow squares) and directly after the bed rest phase (R + 0, R + 2, and R + 5, green diamonds). Both sets of data show negative correlations with trend lines indicated (BDC, gray; R + 0, black dashed), with the after bed rest data shifted systematically toward lower 44Ca/42Ca, i.e., more negative δ44/42Ca. This vertical offset likely reflects bone loss during bed rest independent of changes arising from variable renal Ca reabsorption in the kidneys.
Thus, we suggest that a combined measurement of daily Ca excretion rate as well as δ44/42Caurine may be sufficient to implicate patient bone resorption, if the data lie below the BDC trend when plotted in Figure 8. For the time being, this inference must be considered tentative, pending better definition of the BDC line in Figure 8 from future studies; this can be done relatively easily, however, since it just involves measurement of these two parameters in healthy individuals whose Ca balance is at steady state.
We used the R1 data here, as they should be the most affected by the bed rest phase. Based on Figure 6 it seems justified to assume that the shift from the baseline trend would be even more pronounced during longer periods of bed rest. Figure 6 also shows a small but not significant difference between the control group (C) and the supplemented group (S). While the control group defines a linear trend shifted parallel toward lower δ44/42Ca, the supplemented group defines a trend with a lower slope and higher y-axis intercept. Currently, we do not have a good explanation for this – it might be related to the supplement of KHCO3 but may also be simply a statistical artifact due to the limited number of subjects in each group (nC = 3, nS = 4).
One should keep in mind that the data currently available, here and elsewhere, are far too few in number to define a statistically meaningful BDC δ44/42Caurine versus excreted Ca rate baseline. Nevertheless, it does reveal a promising way for canceling out the patient-specific effects of renal Ca reabsorption on measured δ44/42Caurine. In order to assess whether such a common BDC baseline approach actually works, many more data will be needed. Furthermore, the influence of dietary Ca isotopic composition on δ44/42Caurine and other potential fractionation mechanisms in the body have to be better understood, and represent significant gaps in our present knowledge that must be addressed in future studies.
Summary and Conclusion
We present time series of Ca isotopic compositions in urine from seven individuals participating in a 21-day bed rest study. Our results document systematic temporal variations in the isotopic composition of excreted calcium. As bed rest progresses, the Ca isotopic composition of urine is shifted toward “lighter” values compared to pre-bed rest compositions. This can be explained by an increased flux of isotopically light Ca entering the blood from bone dissolution, and thus these shifts may be a useful indicator of bone loss. Statistical analyses of the data show a time delay of 14 to 21 days before the shifts in urine Ca isotopic composition become apparent. This finding is consistent with time delays observed in biochemical markers of bone’s organic matrix, as well as in bone densitometric measurements.
The data show huge differences in δ44/42Caurine between individuals of up to 0.8‰. These differences are most likely caused by each subject’s unique Ca metabolism, and especially the percentage of Ca being reabsorbed in the kidneys. Small differences in the renal Ca reabsorption rate can easily explain the magnitude of the observed inter-individual δ44/42Caurine shifts. The fact that the amounts of Ca excreted daily are well correlated with δ44/42Caurine implicates renal Ca reabsorption rate as the cause of these differences.
The individuality in Ca metabolism hampers the use of δ44/42Caurine in a straightforward manner for determining net bone mineral balance or detecting disorders in Ca metabolism. This problem can be overcome if a δ44/42Caurine baseline can be determined for the individual prior to bone loss. Then, changes in δ44/42Caurine from the baseline can be directly related to the net bone mineral balance and/or Ca metabolism.
An extremely important finding is that the data on all seven subjects, taken together, show a strong correlation between the total amount of excreted Ca and Ca isotopic composition of urine. We observe that δ44/42Caurine is lower during the bed rest phase compared to pre-bed rest phase δ44/42Caurine for an identical amount of excreted Ca. This suggests that it may be possible to use data on δ44/42Caurine and amounts of urinary Ca excreted from healthy persons to construct a normal bone balance baseline for the general population. In this case, offsets from the baseline would be diagnostic of disorders in Ca metabolism; in particular, individuals with net bone loss would be expected to exhibit lower δ44/42Caurine for a given amount of excreted Ca relative to the baseline.
Data Availability
The datasets generated for this study are available on request to the corresponding author.
Author Contributions
AH conducted the chemical preparation of the samples, did the mass spectrometry work, and wrote the first version of the manuscript. PF-M did the sample collection and contributed to the methods section of the paper. JR contributed to the discussions section and did the statistical analysis of the time delays. SG conceived the mass spectrometry, calibrated the double spike, performed the Ca isotopes data reduction, contributed to the discussion section, and did linguistic revisions of the manuscript.
Funding
The NUC study was funded by ESA as part of the “Microgravity Applications Programme” (contract number: 21381/08/NL/VJ). This study was funded by the German Aerospace Center (DLR cost object 2475 101) and the Max Planck Society.
Conflict of Interest Statement
The authors declare that the research was conducted in the absence of any commercial or financial relationships that could be construed as a potential conflict of interest.
Acknowledgments
We thank Ingrid Raczek, Gerlinde Borngässer, and Heinz Feldmann for their support in the clean lab and at the mass spectrometer. We are also indebted to the subjects who volunteered – without whom this study would never have come to fruition. We also thank the reviewers and editor for their helpful and constructive comments.
Footnote
References
Armbrecht, G., Belavy, D. L., Gast, U., Bongrazio, M., Touby, F., Beller, G., et al. (2010). Resistive vibration exercise attenuates bone and muscle atrophy in 56 days of bed rest: biochemical markers of bone metabolism. Osteoporos. Int. 21, 597–607. doi: 10.1007/s00198-009-0985-z
Bleeker, M. W. P., Hopman, M. T. E., Rongen, G. A., and Smits, P. (2004). Unilateral lower limb suspension can cause deep venous thrombosis. Am. J. Physiol. Regul. Integr. Comp. Physiol. 286, R1176–R1177. doi: 10.1152/ajpregu.00718.2003
Channon, M. B., Gordon, G. W., Morgan, J. L. L., Skulan, J. L., Smith, S. M., and Anbar, A. D. (2015). Using natural, stable calcium isotopes of human blood to detect and monitor changes in bone mineral balance. Bone 77, 69–74. doi: 10.1016/j.bone.2015.04.023
Chu, N.-C., Henderson, G. M., Belshaw, N. S., and Hedges, R. E. M. (2006). Establishing the potential of Ca isotopes as proxy for consumption of dairy products. Appl. Geochem. 21, 1656–1667. doi: 10.1016/j.apgeochem.2006.07.003
Coplen, T. B. (2011). Guidelines and recommended terms for expression of stable-isotope-ratio and gas-ratio measurement results. Rapid Commun. Mass Spectrom. 25, 2538–2560. doi: 10.1002/rcm.5129
Eisenhauer, A., Nägler, T. F., Stille, P., Kramers, J., Gussone, N., Bock, B., et al. (2004). Proposal for an International Agreement on Ca Notation as Result of the Discussions from the workshops on Stable Isotope Measurements in Davos (Goldschmidt 2002) and Nice (EGS-AGU-EUG 2003). Geostand. Geoanal. Res. 28, 149–151. doi: 10.1111/j.1751-908X.2004.tb01051.x
Gordon, G. W., Monge, J., Channon, M. B., Wu, Q., Skulan, J. L., Anbar, A. D., et al. (2014). Predicting multiple myeloma disease activity by analyzing natural calcium isotopic composition. Leukemia 28, 2112–2115. doi: 10.1038/leu.2014.193
Heuser, A. (2016). “Biomedical application of Ca stable isotopes,” in Calcium Stable Isotope Geochemistry, eds N. Gussone, A.-D. Schmitt, A. Heuser, F. Wombacher, M. Dietzel, E. T. Tipper (Berlin: Springer), 247–260. doi: 10.1007/978-3-540-68953-9_8
Heuser, A., and Eisenhauer, A. (2010). A pilot study on the use of natural calcium isotope (44Ca/40Ca) fractionation in urine as a proxy for the human body calcium balance. Bone 46, 889–896. doi: 10.1016/j.bone.2009.11.037
Heuser, A., Eisenhauer, A., Gussone, N., Bock, B., Hansen, B. T., and Nägler, T. F. (2002). Measurement of calcium isotopes (δ44Ca) using a multicollector TIMS technique. Int. J. Mass Spectrom. 220, 387–399. doi: 10.1016/S1387-3806(02)00838-2
Heuser, A., Schmitt, A.-D., Gussone, N., and Wombacher, F. (2016). “Analytical methods,” in Calcium Stable Isotope Geochemistry, eds N. Gussone, A.-D. Schmitt, A. Heuser, F. Wombacher, M. Dietzel, E. T. Tipper (Berlin: Springer), 23–73. doi: 10.1007/978-3-540-68953-9_2
Hoenderop, J. G. J., Nilius, B., and Bindels, R. J. M. (2005). Calcium Absorption across epithelia. Physiol. Rev. 85, 373–422. doi: 10.1152/physrev.00003.2004
Iba, K., Takada, J., Hatakeyama, N., Ozasa, Y., Wada, T., and Yamashita, T. (2008). Changes in urinary NTX levels in patients with primary osteoporosis undergoing long-term bisphosphonate treatment. J. Orthop. Sci. 13, 438–441. doi: 10.1007/s00776-008-1265-z
Morgan, J. L. L., Skulan, J. L., Gordon, G. W., Romaniello, S. J., Smith, S. M., and Anbar, A. D. (2012). Rapidly assessing changes in bone mineral balance using natural stable calcium isotopes. Proc. Nat. Acad. Sci. U.S.A. 109, 9989–9994. doi: 10.1073/pnas.1119587109
Mundy, G. R., and Guise, T. A. (1999). Hormonal control of calcium homeostasis. Clin. Chem. 45, 1347–1352.
Peacock, M. (2010). Calcium metabolism in health and disease. Clin. J. Am. Soc. Nephrol. 5, S23–S30. doi: 10.2215/CJN.05910809
Reynard, L. M., Henderson, G. M., and Hedges, R. E. M. (2010). Calcium Isotope ratios in animal and human bone. Geochim. Cosmochim. Acta 74, 3735–3750. doi: 10.1016/j.gca.2010.04.002
Rittweger, J., Beller, G., Armbrecht, G., Mulder, E., Buehring, B., Gast, U., et al. (2010). Prevention of bone loss during 56 days of strict bed rest by side-alternating resistive vibration exercise. Bone 46, 137–147. doi: 10.1016/j.bone.2009.08.051
Rittweger, J., Debevec, T., Frings-Meuthen, P., Lau, P., Mittag, U., Ganse, B., et al. (2016). On the combined effects of normobaric hypoxia and bed rest upon bone and mineral metabolism: results from the PlanHab study. Bone 91, 130–138. doi: 10.1016/j.bone.2016.07.013
Rittweger, J., Winwood, K., Seynnes, O., de Boer, M., Wilks, D., Lea, R., et al. (2006). Bone loss from the human distal tibia epiphysis during 24 days of unilateral lower limb suspension. J. Physiol. 577, 331–337. doi: 10.1113/jphysiol.2006.115782
Skulan, J. L., Bullen, T. D., Anbar, A. D., Puzas, J. E., Shackelford, L. C., LeBlanc, A., et al. (2007). Natural Calcium isotopic composition of urine as a marker of bone mineral balance. Clin. Chem. 53, 1155–1158. doi: 10.1373/clinchem.2006.080143
Skulan, J. L., and DePaolo, D. J. (1999). Calcium isotope fractionation between soft and mineralized tissues as a monitor of calcium use in vertebrates. Proc. Nat. Acad. Sci. U.S.A. 96, 13709–13713. doi: 10.1073/pnas.96.24.13709
Keywords: calcium isotopes, urine, renal Ca reabsorption, Ca metabolism, bone loss, bed rest
Citation: Heuser A, Frings-Meuthen P, Rittweger J and Galer SJG (2019) Calcium Isotopes in Human Urine as a Diagnostic Tool for Bone Loss: Additional Evidence for Time Delays in Bone Response to Experimental Bed Rest. Front. Physiol. 10:12. doi: 10.3389/fphys.2019.00012
Received: 23 October 2018; Accepted: 08 January 2019;
Published: 25 January 2019.
Edited by:
Costantino Balestra, Haute École Bruxelles-Brabant (HE2B), BelgiumReviewed by:
Rahul Goel, Baylor College of Medicine, United StatesSergey Ponomarev, Institute of Biomedical Problems (RAS), Russia
Copyright © 2019 Heuser, Frings-Meuthen, Rittweger and Galer. This is an open-access article distributed under the terms of the Creative Commons Attribution License (CC BY). The use, distribution or reproduction in other forums is permitted, provided the original author(s) and the copyright owner(s) are credited and that the original publication in this journal is cited, in accordance with accepted academic practice. No use, distribution or reproduction is permitted which does not comply with these terms.
*Correspondence: Stephen J. G. Galer, steve.galer@mpic.de
†Present address: Alexander Heuser, GEOMAR Helmholtz-Zentrum für Ozeanforschung Kiel, Kiel, Germany