 Caitlin H. Frame
 Evan Lau
 E. Joseph Nolan IV2
 Tyler J. Goepfert
 Moritz F. Lehmann
- 1Department of Environmental Sciences, University of Basel, Basel, Switzerland
- 2Department of Natural Sciences and Mathematics, West Liberty University, West Liberty, WV, USA
- 3Helmholtz Center for Ocean Research, GEOMAR, Kiel, Germany
Ammonia-oxidizing microorganisms are an important source of the greenhouse gas nitrous oxide (N2O) in aquatic environments. Identifying the impact of pH on N2O production by ammonia oxidizers is key to understanding how aquatic greenhouse gas fluxes will respond to naturally occurring pH changes, as well as acidification driven by anthropogenic CO2. We assessed N2O production rates and formation mechanisms by communities of ammonia-oxidizing bacteria (AOB) and archaea (AOA) in a lake and a marine environment, using incubation-based nitrogen (N) stable isotope tracer methods with 15N-labeled ammonium (15) and nitrite (15), and also measurements of the natural abundance N and O isotopic composition of dissolved N2O. N2O production during incubations of water from the shallow hypolimnion of Lake Lugano (Switzerland) was significantly higher when the pH was reduced from 7.54 (untreated pH) to 7.20 (reduced pH), while ammonia oxidation rates were similar between treatments. In all incubations, added was the source of most of the N incorporated into N2O, suggesting that the main N2O production pathway involved hydroxylamine (NH2OH) and/or produced by ammonia oxidation during the incubation period. A small but significant amount of N derived from exogenous/added 15 was also incorporated into N2O, but only during the reduced-pH incubations. Mass spectra of this N2O revealed that and 15 each contributed N equally to N2O by a “hybrid-N2O” mechanism consistent with a reaction between NH2OH and , or compounds derived from these two molecules. Nitrifier denitrification was not an important source of N2O. Isotopomeric N2O analyses in Lake Lugano were consistent with incubation results, as 15N enrichment of the internal N vs. external N atoms produced site preferences (25.0–34.4‰) consistent with NH2OH-dependent hybrid-N2O production. Hybrid-N2O formation was also observed during incubations of seawater from coastal Namibia with 15 and . However, the site preference of dissolved N2O here was low (4.9‰), indicating that another mechanism, not captured during the incubations, was important. Multiplex sequencing of 16S rRNA revealed distinct ammonia oxidizer communities: AOB dominated numerically in Lake Lugano, and AOA dominated in the seawater. Potential for hybrid N2O formation exists among both communities, and at least in AOB-dominated environments, acidification may accelerate this mechanism.
Introduction
Ammonia oxidizing bacteria (AOB) and archaea (AOA) are a source of the greenhouse gas nitrous oxide (N2O) (Goreau et al., 1980; Santoro et al., 2011; Löscher et al., 2012) in soils and aquatic environments. The rate at which these microorganisms produce N2O depends on the rate at which they carry out chemosynthetic reactions that oxidize ammonia (NH3) to nitrite (). However, other environmental factors can enhance their N2O production rate, such as reduced oxygen (O2) concentrations (Goreau et al., 1980; Löscher et al., 2012), higher concentrations, and higher densities of ammonia-oxidizing cells (Frame and Casciotti, 2010). In soils, pH is another factor that influences N2O production, with acidic soils generally producing more N2O than alkaline soils (Martikainen, 1985). Certain lakes and marine environments also experience pH decreases, which may occur naturally as a result of rapid respiration of organic carbon to carbon dioxide (CO2), or by the dissolution of acid-forming gases (e.g., CO2, sulfur dioxide, and nitrogen oxides) produced by human activities.
There are several ways in which reducing the pH of aquatic environments (i.e., acidification) may affect the rate of N2O production by ammonia oxidizers. Some evidence suggests that acidification will cause ammonia oxidation rates to decline. Specifically, the ammonia monooxygenase enzyme (AMO), which catalyzes conversion of NH3 to the intermediate hydroxylamine (NH2OH), is thought to act on the free base form of the substrate (NH3), rather than the protonated form, ammonium () (Suzuki et al., 1974; Stein et al., 1997). In the pH range of many natural aquatic systems (pH 6–8) /NH3 is mostly present as (pKa = 9.25 at 25°C). Any acidification will further reduce the fraction of /NH3 that is present as NH3, and thus reduce the substrate concentration for ammonia oxidizers.
The net effect of ammonia oxidation is also acidifying, releasing protons (H+) to the surrounding environment:
so that, for example, AOB batch cultures that are actively consuming NH3 are normally exposed to pH decreases as they grow. In these cultures, once the pH drops below ~6.5, further ammonia oxidation is inhibited (Allison and Prosser, 1993; Jiang and Bakken, 1999b). However, the reason for this may not be decreased substrate availability, since decreases in the activity of AOB are not necessarily correlated with reductions in the NH3 concentration (Jiang and Bakken, 1999a). It is more likely that inhibition is caused by other factors, such as toxic buildup of nitrous acid (HNO2), nitric oxide (NO), and nitrogen dioxide (NO2) under acidic conditions (Schmidt and Bock, 1997; Stein and Arp, 1998; Schmidt et al., 2002; Udert et al., 2003; Park and Bae, 2009). Recent environmental studies suggest that ammonia oxidation rates may not have a single relationship to pH. For example, ammonia oxidation rates in the open ocean are inhibited by acidification (from pH 8.1–8.2 down to pH 7.6–7.8; Beman et al., 2011; Rees et al., 2016), whereas sedimentary ammonia oxidation rates do not seem to be sensitive to acidification (from pH 8 down to 6; Kitidis et al., 2011).
AOA may not be subject to the same growth inhibition as AOB at lower pH ranges. For example, an obligately acidophilic AOA with an optimum pH range of 4–5 was discovered in acidic soil (Lehtovirta-Morley et al., 2011), and in soil pH manipulation experiments, archaeal amoA transcript abundances outnumbered those of AOB in acidic soils (Nicol et al., 2008), suggesting that AOA may outcompete AOB in acidic environments. Marine AOA, which are generally regarded as more important than AOB to ammonia oxidation in the ocean (Wuchter et al., 2006), may also be more tolerant of acidic conditions. For example, certain marine AOA strains are capable of maintaining near-maximal growth rates down to a pH of 5.9 (Qin et al., 2014), perhaps because they express -transport proteins that actively transport into AOA cells, thus supplying AMO with NH3 under acidic conditions (Lehtovirta-Morley et al., 2011, 2016).
Unlike , N2O is not the major nitrogenous product of ammonia oxidation, and it is not known to what degree the reactions that produce N2O are convolved with the main energy-harnessing reactions of ammonia oxidizers (i.e., NH3 oxidation to NH2OH and then to ). This means that the impact of pH on the N2O production rate may be decoupled from its impact on the ammonia oxidation rate. That is, even if acidification decreases the ammonia oxidation rate, the N2O production rate may not necessarily also decrease proportionally. In fact, many of the reactive nitrogen oxides produced during ammonia oxidation undergo N2O-forming reactions over relevant timescales, with or without enzyme catalysis, and with their own pH-dependencies.
One of these nitrogen oxides is NH2OH, which is the enzymatic product of NH3 oxidation by AMO in both AOB and AOA (Figure 1, blue box; Hofman and Lees, 1953; Vajrala et al., 2013). Although most NH2OH is converted to during active ammonia oxidation, NH2OH is also subject to abiotic autoxidation (Figure 1, pathway 1a) and disproportionation reactions (Figure 1, pathway 1b) that produce N2O as well as nitrogen (N2), nitric oxide (NO), and NH3/. N2O yields during these reactions vary with alkalinity (Bonner et al., 1978), redox conditions (Moews and Audrieth, 1959; Pacheco et al., 2011), and the presence of certain transition metals (Anderson, 1964; Alluisetti et al., 2004). NH2OH may also react with /HNO2 to produce N2O (Figure 1, pathway 2). This reaction occurs abiotically at a rate that accelerates as pH decreases (Döring and Gehlen, 1961; Bonner et al., 1983). It can also be catalyzed by the copper- and iron-containing reductases of certain denitrifying bacteria (Iwasaki et al., 1963; Kim and Hollocher, 1984), as well as soluble enzyme extracts of AOB that have an acidic optimum pH (Hooper, 1968). A reaction such as pathway 2 could explain the “hybrid” N2O production observed in AOA cultures, where one -derived N atom and one NH3-derived N atom (e.g., from NH2OH) were combined into the same N2O molecule (Stieglmeier et al., 2014b). Furthermore, Harper et al. (2015) found that this hybrid reaction between NH2OH and was responsible for most of the N2O produced by activated sludge during bioreactor experiments. NH2OH may also react abiotically with NO to form N2O and N2 in proportions that are pH-dependent (Figure 1, pathway 3; Bonner et al., 1978). In terms of tracing the source compounds contributing N to N2O, NO can be derived abiotically from HNO2 through a disproportionation reaction (Figure 1, pathway 4; Park and Lee, 1988), and the reaction of HNO2-derived NO with NH2OH could also produce a hybrid type N2O. However, abiotic disproportionation HNO2 tends to be most important only in very acidic environments (pKa HNO2 = 2.8; Riordan et al., 2005).
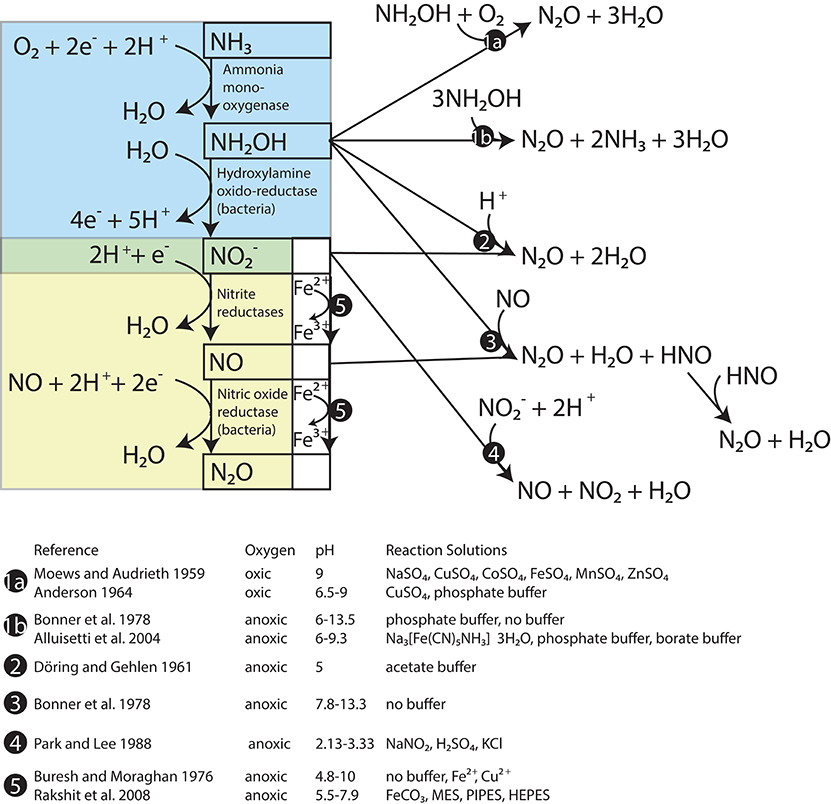
Figure 1. Reactions between products of ammonia oxidation that produce N20. The steps of ammonia oxidation are in the blue box and the steps of nitrifier denitrification are in the yellow box. Known abiotic pathways to N20 formation are located outside these boxes.
Reduction of and by trace metal ions (Buresh and Moraghan, 1976) and metal-containing minerals (e.g., Rakshit et al., 2008) is known as chemodenitrification (Figure 1, pathway 5). In this process, reduced metal species, particularly Fe2+ (and possibly also Mn2+) are oxidized, and NO, N2O, and N2 are produced (Picardal, 2012). This pathway has a recognized importance in soils (Zhu-Barker et al., 2015), but is less studied in seawater and eutrophic lake water, which typically have much lower metal concentrations (Morel et al., 2003) than soil. Reducing sediments along productive continental margins may support significant rates of chemodenitrification (Scholz et al., 2016).
Enzymatic reduction of to NO and N2O in AOB is known as nitrifier denitrification (Figure 1, yellow box). This pathway produces N2O whose N atoms are both derived from .1 The existence of this pathway in AOB was confirmed in cultures of Nitrosomonas europaea by the production of N2O with a molecular mass of 46 (46N2O = 15N15N16O) after tracer additions of 15 (Poth and Focht, 1985). However, in similar experiments with AOA cultures, Stieglmeier et al. (2014b) observed no 46N2O production, even at low O2 concentrations that are thought to stimulate nitrifier denitrification in AOB (Goreau et al., 1980). Similarly, microrespirometry measurements of Nitrososphaera viennensis cultures indicate that this AOA does not reduce to N2O (Kozlowski et al., 2016).
In AOB, NO produced by nitrite reduction is converted to N2O by a membrane-bound NO reductase (NOR) that reduces 2NO to N2O (Figure 1, yellow box; Beaumont et al., 2004b; Kozlowski et al., 2014). In some denitrifiers, the NOR homolog that carries out the same reduction of NO to N2O, has a neutral to acidic pH optimum (5–7.6; Hoglen and Hollocher, 1989) raising the possibility that this step in nitrifier denitrification also has a slightly acidic pH optimum. Among AOA, however, no homologs for the catalytic subunit of bacterial NOR (norB) have been found in any sequenced genomes to date (Santoro et al., 2015), confirming tests of AOA cultures that indicate that nitrifier denitrification does not occur in these organisms (Stieglmeier et al., 2014b; Kozlowski et al., 2016).
NO is a precursor of N2O during bacterial nitrifier denitrification, but its production and consumption may be involved in other processes in ammonia oxidizers. For example, NO is an intermediate in the catalytic cycle of hydroxylamine oxidoreductase (HAO) (Cabail and Pacheco, 2003), an enzyme that oxidizes NH2OH to in AOB (Figure 1, blue box). NO production is also required for AOA to carry out their ammonia oxidation cycle (Shen et al., 2013; Martens-Habbena et al., 2015; Kozlowski et al., 2016), though no HAO homologs have been identified among AOA (Hallam et al., 2006; Walker et al., 2010).
Field studies assessing the importance of N2O production pathways in aquatic environments have relied on two approaches to date: (1) 15N tracer incubation studies that track the incorporation of N derived from 15N-labeled precursor molecules, and (2) dissolved N2O measurements of the bulk O and N stable isotopic composition as well as the intramolecular distribution of 15N and 14N between the internal and external N atoms of the linear, asymmetrical N2O molecule (known as site preference; SP = δ15Ninternal-δ15Nexternal; Toyoda and Yoshida, 1999). The SP signature can be useful for distinguishing N2O production pathways because it is often (but not always) independent of the isotopic composition of the starting compounds (Yang et al., 2014). Using the first approach, Nicholls et al. (2007) and Trimmer et al. (2016) may have observed hybrid N2O formation by an ammonia oxidizer community immediately above the oxygen minimum zone (OMZ) of the Arabian Sea and in the Eastern Tropical North Pacific, respectively, where they observed 45N2O but not 46N2O production during tracer incubations with 15 and with a natural abundance (NA) isotopic composition. In studies using the second approach, profiles of the SP of N2O have been used to distinguish N2O produced by NH2OH-dependent pathway(s), which have a distinctly higher SP (~34‰; e.g., Sutka et al., 2006; Heil et al., 2014; Frame and Casciotti, 2010) than N2O that is formed during denitrification and nitrifier denitrification, which has a much lower SP (0 to −5‰; Toyoda et al., 2005; Sutka et al., 2006; Yamazaki et al., 2014).
Here we have used profiles of dissolved inorganic N concentrations (, , , and N2O) and the natural abundance isotopic composition of , , and N2O to locate depths where ammonia oxidation and/or N2O production are important in the water columns of Lake Lugano, a human-impacted lake in southern Switzerland, and the marine upwelling zone off the Namibian coast of southwestern Africa. N2O isotope and site preference profiles were used to identify the likely pathways of N2O production and the involved substrates/intermediates in the two environments. Short (24–30 h) incubations with 15N-tracers (15 and 15) at targeted depths revealed that hybrid N2O formation occurred in both the shallow hypolimnion of Lake Lugano, as well as in water from the Namibian upwelling zone. Furthermore, N2O yields produced during incubations of Lake Lugano water were significantly higher when the pH was reduced experimentally. The isotopic composition of the N2O that was produced indicated that the increase was due, at least in part, to enhanced incorporation of N derived from exogenous . Multiplex sequencing of microbial 16S rRNA from the incubation locations indicated that AOB numerically dominated the ammonia-oxidizing community in Lake Lugano whereas AOA dominated in the Namibian Upwelling zone. The lines of evidence presented here suggest that there is potential, at least over the short term, for acidification to enhance hybrid N2O formation in aquatic environments.
Methods
Sampling
Lake Lugano is separated into a permanently stratified northern basin and a monomictic southern basin. This study focuses on the 95 m-deep southern basin. Water samples and incubation water were collected with a 5L Niskin bottle at the Figino Station (45.95°N, 8.90°E) during a sampling campaign on November 5, 2013. Profiles of dissolved O2, temperature, salinity, and pH were collected by a conductivity, temperature, and depth sensor (CTD). O2 profiles were calibrated by Winkler titration. Water from the Namibian Upwelling zone was collected by hydrocast with a 10L-Niskin bottle rosette at station 89 (20.65°S, 10.95°E) on January 28, 2014 during the NamUFil cruise of the R/V Meteor.
Geochemical Profiles
Water samples for and concentrations, as well as isotope measurements were immediately filtered through 0.22 μm-pore sterivex filters (Millipore) and then frozen within 2 h of sampling. concentrations were measured fluorometrically (Holmes et al., 1999). concentrations were determined by converting present in 10 ml of sample water to N2O by azide reduction (McIlvin and Altabet, 2005) and then quantifying the amount of N2O in each sample by gas chromatography-isotope ratio mass spectrometry (GC-IRMS, see below). concentration standards were prepared in 10 ml of distilled water and in lake-water or seawater, and were analyzed by GC-IRMS along with the samples. For concentration and isotopic measurements, sulfamic acid was used to remove prior to analysis (Granger and Sigman, 2009). concentrations were measured by reduction to NO with Vanadium (III) and chemiluminescence detection (Braman and Hendrix, 1989). Nitrate N and O isotope measurements of duplicate samples were performed by conversion of to N2O using the denitrifier method (Sigman et al., 2001; Casciotti et al., 2002) and subsequent purification and analysis of this N2O with a modified purge-and-trap gas bench GC-IRMS (Thermo Finnigan DeltaV Plus) system. Isotopic calibration was performed by concurrent analysis of isotope standards USGS 32, USGS 34, and USGS 35 (Casciotti et al., 2008). N and O isotopic data are reported on the permil (‰) scale referenced to air N2 and Vienna Standard Mean Ocean Water (VSMOW), respectively (δ15N = ([15N]/[14N])sample / [15N]/[14N]air_N2 − 1) × 1000‰ and δ18O = ([18O]/[16O]sample / [18O]/[16O]VSMOW − 1) × 1000‰).
Samples for N2O concentration and isotope analyses were taken by overfilling 160 ml glass sample bottles twice from the bottom through a plastic hose connected to the Niskin outlet. The Lake Lugano N2O samples were preserved by adding 100 μl of saturated mercuric chloride solution (HgCl2) after a headspace was added by pipetting 1 ml of water off the top of each bottle. Each bottle was then sealed with a butyl rubber septum (VWR, 5483369) and aluminum crimps (CS Chromatographie, 300219). The marine samples were preserved by adding 5 ml of 10 M sodium hydroxide (NaOH) to the bottom of each bottle with a syringe (Mengis et al., 1997), pipetting 1 ml of water off the top for headspace, sealing with butyl septa and aluminum crimps, and then shaking vigorously to distribute the NaOH. Lake Lugano N2O samples were analyzed within 1 week of collection. Marine samples were analyzed within 3 months of collection. The total N2O in each sample was purged with carrier helium directly into a customized purge-and-trap system (McIlvin and Casciotti, 2010) and analyzed by continuous-flow GC-IRMS. Duplicate N2O samples at each depth were collected for the Lake Lugano profile and one sample from each depth was analyzed for the Namibian Upwelling profile. N2O isotope ratios were referenced to N2O injected from a reference N2O tank (≥99.9986%, Messer) calibrated on the Tokyo Institute of Technology scale (Mohn et al., 2012) for bulk and site-specific isotopic composition by J. Mohn (EMPA, Switzerland). Ratios of m/z 45/44, 46/44, and 31/30 signals were converted to δ15N-N2O (referenced to N2_AIR), δ18O-N2O (referenced to Vienna Standard Mean Ocean Water), and site-specific δ15Nα and δ15Nβ-N2O according to Frame and Casciotti (2010), with an additional two-point correction (Mohn et al., 2014) using measurements of two isotopic mixtures of N2O in synthetic air (CA-06261 and 53504; kindly provided by J. Mohn). N2O concentrations were calculated by converting the N2O sample peak areas measured by GC-IRMS to N2O standards prepared by converting to a known quantity of N2O by the denitrifier method (McIlvin and Casciotti, 2010). At each depth, temperature and salinity data were used to calculate the N2O concentrations at equilibrium with the atmosphere according to Weiss and Price (1980), based on atmospheric partial pressures reported by NOAA ESRL Global Monitoring Division (http://esrl.noaa.gov/gmd/). The saturation disequilibrium (ΔN2O) was calculated as the difference between the measured N2O concentration and the atmospheric equilibrium concentration, with positive values corresponding to oversaturation.
Incubations
A list of all incubation treatments is provided in Table 1. Water for the Lake Lugano incubations that was collected at 17 m depth was poured into opaque 10 L HDPE canisters (Huber, 15.0250.03), stored in the dark for ~5 h during transport back to the laboratory, and then amended with 15N-labeled incubation reagents. Water for the seawater incubations was drawn from 200 m depth and immediately mixed with the 15N-labeled substrates inside 3.4 L LDPE drinking water containers (Campmor, 81027). A dilution (1:2) of 30% hydrochloric acid (Fluka TraceSelect, 96208) with milliQ water was added to water for reduced-pH incubations of Lake Lugano water and mixed immediately before and substrates were added. Tracer 15NH4Cl (98.5%) and Na15NO2 (99.2%) purchased from Cambridge Isotope Laboratories (NLM-658 and NLM-467) were paired, respectively, with NaNO2 and NH4Cl with natural abundance (NA) isotopic compositions, so that each incubation received either 1 μM 15 + 1 μM NA or 1 μM NA + 1 μM 15. For each set of experimental conditions (Table 1), 10 acid-washed 160 ml glass incubation bottles (Wheaton, 223748) were rinsed with milliQ and lake or sea water, and then filled with 120 ml of incubation water and closed with gray fluorobutyl PTFE-lined septa (National Scientific, C4020-36AP) and aluminum crimps. Headspace O2 concentrations of the reduced-O2 incubations were adjusted by displacement with either high purity (99.999%) helium for the Lake Lugano incubations, or N2 for the Namibian Upwelling incubations. O2 in the headspace was quantified using a gas chromatograph with an electron-capture detector (SRI 8610C), and O2 concentrations were calculated according to Weiss and Price (1980). During the Lake Lugano incubations, one bottle was sacrificed at the beginning of the incubation, and three bottles each were sacrificed after ~5, 17, or 30 h. During the Namibian Upwelling incubations, one bottle for each set of experimental conditions was sacrificed at the beginning of each incubation, and three bottles were sacrificed after ~12 and ~24 h. Bottles were incubated in the dark at 20–21°C for both experiments.
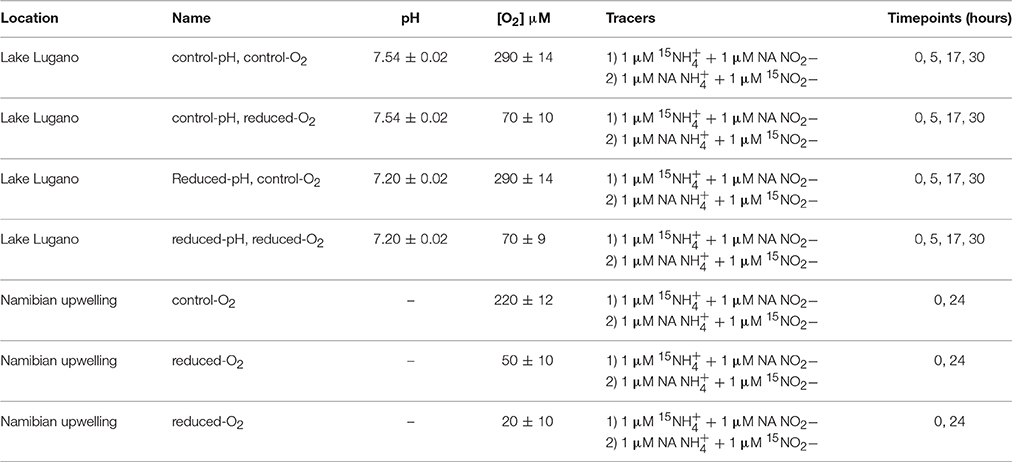
Table 1. Summary of experimental conditions for the Lake Lugano and Namibian Upwelling experiments.
Immediately before an incubation bottle was sacrificed, 40 ml of liquid was withdrawn by syringe for colorimetric pH measurements with phenol red (Robert-Baldo et al., 1985) or frozen at −80°C and then stored at −20°C prior to measurements of concentration and dissolved N isotope composition. Seawater incubation samples were also filtered through polycarbonate membrane filters (Whatman nuclepore) with 0.22 μm pores before freezing. and concentration measurements were made as described above. The initial 15N atom fraction (15F = [15N]/[15N + 14N]) of was calculated at the beginning of the incubation using the added tracer concentration and the ambient concentration of before tracer addition, and assuming that the δ15N of ambient was 0‰. The 15F of was not measured during the incubations. The 15F of during the incubations was measured using the azide reduction/GC-IRMS method (McIlvin and Altabet, 2005), and the 15F of was measured using the denitrifier method (Sigman et al., 2001) after removal of with sulfamic acid. -derived N2O with a 15N composition <15% was analyzed using the IRMS manufacturer's resistor (3 × 10¹⁰ Ω) and capacitor pairing on the m/z 45 Faraday cup. For more 15N-enriched N2O, the resistance on the m/z 45 cup was reduced to 3 × 10⁸. Internal isotope standards for 15FNO2− and 15FNO3− were prepared in triplicate by mixing NA NaNO2 or KNO3 of known δ15N values with either 99.2% Na15NO2 or 98.5% Na15NO3 (Cambridge Isotope Laboratories, NLM-157). The total N2O in each incubation bottle was analyzed for concentration and m/z ion ratios 45/44 and 46/44 as described for natural abundance stable isotope measurements of water column N2O samples. Additional information about converting IRMS measurements to 45N2O and 46N2O production rates is provided in the Supplementary Material S.1.
DNA Extraction
Water from the incubation depth was filtered through a single 0.22 μm-pore size 47 mm polycarbonate Nuclepore filter (Whatman). The volume of water filtered from the Namibian Upwelling was 4 L and from the Lake Lugano was 0.3 L. Filters were frozen immediately and stored at ≤ −80°C until extraction. DNA from either environment was extracted using the FastDNA spin kit for soil (MP Biomedicals).
Illumina 16S rRNA Library Generation
The polymerase chain reaction (PCR) was used to amplify the V4 region of the 16S ribosomal RNA (rRNA) gene of prokaryotes using universal 16S rRNA V4 primers F515 (5′- GTGCCAGCMGCCGCGGTAA -3′) and R806 (5′-GGACTACHVGGGTWTCTAAT-3′; Caporaso et al., 2011). Forward and reverse primers were barcoded and appended with Illumina-specific adapters (Kozich et al., 2013). PCR amplifications were carried out using BioReagents™ exACTGene™ Complete PCR Kit and Core Reagent Sets (Thermo Fisher Scientific) for 30 cycles (Caporaso et al., 2012). Agarose gel electrophoresis was used to separate PCR products of the correct size that were then band-excised and recovered using a QIAquick gel extraction kit (Qiagen). For each library, triplicate PCR products were combined and quantified with a Qubit fluorometric assay (ThermoFisher Scientific) and pooled at equimolar ratios. The final pool was analyzed on an Agilent 2100 Bioanalyzer System (Agilent Technologies) using a High Sensitivity DNA chip to determine the average size of the amplicon pool. Quantitative PCR was performed on the pool using a Biorad IQ5 real time thermocycler (Bio-Rad Laboratories) and Illumina quantification standards (KAPA Biosystems). The samples were sequenced on an Illumina MiSeq (http://www.illumina.com/systems/miseq.ilmn) using 201 nucleotide paired-end multiplex sequencing with 5% PhiX spiked into the run. The library was sequenced on a single flow cell using V2 sequencing reagents, generating paired reads of ~400 bp, with ~150 bp overlap between forward and reverse reads.
Bioinformatic Analyses
Raw 16S rRNA sequence data were initially processed in Basespace using Illumina's metagenomic pipeline (https://basespace.illumina.com/home/index). Merging the paired reads and further analyses were carried out using Axiome with installed PANDAseq and the Quantitative Insights Into Microbial Ecology (QIIME v.1.8.0) software pipeline, including taxaplot for overall bacterial diversity, and calculations of Chao1 to estimate taxon richness and rarefaction curves to calculate species richness for a given number of individual sequences sampled (Caporaso et al., 2010; Masella et al., 2012; Lynch et al., 2013). On PANDAseq, the minimum overlap length was set at the threshold of 0.9. The read length maximum for all sequences was 253 bp. Since the V4 region of the 16S rRNA gene is conserved, reads were removed from further analysis if at least one of the following criteria was met: reads were ≥4 bp shorter than the maximum mentioned above, the number of ambiguous bases was ≥1, homopolymers with >4 bp were present, or sequences did not match any sequences in the database by more than 97% based on the percent coverage in BLAST. The clustering of the sequences into operational taxonomic units (OTUs) was initially performed using UCLUST (Edgar, 2010; Edgar et al., 2011) with a cutoff value of 97% sequence identity. The taxonomic identity of a representative sequence from each cluster was classified using the RDP classifier (Wang et al., 2007) and Greengenes datafiles compiled in October 2012 (downloaded from: http://greengenes.lbl.gov/), which includes chimera screening based on 16S rRNA gene records from GenBank (DeSantis et al., 2006). The confidence threshold was set at the default cutoff value of 80% in order to retrieve potential sequences from the nitrifying taxa Thaumarchaeota and Nitrosomonadaceae.
Phylogenetic Analyses
Phylogenetic trees were constructed using MEGA 7 (Kumar et al., 2016). The 16S rRNA gene sequences of representative AOA and AOB were downloaded from GenBank (Benson et al., 2015) for all phylogenetic analyses. Gene sequences were aligned using the MUSCLE algorithm in MEGA 7 and manually inspected. The final alignments consisted of 253 characters, comprising 481 and 108 taxa for sequences related to AOA and AOB, respectively. Phylogenetic reconstruction was implemented using Maximum Parsimony (MP) and Maximum Likelihood (ML). MP was implemented with complete deletion if gaps were present, and tree-bisection-reconnection (TBR) utilized for tree generation. The resulting trees were obtained via random stepwise addition of sequences, at MP search level 1, with 25 initial trees generated from a heuristic search. ML was implemented using Tamura-Nei model of nucleotide substitution rates, with tree inference based on Nearest-Neighbor-Interchange (NNI). Statistical support for MP and ML trees were obtained from 1000 bootstrap replicates under the same initial settings (only bootstrap values >50% are reported). Pairwise base comparisons of OTUs and their closest relatives were determined using BLAST (Altschul et al., 1990) and reported as % identity values.
Statistical and Ecological Analyses
The abundances (frequencies) of ammonia oxidizer OTUs in the Namibian Upwelling and Lake Lugano samples were counted using a program written in Python (v.2.7) (https://www.python.org/download/releases/2.7) to search for each OTU that was verified by the above phylogenetic analyses (Lau et al., 2015). The Shannon-Weiner Index and Pielou Evenness were calculated using the BiodiversityR package (Kindt and Coe, 2005) in R version 3.2.2 (http://www.R-project.org/). All partial 16S rRNA gene sequence data are available through the European Bioinformatics Institute (EBI) with project accession number PRJEB11492. The nucleotide sequences for the partial 16S rRNA genes have been deposited in EBI under individual accession numbers (LN908279-LN908785).
Results
Geochemical Profiles
Lake Lugano
The 17-m incubation depth in Lake Lugano corresponded to the shallow local minima in both pH (7.47) and O2 concentration (58 μM; Figures 2A,B). Below 15 m, the respective and concentrations dropped from their surface values of ~3.8 μM and ~1.2 μM to ~0.9 μM and ≤ 0.3 μM, respectively (Figures 2C,D). In contrast, N2O concentrations increased steadily from a surface concentration of 11 nM to 37 nM at 50 m (ΔN2O = 22 nM; Figure 2E). The δ15N-N2O dropped from a surface value of 4.9‰ to a minimum of 2.4‰ at 15 m and then increased again to 4.9‰ at 50 m (Figure 2F). In contrast, the δ18O-N2O and SP increased in parallel, from the surface values of 44.5‰ and 15.3‰, respectively, to values of 47.2‰ and 34.4‰, respectively, at 50 m (Figures 2G,H). Like N2O, concentrations increased between the surface (58 μM) and 50 m (92 μM; Figure 2I) and the δ15N- profile had a distinct minimum around 15–17 m (Figure 2J), corresponding with the δ15N-N2O minimum. However, the shape of the δ18O- profile was the mirror opposite of the δ18O-N2O profile, with δ18O- decreasing from 6.7‰ in the surface to 1.6‰ at 50 m (Figure 2K). Surface was depleted in 15N relative to both and N2O, with δ15N- values between −29‰ and −27‰ (Figure 2L).
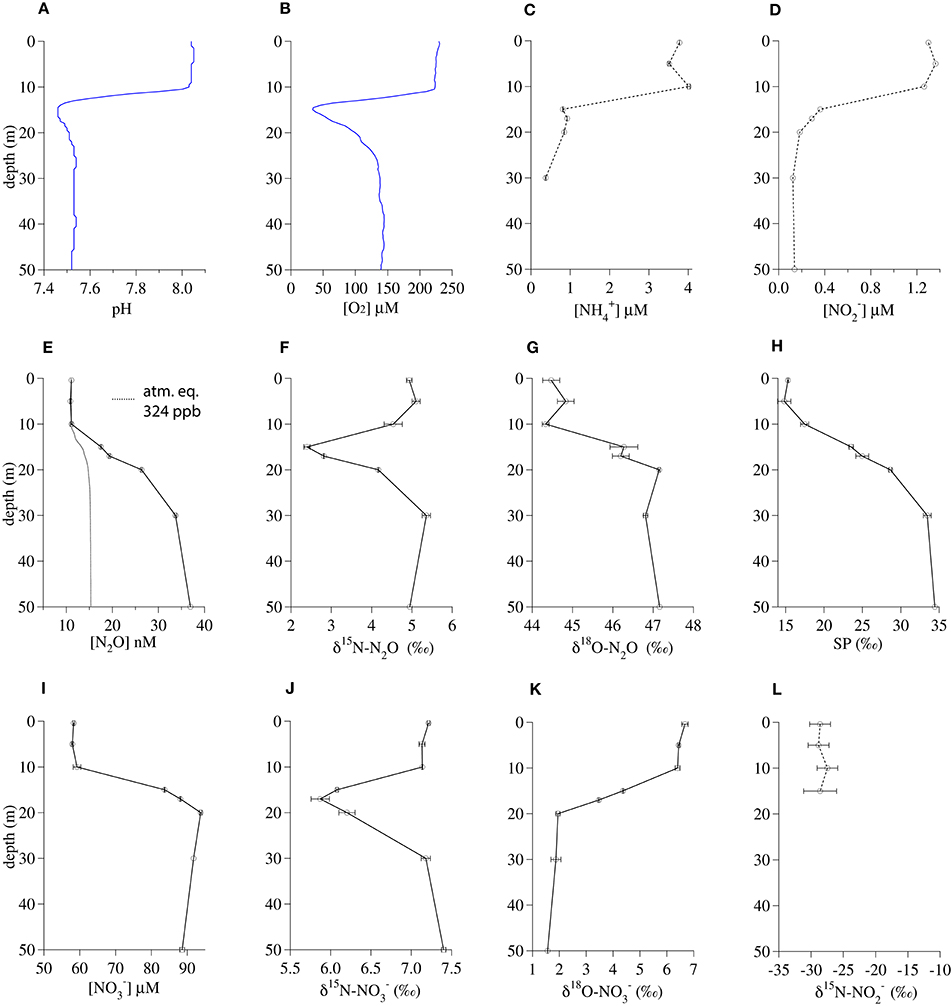
Figure 2. Geochemical profiles from November 2013 in the south basin of Lake Lugano. (A) pH, (B) O2 concentration, (C) concentration, (D) concentration, (E) N2O concentration, (F) δ15 N-N2O, (G) δ18 O-N2O, (H) N2O Site Preference, (I) concentration, (J) δ15 N-, (K) δ18 O-, (L) δ15 N-. Bars indicate standard deviations among duplicate measurements.
With the onset of seasonal anoxia in the south basin of Lake Lugano (Lehmann et al., 2004; Blees et al., 2014), the sediments (95 m) and deep redox transition zone (70–90 m) become important in the production and consumption of deep N2O in this system (Freymond et al., 2013; Wenk et al., 2016). Here we have restricted our discussion to the top 50 m of the water column. See Wenk et al. (2014) and Wenk et al. (2016) for details about N cycle dynamics in the redox transition zone.
Namibian Upwelling Zone
The salinity (35.06) and potential temperature (11.74°C) of the water at the 200-m incubation depth (Figure 3A) was characteristic of a deeper tropical branch of South Atlantic Central Water that flows northwestward along the African continental shelf at this latitude (Brea et al., 2004). The in situ O2 concentration (56.8 μM) at 200 m fell within a broader O2-depleted zone extending from 150 to 500 m (Figure 3B). The incubation depth was well-below the depth of the concentration maximum (30 m, Figure 3C) and the maximum (50 m, Figure 3D). N2O oversaturation (ΔN2O) was greatest between 200 and 400 m (Figure 3E). At 200 m, there were minima in δ15N-N2O (5.1 ± 0.02‰, Figure 2F), δ18O-N2O (39.3 ± 0.24‰, Figure 3G), and SP (4.9 ± 0.4‰ Figure 3H). concentrations were near zero in the surface water and increased with depth to a near-maximal concentration of 29 μM at 200 m (Figure 3I). At this depth, had a δ15N (5.3 ± 0.2‰, Figure 3J) similar to that of N2O and a δ18O (3.0 ± 0.3‰, Figure 3K) that was much lower than that of N2O.
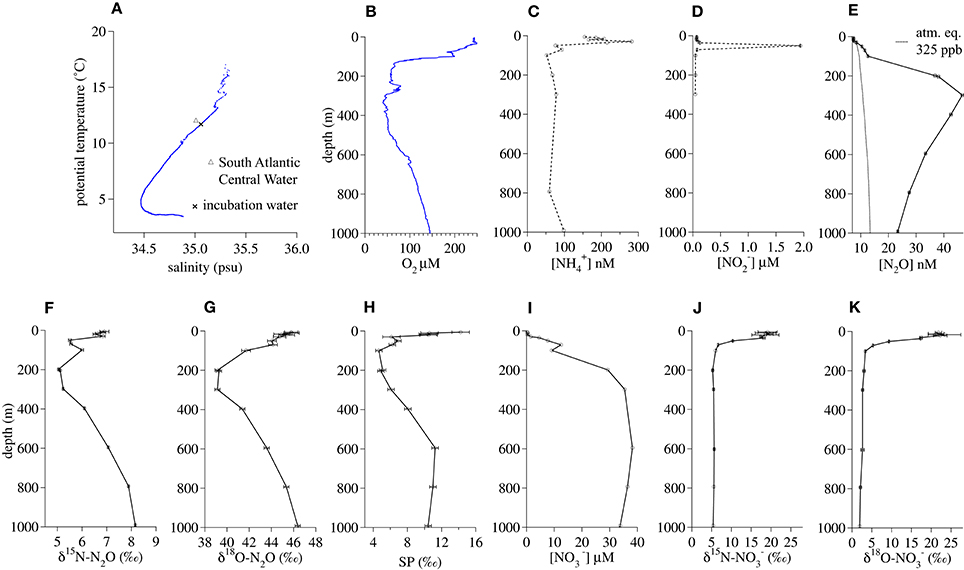
Figure 3. Geochemical profiles from January 2014 in the Namibian Upwelling Zone (20.65°S, 10.95°E). (A) Salinty vs. potential temperature, (B) O2 concentration, (C) concentration, (D) concentration, (E) N2O concentration, (F) δ15 N-N2O, (G) δ18 O-N2O, (H) N2O Site Preference, (I) concentration, (J) δ15 N-, (K) δ18 O-.
Nitrification Rates
Lake Lugano
Ammonia oxidation rates were estimated in two ways, using data from either the 15 incubations or the 15 incubations. The first method was by linear regression of the [15NNOx−] produced over time during the 15 incubations (Figure 4A) multiplied by an isotopic dilution factor (1/15FNH4+0 = [15 + 14]/[15]) calculated from the added tracer, the concentration of present in the water before tracer addition, and assuming that this had a δ15N of 0‰. The pH reduction from 7.54 to 7.20 was associated with a 12% decrease in ammonia oxidation rates in incubations at the untreated-O2 concentrations (rates calculated in this way were 0.356 ± 0.006 μM/day in the untreated-pH incubations and 0.314 ± 0.027 μM/day in the reduced-pH incubations). Among the reduced-O2 incubations, those with a reduced pH had 14% lower ammonia oxidation rates than those at the untreated pH (0.325 ± 0.004 μM/day and 0.380 ± 0.005 μM/day, respectively). Because we did not measure the 15FNH4+ over the course of the 15 incubations, we were not able to account for the dilution of the tracer 15 over time by regeneration of , or removal of from the system by processes other than ammonia oxidation (Ward and Kilpatrick, 1990). Therefore, in a second approach, we used the results of the incubations with 15 and NA to calculate zero-order rates of ammonia oxidation (Ramm_ox) and nitrite oxidation (Rnit_ox). Specifically, rates were calculated for each timepoint (t) using measurements of the 15N atom fractions of (15, Figure 4B) and (15, Figure 4C), and the total concentrations of ([], Figure 4D) and ([], Figure 4E) to solve the following equations:
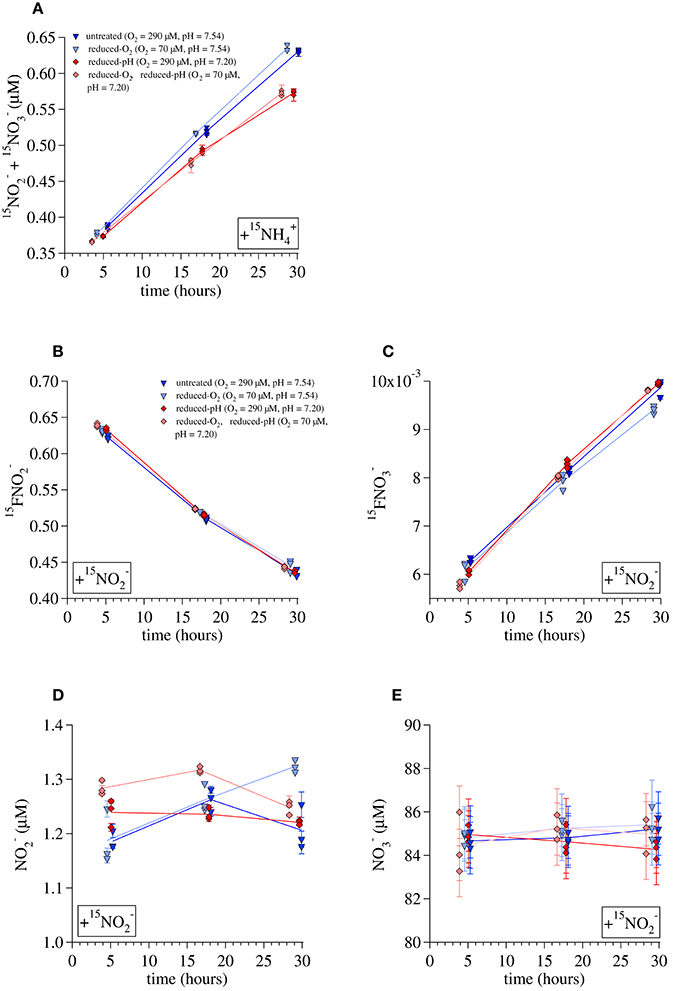
Figure 4. Data used to calculate ammonia-oxidation rates during the Lake Lugano incubations. (A) 15 production during 15 incubations, (B) 15 during 15 incubations, (C) 15 during 15 incubations, (D) concentrations during 15 incubations, and (E) concentrations during 15 incubations. Lines are drawn between averages of triplicate incubations at each time point. Error bars represent one standard deviation from the average of duplicate measurements.
Ammonia oxidation rates calculated this way were similar but somewhat higher than those derived from the 15 incubation data. Average rates calculated for incubations terminated at the middle timepoint (~17 h) and final timepoint (~30 h) were 0.50 ± 0.02 μmol/day for the untreated-O2—untreated-pH incubations, 0.48 ± 0.02 μM/day for the reduced-O2—untreated-pH incubations, 0.54 ± 0.01 μM/day for the untreated-O2—reduced-pH incubations, and 0.54 ± 0.02 μM/day for the reduced-O2—reduced-pH incubations. Rates are given with the standard deviation among the calculated rates for each of the 17 and 30-h time points. Values of Rnit_ox calculated for the 15 incubations were higher than Ramm_ox under all conditions. The average Rnit_ox was 0.64 ± 0.06 μmol/day among the untreated-O2—untreated-pH incubations, 0.59 ± 0.05 μmol/day among the reduced-O2—untreated-pH incubations, 0.72 ± 0.03 μM/day among the untreated-O2—reduced-pH incubations, and 0.72 ± 0.05 μM/day among the reduced-O2—reduced-pH incubations. Thus, there was net consumption of of 0.1–0.2 μM/day.
Namibian Upwelling Zone
In the Namibian Upwelling incubations, ammonia-oxidation rates calculated from linear regressions of 15 measured at 12 and 24 h during 15 incubations were two orders of magnitude lower than during the Lake Lugano incubations. Average rates were 3.0 ± 0.3 nM/day (r2 = 0.96) at 220 μM O2, 2.4 ± 0.3 nM/day (r2 = 0.91) at 50 μM O2, and 2.3 ± 0.2 nM/day (r2 = 0.98) at 20 μM O2 (Table 2).
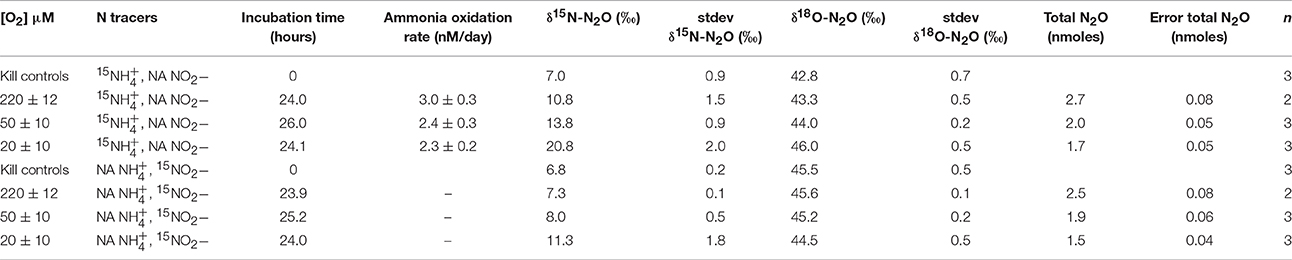
Table 2. Results of incubations in the Namibian Upwelling zone.
N2O Production Rates and Yields
Lake Lugano
Incorporation of tracer 15N into N2O over the course of the incubation can produce an excess of either m/z 45 N2O (total 45N2O = 15N14N16O + 14N15N16O + 14N14N17O) or m/z 46 N2O (total 46N2O = 15N15N16O + 14N14N18O). During the Lake Lugano incubations with 15 + NA , significant amounts of both 45N2O and 46N2O were produced (Figures 5A,B). The quantities of 45N2O and 46N2O present in each incubation bottle were calculated by converting the calibrated molecular ratios (45R = [45N2O]/[44N2O] and 46R = [46N2O]/[44N2O]) to molecular fractions (45F = [45N2O]/[44N2O + 45N2O + 46N2O] and 46F = [46N2O]/[44N2O + 45N2O + 46N2O]):
and then multiplying the molecular fractions by the total N2O:
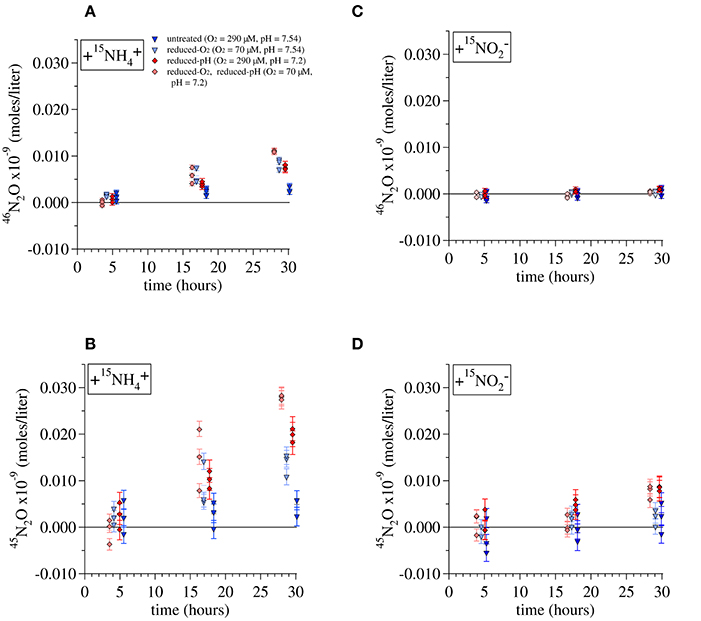
Figure 5. Production of (A) 46N2O and (B) 45N2O during incubations of Lake Lugano water with additions of 1 μM 15 and 1 μM unlabeled . Production of (C) 46N2O and (D) 45N2O during incubations with 1 μM 15 and 1 μM unlabeled . Error bars represent the propagated error from the measurements of the total N2O in each incubation, its constituent isotope ratios, and the volume of water present in each incubation. Lines are drawn to the average value of triplicate incubations at each time point.
For each set of experimental conditions, the total 45N2O and 46N2O measured in incubations killed immediately after tracer addition (t0) was subtracted from the measurements of incubations killed at all subsequent time points. The 45R and 46R measured in incubations killed at t0 were similar to those of the background N2O, indicating that our preservation methods prevented further N2O production from either 15 or 15. Error bars in Figure 5 represent the propagated error from measurements of the total N2O in each incubation, its isotope ratios, and the total volume of water and background N2O present in each incubation bottle. Total daily incorporation of 15N into N2O during 15 incubations was calculated from these daily rates as (Rate45N2O + 2 × Rate46N2O). Rates of 15N incorporation were 0.0086 ± 0.003 nM-N/day for the untreated-O2—untreated-pH 15 incubation, 0.025 ± 0.005 nM-N/day for the reduced-O2—untreated-pH incubations, 0.028 ± 0.003 nM-N/day for the untreated-O2—reduced-pH incubations, and 0.043 ± 0.001 nM-N/day for the reduced-O2—reduced-pH incubation, where we have indicated ± one standard deviation from the daily average calculated using the final three incubations. Assuming that is the ultimate source of all the N2O produced during these incubations, multiplying the rates of 15N incorporation by their respective isotope dilution factors (1/15) would increase total N2O production rates by factors of 1.50 for the untreated-O2—untreated-pH and reduced-O2—untreated-pH incubations, and 1.61 for the untreated-O2—reduced-pH and reduced-O2—reduced-pH incubations.
Multiplying rates by 1/15 does not account for incorporation of N from exogenous into N2O, which probably also contributed to N2O production, particularly in the reduced-pH incubations. Indeed, during incubations with 15, significant amounts of 45N2O formed during both the reduced-pH and reduced O2—reduced-pH incubations (t-test, p = 0.012 and 0.022, respectively; Figure 5D), indicating that 15N derived from tracer 15 also contributed to N2O production. However, no significant 46N2O production was observed among any of the 15 incubations (Figure 5C), including those that produced significant amounts of 45N2O.
The yield of N2O during the 15 incubations was calculated as the rate of incorporation of 15N into N2O relative to the rate of 15 production. The average yields (mol 15N-N2O/mol 15N-) were 3.64 × 10⁻⁵ for the untreated-O2—untreated-pH incubations, 10.0 × 10⁻⁵ for the reduced-O2—untreated-pH incubations, 14.0 × 10⁻⁵ for the untreated-O2—reduced-pH incubations and 21.0 × 10⁻⁵ for the reduced-O2—reduced-pH incubations.
Namibian Upwelling Zone
Among the Namibian Upwelling incubations, there was detectable production of 45N2O when 1 μM 15 + 1 μM NA was added, but not when 1 μM NA + 1 μM 15 was added. The increases in 45N2O were too small to be converted to significant daily rates of 45N2O production, and therefore results are reported in Table 2 using the more sensitive delta notation where the δ15N-N2O signal increases in proportion to [45N2O]/[44N2O], and the δ18O-N2O signal increases in proportion to [46N2O]/[44N2O]. Increases in δ15N-N2O over 24 h were higher during the 15 incubations (10.8 ± 1.5‰ to 20.8 ± 2‰) than during the 15 incubations (7.3 ± 0.1‰ to 11.3 ± 1.8‰). During the 15 incubations, increases in δ18O-N2O (43.3 ± 0.5‰ to 46.0 ± 0.5‰) were smaller than the increases in δ15N-N2O. The increases in δ18O-N2O during the 20 and 50 μM-O2 incubations were significantly higher than the δ18O of the background N2O (two-tailed p = 0.003 and 0.0462, respectively for the 20 μM- and 50 μM-O2 incubations). The 15 incubations with the lower O2 concentrations showed the largest increases in δ15N-N2O. This was partly due to the fact that headspace O2 displacement with He and N2 also reduced background N2O in the reduced-O2 incubations (Table 2). However, correction for the differences in background N2O among O2 treatments explains less than half of the increase in δ15N-N2O during the 20 μM-O2 incubations as compared to the 220 μM-O2 incubations.
Nitrifier Community Composition
Overall Microbial Diversity and Abundances
The OTU abundances and their taxonomic affiliation, closest known cultured relatives, and the number of reads assigned to each OTU are summarized in Tables S1, S2. Three separate reactions with DNA extracted from the Lake Lugano water (17 m depth) yielded 382,374, 77,700, and 287,306 partial 16S rRNA gene sequence reads. Three separate reactions with DNA from the Namibian Upwelling incubation water yielded 246,743, 23,288, and 154,829 reads. These reads underwent quality filtration and de-noising to produce a total of 271,425 unique OTUs that were ~253 bp long. Figure S5 summarizes the bacterial and archaeal phyla into which these OTUs fall. Comparison of the observed taxon richness to Chao1-estimated richness revealed that multiplex sequencing coverage was 47.9 ± 1.4% in the Lake Lugano sample and 52.3 ± 3.7% in the Namibian Upwelling sample. Rarefaction analyses that assess taxon richness in the Namibian Upwelling and Lake Lugano samples were generated with the QIIME pipeline (see Figure S4; Caporaso et al., 2012). The Shannon-Weiner diversity index (H), which is directly proportional to the number of taxa and inversely proportional to the number of sequences falling into each taxon, was an order of magnitude higher for AOB in Lake Lugano than for AOB in the Namibian Upwelling, whereas this index was higher for AOA in the Namibian Upwelling than in Lake Lugano (Figure S6).
AOA and AOB Diversity and Abundances
A total of 442 unique OTUs related to AOA and 65 unique OTUs related to the AOB family Nitrosomonadaceae were identified. The AOA OTUs constitute 0.3 and 31.2% of total microbial OTUs in Lake Lugano and the Namibian Upwelling site, respectively. AOB OTUs constituted 0.6% of total microbial OTUs in the Lake Lugano sample, but were extremely rare (< 0.01%) in the Namibian Upwelling sample. Both ML and MP trees were nearly identical in their placement of AOA and AOB OTUs with respect to their closest relatives. The 65 AOB OTUs fell into a monophyletic cluster that included cultured members of the family Nitrosomonadaceae (Figure 6A). The closest cultured representative to 27 of the 65 OTUs was the predominantly terrestrial species Nitrosospira briensis (with 91–100% 16S rRNA sequence identity), although their closest relatives were all uncultured freshwater organisms (see Figure 6A; Table S1). Most of the AOB OTUs (62) were detected only in the Lake Lugano sample and not the Namibian Upwelling sample, and the remaining 3 OTUs were present in both the Lake Lugano and Namibian Upwelling samples (Table S1).
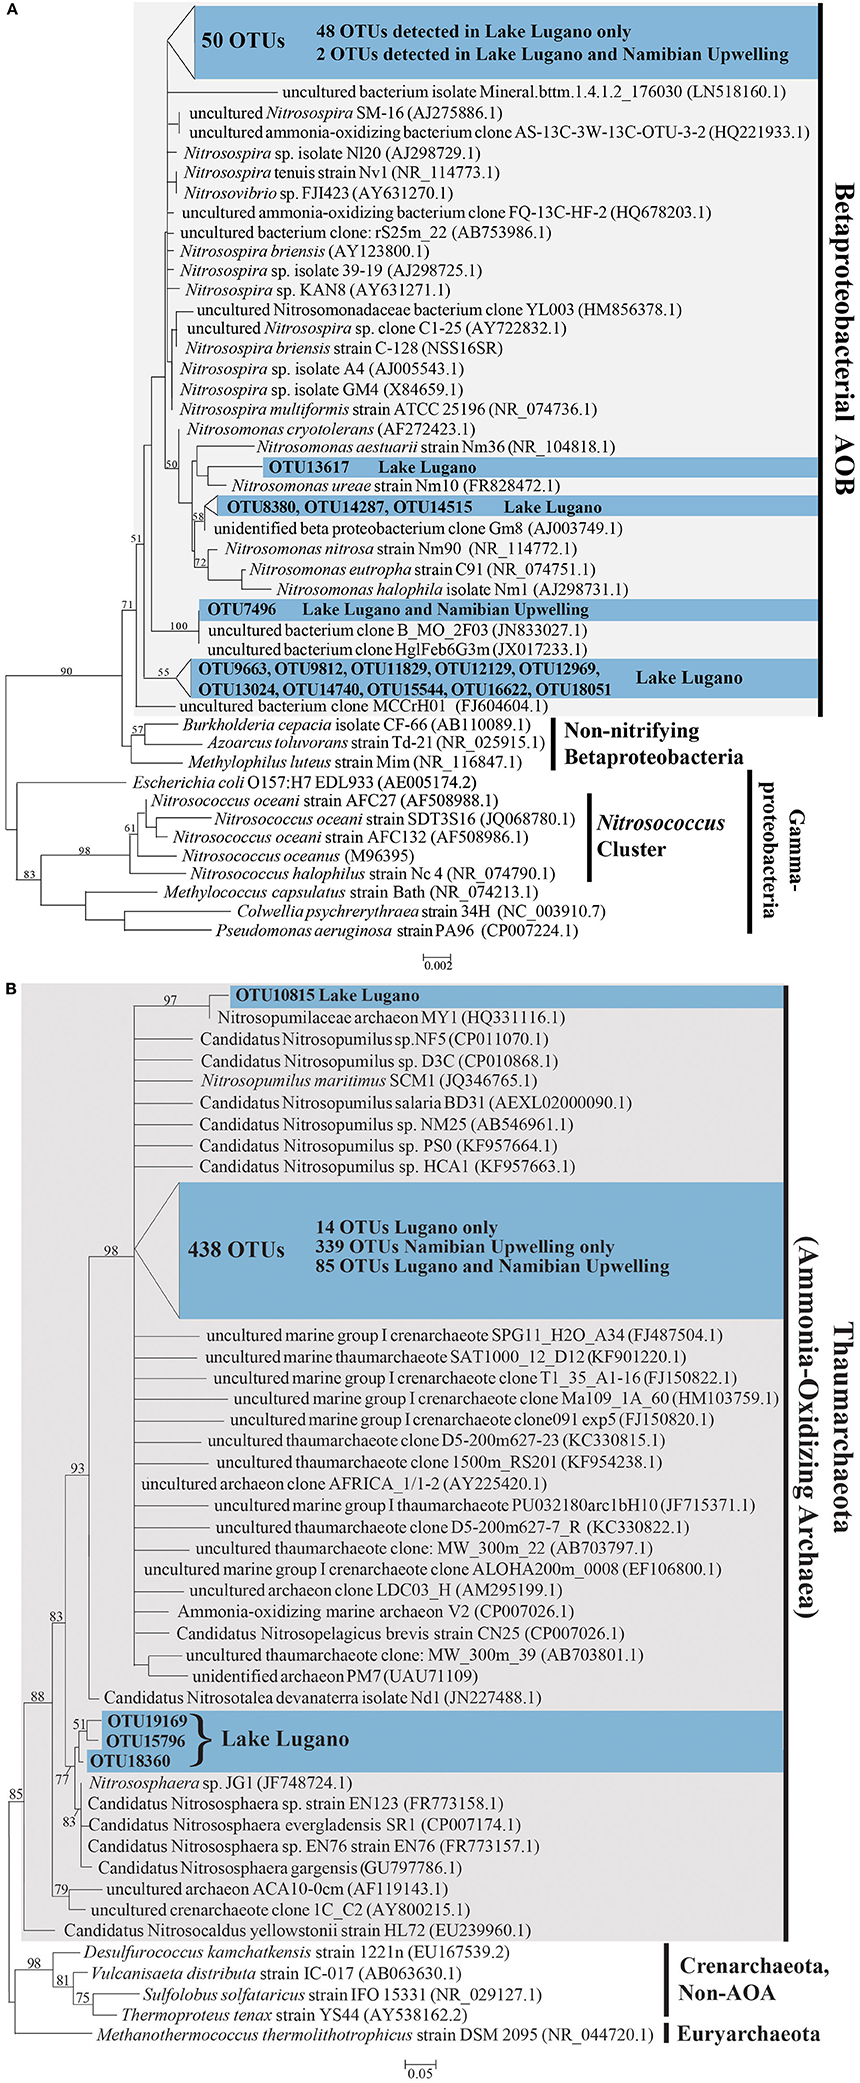
Figure 6. (A) Phylogenetic tree based on maximum likelihood (ML) analysis of 65 OTUs (~253 bp) detected in this study (in blue) in comparison with their close relatives and representatives from the Nitrosomonadaceae in the Betaproteobacteria. The locations where these OTUs were detected are indicated (Lake Lugano or Namibian Upwelling) and their accession numbers are LN908721-LN908785. (B) Phylogenetic tree based on maximum likelihood (ML) analysis of 442 OTUs (~253 bp) detected in this study (in blue) in comparison with their close relatives and representatives among the Thaumarchaeota. The locations where these OTUs were detected are indicated (Lake Lugano or Namibian Upwelling) and their accession numbers are LN908279-LN908720. Bootstrap values from 1000 replicates are indicated at the nodes of branches (if > 50). The scale bar represents the number of substitutions per site.
The 442 unique AOA sequences fell into a clade with members of the Thaumarchaea (marine group I archaea) such as Nitrosopumilus maritimus SCM1 and Nitrososphaera sp. JG1, with moderate bootstrap support (Figure 6B). The closest cultured relatives of these OTUs were mainly found in seawater, with the majority most closely related to Candidatus Nitrosopelagicus brevis strain CN25 (with 88–100% sequence identity), and a large number most closely related to Candidatus Nitrosopumilus sp. NF5 and Candidatus Nitrosopumilus sp. D3C (with 86–98% sequence identity; see Figure 6B; Table S2). With a few exceptions, the uncultured closest relatives of these OTUs were also detected in seawater (Figure 6B). Of the 442 AOA OTUs identified, 339 were detected only in the Namibian Upwelling sample, 18 were detected only in Lake Lugano, and 85 were detected in both locations (Table S2). Among the AOA OTUs unique to Lake Lugano, their closest cultured relatives include Candidatus Nitrosopelagicus brevis strain CN25 (Santoro et al., 2015) and Candidatus Nitrosopumilus sp. HCA1 (KF957663.1) (Bayer et al., 2016), which are both marine, and also Nitrososphaera viennensis EN76 (Stieglmeier et al., 2014a) and Candidatus Nitrososphaera evergladensis SR1 (Zhalnina et al., 2014), which were both found in soil.
Discussion
Geochemical Profiles
The profiles of the N2O concentration and isotopic composition were useful as qualitative indicators of the depths of rapid nitrification in Lake Lugano. Although the depth of the water used for the Lake Lugano experiments (17 m) was shallower than the N2O concentration maximum, its coincidence with a clear minimum in the δ15N-N2O profile (Figure 2F) suggests that there was rapid in situ N2O production there. However, the absence of a corresponding extremum in the SP profile (Figure 2H) at this depth suggests that the δ15N-N2O minimum probably reflects a minimum in the δ15N of the precursor N molecule, rather than a change in the mechanism of N2O formation at this depth. While there is also a minimum in the δ15N- profile at the incubation depth, the δ18O- profile indicates that was probably not the precursor of N2O at this depth. More precisely, at this depth, the δ18O-N2O was 44‰ higher than the δ18O-, whereas the combination of a 42‰ branching isotope effect (Casciotti et al., 2007; Frame et al., 2014) and a −22‰ kinetic isotope effect (Granger et al., 2006) associated with reduction to N2O, should have produced N2O with a δ18O that was at most only 20‰ higher than the δ18O-.
The similarity of the δ15N-N2O and δ15N- profiles suggests that both compounds are derived from a shared pool of relatively low-δ15N precursor N, which could be either or . The δ15N- in the top 15 m ranged between −29‰ and −27‰ (Figure 2L). The NH3 oxidized to at these depths could have been relatively depleted in 15N because of rapid remineralization of isotopically lighter organic N. The 20‰ equilibrium isotope effect between and NH3 (Hermes et al., 1985) and/or expression of the isotope effect(s) associated with ammonia oxidation (Casciotti et al., 2003) may have also contributed to production of 15N-depleted N2O by ammonia oxidizers at this depth.
N2O production in the deeper water of this basin has been linked to a NH2OH-decomposition pathway, largely by the SP value of the N2O, which approaches a value of ~34‰ in the oxic water between 30 and 70 m (Wenk et al., 2016 and Figure 2H). This particular N2O formation mechanism happens during ammonia oxidation in aerobic conditions (Sutka et al., 2006; Frame and Casciotti, 2010; Santoro et al., 2011). Interestingly, such a high SP value is also observed in N2O that is formed abiotically by either the hybrid reaction of NH2OH with HNO2/ or by the oxidation of NH2OH (Figure 1, pathways 1 and 2; Heil et al., 2014). Thus the production of high SP (~34‰) N2O often observed among AOB and AOA cultures may not distinguish a pathway involving only NH2OH from a hybrid pathway where N2O is formed via the reduction of HNO2/ by NH2OH. To our knowledge, no data has been reported on the SP of N2O produced by the enzyme-catalyzed reaction of NH2OH and HNO2 described by Hooper (1968), but it seems reasonable to assume that it may also be ~34‰. Thus, while the SP of the N2O present in the shallower depths of Lake Lugano increases steadily between 5 and 50 m (Figure 2H), suggesting a NH2OH-dependent N2O formation mechanism, we cannot use SP alone to distinguish N2O produced by the reaction between NH2OH and from N2O produced by NH2OH autoxidation or disproportionation.
The high concentration of N2O that had accumulated at the depth of the Namibian Upwelling incubation had a relatively low SP (Figure 3H), suggesting that the source of this N2O was either reduction by denitrification or reduction by nitrifier denitrification (Toyoda et al., 2005; Frame and Casciotti, 2010). However, in our incubations we observed hybrid N2O formation rather than denitrification or nitrifier denitrification. The absence of denitrification and nitrifier denitrification during the incubations is unsurprising, given the relatively high O2 concentrations (20, 50, or 220 μM), all of which were well above thresholds that limit transcription of norB in denitrifiers (Dalsgaard et al., 2014) and initiation of nitrifier denitrification by AOB (Frame and Casciotti, 2010). The lower O2 concentrations tested during these incubations were similar to the in situ O2 concentration at this depth (56.8 μM), suggesting that if denitrification or nitrifier denitrification had occurred in this water mass, it was not happening at the time and location where we sampled it. Frame et al. (2014) have argued that in this region of the South Atlantic, transport and mixing of continental shelf water that is O2-depleted and contains N2O produced by anaerobic or suboxic processes with relatively O2-rich offshore water, can produce water that contains relatively high O2 concentrations and also N2O with isotopic signatures that are characteristic of low-O2 processes like denitrification or nitrifier denitrification.
Nitrification Rates
The difference in ammonia oxidation rates (Ramm_ox) calculated during incubations with 15 vs. those with 15 is probably the result of dilution and loss of the added 15 due to rapid regeneration and uptake, which would both tend to reduce our estimate of Ramm_ox during the 15 incubations. It also suggests that the rate reduction that we observed in the reduced-pH 15 incubations does not necessarily reflect an actual reduction in the rate of ammonia oxidation, but instead a more rapid reduction in the 15FNH4+ over time as compared to the control-pH incubations.
In both Lake Lugano and the Namibian Upwelling, zero-order reaction kinetics were assumed for ammonia oxidation, rather than first-order or Michaelis-Menten kinetics. This was probably a reasonable assumption in the Namibian Upwelling experiments, because AOA have an extremely high affinity for NH3/, with half-saturation constants (Km) on the order of 100 nM (Martens-Habbena et al., 2009; Horak et al., 2013). In contrast, AOB have a lower affinity for than marine assemblages of AOA (Horak et al., 2013; Newell et al., 2013). The lowest reported Km among cultivated AOB representatives is 6 μM, and the typical range for cultivated AOB is 0.05–14 mM (Knowles et al., 1965; Keener and Arp, 1993; Martens-Habbena et al., 2009; Jiang and Bakken, 1999b). concentrations during the incubations remained well above the Km of AOA but below the Km reported for AOB. Since both AOB and AOA were present in the Lake Lugano incubations, we used the results of the 15 incubations to model first-order rate constants for ammonia oxidation that were 0.46 ± 0.04 M−1 day−1 for the untreated-O2—untreated-pH incubations, 0.45 ± 0.04 M−1 day−1 for the reduced-O2—untreated pH incubations, 0.47 ± 0.04 M−1 day−1 for the untreated-O2—reduced-pH incubations, and 0.42 ± 0.04 M−1 day−1 for the reduced-O2—reduced-pH incubations. Using the observed concentration of (0.92 μM) at 17 m in Lake Lugano and assuming that this concentration is in steady-state, the actual ammonia oxidation rate may be slightly lower than what we calculated using the zero-order reaction model.
N2O Yields and Mechanisms of N2O Formation in Lake Lugano
Total N2O yields measured in Lake Lugano (3.64 × 10⁻⁵ to 21.0 × 10⁻⁵ mol 15N-N2O / mol 15N-) were comparable to those observed by Yoshida et al. (1989) in the western North Pacific, also using 15N tracer techniques (8 to 54 × 10−5). They were at the low end of the range observed during growth of batch cultures of the AOB Nitrosomonas marina (10 to 60 × 10−5) at similar O2 concentrations (Frame and Casciotti, 2010) and were lower than those observed for batch cultures of the AOA N. maritimus (60 to 100 × 10−5) and N. viennensis (140 to 180 × 10−5) in media buffered to pH 7.5 (Stieglmeier et al., 2014b). The N2O formed during the Lake Lugano incubations was largely derived from intermediates or products of the ammonia oxidation reactions, and relatively little N was incorporated from exogenous , as indicated by the higher rates of 15N-N2O formation during the 15 incubations than during the 15 incubations (Figures 5A–D).
During all of the 15 incubations, the measured ratio of 46N2O:45N2O production (0.38–0.67) was lower than the expected ratio produced by random pairing of N derived from with the isotope ratio 15FNH4+0 (expected 46N2O/45N2O = (15FNH4+0)2 / (2 × 15FNH4+0 × (1−15FNH4+0)) = 1.0 for the untreated-O2—untreated-pH and reduced-O2—untreated-pH incubations and 0.82 for the untreated-O2—reduced-pH and reduced-O2—reduced-pH incubations). Interestingly, Jung et al. (2014) also report relatively high 45N2O production compared to 46N2O production during tracer incubations of AOB and soil AOA cultures in the presence of 99% 15 and excess N.A. . Because they were working with laboratory cultures, their experiments started with almost no background 14 and contained no ammonium regenerating processes that would increase 14 over the course of the incubations, allowing them to attribute the 45N2O production to a reaction between 15-derived N and -derived N.
In the present study, incubations with 15 at the reduced pH produced lower ratios of 46N2O:45N2O than incubations at the untreated pH. Three factors may account for the difference: (1) the 15FNH4+_0 was lower among the reduced-pH incubations (0.62) than it was among incubations at the untreated pH (0.67), (2) there may have been differences in the regeneration rates of among experimental treatments, which would have progressively reduced the 15FNH4+ at different rates in the two different pH treatments, and (3) an increased contribution of N from an unlabeled N pool (i.e., exogenous ) enhanced 45N2O production. Although we lack knowledge of the evolution of 15FNH4+ during our experiments that would allow us to rule out factors (1) and (2), we can be certain that the more rapid production of 45N2O during the reduced-pH 15 incubations was at least partly the result of additional N-incorporation from exogenous , given the production of 45N2O in the 15-amended experiment (Figure 5D), and that this argues in favor of factor (3) discussed above.
Nitrifier denitrification is unlikely to have contributed to N2O production during the Lake Lugano experiments. During the 15 incubations with untreated-O2—reduced-pH and reduced-O2—reduced-pH, the formation of 45N2O and not 46N2O (Figures 5C,D) suggests that nitrifier denitrification was not important. Although cultured representatives of Nitrosospira, the most abundant AOB genus in the Lake Lugano, are known to contain norB homologs (Garbeva et al., 2007), whose enzyme products reduce NO to N2O during nitrifier denitrification reactions (Figure 1, yellow box; Schmidt et al., 2004; Kozlowski et al., 2014), the incubation conditions, such as the relatively high O2 concentrations (70 and 290 μM), were unlikely to have stimulated nitrifier denitrification. Rather, a hybrid N2O formation mechanism (Figure 1, pathway 2) that combines one N derived from exogenous with one N derived from a different, unlabeled N pool, explains the formation of 45N2O in the absence of 46N2O formation during the 15 incubations. Stieglmeier et al. (2014b) also observed hybrid N2O formation by AOA cultures, and have suggested that this other pool of N is NH2OH. NH2OH is known to form N2O in the presence of , both enzymatically (Hooper, 1968) and abiotically (Döring and Gehlen, 1961). Since both and NH2OH form in the periplasm (Hollocher et al., 1982), a reaction between these two compounds during the 15 incubations is also consistent with the relatively high rates of both 45N2O and 46N2O production (Figures 5A,B). However, without knowledge of 15FNH4+ over the course of the incubations, we cannot rule out formation of some 15N-N2O through NH2OH autoxidation or disproportionation (Figure 1, pathway 1). A third possibility is that two intracellular molecules react with each other to form N2O via nitrifier denitrification in a system where mixing between endogenous (i.e., periplasmic) and exogenous occurs so slowly that the two pools have distinct isotopic compositions. In the 15 incubations, nitrifier denitrification of the relatively 15N-enriched periplasmic would produce more 45N2O and 46N2O than we would predict based on the measured isotopic composition of the total . In the 15 incubations, nitrifier denitrification of periplasmic would mainly produce 44N2O, and only a small influx of exogenous 15 would be reduced to 45N2O after mixing with unlabeled periplasmic (as we observed during the reduced-pH incubations; Figure 5D). In this way, it would be possible for nitrifier denitrification to produce 45N2O and not 46N2O during the 15 incubations. We believe that this pathway is unlikely given the relatively high O2 concentrations in our incubations, but without more detailed knowledge of the size of the periplasmic pool maintained by the ammonia-oxidizing cells, and the rate at which this pool exchanges with the external pool, we cannot completely exclude the possibility of nitrifier denitrification.
Possible Explanations for the Influence of pH on N2O Production
Reducing the pH during the Lake Lugano incubations increased 15N2O production in both the 15 experiments and the 15 experiments. There may be several reasons for this, including structural (e.g., the outer cell membrane may exchange HNO2/ more rapidly between the periplasm and the outer environment at a lower pH), enzymatic (e.g., a shift toward the optimal pH of the N2O-producing enzymes in the periplasm), transcriptional (regulation of the genes encoding the enzymes involved in N2O production may be pH-sensitive), and chemical (due to acceleration in the rates of abiotic reactions that produce N2O from precursor molecules made by AOB). As discussed below, the most likely explanations are a shift toward the optimal pH of enzymes that catalyze N2O production and/or the involvement of a non-biological catalyst that accelerates the abiotic reactions that form N2O.
The majority of ammonia oxidizers in Lake Lugano are Gram-negative bacteria, which means that they have a periplasmic space that is bounded by inner and outer cell membranes. In other Gram-negative species such as Escherichia coli, the pH of the periplasm rapidly changes to reflect that of the external environment (Wilks and Slonczewski, 2007). To our knowledge, it is unknown whether AOB regulate the pH of their periplasm or not, but decreases in the periplasmic pH are likely to enhance the rates of the N2O-forming reactions of NH2OH and/or . Furthermore, if there are differences in the rate at which HNO2 vs. cross the outer cell membrane, as suggested by Hollocher et al. (1982), then a pH shift could also alter the rate at which 15N from the tracer 15 enters the periplasm and the rate at which the formed during ammonia oxidation is expelled from the periplasm into the outer environment. This effect would not necessarily change the actual rate of N2O production, just our ability to observe it with 15N tracers. However, if this occurs, it is unlikely to be the dominant effect, because we observed increased 15N-N2O production during the reduced-pH incubations with 15, and in this case, more rapid exchange of /HNO2 across the outer cell membrane in the reduced-pH incubations would dilute the periplasmic concentration of 15, and therefore decrease the rate of 15N-N2O production relative to total N2O production.
The results of the 15-incubations are consistent with an acceleration of the periplasmic reactions that form N2O. Formation of 46N2O, which is composed only of 15-derived N (and should therefore be relatively independent of any influx of external into the periplasm), was also faster at the reduced pH (Figure 5A). At the enzyme level, Hooper (1968) observed acceleration of N2O formation with decreasing pH: AOB enzyme extracts converted NH2OH + HNO2 to N2O with an optimum pH of 5.75, via a reaction whose rate increased steadily as the pH dropped from 7.5 to 6. Assuming that a similar reaction also occurs in intact AOB cells, the reaction rate increase observed by Hooper (1968) was large enough to explain the pH effect observed during the Lake Lugano incubations. Decreases in pH also have effects at the level of transcription and protein expression. For example expression of enzymes involved in handling nitrogen oxides in AOB, increases as the pH of the growth medium decreases from 8.2 to 7.2 (Beaumont et al., 2004a). The mechanism for this appears to depend on a transcriptional regulator whose repression is reversed by the presence of at lower pH values (Beaumont et al., 2004a).
Without some form of catalysis, the rate constants reported for the abiotic hybrid N2O formation reaction between NH2OH and are too small for these reactions to have contributed significantly to N2O production during our incubations. In particular, the set of reactions thought to produce N2O that contains one NH2OH-derived N and one HNO2-derived N, has a second-order dependence on [HNO2] (Döring and Gehlen, 1961; Bonner et al., 1983; Schreiber et al., 2012):
(Döring and Gehlen, 1961; Casado et al., 1983)
This rate-limiting step (i.e., Equation 10, the formation of NO by disproportionation of HNO2) becomes important at pH values <4.5 (Hooper, 1968), but it is not fast enough to explain 45N2O production during the incubations, given the low rate constant for HNO2 disproportionation and the low [HNO2] during the incubations (1.8 × 10⁻¹¹ M at the untreated pH and 4.0 × 10⁻¹¹ M at the reduced pH). Thus a role for a catalyst, whether enzymatic or non-biological, is indicated.
It is important to note that the NO reacting in Equation (11) may be formed through mechanisms other than the rate-limiting abiotic HNO2 disproportionation step. As mentioned earlier, a number of processes in ammonia oxidizers release NO. For example, nitrite reductases can convert to NO. In AOB, NO is an intermediate in the catalytic cycle of hydroxylamine oxido-reductase (HAO) (Cabail and Pacheco, 2003) and may be released from NH2OH in HAO enzyme preparations (Hooper and Nason, 1965; Ritchie and Nicholas, 1972; Hooper and Terry, 1979). In AOA, NO is needed to oxidize NH2OH to (Kozlowski et al., 2016). Abiotic reactions between NH2OH and NO observed by Bonner et al. (1978) (pH 7.8, anaerobic conditions), produced N2O that was ~75% composed of equal proportions of NH2OH-derived N and NO-derived N, and ~25% composed of only NO-derived N. If this reaction occurs during ammonia oxidation, then depending on whether NO is derived from NH2OH, , or both, these reactions could produce N2O that is entirely derived from NH2OH, or some mixture of hybrid N2O and N2O that is entirely derived from .
Chemodenitrification, the reduction of or coupled to oxidation of ferrous iron (Fe2+) (Buresh and Moraghan, 1976; Rakshit et al., 2008; Picardal, 2012) was an unlikely source of N2O during the Lake Lugano incubations. In the top 20 m of the lake, concentrations of metals involved in chemodenitrification (Fe and possibly manganese, Mn) were less than the 1.7 μM detection limit when measured by induction coupled plasma optical emission spectrometry (J. Tischer, U. Basel, unpublished data). Furthermore, the 15FNO2− values during incubations with 15 (Figure 4B) were high enough that if chemodenitrification of to N2O had been significant, the observed production of 45N2O (Figure 5C) would have been accompanied by detectable 46N2O production (Figure 5D), and it was not. The 15FNO3− values were lower than 15FNO2− values (Figure 4C), so that mixed reduction of both and by Fe2+ could explain detectable 45N2O production in the absence of detectable 46N2O production. However, reduction by Fe2+ is much slower than oxidation by , except when Cu2+ > 1.6 μM (Buresh and Moraghan, 1976; Picardal, 2012). We did not measure Cu concentrations in Lake Lugano, but the total dissolved Cu measured in Lake Greifen, a similarly eutrophic lake in northeastern Switzerland, were much lower than this (0.5–2.8 × 10⁻⁸ M; Xue and Sigg, 1993).
Although trace metal concentrations were low in Lake Lugano, metal ions could have played a role in accelerating the hybrid N2O reaction. Harper et al. (2015) have reported that Cu2+ can drive abiotic hybrid N2O formation rates in activated sludge that are faster than the biologically-catalyzed reactions. Furthermore, NH2OH disproportionation and oxidation reactions may be driven by the presence of copper and iron ions (Anderson, 1964; Alluisetti et al., 2004).
Evidence for Hybrid N2O Formation in the Namibian Upwelling Zone
The relationship between the changes in δ15N-N2O and δ18O-N2O during the Namibian Upwelling incubations were too small to convert to N2O production rates, but they still contain information about the mechanism of N2O formation. In particular, in light of the high degree of 15N labeling of the pool (15FNH4+_0 = 0.94) that was achieved during the 15 incubations, random pairing of -derived N atoms cannot explain the large increase in δ15N-N2O relative to δ18O-N2O. In the Supplementary Material S.2 we demonstrate that the change in δ15N-N2O relative to the change in δ18O-N2O observed during these incubations is not consistent with the formation of N2O composed only of N derived from . Specifically, N2O produced with a binomial distribution of 15N and 14N derived from with this 15FNH4+_0 would produce a much larger increase in δ18O-N2O (i.e., more 46N2O) relative to the increase in δ15N-N2O (45N2O) than what was observed. In contrast, hybrid N2O formation (for example, by reaction of highly 15N-labeled NH2OH with unlabeled NO or ) would produce a much larger increase in δ15N-N2O with almost no change in δ18O-N2O (Figure S3).
If hybrid N2O formation produced 45N2O during the 15 incubations, from which N pool was the 14N atom derived? 15N was more rapidly incorporated into N2O during the 15 incubations than during the 15 incubations, as indicated by the larger increase in δ15N-N2O (45N2O) during the 15 incubations (Table 2). If both and exogenous had contributed equally to N2O formation, then we would expect approximately equal increases in δ15N-N2O when either 15 or 15 was added (15FNO2−_0 = 0.95). The fact that the δ15N-N2O increased by less during the 15 incubations than during the 15 incubations suggests that exogenous could not have been the sole source of 14N to 45N2O produced during the 15 incubations. Possibly, an intracellular pool of unlabeled was held over from before the 15 incubation started. If there was enough of this holdover to dilute any endogenous 15 produced by 15 oxidation, then reactions between 15NH2OH with the holdover 14 would produce an increase in δ15N-N2O (45N2O) without increasing δ18O-N2O (46N2O).
Previous studies in aquatic systems have reported some variation in the importance of -derived N vs. -derived N to N2O production. Similar results to ours are reported for incubations of suboxic Black Sea water, where Westley et al. (2006) also found production of 15N-N2O with the addition of 15 but not 15. In the Eastern Tropical South Pacific, above the OMZ (O2 ≥ 10 μM), the rates of -derived N incorporation into N2O (0.01–0.02 nM/day) were similar to what was observed in Lake Lugano, although the yield (as defined in this paper) was substantially higher (80 × 10−5; Ji et al., 2015). In the North Pacific Gyre, Wilson et al. (2014) observed no changes in δ15N-N2O during incubations with either 1 μM NA + 1 μM 15 or 1 μM 15 + 1 μM NA . Critically, however, when they reduced the NA addition to 100 nM and added 1 μM 15, the δ15N-N2O increased significantly over the course of the incubation. This suggests that the rate of ammonia oxidation influences the degree to which N derived from exogenous can be incorporated into N2O, with higher rates of ammonia oxidation perhaps flooding the intracellular pool and preventing N derived from exogenous from being incorporated into N2O.
It is difficult at this point to determine whether the same hybrid N2O reaction mechanism(s) can explain the results of both the Lake Lugano incubations, which were numerically dominated by AOB, and the Namibian Upwelling incubations, which were dominated by AOA. To date, it is not known whether AOA enzymes also catalyze the reaction between NH2OH and (Figure 1, pathway 2) as observed for AOB by Hooper (1968). The original AOB periplasmic enzyme complex purified in that study included HAO as well as other enzyme components. No homologs of hao have been identified in AOA genomes, though alternatives have been proposed (Stahl and de la Torre, 2012). Furthermore, if a periplasmic reservoir of plays a role in the incorporation of -derived N into N2O, as we hypothesize here, then differences in the permeability of the outer membranes/cell walls of AOB vs. AOA could contribute to differences in the degree to which N derived from vs. exogenous contribute to N2O formation. Unlike AOB, almost all archaea tested have only a single cell membrane bounding the cytoplasm (Albers and Meyer, 2011). Rather than having an outer membrane, AOA have an S-layer protein cell wall separating a pseudo-periplasm from the surrounding environment (Stieglmeier et al., 2014a). Model predictions of AMO protein structure in the soil AOA Candidatus Nitrosotalea devanterra suggest that the membrane-bound enzyme faces outward into the pseudoperiplasm (Lehtovirta-Morley et al., 2016). For future reference during 15N tracer studies of N2O production, it would be helpful to confirm that NH2OH and both form in the pseudoperiplasm of AOA, and investigate what controls the rates at which exogenous enters, and periplasmic exits, this compartment.
A Putative Link to O2
During both the Lake Lugano and Namibian Upwelling incubations, more 15N-N2O was produced at the reduced-O2 concentrations (O2 = 70 and 20 μM, respectively) than at the untreated-O2 concentrations (O2 = 290 and 220 μM, respectively). It is well known that N2O yields by AOB increase during growth at suboxic O2 concentrations (Goreau et al., 1980), and previous work on the mechanisms causing this increase implicated induction of the nitrifier denitrification pathway at very low O2 concentrations (e.g., Frame and Casciotti, 2010). Reducing O2 from 290 to 70 μM in the Lake Lugano incubations nearly tripled the yield of 45N2O and 46N2O during the 15 incubations. However, the reason for this increase was probably not increased nitrifier denitrification, since there was no 46N2O production during any of the incubations with 15 (Figure 5C).
The mechanism conferring this O2 sensitivity may not necessarily involve direct regulation of enzyme activity. In particular, NO removal by O2 is a possible abiotic NO-sink that would become more important at higher O2 and NO concentrations:
Once NO2 is formed, in aqueous solutions it tends to react with water to form and (Park and Lee, 1988), or react with NO to form N2O3 (Grätzel et al., 1970). Martens-Habbena et al. (2015) measured NO concentrations of ~50–80 nM during oxic incubations of N. maritimus with 10 μM . If similar NO concentrations were produced during incubations in the present study, liquid-phase reactions between NO and O2 may deplete NO concentrations significantly, with the rate of depletion increasing in proportion to [O2] as well as [NO]2. Thus, abiotic reaction with O2 may compete for NO with N2O-forming reactions that also consume NO, particularly when incubation O2 concentrations are high.
Like O2, NO tends to partition into the gas phase over the aqueous phase (Schwartz and White, 1981). If it is NO (aq), rather than , that participates in biological hybrid N2O formation, an implication is that inclusion of a headspace during incubations of ammonia oxidizers suspended in water will reduce aqueous NO concentrations, and therefore slow down liquid-phase NO-dependent reactions (such as the reaction of NO with NH2OH to form N2O). Differences in aqueous NO concentrations might contribute to the discrepancy in the literature over whether reduced-O2 growth conditions increase the yields of N2O produced by AOA (e.g., Löscher et al., 2012; Stieglmeier et al., 2014b), particularly if there is variation in aeration procedures and ratios of headspace to liquid volumes.
Conclusions
Previous studies have shown that decreases in pH can increase N2O production by AOB cultures (e.g., Jiang and Bakken, 1999a) but did not separate the effect of pH-dependent NH3 limitation from the influence of pH on the N2O production mechanisms. Here we have shown that acidification enhances the N2O yields of ammonia oxidizers even when it does not substantially change the ammonia oxidation rates. We have demonstrated that hybrid N2O formation (i.e., the combination of - and -derived N) occurs among the Nitrosospira-dominated ammonia oxidizer community in the shallow hypolimnion of Lake Lugano and that this mechanism contributes to the increased yield of N2O under acidified conditions. The -derived reactant in this hybrid N2O production pathway is probably NH2OH, while the -derived reactant could be one of several inter-convertible nitrogen oxides (/HNO2, NO, N2O3). Our results suggest that nitrifier denitrification was not an important source of N2O in this environment. While N derived from exogenous contributed significantly to N2O formation under acidified conditions, N derived from was always a more important contributor to N2O. Finally, we report preliminary isotopic evidence that hybrid N2O formation also occurs among the subsurface AOA-dominated nitrifier community present in the Namibian Upwelling zone.
Our results are not necessarily predictive of the long-term influence of acidification on N2O production by ammonia oxidizers, since acidification may also change ammonia oxidizer community composition (Bowen et al., 2013) and pH decreases may have cascading chemical and biological effects in lake and ocean ecosystems. However, our results are applicable to environments that experience rapid changes in pH such as stratified lakes that undergo episodic mixing or rapid influx of acidified precipitation, and ocean upwelling zones where CO2-rich, low-pH deeper water may enhance N2O production when it comes in contact with shallower ammonia-oxidizing communities.
Author Contributions
CF conceived of and performed experiments. EL and EN analyzed and interpreted genetic sequence data. TG provided instrumentation support and sample analysis. CF and ML performed chemical data analysis and interpretation. All authors contributed to writing this paper.
Conflict of Interest Statement
The authors declare that the research was conducted in the absence of any commercial or financial relationships that could be construed as a potential conflict of interest.
Acknowledgments
We would like to thank Marco Simona and Mauro Veronesi for sampling assistance on Lake Lugano. We also thank the captain, crew, and chief scientist Volker Morholtz during cruise M103 of the R/V Meteor, Thomas Kuhn for IRMS technical assistance, Ryan Percifeld for assistance with multiplex sequencing. Kai Udert provided helpful discussion. Funding was provided by grants from the Freiwillige Akademische Gesellschaft of Basel (CF), the Swiss National Science Foundation NUW1530 (ML), the National Institutes of Health West Virginia IDeA Network of Biomedical Research Excellence (WV-INBRE, Award# 2P20GM103434-14), and the West Liberty University Faculty Development Fund (EL).
Supplementary Material
The Supplementary Material for this article can be found online at: http://journal.frontiersin.org/article/10.3389/fmicb.2016.02104/full#supplementary-material
Footnotes
1. ^For clarity in this paper, we will reserve the term nitrifier denitrification for this specific chain of enzymatic reactions and will not use it for other forms of reductive N incorporation from into N2O.
References
Albers, S.-V., and Meyer, B. H. (2011). The archaeal cell envelope. Nat. Rev. Microbiol. 9, 414–426. doi: 10.1038/nrmicro2576
Allison, S. M., and Prosser, J. I. (1993). Ammonia oxidation at low pH by attached populations of nitrifying bacteria. Soil Biol. Biochem. 25, 935–941. doi: 10.1016/0038-0717(93)90096-T
Alluisetti, G. E., Almaraz, A. E., Amorebieta, V. T., Doctorovich, F., and Olabe, J. A. (2004). Metal-catalyzed anaerobic disproportionation of hydroxylamine. Role of diazene and nitroxyl intermediates in the formation of N2, N2O, NO+, and NH3. J. Am. Chem. Soc. 126, 13432–13442. doi: 10.1021/ja046724i
Altschul, S. F., Gish, W., Miller, W., Myers, E. W., and Lipman, D. J. (1990). Basic local alignment search tool. J. Mol. Biol. 215, 403–410. doi: 10.1016/S0022-2836(05)80360-2
Anderson, J. H. (1964). The copper-catalysed oxidation of hydroxylamine. Analyst 89, 357–362. doi: 10.1039/an9648900357
Awad, H. H., and Stanbury, D. M. (1993). Autoxidation of NO in aqueous solution. Int. J. Chem. Kinet. 25, 375–381. doi: 10.1002/kin.550250506
Bayer, B., Vojvoda, J., Offre, P., Alves, R. J., Elisabeth, N. H., Garcia, J. A., et al. (2016). Physiological and genomic characterization of two novel marine thaumarchaeal strains indicates niche differentiation. ISME J. 10, 1051–1063. doi: 10.1038/ismej.2015.200
Beaumont, H. J., Lens, S. I., Reijnders, W. N., Westerhoff, H. V., and van Spanning, R. J. M. (2004a). Expression of nitrite reductase in Nitrosomonas europaea involves NsrR, a novel nitrite-sensitive transcription repressor. Mol. Microbiol. 54, 148–158. doi: 10.1111/j.1365-2958.2004.04248.x
Beaumont, H. J., van Schooten, B., Lens, S. I., Westerhoff, H. V., and van Spanning, J. M. (2004b). Nitrosomonas europaea expresses a nitric oxide reductase during nitrification. J. Bacteriol. 186, 4417–4421. doi: 10.1128/JB.186.13.4417-4421.2004
Beman, J. M., Chow, C. E., King, A. L., Feng, Y., and Fuhrman, J. A. (2011). Global declines in oceanic nitrification rates as a consequence of ocean acidification. Proc. Natl. Acad. Sci. U.S.A. 108, 208–213. doi: 10.1073/pnas.1011053108
Benson, D. A., Clark, K., Karsh-Mizrachi, I., Lipman, D. J., Ostell, J., and Sayers, E. W. (2015). GenBank. Nucleic Acids Res. 43:D30–D35. doi: 10.1093/nar/gku1216
Blees, J., Niemann, H., Wenk, C. B., Zopfi, J., Schubert, C. J., Jenzer, J. S., et al. (2014). Bacterial methanotrophs drive the formation of a seasonal anoxic benthic nepheloid layer in an alpine lake. Limnol. Oceanogr. 59, 1410–1420. doi: 10.4319/lo.2014.59.4.1410
Bonner, F. T., Dzelzkalns, L. S., and Bonucci, J. A. (1978). Properties of nitroxyl as intermediate in the nitric oxide-hydroxylamine reaction and in trioxodinitrate decomposition'. Inorg. Chem. 17, 2487–2494. doi: 10.1021/ic50187a030
Bonner, F. T., Kada, J., and Phelan, K. G. (1983). Symmetry of the intermediate in the hydroxylamine-nitrous acid reaction. Inorg. Chem. 22, 1389–1391. doi: 10.1021/ic00151a024
Bowen, J. L., Kearns, P. J., Holcomb, M., and Ward, B. B. (2013). Acidification alters the composition of ammonia-oxidizing microbial assemblages in marine mescosms. Mar. Ecol. Prog. Ser. 492, 1–8. doi: 10.3354/meps10526
Braman, R. S., and Hendrix, S. A. (1989). Nanogram nitrite and nitrate determination in environmental and biological materials by Vanadium(III) reduction with chemi-luminescence detection. Anal. Chem. 61, 2715–2718. doi: 10.1021/ac00199a007
Brea, S., Alvarez-Salgado, X. A., Alvarez, M., Perez, F. F., Memery, L., Mercier, H., et al. (2004). Nutrient mineralization rates and ratios in the eastern South Atlantic. J. Geophys. Res. 109, doi: 10.1029/2003jc002051
Buresh, R. J., and Moraghan, J. T. (1976). Chemical reduction of nitrate by ferrous iron. J. Environ. Qual. 5, 320–325. doi: 10.2134/jeq1976.00472425000500030021x
Cabail, M. Z., and Pacheco, A. A. (2003). Selective one-electron reduction of Nitrosomonas europaea hydroxylamine oxidoreductase with nitric oxide. Inorg. Chem. 42, 270–272. doi: 10.1021/ic025779n
Caporaso, J. G., Kuczynski, J., Stombaugh, J., Bittinger, K., Bushman, F. D., and Costello, E. K. (2010). QIIME allows analysis of high-throughput community sequencing data. Nat. Methods 7, 335–336. doi: 10.1038/nmeth.f.303
Caporaso, J. G., Lauber, C. L., Walters, W. A., Berg-Lyons, D., Huntley, J., and Fierer, N. (2012). Ultra-high-throughput microbial community analysis on the Illumina HiSeq and MiSeq platforms. ISME J. 6, 1621–1624. doi: 10.1038/ismej.2012.8
Caporaso, J. G., Lauber, C. L., Walters, W. A., Berg-Lyons, D., Lozupone, C. A., Turnbaugh, P. J., et al. (2011). Global patterns of 16S rRNA diversity at a depth of millions of sequences per sample. Proc. Nat. Acad. Sci. U.S.A. 108(Suppl. 1), 4516–4522. doi: 10.1073/pnas.1000080107
Casado, J., Castro, A., Ramón Leis, J., López Quintela, A., and Mosquera, M. (1983). Kinetic studies on the formation of N-nitroso compounds VI. The reactivity of N2O3 as a nitrosating agent. Monatshefte Chem. 114, 639–646. doi: 10.1007/BF01134177
Casciotti, K. L., Bohlke, J. K., McIlvin, M. R., Mroczkowski, S. J., and Hannon, J. E. (2007). Oxygen isotopes in nitrite: analysis, calibration, and equilibration. Anal. Chem. 79, 2427–2436. doi: 10.1021/ac061598h
Casciotti, K. L., Sigman, D. M., and Ward, B. B. (2003). Linking diversity and stable isotope fractionation in ammonia-oxidizing bacteria. Geomicrobiol. J. 20, 335–353. doi: 10.1080/01490450303895
Casciotti, K. L., Sigman, D. M., Galanter Hastings, M., Böhlke, J. K., and Hilkert, A. (2002). Measurement of the oxygen isotopic composition of nitrate in seawater and freshwater using the denitrifier method. Anal. Chem. 74, 4905–4912. doi: 10.1021/ac020113w
Casciotti, K. L., Trull, T. W., Glover, D. M., and Davies, D. (2008). Constraints on nitrogen cycling at the subtropical North Pacific Station ALOHA from isotopic measurements of nitrate and particulate nitrogen. Deep Sea Res. Part II Top. Stud. Oceanogr. 55, 1661–1672. doi: 10.1016/j.dsr2.2008.04.017
Dalsgaard, T., Stewart, F. J., Thamdrup, B., De Brabandere, L., Revsbech, N. P., and Ulloa, O. (2014). Oxygen at nanomolar levels reversibly suppresses process rates and Gene expression in anammox and denitrification in the oxygen minimum zone off northern Chile. MBio 5, 1–14. doi: 10.1128/mBio.01966-14
DeSantis, T. Z., Hugenholtz, P., Larsen, N., Rojas, M., Brodie, E. L., Keller, K., et al. (2006). Greengenes, a chimera-checked 16S rRNA gene database and workbench compatible with ARB. Appl. Environ. Microbiol. 72, 5069–5072. doi: 10.1128/AEM.03006-05
Döring, V. C., and Gehlen, H. (1961). Über die Kinetic der Reaktionzwischen Hydroxylamin und Salpetriger Säure. Z. Anorg. Allg. Chem. 312, 32–44. doi: 10.1002/zaac.19613120106
Edgar, R. C. (2010). Search and clustering orders of magnitude faster than BLAST. Bioinformatics 26, 2460–2461. doi: 10.1093/bioinformatics/btq461
Edgar, R. C., Haas, B. J., Clemente, J. C., Quince, C., and Knight, R. (2011). UCHIME improves sensitivity and speed of chimera detection. Bioinformatics 27, 2194–2200. doi: 10.1093/bioinformatics/btr381
Frame, C. H., and Casciotti, K. L. (2010). Biogeochemical controls and isotopic signatures of nitrous oxide production by a marine ammonia-oxidizing bacterium. Biogeosciences 7, 2695–2709. doi: 10.5194/bg-7-2695-2010
Frame, C., Deal, E., Nevison, C. D., and Casciotti, K. L. (2014). N2O production in the eastern South Atlantic: Analysis of N2O stable isotopic and concentration data. Global Biogeochem. Cycles 28, 1262–1278. doi: 10.1002/2013GB004790
Freymond, C. V., Wenk, C. B., Frame, C. H., and Lehmann, M. F. (2013). Year-round N2O production by benthic NOx reduction in a monomictic south-alpine lake. Biogeosciences 10, 8373–8383. doi: 10.5194/bg-10-8373-2013
Garbeva, P., Baggs, E. M., and Prosser, J. I. (2007). Phylogeny of nitrite reductase (nirK) and nitric oxide reductase (norB) genes from Nitrosospira species isolated from soil. FEMS Microbiol. Lett. 266, 83–89. doi: 10.1111/j.1574-6968.2006.00517.x
Goreau, T. J., Kaplan, W. A., Wofsy, S. C., McElroy, M. B., Valois, F. W., and Watson, S. W. (1980). Production of and N2O by nitrifying bacteria at reduced concentrations of oxygen. Appl. Environ. Microbiol. 40, 526–532.
Granger, J., and Sigman, D. M. (2009). Removal of nitrite with sulfamic acid for nitrate N and O isotope analysis with the denitrifier method. Rapid Commun. Mass Spectrom. 23, 3753–3762. doi: 10.1002/rcm.4307
Granger, J., Sigman, D. M., Prokopenko, M. G., Lehmann, M. F., and Tortell, P. D. (2006). A method for nitrite removal in nitrate N and O isotope analyses. Limnol. Oceanogr. Methods 4, 204–212. doi: 10.4319/lom.2006.4.205
Grätzel, M., Taniguchi, S., and Henglein, A. (1970). Pulse radiolytic investigation of NO oxidation and the equilibrium N2O3 = NO + NO2 in aqueous solution. Ber. Bunsenges. 73, 488–492.
Hallam, S. J., Mincer, T. J., Schleper, C., Preston, C. M., Roberts, K., Richardson, P. M., et al. (2006). Pathways of carbon assimilation and ammonia oxidation suggested by environmental genomic analyses of marine Crenarchaeota. PLoS Biol. 4:e95. doi: 10.1371/journal.pbio.0040095
Harper, W. F. Jr., Takeuchi, Y., Riya, S., Hosomi, M., and Terada, A. (2015). Novel abiotic reactions increase nitrous oxide production during partial nitrification: modeling and experiments. Chem. Eng. J. 281, 1017–1023. doi: 10.1016/j.cej.2015.06.109
Heil, J., Wolf, B., Bru, N., Emmenegger, L., Vereecken, H., and Mohn, J. (2014). Site-specific N isotopic signatures of abiotically produced N2O. Geochim. Cosmochim. Acta 139, 72–82. doi: 10.1016/j.gca.2014.04.037
Hermes, J. D., Weiss, P. M., and Cleland, W. W. (1985). Use of nitrogen-15 and deuterium isotope effects to determine the chemical mechanism of phenylalanine ammonia-lyase. Biochemistry 24, 2959–2967. doi: 10.1021/bi00333a023
Hofman, B. Y. T., and Lees, H. (1953). The biochemistry of the nitrifying organisms. Biochem. J. 54, 579–583. doi: 10.1042/bj0540579
Hoglen, J., and Hollocher, T. C. (1989). Purification and some characteristics of nitric oxide reductase-containing vesicles from Paracoccus denitrificans. J. Biol. Chem. 264, 7556–7563.
Hollocher, T. C., Kumar, S., and Nicholas, D. J. (1982). Respiration-dependent proton translocation in Nitrosomonas europaea and its apparent absence in Nitrobacter agilis during inorganic oxidations. J. Bacteriol. 149, 1013–1020.
Holmes, R. M., Aminot, A., and Kerouel, R. (1999). A simple and precise method for measuring ammonium in marine and freshwater ecosystems. Can. J. Fish. Aquat. Sci. 56, 1801–1808. doi: 10.1139/f99-128
Hooper, A. B. (1968). A nitrite-reducing enzyme from Nitrosomonas europaea preliminary characterization with hydroxylamine as electron donor. Biochem. J. 162, 49–65. doi: 10.1016/0005-2728(68)90213-2
Hooper, A. B., and Nason, A. (1965). Characterization of hydroxylamine-cytochrome c reductase from the chemoautotrophs Nitrosomonas europaea and Nitrosocystis oceanus. J. Biol. Chem. 240, 4044–4057.
Hooper, A. B., and Terry, K. R. (1979). Hydroxylamine oxidoreductase of Nitrosomonas: production of nitric oxide from hydroxylamine. Biochim. Biophys. Acta 571, 12–20. doi: 10.1016/0005-2744(79)90220-1
Horak, R. E., Qin, W., Schauer, A. J., Armbrust, E. V., Ingalls, A. E., Moffett, J. W., et al. (2013). Ammonia oxidation kinetics and temperature sensitivity of a natural marine community dominated by Archaea. ISME J. 7, 2023–2033. doi: 10.1038/ismej.2013.75
Iwasaki, H., Shidara, S., Suzuki, H., and Mor, T. (1963). Studies on denitrification. VII. Further purification and properties of denitrifying enzyme. J. Biochem. 53, 299–303.
Ji, Q., Babbin, A. R., Jayakumar, A., Oleynik, S., and Ward, B. B. (2015). Nitrous oxide production by nitrification and denitrification in the Eastern Tropical South Pacific oxygen minimum zone. Geophys. Res. Lett. 42, 10755–10764. doi: 10.1002/2015GL066853
Jiang, Q. Q., and Bakken, L. R. (1999a). Comparison of Nitrosospira strains isolated from terrestrial environments. FEMS Microbiol. Ecol. 30, 171–186. doi: 10.1111/j.1574-6941.1999.tb00646.x
Jiang, Q.-Q., and Bakken, L. R. (1999b). Nitrous oxide production and methane oxidation by different ammonia-oxidizing bacteria. Appl. Environ. Microbiol. 65, 2679–2684.
Jung, M.-Y., Well, R., Min, D., Giesemann, A., Park, S.-J., Kim, J.-G., et al. (2014). Isotopic signatures of N2O produced by ammonia-oxidizing archaea from soils. ISME J. 8, 1115–1125. doi: 10.1038/ismej.2013.205
Keener, W. K., and Arp, D. J. (1993). Kinetic studies of ammonia monooxygenase inhibition in Nitrosomonas europaea by hydrocarbons and halogenated hydrocarbons in an optimized whole-cell assay. Appl. Environ. Microbiol. 59, 2501–2510.
Kim, C., and Hollocher, T. C. (1984). Catalysis of nitrosyl transfer reactions by a dissimilatory nitrite reductase (cytochrome c, d1). J. Biol. Chem. 259, 2092–2099.
Kindt, R., and Coe, R. (2005). A Manual and Software for Common Statistical Methods for Ecological and Biodiversity Studies. Nairobi: World Agroforestry Centre (ICRAF).
Kitidis, V., Laverock, B., McNeill, L. C., Beesley, A., Cummings, D., Tait, K., et al. (2011). Impact of ocean acidification on benthic and water column ammonia oxidation. Geophys. Res. Lett. 38, 2–6. doi: 10.1029/2011GL049095
Knowles, G., Downing, A. L., and Barrett, M. J. (1965). Determination of kinetic constants for nitrifying bacteria in mixed culture, with the aid of an electronic computer. J. Gen. Microbiol. 38, 268–278. doi: 10.1099/00221287-38-2-263
Kozich, J. J., Westcott, S. L., Baxter, N. T., Highlander, S. K., and Schloss, P. D. (2013). Development of a dual-index sequencing strategy and curation pipeline for analyzing amplicon sequence data on the MiSeq Illumina sequencing platform. Appl. Environ. Microbiol. 79, 5112–5120. doi: 10.1128/AEM.01043-13
Kozlowski, J. A., Price, J., and Stein, L. Y. (2014). Revision of N2O-producing pathways in the ammonia-oxidizing bacterium Nitrosomonas europaea ATCC 19718. Appl. Environ. Microbiol. 80, 4930–4935. doi: 10.1128/aem.01061-14
Kozlowski, J. A., Stieglmeier, M., Schleper, C., Klotz, M. G., and Stein, L. Y. (2016). Pathways and key intermediates required for obligate aerobic ammonia-dependent chemolithotrophy in bacteria and Thaumarchaeota. ISME J. 10, 1836–1845. doi: 10.1038/ismej.2016.2
Kumar, S., Stecher, G., and Tamura, K. (2016). MEGA7: Molecular Evolutionary Genetics Analysis version 7.0 for bigger datasets. Mol. Biol. Evol. 33, 1870–1874. doi: 10.1093/molbev/msw054
Lau, E., Iv, E. J., Dillard, Z. W., Dague, R. D., Semple, A. L., and Wentzell, W. L. (2015). High throughput sequencing to detect differences in methanotrophic Methylococcaceae and Methylocystaceae in surface peat, forest soil, and Sphagnum moss in Cranesville Swamp Preserve, West Virginia, USA. Microorganisms 3, 113–136. doi: 10.3390/microorganisms3020113
Lehmann, M. F., Bernasconi, S. M., McKenzie, J. A., Berbieri, A., Simona, M., and Veronesi, M. (2004). Seasonal variation of the 13C and 15N of particulate and dissolved carbon and nitrogen in Lake Lugano: constraints on biogeochemical cycling in a eutrophic lake. Limnol. Oceanogr. 49, 415–429. doi: 10.4319/lo.2004.49.2.0415
Lehtovirta-Morley, L. E., Sayavedra-Soto, L. A., Gallois, N., Schouten, S., Stein, L. Y., Prosser, J. I., et al. (2016). Identifying potential mechanisms enabling acidophily in the ammonia-oxidizing archaeon ‘Candidatus Nitrosotalea devanterra.’ Appl. Environ. Microbiol. 82, 2608–2619. doi: 10.1128/AEM.04031-15
Lehtovirta-Morley, L. E., Stoecker, K., Vilcinskas, A., Prosser, J. I., and Nicol, G. W. (2011). Cultivation of an obligate acidophilic ammonia oxidizer from a nitrifying acid soil. Proc. Natl. Acad. Sci. U.S.A. 108, 15892–15897. doi: 10.1073/pnas.1107196108
Löscher, C. R., Kock, A., Könneke, M., LaRoche, J., Bange, H. W., and Schmitz, R. A. (2012). Production of oceanic nitrous oxide by ammonia-oxidizing archaea. Biogeosciences 9, 2419–2429. doi: 10.5194/bg-9-2419-2012
Lynch, M. D. J., Masella, A. P., Hall, M. W., Bartram, A. K., and Neufeld, J. D. (2013). AXIOME: automated exploration of microbial diversity. Gigascience 2. doi: 10.1186/2047-217X-2-3
Martens-Habbena, W., Berube, P. M., Urakawa, H., de la Torre, J. R., and Stahl, D. A. (2009). Ammonia oxidation kinetics determine niche separation of nitrifying Archaea and Bacteria. Nature 461, 976–981. doi: 10.1038/nature08465
Martens-Habbena, W., Qin, W., Horak, R. E. A., Urakawa, H., Schauer, A. J., Moffett, J. W., et al. (2015). The production of nitric oxide by marine ammonia-oxidizing archaea and inhibition of archaeal ammonia oxidation by a nitric oxide scavenger. Environ. Microbiol. 17, 2261–2274. doi: 10.1111/1462-2920.12677
Martikainen, P. J. (1985). Nitrous oxide emission associated with autotrophic ammonium oxidation in acid coniferous forest soil. Appl. Environ. Microbiol. 50, 1519–1525.
Masella, A. P., Bartram, A. K., Truszkowski, J. M., Brown, D. G., and Neufeld, J. D. (2012). PANDAseq: paired-end assembler for Illumina sequences. BMC Bioinformatics 13:31. doi: 10.1186/1471-2105-13-31
McIlvin, M. R., and Altabet, M. A. (2005). Chemical conversion of nitrate and nitrite to nitrous oxide for nitrogen and oxygen isotopic analysis in freshwater and seawater. Anal. Chem. 77, 5589–5595. doi: 10.1021/ac050528s
McIlvin, M. M., and Casciotti, K. L. (2010). Fully automated system for stable isotopic analyses of dissolved nitrous oxide at natural abundance levels. Limnol. Oceanogr. Methods 8, 54–66. doi: 10.4319/lom.2010.8.54
Mengis, M., Gächter, R., and Wehrli, B. (1997). Sources and sinks of nitrous oxide (N2O) in deep lakes. Biogeochemistry 38, 281–301. doi: 10.1023/A:1005814020322
Moews, P. C., and Audrieth, L. F. (1959). The autoxidation of hydroxylamine. J. Inorg. Nucl. Chem. 11, 242–246. doi: 10.1016/0022-1902(59)80250-5
Mohn, J., Tuzson, B., Manninen, A., Yoshida, N., Toyoda, S., Brand, W. A., et al. (2012). Site selective real-time measurements of atmospheric N2O isotopomers by laser spectroscopy. Atmos. Meas. Tech. 5, 1601–1609. doi: 10.5194/amt-5-1601-2012
Mohn, J., Wolf, B., Toyoda, S., Lin, C.-T., Liang, M.-C., Brüggemann, N., et al. (2014). Interlaboratory assessment of nitrous oxide isotopomer analysis by isotope ratio mass spectrometry and laser spectroscopy: current status and perspectives. Rapid Commun. Mass Spectrom. 28, 1995–2007. doi: 10.1002/rcm.6982
Morel, F. M. M., Milligan, A. J., and Saito, M. A. (2003). “Marine bioinorganic chemistry: the role of trace metals in the oceanic cycles of major nutrients,” in Treatise on Geochemistry, Vol. 6, ed H. Elderfield (Cambridge: Elsevier), 113–143.
Newell, S. E., Fawcett, S. E., and Ward, B. B. (2013). Depth distribution of ammonia oxidation rates and ammonia-oxidizer community composition in the Sargasso Sea. Limnol. Oceanogr. 58, 1491–1500. doi: 10.4319/lo.2013.58.4.1491
Nicholls, J. C., Davies, C. A., and Trimmer, M. (2007). High-resolution profiles and nitrogen isotope tracing reveal a dominant source of nitrous oxide and multiple pathways of nitrogen gas formation in the central Arabian Sea. Limnol. Oceanogr. 52, 156–168. doi: 10.4319/lo.2007.52.1.0156
Nicol, G. W., Leininger, S., Schleper, C., and Prosser, J. I. (2008). The influence of soil pH on the diversity, abundance and transcriptional activity of ammonia oxidizing archaea and bacteria. Environ. Microbiol. 10, 2966–2978. doi: 10.1111/j.1462-2920.2008.01701.x
Pacheco, A. A., McGarry, J., and Kostera, J. (2011). Techniques for investigating hydroxylamine disproportionation by hydroxylamine oxidoreductases. Methods Enzymol. 486, 447–463. doi: 10.1016/B978-0-12-381294-0.00020-1
Park, J. Y., and Lee, Y. N (1988). Solubility and decomposition kinetics of nitrous acid in aqueous solution. J. Phys. Chem. 92, 6294. doi: 10.1021/j100333a025
Park, S., and Bae, W. (2009). Modeling kinetics of ammonium oxidation and nitrite oxidation under simultaneous inhibition by free ammonia and free nitrous acid. Process Biochem. 44, 631–640. doi: 10.1016/j.procbio.2009.02.002
Picardal, F. (2012). Abiotic and microbial interactions during anaerobic transformations of Fe(II) and NOx-. Front. Microbiol. 3:112. doi: 10.3389/fmicb.2012.00112
Poth, M., and Focht, D. D. (1985). 15N kinetic analysis of N2O production by Nitrosomonas europaea: an examination of nitrifier denitrification. Appl. Environ. Microb. 49, 1134–1141.
Qin, W., Amin, S. A., Martens-Habbena, W., Walker, C. B., Urakawa, H., and Devol, A. H. (2014). Marine ammonia-oxidizing archaeal isolates display obligate mixotrophy and wide ecotypic variation. Proc. Natl. Acad. Sci. U.S.A. 111, 12504–12509. doi: 10.1073/pnas.1324115111
Rakshit, S., Krause, F., and Voordouw, G. (2008). Nitrite Reduction by siderite. Soil Sci. Soc. Am. J. 72, 1070–1077. doi: 10.2136/sssaj2007.0296
Rees, A. P., Brown, I. J., Jayakumar, A., and Ward, B. B. (2016). The inhibition of N2O production by ocean acidification in cold temperate and polar waters. Deep Sea Res. I 127, 93–101. doi: 10.1016/j.dsr2.2015.12.006
Riordan, E., Minogue, N., Healy, D., O'Driscoll, P., and Sodeau, J. R. (2005). Spectroscopic and optimization modeling study of nitrous acid in aqueous solution. J. Phys. Chem. 109, 779–786. doi: 10.1021/jp040269v
Ritchie, G. A., and Nicholas, D. J. (1972). Identification of the sources of nitrous oxide produced by oxidative and reductive processes in Nitrosomonas europaea. Biochem. J. 126, 1181–1191. doi: 10.1042/bj1261181
Robert-Baldo, G. L., Morris, M. J., and Byrne, R. H. (1985). Spectrophotometric determination of seawater pH using phenol red. Anal. Chem. 57, 2564–2567. doi: 10.1021/ac00290a030
Santoro, A. E., Buchwald, C., McIlvin, M. R., and Casciotti, K. L. (2011). Isotopic signature of N2O produced by marine ammonia-oxidizing archaea. Science 333, 1282–1285. doi: 10.1126/science.1208239
Santoro, A. E., Dupont, C. L., Richter, R. A., Craig, M. T., Carini, P., McIlvin, M. R., et al. (2015). Genomic and proteomic characterization of “Candidatus Nitrosopelagicus brevis”: an ammonia-oxidizing archaeon from the open ocean. Proc. Natl. Acad. Sci. U.S.A. 112, 1173–1178. doi: 10.1073/pnas.1416223112
Schmidt, I., and Bock, E. (1997). Anaerobic ammonia oxidation with nitrogen dioxide by Nitrosomonas eutropha. Arch. Microbiol. 167, 106–111. doi: 10.1007/s002030050422
Schmidt, I., Hermelink, C., van de Pas-schoonen, K., Strous, M., Den Camp, H. J., Kuenen, J. G., and Jetten, M. S. M. (2002). Anaerobic ammonia oxidation in the presence of nitrogen oxides (NOx) by two different lithotrophs. Appl. Environ. Microbiol. 68, 5351–5357. doi: 10.1128/AEM.68.11.5351-5357.2002
Schmidt, I., van Spanning, R. J., and Jetten, M. S. (2004). Denitrification and ammonia oxidation by Nitrosomonas europaea wild-type, and NirK- and NorB-deficient mutants. Microbiology 150, 4107–4114. doi: 10.1099/mic.0.27382-0
Scholz, F., Löscher, C. R., Fiskal, A., Sommer, S., Hensen, C., Lomnitz, U., et al. (2016). Nitrate-dependent iron oxidation limits iron transport in anoxic ocean regions. Earth Planet. Sci. Lett. 454, 272–281. doi: 10.1016/j.epsl.2016.09.025
Schreiber, F., Wunderlin, P., Udert, K. M., and Wells, G. F. (2012). Nitric oxide and nitrous oxide turnover in natural and engineered microbial communities: biological pathways, chemical reactions, and novel technologies. Front. Microbiol. 3:372. doi: 10.3389/fmicb.2012.00372
Schwartz, S. E., and White, W. H. (1981). “Solubility equilibria of the nitrogen oxides and oxyacids in dilute aqueous solution,” in Advances in Environmental Science and Engineering, Vol. 4, eds J. R. Pfafflin and E. N. Ziegler (New York, NY: Gordon and Breach), 1–45.
Shen, T., Stieglmeier, M., Dai, J., Urich, T., and Schleper, C. (2013). Responses of the terrestrial ammonia-oxidizing archaeon Ca. Nitrososphaera viennensis and the ammonia-oxidizing bacterium Nitrosospira multiformis to nitrification inhibitors. FEMS Microbiol. Lett. 344, 121–129. doi: 10.1111/1574-6968.12164
Sigman, D. M., Casciotti, K. L., Andreani, M., Barford, C., Galanter, M., and Bohlke, J. K. (2001). A bacterial method for the nitrogen isotopic analysis of nitrate in seawater and freshwater. Anal. Chem. 73, 4145–4153. doi: 10.1021/ac010088e
Stahl, D. A., and de la Torre, J. R. (2012). Physiology and diversity of ammonia-oxidizing archaea. Annu. Rev. Microbiol. 66, 83–101. doi: 10.1146/annurev-micro-092611-150128
Stein, L. Y., and Arp, D. J. (1998). Loss of ammonia monooxygenase activity in Nitrosomonas europaea upon exposure to nitrite. Appl. Environ. Microbiol. 64, 4098–4102.
Stein, L. Y., Arp, D. J., and Hyman, M. R. (1997). Regulation of the synthesis and activity of ammonia monooxygenase in Nitrosomonas europaea by altering pH to affect NH3 availability. Appl. Environ. Microbiol. 63, 4588–4592.
Stieglmeier, M., Klingl, A., Alves, R. J., Rittmann, S. K., Melcher, M., Leisch, N., et al. (2014a). Nitrososphaera viennensis gen. nov., sp. nov., an aerobic and mesophilic, ammonia-oxidizing archaeon from soil and a member of the archaeal phylum Thaumarchaeota. Int. J. Syst. Evol. Microbiol. 64, 2738–2752. doi: 10.1099/ijs.0.063172-0
Stieglmeier, M., Mooshammer, M., Kitzler, B., Wanek, W., Zechmeister-Boltenstern, S., Richter, A., et al. (2014b). Aerobic nitrous oxide production through N-nitrosating hybrid formation in ammonia-oxidizing archaea. ISME J. 8, 1135–1146. doi: 10.1038/ismej.2013.220
Sutka, R. L., Ostrom, N. E., Ostrom, P. H., Breznak, J. A., Gandhi, H., Pitt, A. J., et al. (2006). Distinguishing nitrous oxide production from nitrification and denitrification on the basis of isotopomer abundances. Appl. Environ. Microbiol. 72, 638–644. doi: 10.1128/AEM.72.1.638-644.2006
Suzuki, I., Dular, U., and Kwok, S. C. (1974). Ammonia or ammonium ion as substrate for oxidation by Nitrosomonas europaea cells and extracts. J. Bacteriol. 120, 556–558.
Toyoda, S., and Yoshida, N. (1999). Determination of nitrogen isotopomers of nitrous oxide on a modified isotope ratio mass spectrometer. Anal. Chem. 71, 4711–4718. doi: 10.1021/ac9904563
Toyoda, S., Mutobe, H., and Yamagishi, H. (2005). Fractionation of N2O isotopomers during production by denitrifier. Soil Biol. Biochem. 37, 1535–1545. doi: 10.1016/j.soilbio.2005.01.009
Trimmer, M., Chronopoulou, P.-M., Maanoja, S. T., Upstill-Goddard, R. C., Kitidis, V., and Purdy, K. J. (2016). Nitrous oxide as a function of oxygen and archaeal gene abundance in the North Pacific. Nat. Commun. 7:1451. doi: 10.1038/ncomms13451
Udert, K. M., Fux, C., Münster, M., Larsen, T. A., Siegrist, H., and Gujer, W. (2003). Nitrification and autotrophic denitrification of source-separated urine. Water Sci. Technol. 48, 119–130. doi: 10.1021/es048422m
Vajrala, N., Martens-Habbena, W., Sayavedra-Soto, L. A., Schauer, A., Bottomley, P. J., and Stahl, D. A. (2013). Hydroxylamine as an intermediate in ammonia oxidation by globally abundant marine archaea. Proc. Natl. Acad. Sci. U. S. A. 110, 1006–1011. doi: 10.1073/pnas.1214272110
Walker, C. B., de la Torre, J. R., Klotz, M. G., H, U., Pinel, N., Arp, D. J., et al. (2010). Nitrosopumilus maritimus genome reveals unique mechanisms for nitrification and autotrophy in globally distributed marine crenarchaea. Proc. Natl. Acad. Sci. U.S.A. 107, 8818–8823. doi: 10.1073/pnas.0913533107
Wang, Q., Garrity, G. M., Tiedje, J. M., and Cole, J. R. (2007). Naive Bayesian classifier for rapid assignment of rRNA sequences into new bacterial taxonomy. Appl. Environ. Microbiol. 73, 5261–5267. doi: 10.1128/AEM.00062-07
Ward, B. B., and Kilpatrick, K. A. (1990). Relationship between substrate concentration and oxidation ammonium and methane in a stratified water column. Cont. Shelf Res. 10, 1193–1208. doi: 10.1016/0278-4343(90)90016-F
Weiss, R. F., and Price, B. A. (1980). Nitrous oxide solubility in water and seawater. Mar. Chem. 8, 347–359. doi: 10.1016/0304-4203(80)90024-9
Wenk, C. B., Frame, C. H., Koba, K., Casciotti, K. L., Veronesi, M., Niemann, H., et al. (2016). Differential N2O dynamics in two oxygen-deficient lake basins revealed by stable isotope and isotopomer distributions. Limnol. Oceanogr. 61, 1735–1749. doi: 10.1002/lno.10329
Wenk, C. B., Zopfi, J., Gardner, W. S., McCarthy, M. J., Niemann, H., Veronesi, M., et al. (2014). Partitioning between benthic and pelagic nitrate reduction in the Lake Lugano south basin. Limnol. Oceanogr. 59, 1421–1433. doi: 10.4319/lo.2014.59.4.1421
Westley, M. B., Yamagishi, H., Popp, B. N., and Yoshida, N. (2006). Nitrous oxide cycling in the Black Sea inferred from stable isotope and isotopomer distributions. Deep Sea Res. II 53, 1802–1816. doi: 10.1016/j.dsr2.2006.03.012
Wilks, J. C., and Slonczewski, J. L. (2007). pH of the cytoplasm and periplasm of Escherichia coli : rapid measurement by green fluorescent protein fluorimetry. J. Bacteriol. 189, 5601–5607. doi: 10.1128/JB.00615-07
Wilson, S. T., Daniela, A., Segura-Noguera, M., and Karl, D. M. (2014). A role for nitrite in the production of nitrous oxide in the lower euphotic zone of the oligotrophic North Pacific Ocean. Deep. Res. Part I 85, 47–55. doi: 10.1016/j.dsr.2013.11.008
Wuchter, C., Abbas, B., Coolen, M. J., Herfort, L., van Bleijswijk, J., Timmers, P., et al. (2006). Archaeal nitrification in the ocean. Proc. Natl. Acad. Sci. U.S.A. 103, 12317–12322. doi: 10.1073/pnas.0600756103
Xue, H., and Sigg, L. (1993). Free cupric ion concentration and Cu(II) speciation in a eutrophic lake. Limnol. Oceanogr. 38, 1200–1213. doi: 10.4319/lo.1993.38.6.1200
Yamazaki, T., Hozuki, T., Arai, K., Toyoda, S., Koba, K., Fujiwara, T., et al. (2014). Isotopomeric characterization of nitrous oxide produced by reaction of enzymes extracted from nitrifying and denitrifying bacteria. Biogeosciences 11, 2679–2689. doi: 10.5194/bg-11-2679-2014
Yang, H., Gandhi, H., Ostrom, N. E., and Hegg, E. L. (2014). Isotopic fractionation by a fungal p450 nitric oxide reductase during the production of N2O. Environ. Sci. Technol. 48, 10707–10715. doi: 10.1021/es501912d
Yoshida, N., Morimoto, H., Hirano, M., Koike, I., Matsuo, S., Wada, E., et al. (1989). Nitrification rates and 15N abundances of N2O and in the western North Pacific. Nature 342, 895–897. doi: 10.1038/342895a0
Zhalnina, K. V., Dias, R., Leonard, M. T., Dorr de Quadros, P. D., Camargo, F. A., and Drew, J. C. (2014). Genome sequence of Candidatus Nitrososphaera evergladensis from group I. 1b enriched from everglades soil reveals novel genomic features of the ammonia-oxidizing archaea. PLoS ONE 9:e101648. doi: 10.1371/journal.pone.0101648
Keywords: nitrous oxide, ammonia oxidation, nitrification, acidification, Lake Lugano, isotopomer, 16S rRNA multiplex sequencing, hybrid nitrous oxide
Citation: Frame CH, Lau E, Nolan IV EJ, Goepfert TJ and Lehmann MF (2017) Acidification Enhances Hybrid N2O Production Associated with Aquatic Ammonia-Oxidizing Microorganisms. Front. Microbiol. 7:2104. doi: 10.3389/fmicb.2016.02104
Received: 11 August 2016; Accepted: 13 December 2016;
Published: 09 January 2017.
Edited by:
Martin G. Klotz, Queens College, City University of New York, USAReviewed by:
Lisa Y. Stein, University of Alberta, CanadaAnnika C. Mosier, University of Colorado Denver, USA
Copyright © 2017 Frame, Lau, Nolan, Goepfert and Lehmann. This is an open-access article distributed under the terms of the Creative Commons Attribution License (CC BY). The use, distribution or reproduction in other forums is permitted, provided the original author(s) or licensor are credited and that the original publication in this journal is cited, in accordance with accepted academic practice. No use, distribution or reproduction is permitted which does not comply with these terms.
*Correspondence: Caitlin H. Frame, cframe@alum.mit.edu
†Present Address: Evan Lau, Department of Biology, Menlo College, Atherton, CA, USA