Optical observations and spatio-temporal projections of gelatinous zooplankton in the Fram Strait, a gateway to a changing Arctic Ocean
 Dmitrii Pantiukhin1*
  Gerlien Verhaegen1,2
  Casper Kraan3
  Kerstin Jerosch1
  Philipp Neitzel4
  Henk-Jan T. Hoving4†
  Charlotte Havermans1†
- 1Helmholtz Young Investigator Group ARJEL & Functional Ecology, The Alfred Wegener Institute, Helmholtz Centre for Polar and Marine Research, Bremerhaven, Germany
- 2Institute for Extra-cutting-edge Science and Technology Avant-garde Research (X-star), Japan Agency for Marine-Earth Science and Technology (JAMSTEC), Yokosuka, Japan
- 3Thünen Institute of Sea Fisheries, Bremerhaven, Germany
- 4Marine Ecology, GEOMAR Helmholtz Centre for Ocean Research Kiel, Kiel, Germany
Global warming causes profound environmental shifts in the Arctic Ocean, altering the composition and structure of communities. In the Fram Strait, a transitional zone between the North-Atlantic and Arctic Ocean, climate change effects are particularly pronounced and accelerated due to an increased inflow of warm Atlantic water. Gelatinous zooplankton are known as key predators, consuming a great variety of prey and playing an important role in marine ecosystems. Insufficient knowledge of how gelatinous zooplankton are affected by environmental change has resulted in a notable gap in the understanding of the future state of Arctic ecosystems. We analyzed the diversity and abundance of gelatinous zooplankton down to 2600 m depth and established the first regional baseline dataset using optical observations obtained by the towed underwater camera system PELAGIOS (Pelagic In situ Observation System). Our data estimate the abundance of 20 taxa of gelatinous zooplankton. The most abundant taxa belong to the family of Rhopalonematidae, mainly consisting of Aglantha digitale and Sminthea arctica, and the suborder Physonectae. Using the observational data, we employed a joint species distribution modelling approach to better understand their distributional patterns. Variance partitioning over the explanatory variables showed that depth and temperature explained a substantial amount of variation for most of the taxa, suggesting that these parameters drive diversity and distribution. Spatial distribution modelling revealed that the highest abundance and diversity of jellyfish are expected in the marginal sea-ice zones. By coupling the model with climate scenarios of environmental changes, we were able to project potential changes in the spatial distribution and composition of gelatinous communities from 2020 to 2050 (during the summer season). The near-future projections confirmed that with further temperature increases, gelatinous zooplankton communities in the Fram Strait would become less diverse but more abundant. Among taxa of the Rhopalonematidae family, the abundance of Aglantha digitale in the entire water column would increase by 2%, while a loss of up to 60% is to be expected for Sminthea arctica by 2050. The combination of in situ observations and species distribution modelling shows promise as a tool for predicting gelatinous zooplankton community shifts in a changing ocean.
Introduction
Arctic regions are experiencing temperature increases approximately four times greater than the rest of the world (Rantanen et al., 2022). Due to this warming, over the past decade the average annual Arctic sea-ice extent has reached its lowest level since 1850 (Fox-Kemper et al., 2021). An increase in sea-ice free areas, as well as a prolongation of open water days, extend the growing season of open ocean type phytoplankton communities (Arrigo et al., 2008). This extension is also obvious from long-term satellite observation data which show an increase in net primary production (NPP) in the Arctic Ocean by ca. 20-25% per decade from 1998 to 2015 (Arrigo and van Dijken, 2015; Kahru et al., 2016). At the same time, the proportion of primary production from sea-ice algae blooms that rapidly falls to the seafloor will decrease (Constable et al., 2022). Open ocean ecosystems may support new pelagic communities of secondary and tertiary consumers (zooplankton and foraging fish) and upper trophic level mammals (Moore and Stabeno, 2015).
Ocean warming and subsequent sea-ice retreat have already caused a northward migration of subarctic and temperate species (Buchholz et al., 2010; Frainer et al., 2017; Geoffroy et al., 2018; Neukermans et al., 2018; Schröter et al., 2019), increased abundance and reproductive success of subarctic species (Kraft et al., 2013), and a decline in abundance and retraction of some Arctic species linked to sea-ice (Wassmann et al., 2011; Ingvaldsen et al., 2021). Zooplankton taxa are propagating toward the poles at a relatively fast average rate of 100 km per decade (Field et al., 2014), making them important indicators for monitoring ecosystem changes due to climate shifts in the Arctic Ocean. This northward shift of subarctic zooplankton species leads to the emergence of new feeding interactions, which in turn increases connectivity and decreases the modularity of the Arctic marine ecosystems (Pecuchet et al., 2020).
Most studies on changes in zooplankton distribution and abundance in the Arctic have focused on hard-bodied forms of zooplankton taxa such as crustaceans (Basedow et al., 2018; Hop et al., 2021). Gelatinous zooplankton (GZ) is a polyphyletic group consisting of zooplankton that often have transparent and fragile bodies. The focus of our study is on cnidarians and ctenophores as representatives of gelatinous zooplankton (GZ). While other organisms, such as larvaceans, chaetognaths and mollusks, are sometimes classified as GZ, they will not be considered in this study. Due to their high water content these pelagic organisms were long considered dead-ends in marine food webs (Verity and Smetacek, 1996). Recent studies, however, show GZ to be pivotal and abundant components of oceanic food webs (Hays et al., 2018). GZ are considered to be versatile predators and consume a great variety of prey (Choy et al., 2017). Despite a typically low nutritional value, GZ are an important food source for various predators including fish, birds, turtles, and various invertebrates (Decker et al., 2014; Hoving and Haddock, 2017; Urban et al., 2022; Yaragina et al., 2022). Under favorable environmental conditions, GZ can become overwhelmingly abundant and form episodic ‘blooms’ (Boero et al., 2008). Over the last few decades, the magnitude of such blooms has been increasing in various parts of the world (Brodeur et al., 2008; Riisgård et al., 2012), and these blooms are believed to be driven by overfishing, eutrophication and changing oceanographic conditions (Purcell, 2012). However, the general hypotheses of global increases in GZ populations have been questioned and are hard to prove (Condon et al., 2012; Condon et al., 2013), as jellyfish blooms are subject to global fluctuations (Condon et al., 2013). The future state of GZ in changing Arctic ecosystems remains particularly uncertain in this context due to a lack of reliable long-term datasets (Mańko et al., 2020).
Our knowledge of the abundance and composition of GZ in polar seas is scarce (Raskoff et al., 2005). One reason for this data gap is the extreme fragility of GZ. Collecting GZ with nets destroys many species or degrades them into fragments, which are subsequently unidentifiable and often excluded from analysis (Raskoff et al., 2003). Various net sampling methodologies have been shown to be biased toward certain groups of GZ (Hosia et al., 2017). Comparative studies of net-based and optical samplers revealed that nets may dramatically underestimate abundances and diversity of GZ (Remsen et al., 2004; Raskoff et al., 2010; Hosia et al., 2017; Hoving et al., 2019). For example, the abundance estimates of Beroidae comb jellies was three to five times higher when using optical methods compared to multinets (Hoving et al., 2019). Net-based systems also under-sample many GZ species, such as Aeginidae spp., Sminthea arctica, Botrynema spp., Atolla spp., lobate ctenophores and siphonophores (Raskoff et al., 2010). Some of the larger GZ taxa are known only from in situ observations and have never been captured in a good state with nets, e.g., Thalassocalyce inconstans (Swift et al., 2009), Kiyohimea usagi (Hoving et al., 2018).
Insufficient knowledge about GZ has led to a notable gap in understanding the structure of the pelagic Arctic ecosystem, particularly in the deep-sea (meso- and bathypelagic) habitats (Raskoff et al., 2005; Neitzel et al., 2021). Only a few studies focused on the changes in the biomass and diversity of GZ in the Arctic Ocean and its marginal seas. Brodeur et al. (1999) observed the increase of the biomass of large medusae from 1979 to 1997 in the Bering Sea. Since the Bering Sea is the Pacific-Arctic gateway, it is likely that the export of GZ from the North Pacific to the Arctic also increased. In the Barents Sea, continued warming may be favorable for cnidarian abundances (Eriksen et al., 2012). A northward shift to a high Arctic fjord (> 78°N) and an abundance increase in the northern Barents Sea since 2014 has been documented for the deep-water scyphozoan Periphylla periphylla (Geoffroy et al., 2018).
In the Fram Strait, the main gateway to the Arctic Ocean, the transfer of heat from the North Atlantic has intensified over the course of decades, a phenomenon referred to as “Atlantification’’ (Beszczynska-Möller et al., 2012; Polyakov et al., 2012; Ingvaldsen et al., 2021) making this region essential for monitoring ongoing changes in ecosystems. Further Atlantification in the Fram Strait is likely to facilitate the expansion of boreal species into the Arctic and may lead to a less diverse but more abundant GZ community in the future (Mańko et al., 2020). To increase large-scale knowledge of GZ species assemblages in the Fram Strait, we obtained baseline data on vertical distribution and diversity of deep-water Arctic GZ with the Pelagic In situ Observation System (Hoving et al., 2019). The data were collected during the cruises to the HAUSGARTEN Long-Term Ecological Research (LTER) site (Soltwedel et al., 2005) in 2019 and 2021. Quantitative estimations of abundance, diversity and vertical distribution of GZ taxa was obtained using a horizontal video transect methodology (Hoving et al., 2020a). In order to understand current and future patterns of vertical species distributions, we fitted Bayesian Joint Species Distribution Models (JSDMs; Ovaskainen and Abrego, 2020) on the obtained abundance data. These trained models were coupled with climate change scenarios, which allowed us to forecast spatial niche range shifts of dominant species of gelatinous zooplankton. Our modelling effort is limited to a rather small section across Fram Strait, with the aim to project the redistribution related to the spatial shift of two distinguishable currents (West Spitsbergen Current and East Greenland Current) of the Fram Strait.
We hypothesized that global warming is affecting the composition of gelatinous zooplankton communities and changing their abundance and habitable niches in the Fram Strait region. To test this hypothesis, we used the JSDM-based assessment with a focus on the mesopelagic and bathypelagic GZ communities in the Fram Strait, with the specific objectives to (1) assess the significance of specific environmental drivers on structuring GZ communities; (2) delineate spatial distribution and vertical zonation of GZ communities; (3) use climate-change scenarios to project future distributions of GZ communities in the Fram Strait.
Materials and methods
Expeditions and deployments
During the expeditions PS121 (Hoving et al., 2020b) and PS126 (Havermans et al., 2021) of the R/V Polarstern (Alfred-Wegener-Institute and Helmholtz-Zentrum für Polar- und Meeresforschung, 2017) to the Fram Strait in August/September 2019 and June 2021 (Figure 1), we deployed the Pelagic In situ Observation System (PELAGIOS; Hoving et al., 2019) at the HAUSGARTEN Long-Term Ecological Research (LTER) stations in Fram Strait. The PELAGIOS is a towed video camera system that collects high definition (HD) videos at 50 frames per second using the 1Cam Alpha camera as well as Conductivity-Temperature-Depth-Optical data. PELAGIOS was towed horizontally through the water column at approximately 1 knot speed over ground. Horizontal transects were conducted at specific depths down to 2600 m based on prior knowledge of the water masses and ecosystem domains in the study area, with the aim of covering a representative range of habitats for gelatinous zooplankton. (Figure S1, Table S1). Seven deployments were performed at four different stations (4 during PS121, and 3 during PS126), resulting in a total of 13.5 hours of pelagic video (Figure 1, Sn; Table S1). PELAGIOS data from the ascent and descent phases of the transects were not used in the analysis due to limitations in their conversion to species abundance values resulting from the direct horizontal projection design of the PELAGIOS system. A total of 50 unique horizontal transects (sampling points) were identified across the seven stations studied, based on their distinct (longitude, latitude, depth) values (Figure 1; Figure S1, Table S1). Species abundance values at these transects were converted from the number of specimens per minute to the number of specimens per cubic meter given that PELAGIOS records an average volume of 0.116 m3 s-1 at a tow speed of 1 knot (= 0.51 ms-1) (Hoving et al., 2019).
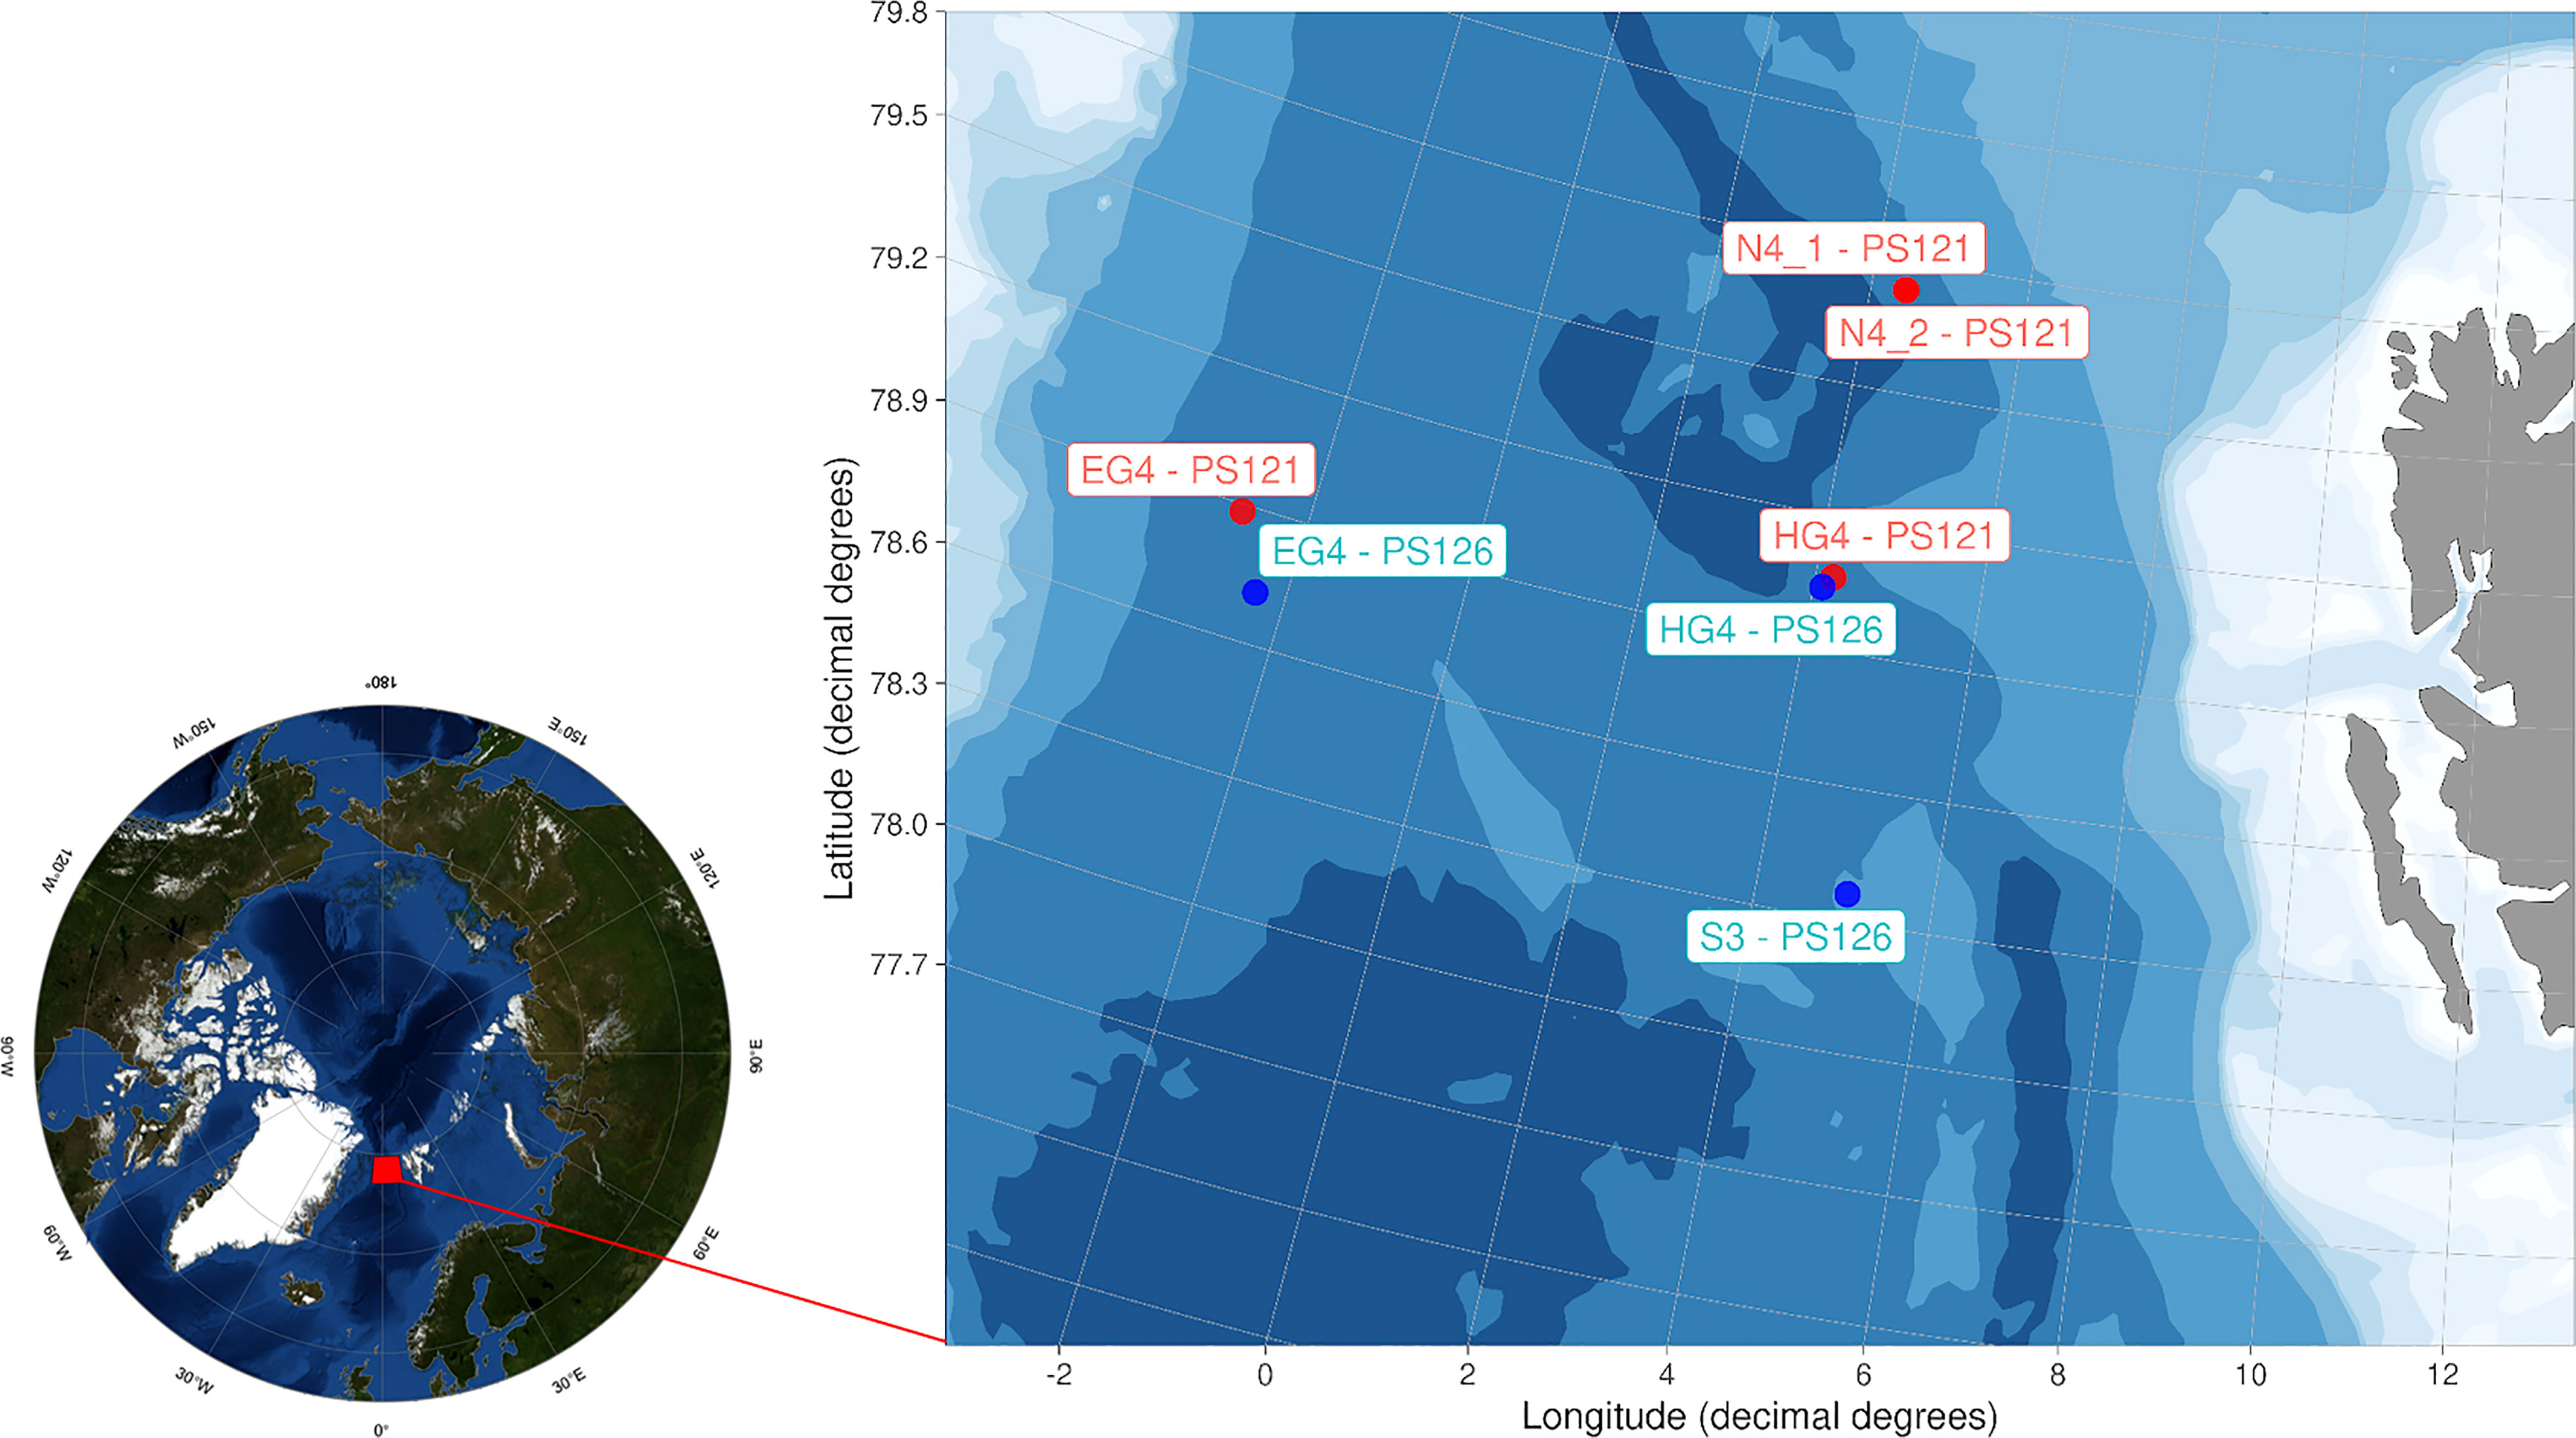
Figure 1 Study area and dive stations of the towed camera PELAGIOS during two expeditions to the HAUSGARTEN LTER in Fram Strait, PS121 (2019, stations in red on the map) and PS126 (2021, stations in green). The map of the Pan-Arctic region uses 'Blue Marble' data from the NASA Earth Observatory (Stöckli et al., 2006). The visualization for the Fram Strait was created using the PlotSvalbard R package (Vihtakari, 2020).
Biological data
The video transects were analyzed using the Video Annotation and Reference System “VARS” (Schlining and Stout, 2006). The VARS annotation program enables the capture of frames from the video with corresponding time codes. It also includes a knowledge base for inputting taxonomic names and hierarchy, and a database search function for easy retrieval of information. We identified the species Botrynema brucei and Botrynema ellinorae based on the presence/absence (respectively) of a sharp knob at the top of the bell. Individuals that could not be distinguished were grouped as Botrynema spp. Other species of Trachymedusae that could not be identified to a lower taxonomic level were assigned to Trachymedusae spp. For the family Aeginidae (Narcomedusae), species identification was based on the number of tentacles, with Solmundella bitentaculata having two tentacles and Bathykorus bouilloni four. Specimens belonging to the order Siphonophorae were divided into two suborders: Calycophorae and Physonectae. The phylum Ctenophora included the genus Beroe spp. and the order Lobata. Rarely occurring GZ taxa (Euplokamis spp., Aulacoctena spp., Bathyctena spp., Dryodora glandiformis, Ptychogena hyperborea) were not incorporated into the modelling section. In addition, unidentified Ctenophora spp. and Trachymedusa spp. were also excluded from further analysis due to lack of ecological significance. During the deployments, identification of species in the epipelagic layer was challenged by high amounts of particulate organic matter and intense light, limiting the quality of video transects. This was particularly true for ctenophores for which diversity in the epipelagic could not be estimated. Each annotated event is presented on the Data Publisher for Earth & Environmental Science (PANGAEA) as a 4-second video clip, with associated metadata (Pantiukhin et al., 2023a; Pantiukhin et al., 2023b). The video clips for each event, with a spread of +/-2 seconds around the actual occurrence, were cropped from the original video using the FFmpeg tool (FFmpeg Developers, 2006).
Environmental parameters
The conductivity-temperature-depth (CTD) data for the PS121 expedition were obtained from the ship’s CTD/rosette system which consists of a Sea-Bird Electronics - Seawater Multi-Parameter - Optical Dissolved Oxygen (SBE37-SMP-ODO) sensor (temperature, salinity, oxygen) and Wetlabs Ecotriplet system (Chlorophyll and colored dissolved organic matter (CDOM) fluorescence plus scattering). For the PS126 expedition, a CTD system was mounted directly on PELAGIOS (temperature, salinity sensors), whereas the oxygen and fluorescence were extracted from the ship’s CTD. The correlation of PELAGIOS CTD data (salinity, temperature) with shipboard CTD data was > 0.95 at depth transects on PS126, thus we used them in combination. For each depth transect of the PELAGIOS, data from the closest ship’s CTD station was used.
Environmental factors used in the models were selected based on their potential importance to the GZ distribution. Temperature, salinity, oxygen and depth are known to affect the distribution of the GZ in the marine environment (Tittensor et al., 2010; Lucas et al., 2014). Moreover, sea-ice is considered as an important driver of Arctic ecosystems, and it has been hypothesized that its reduction will increase the abundance of GZ (Wassmann et al., 2011). The values of temperature (°C), salinity (practical salinity units, or PSU), oxygen saturation (μmol kg-1) were taken from CTD’s (see above) for initial training of the model. Values of sea-ice coverage (%), which were used in the analysis, were obtained from the European Organisation for the Exploitation of Meteorological Satellites (EUMETSAT), Ocean and Sea Ice Satellite Application Facility (EUMETSAT Ocean and Sea Ice Satellite Application Facility, 2017). For the initial training of the model, we used sea-ice concentrations measured 2 weeks prior to the deployment of PELAGIOS at the sampling point. The spatial values were averaged around each sampling point (within a 0.5-degree radius).
To perform spatio-temporal projections of the current and future state of the Fram Strait region, we projected the results of the Joint species distribution model (JSDM) onto environmental grids obtained from the Coupled Model Intercomparison Project Phase 6 (CMIP6). We used the results of the Finite Element Sea Ice-Ocean Model (FESOM; Semmler et al., 2018) as a source of oceanographic data sea in this study for spatial modelling (sea-ice concentrations (%), salinity (PSU), and temperature (°C). FESOM is an ocean-ice model that employs an unstructured grid with a horizontal resolution of 25 km. We projected the JSDM results onto the environmental grids obtained from the FESOM simulations using the shared socio-economic pathway (SSP) scenario SSP245, which represents a medium level emissions scenario (Meinshausen et al., 2020). For the present study, we chose 2020, 2030, 2040, and 2050 (from June to September) as time frames. To avoid spatial bias and ensure consistency with the PELAGIOS camera dives, we considered a vertical resolution of 10 layers (230 m, 410 m, 580 m, 790 m, 1040 m, 1330 m, 1700 m, 1920 m, 2150 m, 2400 m). A polygon with a spatial extent of 77° to 82° lat N and 6° long W to 8° long E served as the study region on which the projections were made. These specific latitudinal and longitudinal coordinates were chosen to cover the deep-sea part of the studied region, while excluding the shelf zones of the Fram Strait where the community structure of GZ is different and was not the target of our study.
Study design and joint distribution modelling
The Joint Distribution Model framework ‘Hierarchical Modelling of Species Communities’ (HMSC; Ovaskainen and Abrego, 2020) was used. This model allows us to link data on species occurrence and environmental covariates with processes of community formation. Environmental filtering is simulated at the species level by analyzing how the occurrences of species vary with environmental variables. Species co-occurrences are expressed as residual species-to-species association matrices, which may be evaluated at various spatial and temporal scales (Tikhonov et al., 2020). The latest version of the HMSC 3.0 model is implemented in the “HMSC” package (Tikhonov et al., 2020) in R (R Core Team, 2022).
As the biotic response variable, we included counts of the 13 different taxa at 50 sampling locations (Figures 2, 3; Figure S1; Table S2). We fitted two different models: first a Poisson model (for count data) to analyze abundance analyses, and second a presence-absence model (presence-absence matrices for this model generated from the count data) to estimate the taxa richness on the predictive gradients. To choose the explanatory variables for the models, we tested temperature (°C), salinity (PSU), oxygen saturation (μmol kg-1), depth (m) (CTD measurements), and concentrations of sea-ice (%) (MODIS sensors) for correlation. The oxygen saturation showed a negative correlation with depth (Pearson’s r = -0.89, Figure S3), and a positive correlation with temperature (Pearson’s r = 0.86, Figure S3). To avoid the risk of over-parameterization, we evaluated the goodness-of-fit of two models with and without oxygen saturation. The models were evaluated according to the Widely Applicable Information Criterion (WAIC; Watanabe, 2013). The models with the lowest WAIC values maximize their predictive power and reduce complexity. In this study, the model excluding oxygen showed WAIC values of 69.03, while including oxygen 72.94. Thus, due to the lower predictive power of the model with oxygen, as well as the difficulty in estimating the influence of oxygen, as it is highly correlated with temperature and depth, the choice was made in favor of a model without oxygen.
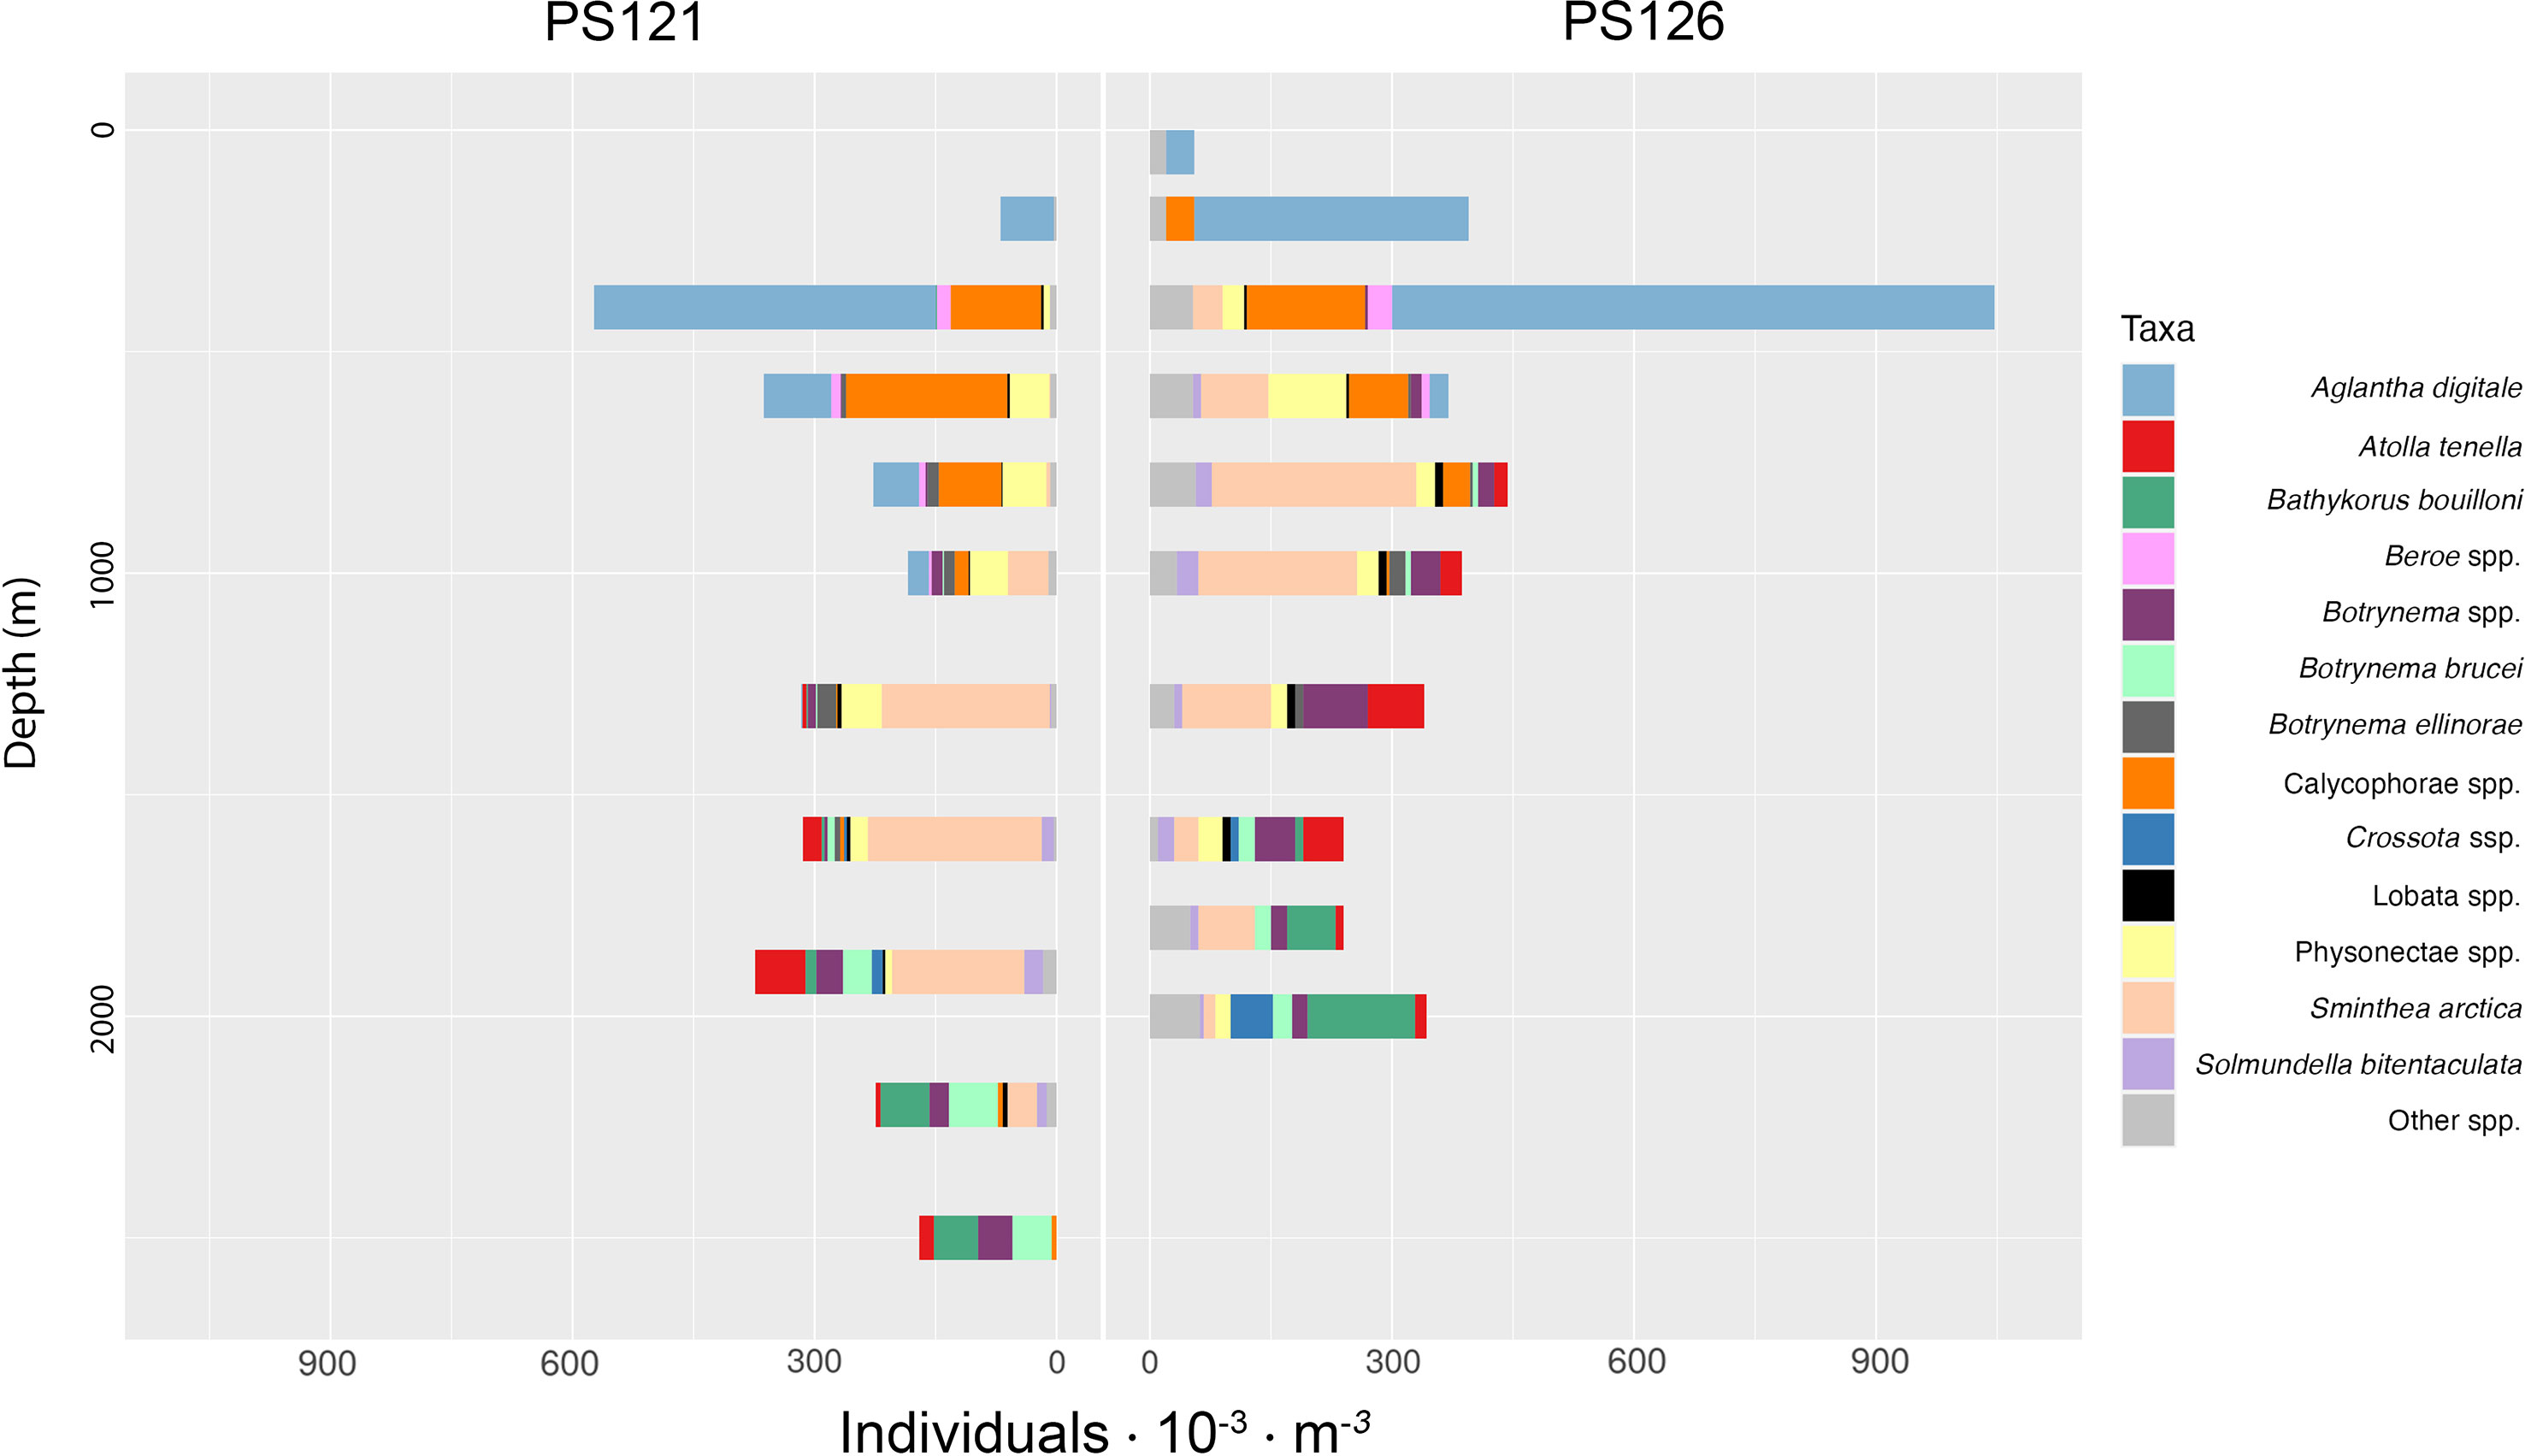
Figure 2 Vertical distribution of gelatinous zooplankton groups encountered with PELAGIOS. The figure displays 13 most dominant taxa that were used for modeling, while the remaining taxa annotated were collapsed into the “Other spp.” category.
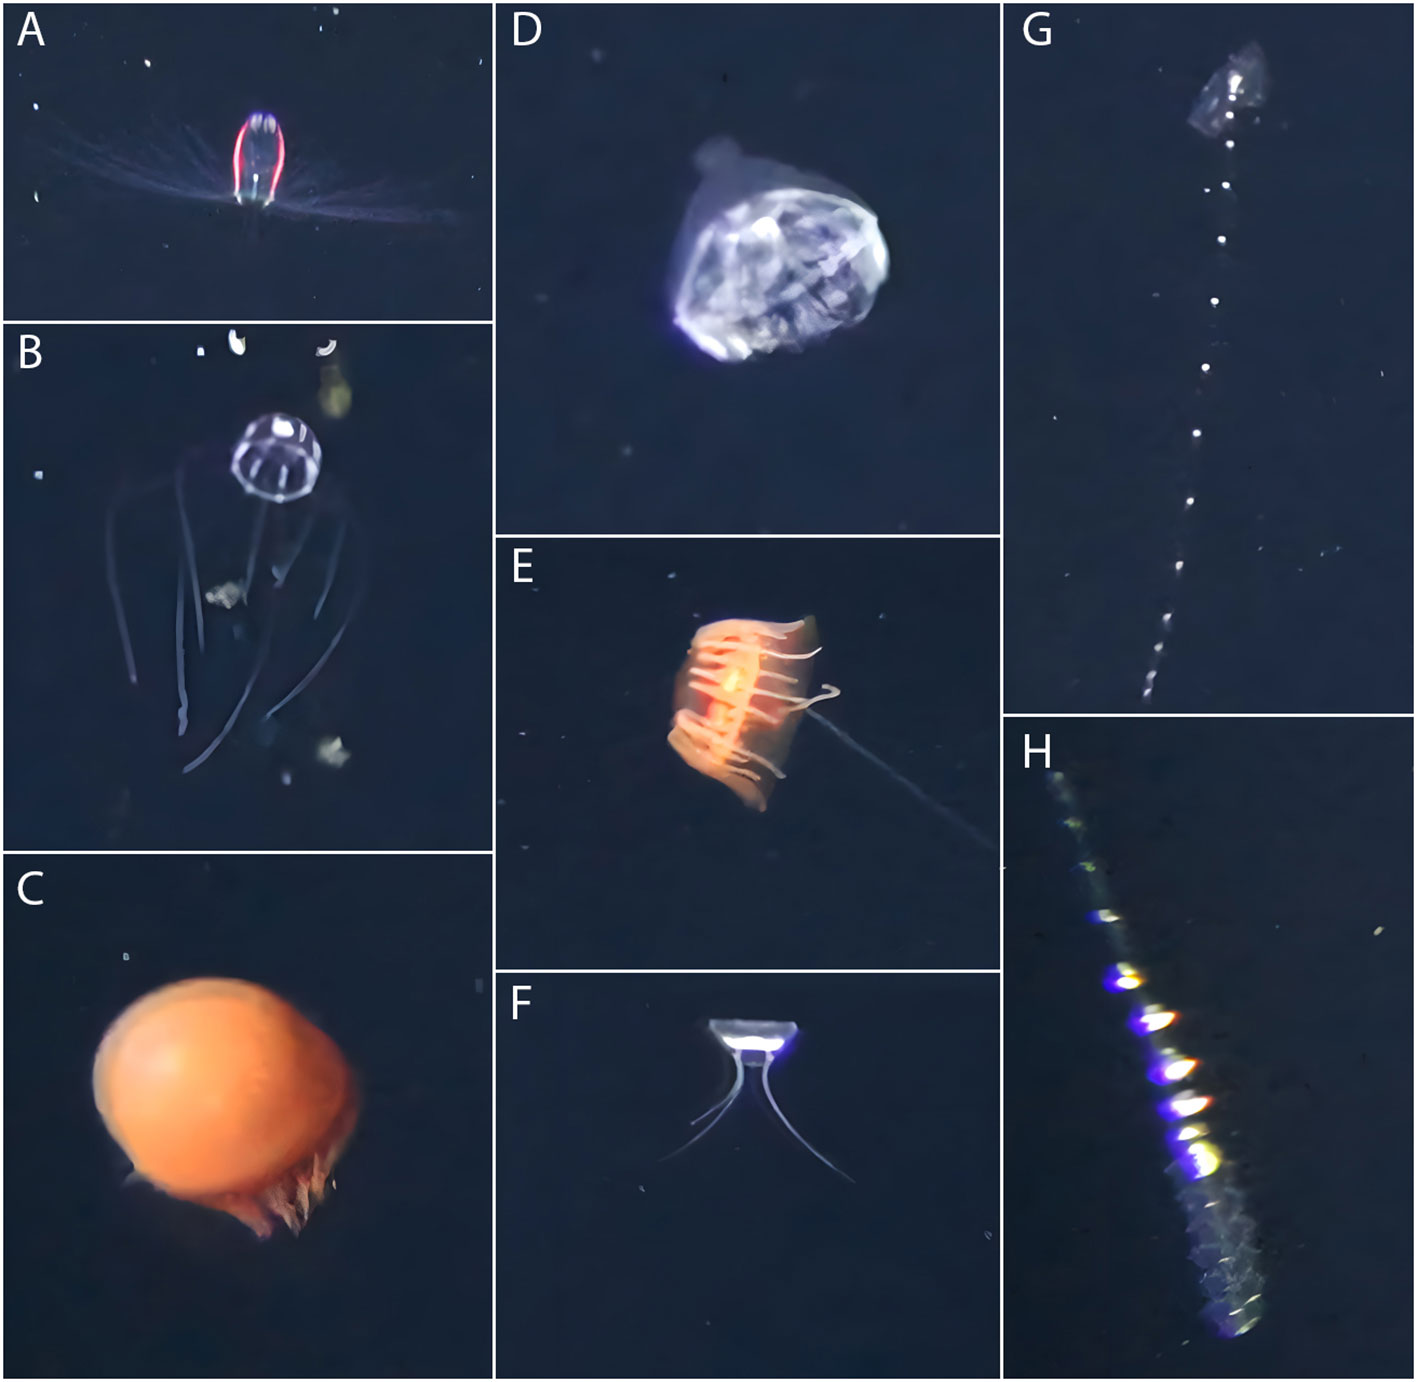
Figure 3 Examples of organisms encountered during pelagic video transects with PELAGIOS: (A) Aglantha digitale, (B) Sminthea arctica, (C) Crossota sp., (D) Botrynema brucei, (E) Atolla tenella, (F) Bathykorus bouilloni, (G) Calycophorae spp., (H) Physonectae spp.
The HMSC model was trained using default prior distributions (Ovaskainen and Abrego, 2020). In order to sample the posterior distribution, we used four Markov Chain Monte Carlo (MCMC) chains and ran each for 375000 iterations. The first 125000 iterations were removed as burn-in and the chains thinned by 1000 to yield 250 posterior samples per chain. In total, we had 1000 posterior samples. To examine MCMC convergence, we looked at the potential scale reduction factors (Gelman and Rubin, 1992) of the model parameters.
We estimated the explanatory and predictive power of the presence-absence model using species-specific area under the receiver operating characteristic curve (AUC-ROC; Pearce & Ferrier, 2000) values and Tjur R2 values (Tjur, 2009), while the explanatory and predictive power of the Poisson model were estimated using pseudo-R2 (Ovaskainen and Abrego, 2020). To calculate the explanatory power (i.e., how well the model predicts the data used for fitting), we used the model trained on all the available data (without partitioning). To estimate the predictive power, we performed a 4-fold cross-validation, partitioning the data into four equal subsets and using three subsets to fit the model and one subset to test its predictive accuracy. We partitioned the explained variation among the predictive variables to quantify the drivers of community structure. To examine how species communities respond to environmental conditions, we estimated species responses to the explanatory variables, counting what proportion of species showed a positive or negative response with at least 95% posterior probability. The figures and maps were produced using the R packages PlotSvalbard (Vihtakari, 2020) and ggplot2 (Wickham, 2016).
Results
Regional oceanography
The PELAGIOS stations were located in the deep part of the Fram Strait, with depths ranging from 2338 m (S3; Figure 1) to 2667 m (N4; Figure 1). The temperature and salinity in the Fram Strait are affected by two main current systems: the warmer West Spitsbergen Current, which is part of the Atlantic water in the region, and the colder East Greenland Current, which brings Arctic water masses into the region. The branch of West Spitsbergen Current recirculates south-westwards as the Return Atlantic Current. To determine the water masses present at each site, we used temperature and salinity data and adapted the characteristic temperature-salinity signatures of each water mass from Beszczynska-Möller et al., 2011; Walczowski et al., 2012 and Mańko et al., 2020 (see Figure S2). The strongest presence of Atlantic water was observed at station N4 (August/September 2019), where transformed Atlantic water extended to a depth of 700 m and intermediate water to a depth of 800 m (Figure S2). This station was also characterized by a high level of mixing between different water masses, as well as the presence of all five distinguished water masses (Figure S2). The largest extent of Arctic water was observed at station S3 (June 2021), where the transition from transformed Atlantic to Arctic water occurred at a depth of 500 m (Figure S2). At stations where an interannual comparison was possible (HG4 and EG4), we found distinguishable interseasonal patterns (Figure S2). In August/September (PS121) at the station EG4, we observed the presence of both Atlantic water and transformed Atlantic water; the latter extended in the water column down to depths of 650 m (Figure S2). In June (PS126, station EG4), we observed only transformed Atlantic water, which spread to a depth of 550 m (Figure S2). Similar changes in water masses were found at station HG4, but here the lower boundary of the transformed Atlantic water varied only slightly, at depths of 600 m (Figure S2). However, in the epipelagic layer in August/September (PS121), the presence of Atlantic water was observed, while in June (PS126) the upper 0-50 m layer was occupied by Arctic water. Sea-ice conditions strengthened in the northwest direction, with maximum sea-ice concentrations found at station EG4 in August/September (PS121) - 62.72%.
General patterns of gelatinous zooplankton on stations
We recorded a total of 20 distinguishable taxa, among the 13 most dominant on horizontal transects were: Aglantha digitale - 706 obs.; S. arctica - 522 obs.; Calycophorae spp. - 375 obs.; Physonectae spp. - 215 obs.; Botrynema spp. - 91 obs.; Atolla tenella - 66 obs.; Bathykorus bouilloni - 64 obs.; Botrynema brucei - 52 obs.; Botrynema ellinorae - 49 obs.; Beroe spp. - 41 obs.; Solmundella bitentaculata - 39 obs.; Lobata spp. - 23 obs.; Crossota sp. - 22 obs (Figures 2, 3; Table S2). The most diverse stations in terms of taxa richness were EG4 and HG4 (17 and 16 taxa present), while the lowest was S3 (11 taxa). The highest abundance was found at station HG4 (PS126; Figure 1) with an average of 549 individuals per 1000 m3, and the lowest abundance was observed at station S3 (PS121; Figure 1) with an average of 183 individuals per 1000 m3. The majority of recorded taxa (12) belonged to the class Hydrozoa (A. digitale ~29% and S. arctica ~22% of all observations), while the class Scyphozoa was represented only by one species - A. tenella. The highest abundance values during the PS121 expedition were recorded at depths of 400-600 m, as well as at 1900 m. In terms of taxon diversity, the highest biodiversity was found at depths of 1300 m (13 taxa; Figure 2). During the PS126 expedition, the greatest abundance was found at depths of 400 and 2000 m, while taxonomic diversity was highest at a depth of 600 m (13 taxa; Figure 2).
Hierarchical modelling of species communities
The convergence of MCMC chains, measured by the potential scale reduction factors (β-parameter; which measure species responses to environmental covariates; Ovaskainen et al., 2017), were on average 1.02 (maximum 1.12) for the Poisson model and 1.001 (maximum 1.004) for the presence-absence model (Figure S4). The 4-fold cross-validation for the presence-absence model showed a mean Tjur R2 (AUC) of 0.29 (0.79). The Poisson model showed the mean pseudo-R2 being 0.43 for explanatory power and 0.29 for predictive power (Figure S5).
Variance partitioning over the explanatory variables showed that temperature and depth explained a substantial amount of variation in both Poisson and presence-absence models, in contrast to the minor explanatory power of sea-ice and salinity (Figures 4A, B). Among the taxa, temperature had the highest explanatory value for S. arctica (0.58 - Poisson; 0.45 - presence-absence), A. digitale (0.38 - Poisson; 0.22 - presence-absence), suborder Physonectae (0.31 - Poisson; 0.32 - presence-absence), and Botrynema spp. (0.32 - Poisson; 0.36 - presence-absence). Depth zonation showed the highest values for B. brucei (0.41 - Poisson; 0.35 - presence-absence), B. bouilloni (0.28 - Poisson; 0.35 - presence-absence), A. tenella (0.25 - Poisson; 0.23 - presence-absence). For the suborder Calycophora, salinity had the major contribution to the explanation of variations was e. In the Poisson model, its contribution was 0.17 and in the presence-absence model - 0.08. Sea-ice did not contribute significantly to the explanatory power of the models (<0.1 for all taxa).
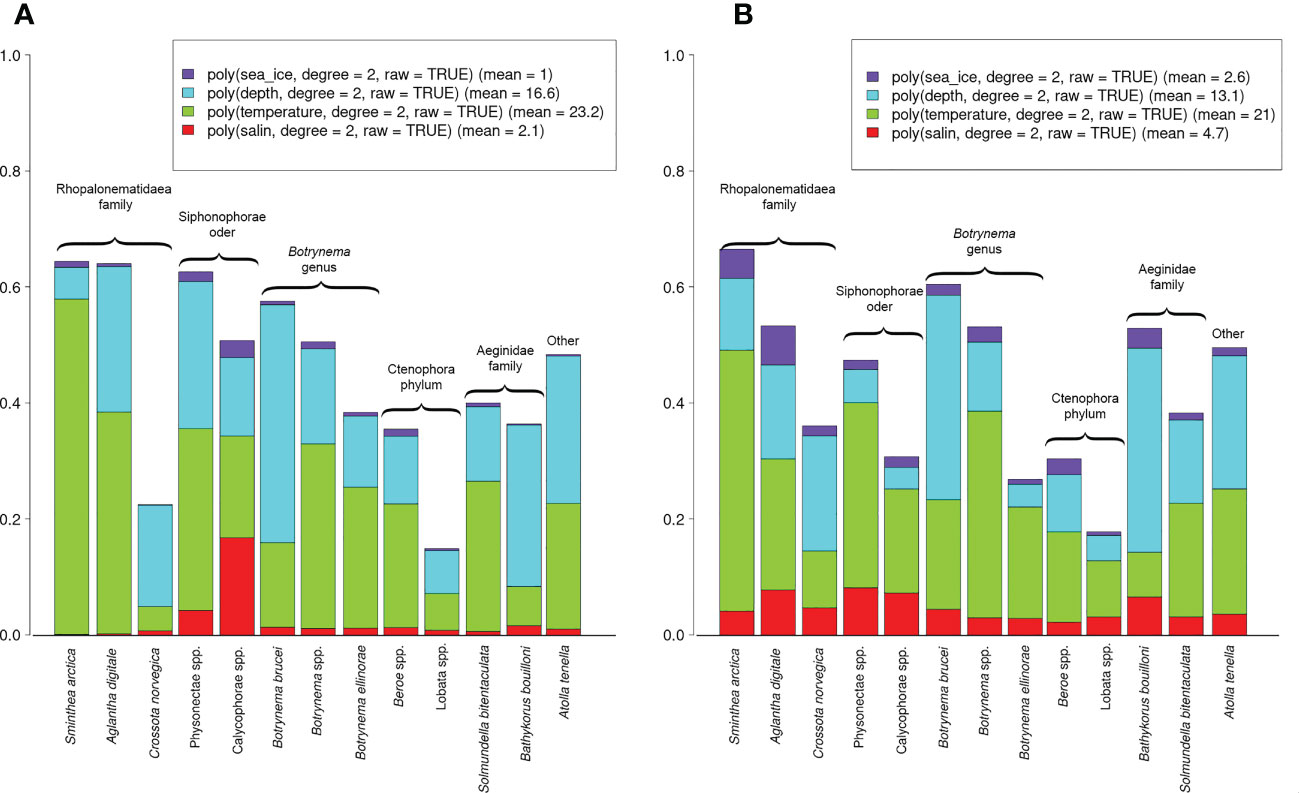
Figure 4 Variance partitioning among the explanatory variables. The values for the Poisson (A) and presence-absence (B) models are estimated by Tjur R2 and R2 respectively. The mean values of variance for all species are presented in the legends.
No significant response to salinity was found in any of the taxa, however all exhibited responses to temperature (Figures S6A, B). Six taxa in the presence-absence model (A. tenella, B. brucei, Botrynema spp., Crossota sp., S. arctica, S. bitentaculata) responded negatively to the second-order term of temperature while only S. arctica showed a clear negative response in the Poisson model. In other cases, taxa responded positively to the first-order term polynomials of temperature and negatively to the second-order term polynomials. This means that their abundance/probability of occurrence peaked at some intermediate temperature value. The responses of taxa to depth in the Poisson model were mostly characterized by peaks at some intermediate value. The exception was Beroe spp., which had a negative response. In the presence-absence models A. tenella, B. bouilloni, B. brucei, and Crossota sp. showed a clear positive response to the increase of depth. The responses of A. tenella, S. arctica, S. bitentaculata in both models showed a positive association with sea-ice, B. brucei showed the same association only in the presence-absence model. Bathykorus bouilloni showed a negative response to the presence of sea-ice in both the presence-absence and Poisson models.
Prediction gradients
Predictive gradients were constructed for total taxa richness based on the presence-absence model, while the Poisson model was used to construct predictive gradients of abundance for each studied taxon.
Taxa abundance and richness
Predictions over environmental gradients (Figure 5) showed that the abundance of different taxa peaked at the lower end of the mesopelagic zone (700-800 m), while taxa richness peaked in the upper bathypelagic zone (1100-1200 m). Higher taxa diversity was found in colder waters with a peak of taxa richness at 0.3-0.4°C. In contrast, total abundance peaked at mean temperatures of 1.2-1.3°C. At higher salinities, an increase in both total taxa abundance and richness was observed. The same patterns of positive response were found for sea-ice concentrations.
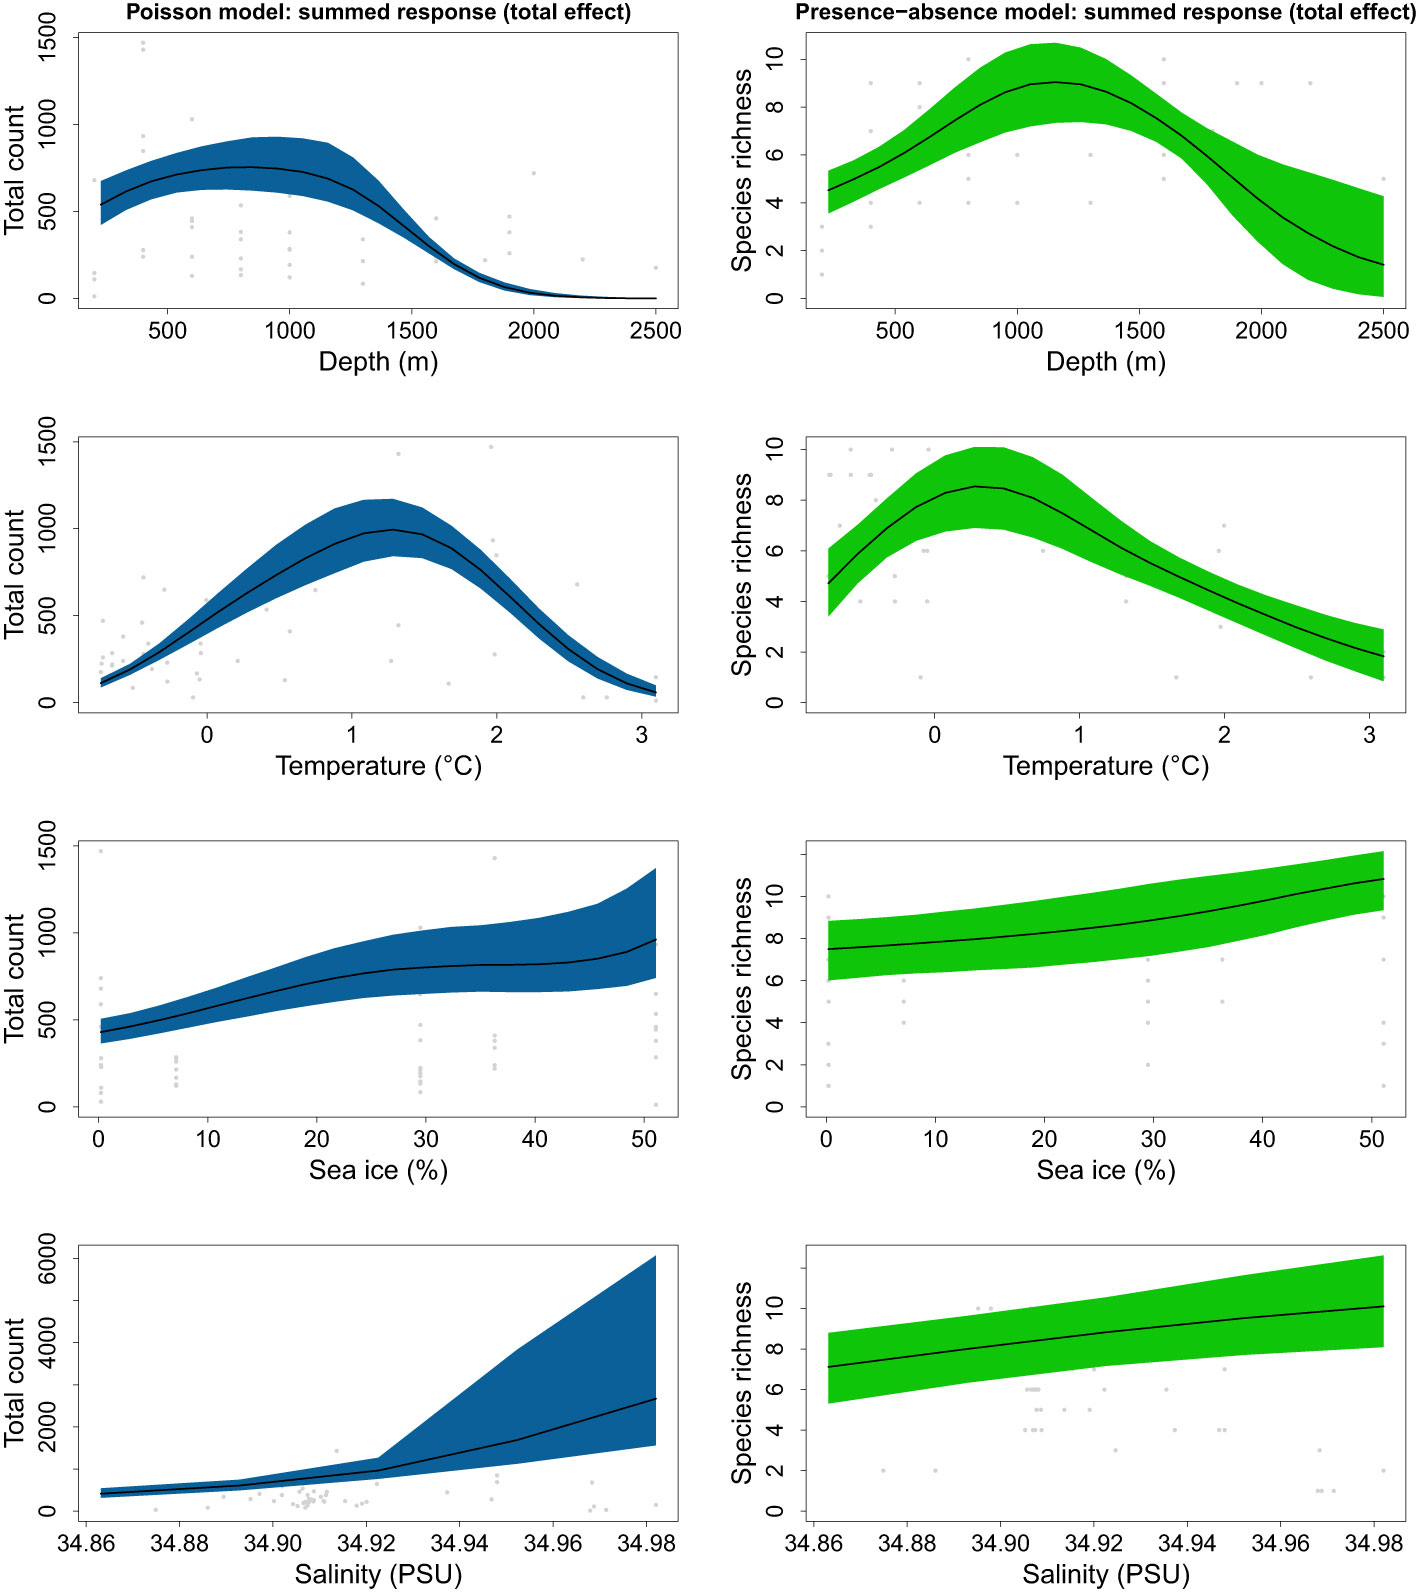
Figure 5 Predicted gradients of total count (Poisson model; left) and taxa richness (presence-absence model; right) for all taxa.
Atolla tenella
The studied taxa were divided into six distinct taxonomic groups (Figures 6, S6) based on their vertical distribution ranges and responses to the environmental parameters (the family Rhopalonematidae, the order Siphonophorae, the genus Botrynema, the phylum Ctenophora, the family Aeginidae and the species A. tenella).
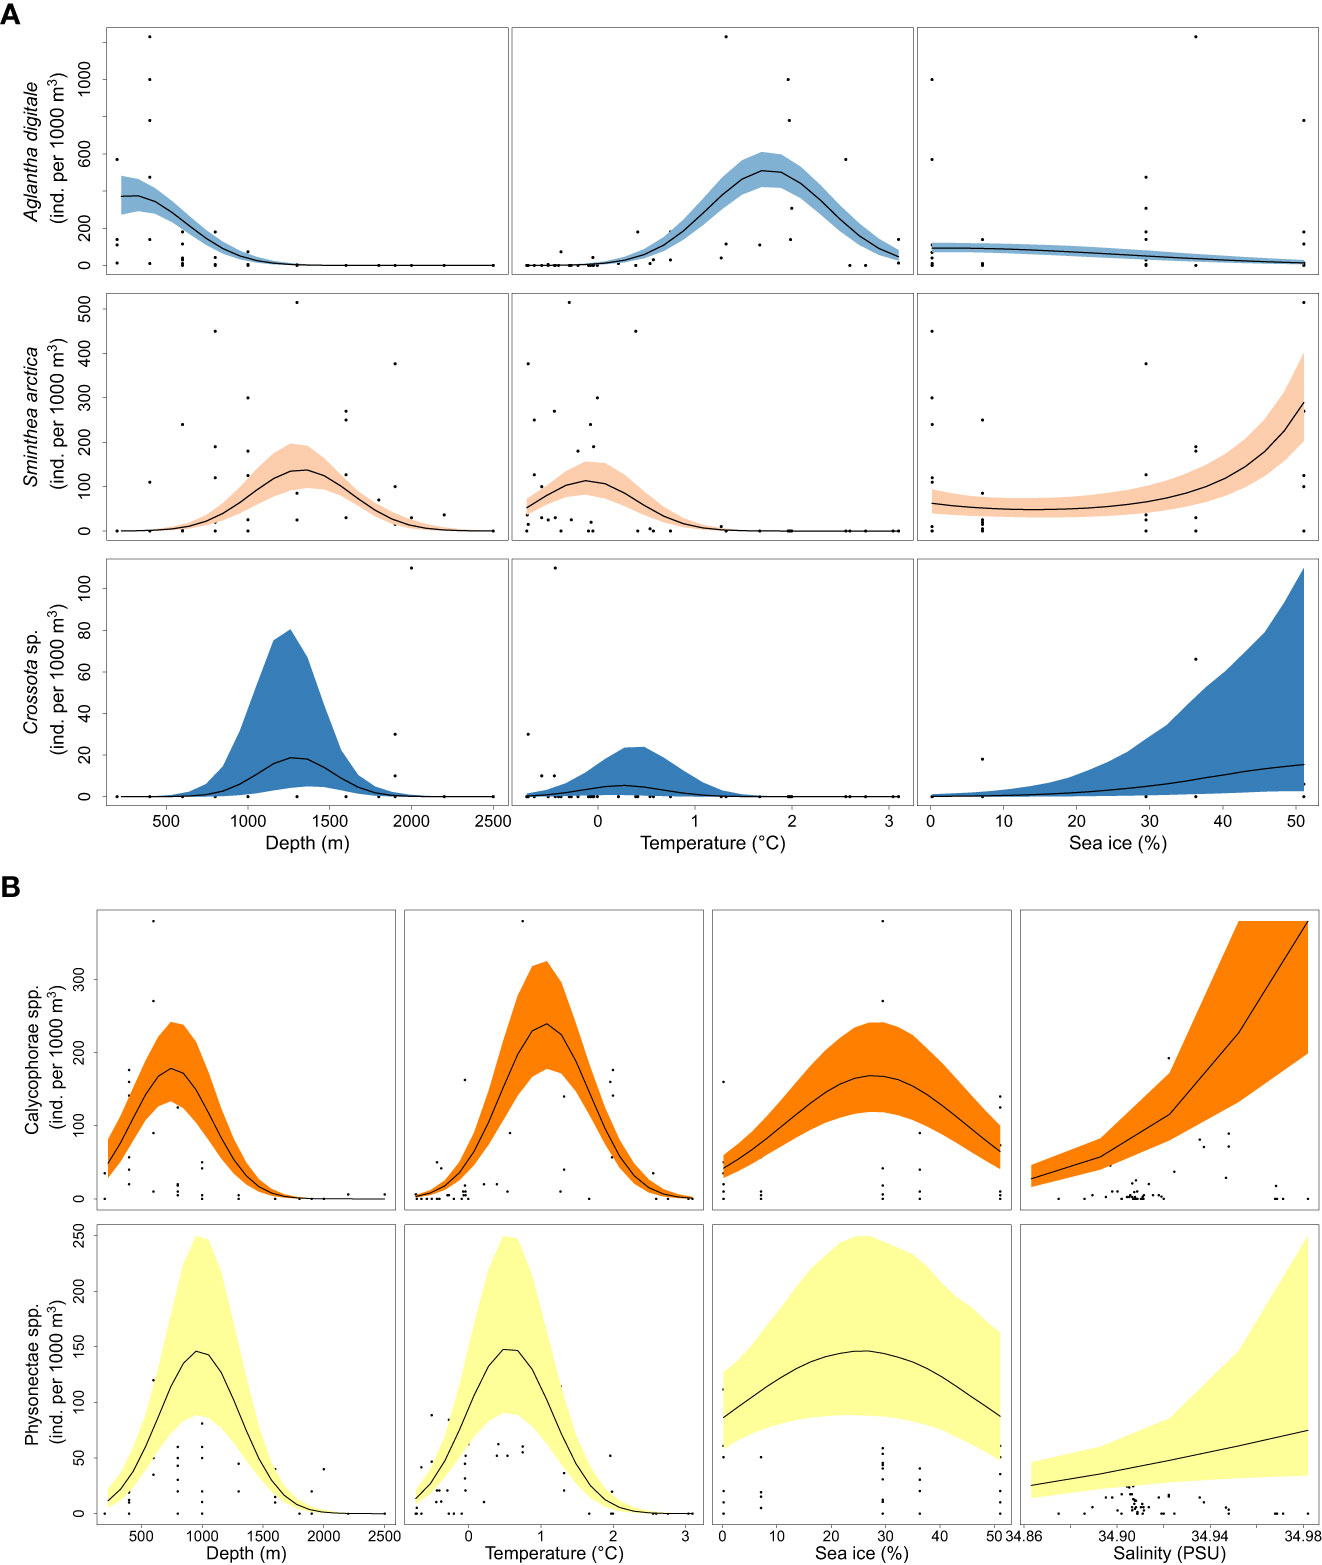
Figure 6 Predicted gradients of total count (Poisson model) of the (A) Rhopalonematidae family and (B) the Siphonophorae order.
Rhopalonematidae family
The Rhopalonematidae family, here composed of A. digitale, S. arctica, and Crossota sp., represented the most dominant group in the study area, accounting for 49% of the observations (Figure 2). We observed a clear separation in the preferred environmental conditions for A. digitale and S. arctica, which were found at approximately 800 m depth and 0.8°C (Figure 6A). Aglantha digitale is normally distributed with a peak at 1.8°C and a depth of 250-300 m (Figure 6A). In contrast, S. arctica was most abundant at 0°C and 1250-1300 m depth. Crossota sp. showed its highest abundance values at a depth of 1300 m and a temperature of 0.2°C. Analysis of sea-ice conditions revealed that A. digitale preferred more open ocean areas, while S. arctica and Crossota sp. were more abundant in sea-ice-covered waters (Figure 6A).
Siphonophorae order
The order Siphonophorae, including Calycophorae and Physonectae spp., was the second most dominant group in our study, representing 29% of the total observations (Figure 2). Within this order, we also observed a separation of preferred niche conditions (Figure 6B). The abundances of Calycophorae and Physonectae spp. were normally distributed around 750-800 m and 950-1000 m respectively (Figure 6B). In terms of temperature, Calycophorae spp. showed its peak abundance at 1.1°C, while Physonectae spp. reached its peak at 0.5°C (Figure 6B). The predictive gradient across the sea-ice gradient showed that both sub-orders were more abundant at average sea-ice cover of 25-30%, mainly in marginal sea-ice zones (Figure 6B). Regarding salinity, representatives of the suborder Calycophorae and Physonectae spp. responded positively to an increase in salinity (Figure 6B), with the former showing a stronger response and reaching an abundance of 300 individuals per 1000 m3 at 34.96 PSU, and the latter reaching 70 individuals per 1000 m3 at the same values.
Botrynema genus
The Botrynema genus represented 7% of the observations and included B. brucei, B. ellinorae, and unidentified Botrynema spp. (Figure 2). Both B. brucei and B. ellinorae had a similar depth distribution with a peak at 1250-1300 m, whereas unidentified Botrynema spp. were observed at shallower depths with a maximum distribution at 950-1000 m (Figure S7A). The temperature distribution followed a similar pattern, with B. brucei and B. ellinorae having peaks of abundance at 0.1-0.15°C, while the undetermined Botrynema spp. showed maximum abundance at slightly warmer temperatures of 0.4-0.5°C. All taxa exhibited a moderately positive response to sea ice (Figure S7A).
Ctenophora phylum
The Ctenophora phylum included Lobata spp. and Beroe spp., which accounted for 5% of all observations (Figure 2). These taxa showed distinct unimodal patterns along temperature and depth gradients (Figure S7B). Beroe spp. had a peak of abundance at 550-600 m and 1.4°C, whereas Lobata spp. peaked at 1150 m and 0.5°C (Figure S7B). Within the study area, Beroe spp. preferred sea-ice free conditions, with the highest abundances observed at 13% sea-ice coverage. In contrast, Lobata spp. showed higher abundance in denser sea-ice conditions, with a peak at 40% sea-ice coverage (Figure S7B).
Aeginidae family
The family Aeginidae, comprising B. bouilloni and S. bitentaculata, represented 4.5% of all recorded taxa (Figure 2). Both species showed similar distribution patterns with respect to depth and temperature, with B. bouilloni being most abundant at 1350 m and 0.15°C, and S. bitentaculata at 1300 m and 0.1°C. Both species showed a positive association with dense sea ice (Figure S6C).
Atolla tenella
The only scyphozoan species observed in our study was A. tenella. This species was found at depths between 800 and 2500 m, with a maximum abundance at 1400m. It was found at the lowest temperatures observed in the region, with a peak abundance at -0.2°C, and in areas of high sea ice cover (>50% sea ice cover; Figure S6D).
Spatial patterns and projections
Taxa richness
Based on the results of the presence-absence model, we were able to estimate the richness of taxa in the study area for the years 2020, 2030, 2040, and 2050 (from June to September). The maximum values of taxa richness for all modelled time intervals were observed at a depth of 1700 m (9-11 taxa), and the lowest in the pelagic layer of 230 m (4-6 taxa; Figure 7; Figure S9). Throughout the entire period of simulation, we found a gradual decrease in taxa richness with a maximum richness loss at the year 2050 (-14.06% compared to 2020, for all vertical layers; Figure 7). We observed the greatest loss of taxa richness in the pelagic layer at a depth of 230 m (-31.25%; Figure 7; Figure S9). The loss of taxa richness gradually decreased with depth, in the bathypelagic layer the decline was on average ~10% (Figure 7; Figure S9).
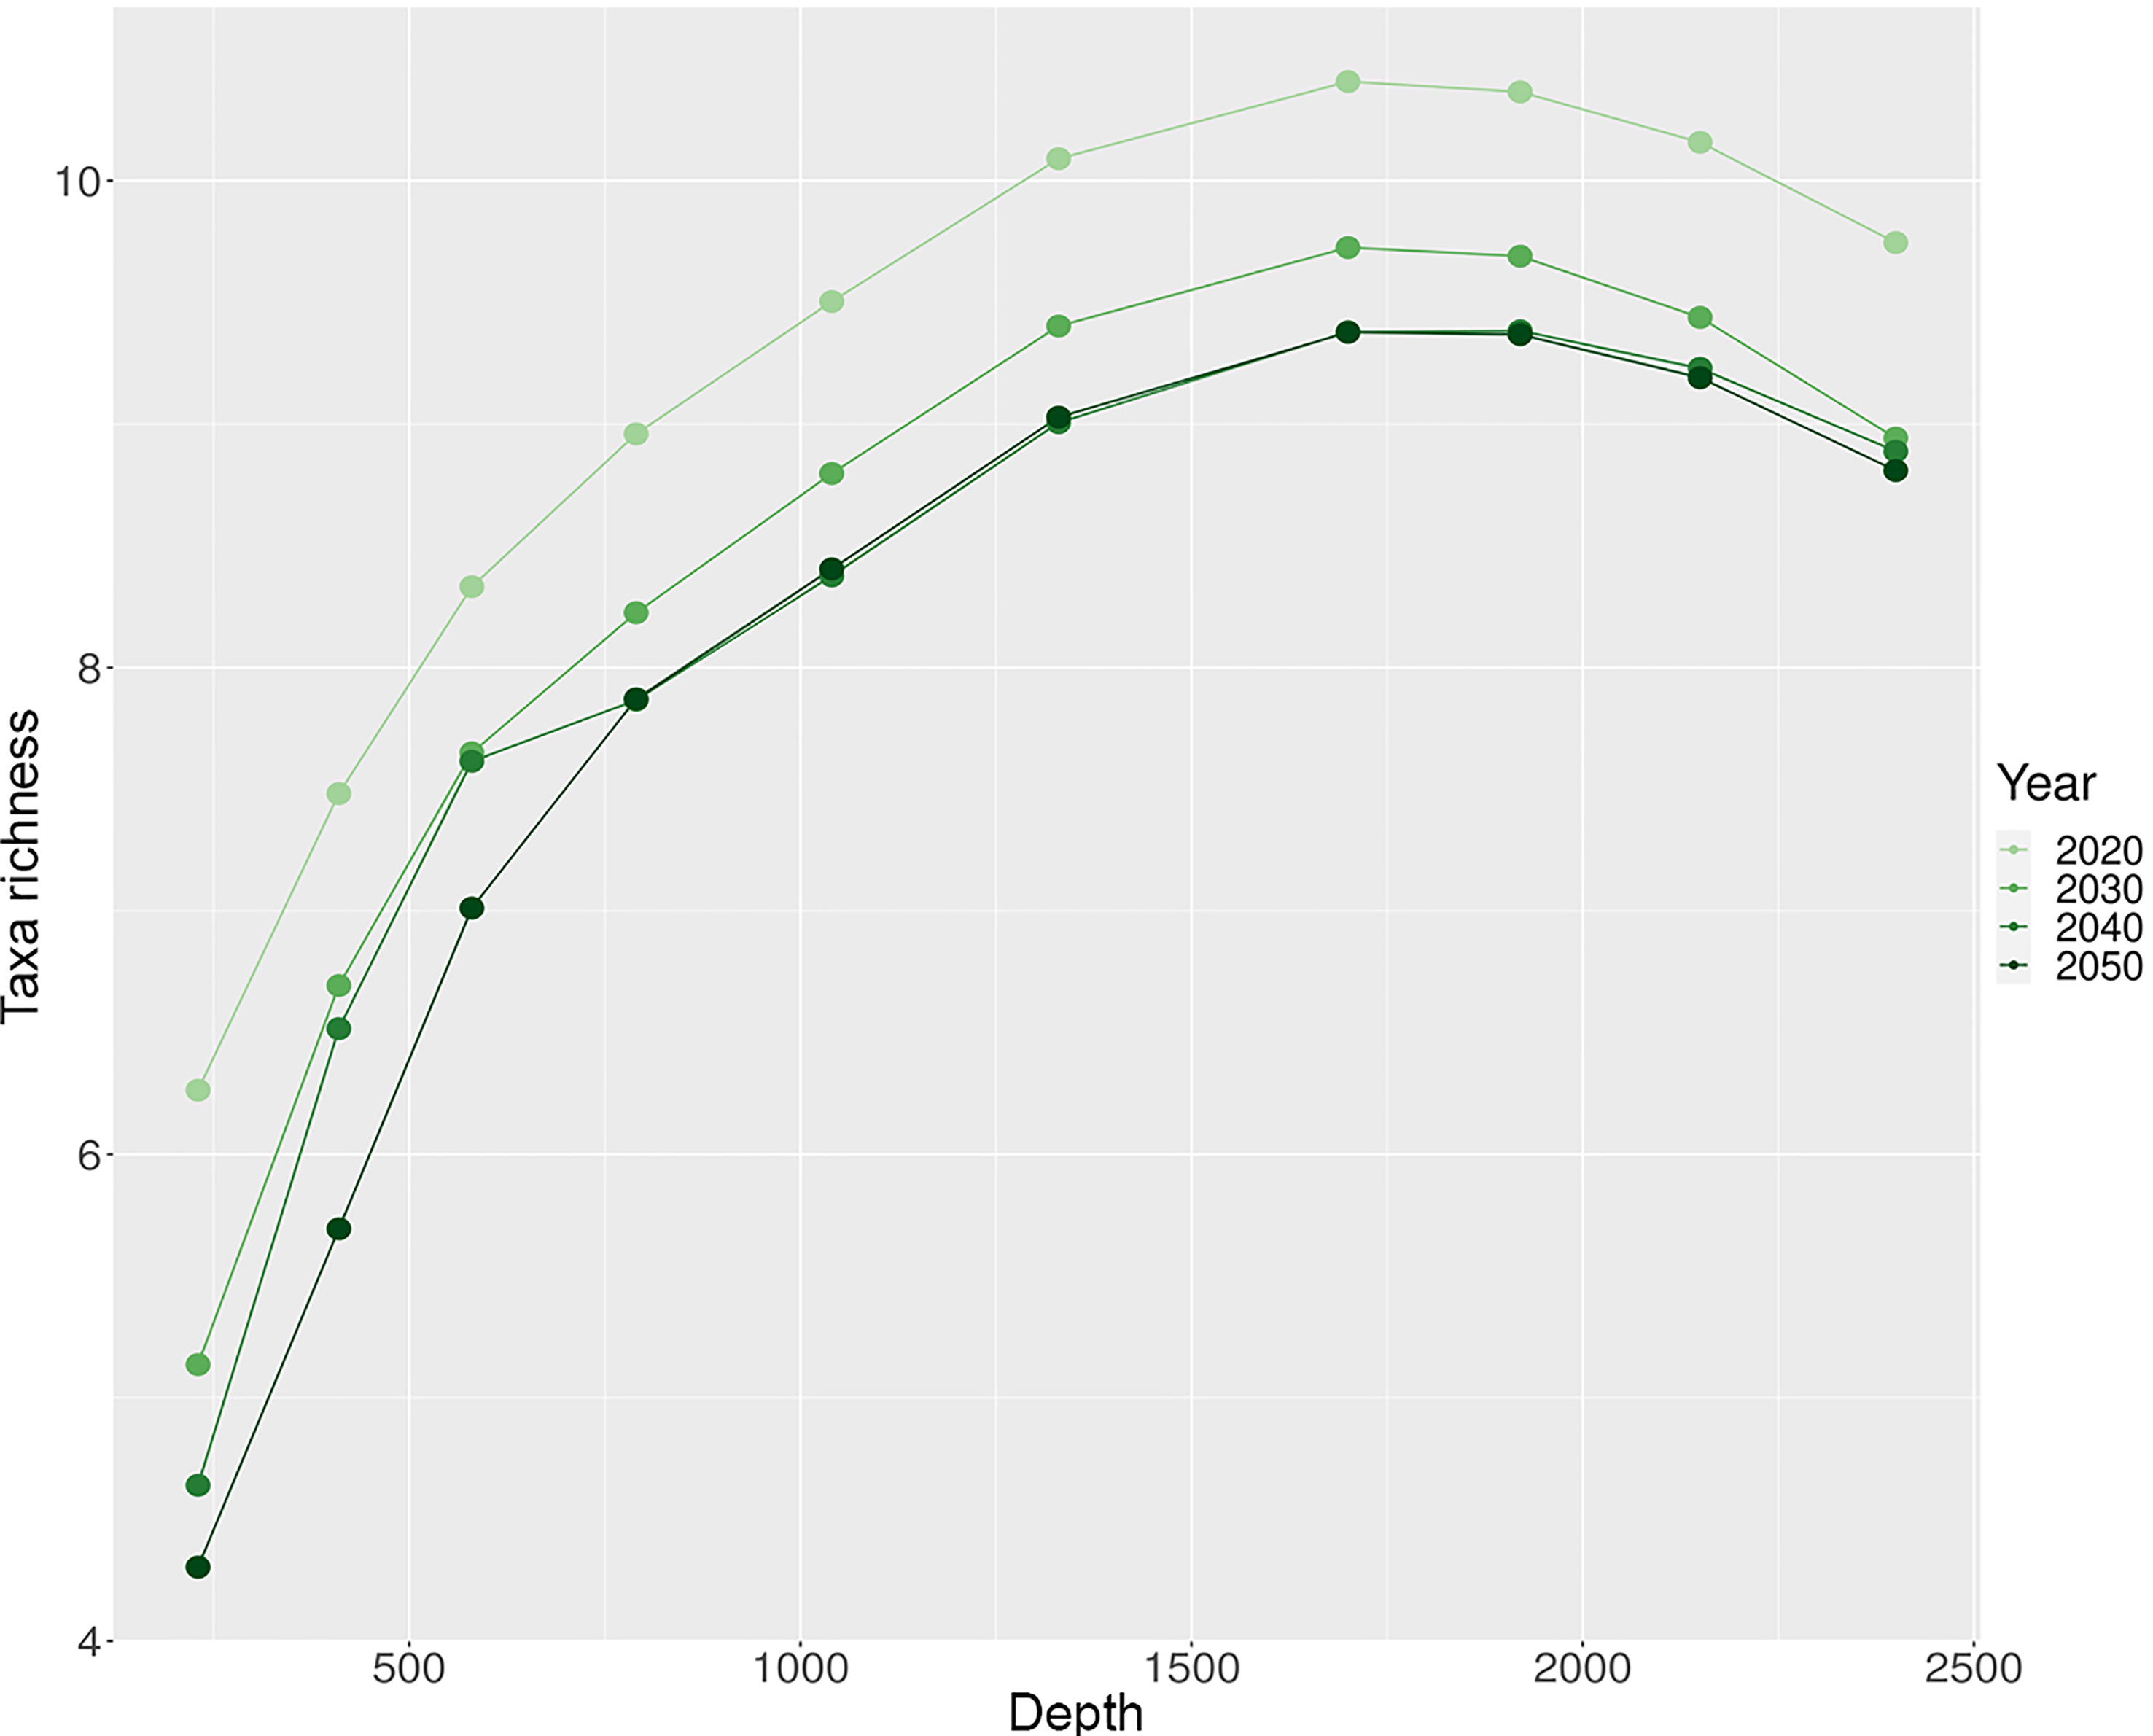
Figure 7 Current and future values (summer season) of species richness at different depth layers. Species richness values were calculated as the mean for each depth layer.
For the upper 230-410 m layers (in the year 2020), we observe the lowest taxa richness in the northeastern part of the region, where the West Spitsbergen Current dominates (Figure S9). The highest taxa richness in these layers is observed in the convergence zones of the West Spitsbergen and East Greenland Currents (Figure S9). By 2050, there is a decrease in taxa richness in these layers in the western region (Figure S9). Comparing this to oceanographic conditions, we may see an increase in temperature in the western region due to an amplification of Return Atlantic Current. At depths of 580 and 790 (in the year 2020), the greatest taxa richness is observed in the northern part of the region, as well as in the convergence zones of currents. By the year 2050, the northern region will have lost most of its taxa richness on these depths, but it will still persist at the edges of the currents (Figure S9). At depths from 1040 to 2400 m in 2020, the greatest taxa richness is observed in the northwestern part of the region. By 2050, taxonomic diversity at these depths will be reduced throughout the entire region (on average, 8-9 taxa per site), with a slight preponderance (6-7 taxa per site) in the southeastern part (Figure S9).
Individual taxa
Based on the results of the 4-fold cross-validation of the Poisson model, we selected four taxa for spatial projections with the highest predictive power (pseudo-R2 > 0.4; Figure S5). These included two species of the family Rhopalonematidae (A. digitale and S. arctica) and the suborder of Siphonophorae (Physonectae spp.). These taxa were projected onto the most favorable depth layers, based on the information derived from prediction gradients (Figures 6A, B).
Rhopalonematidae family
The vertical niches of A. digitale in Fram Strait will narrow over the period from 2020 to 2050, but overall the abundance in the entire water column will increase by 2% (Figure 8; Figure S8A). By 2050, A. digitale will lose up to a quarter of its abundance in the upper 290 m and also decrease at 790 m, but its abundance will increase in the middle layers of 410 and 580 m by 24% and 18% correspondingly (Figure 8; Figure S8A). The spatial distribution patterns of A. digitale are described by the Arctic and Atlantic water masses convergence zones, with the maximum number of individuals found in these areas (Figure 8). With warming in the northwestern part of the region and the retreat of the sea-ice by 2050, the area of high abundance of A. digitale will disappear at the depth of 290 m (Figure 8). A similar high abundance area at this depth along the entire western section from 6 to 8 west longitude will move to a deeper depth of 410 m, where an increase in the abundance of A. digitale will be observed (Figure 8).
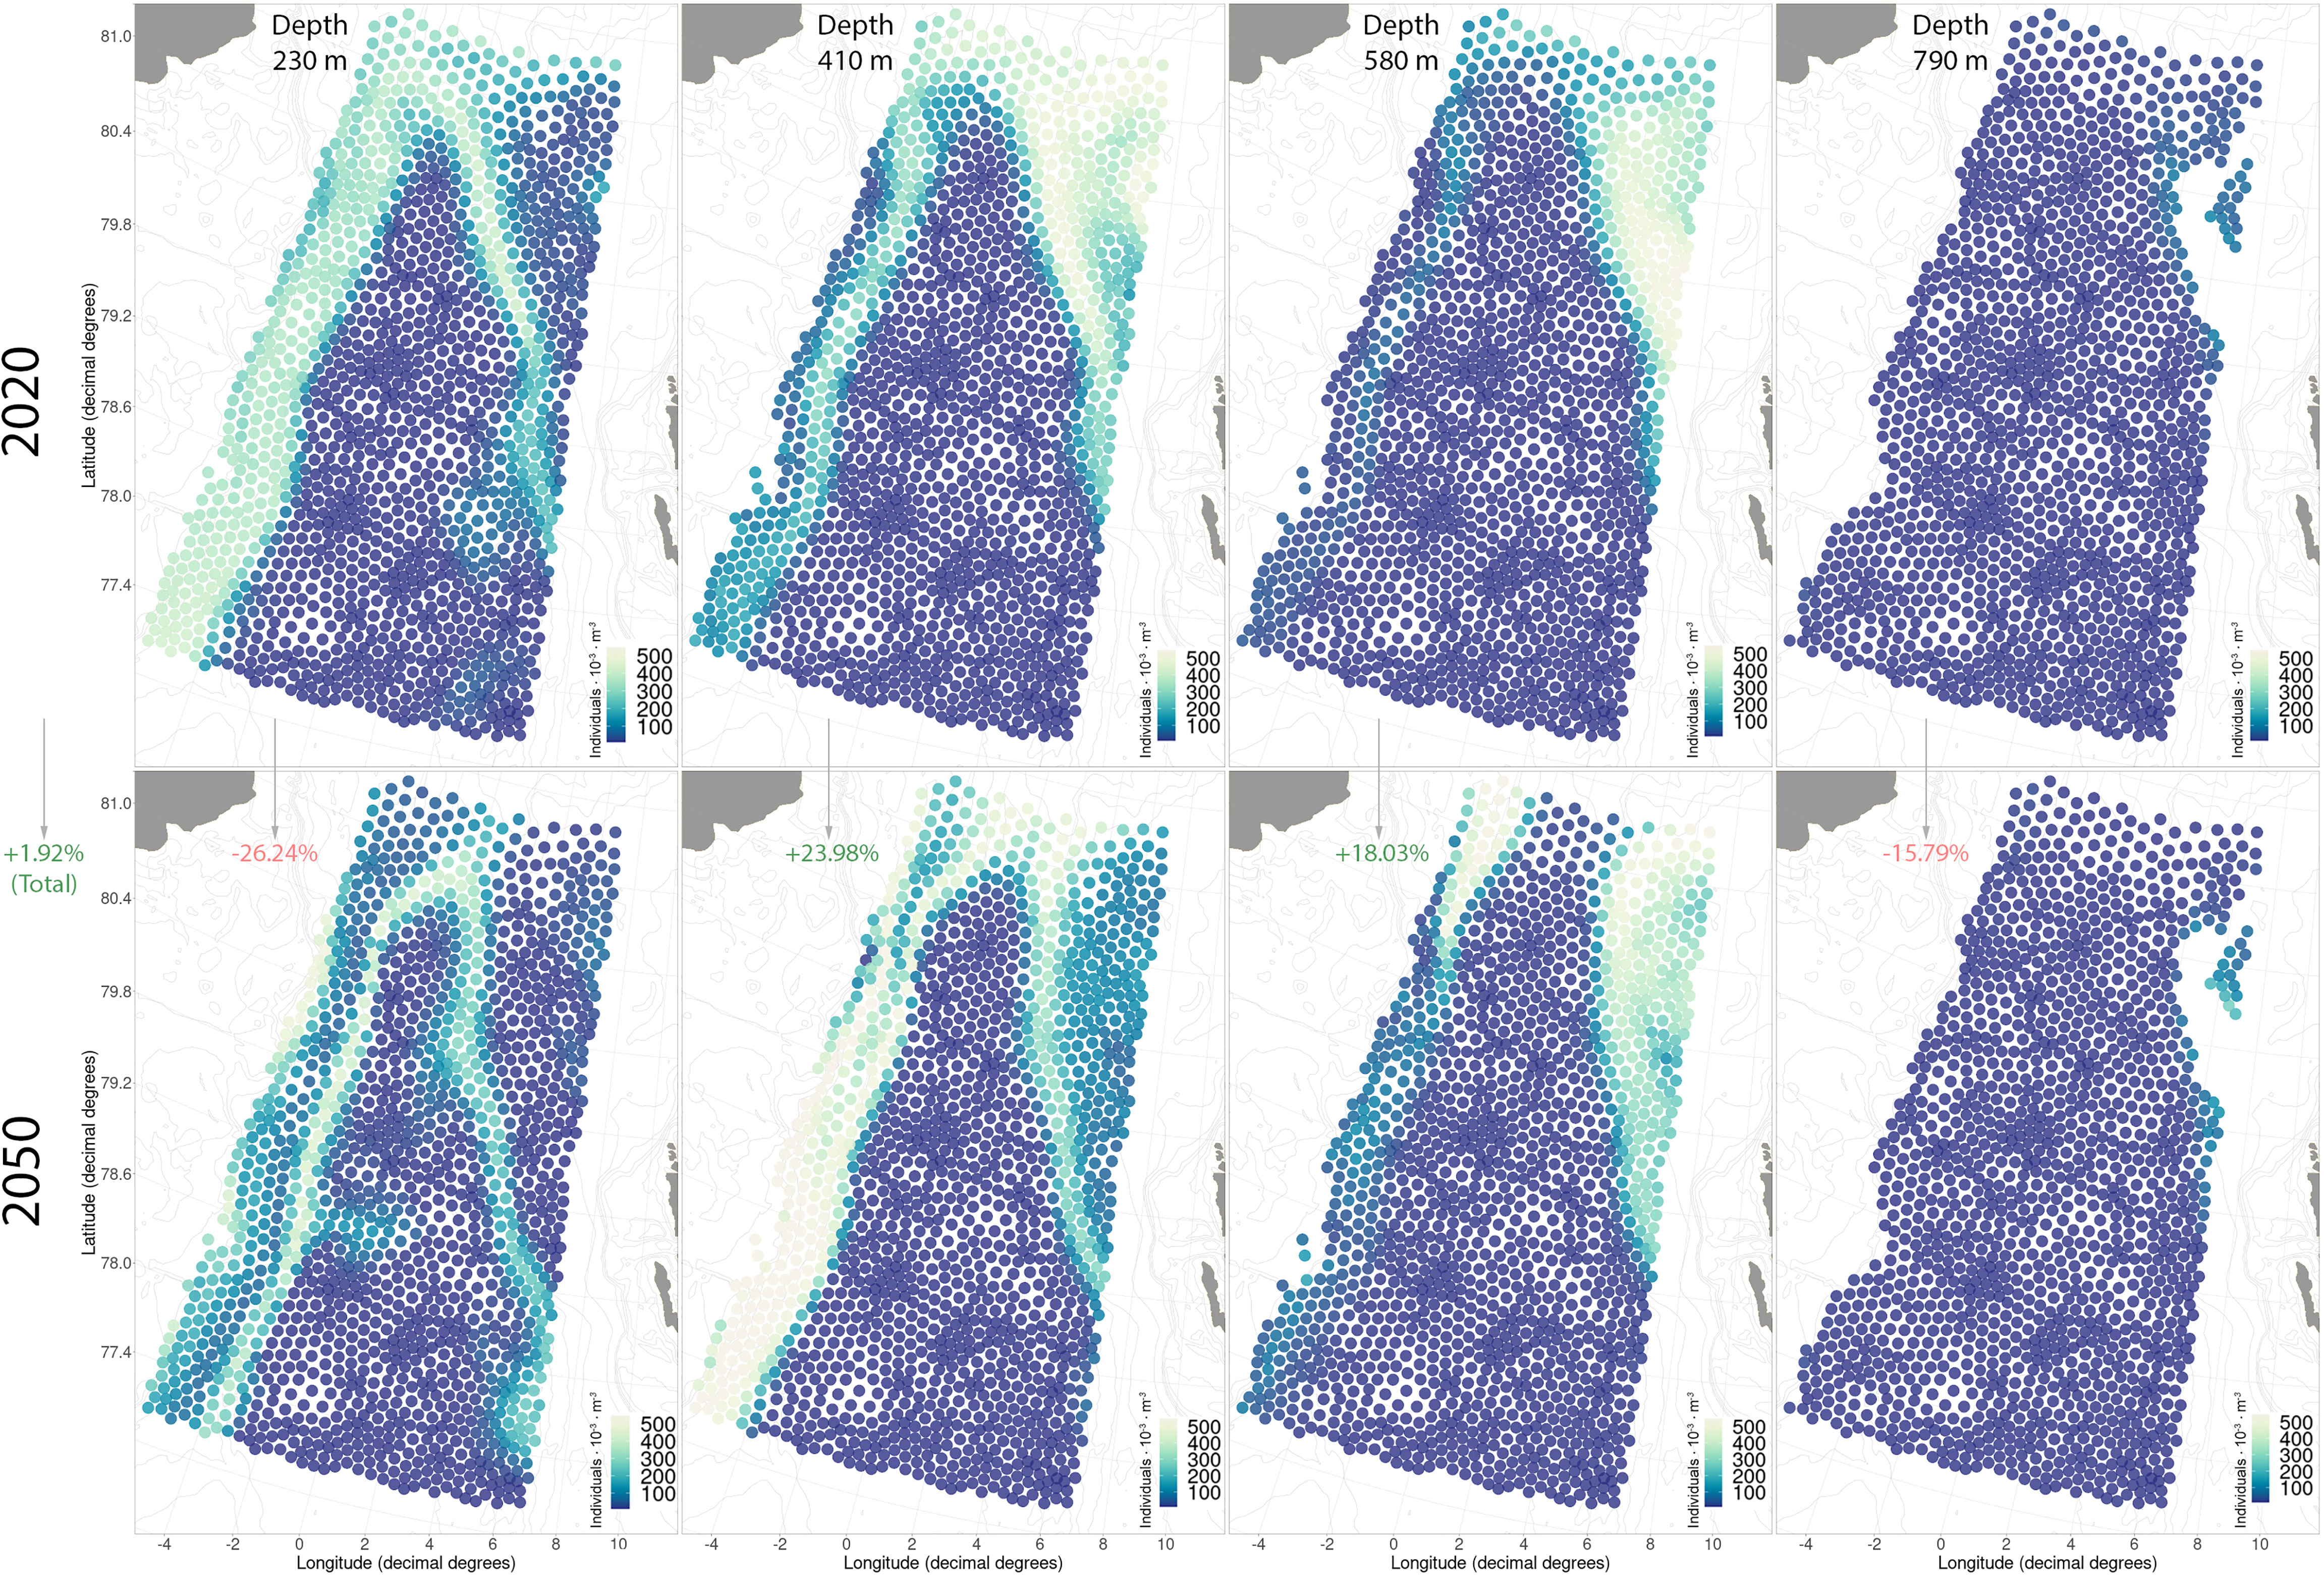
Figure 8 Current and future distributions of Aglantha digitale in the studied region. The red/green values in parentheses give a comparative measure of the retreat/increase in abundance of the selected taxa (summer season of 2050 compared to 2020).
Another member of the family Rhopalonematidae, S. arctica, will experience a greater reduction in preferred niche conditions compared to A. digitale (Figure S8). Sminthea arctica will lose up to 60% of its abundance at all depths by 2050 (Figure 9; Figure S8B). The highest projected abundance of S. arctica for 2020 was found in the northwestern section of the region where it reaches fairly high numbers of >1000 individuals per 1000 m3 (Figure 9). However, with the retreating of the sea-ice and warming in this part of the Fram Strait, we will observe the loss of the northwestern high abundance area and a shift of the main center of abundance to the southeastern part of the region with much lower numbers of ~300 individuals per 1000 m3 (Figure 9).
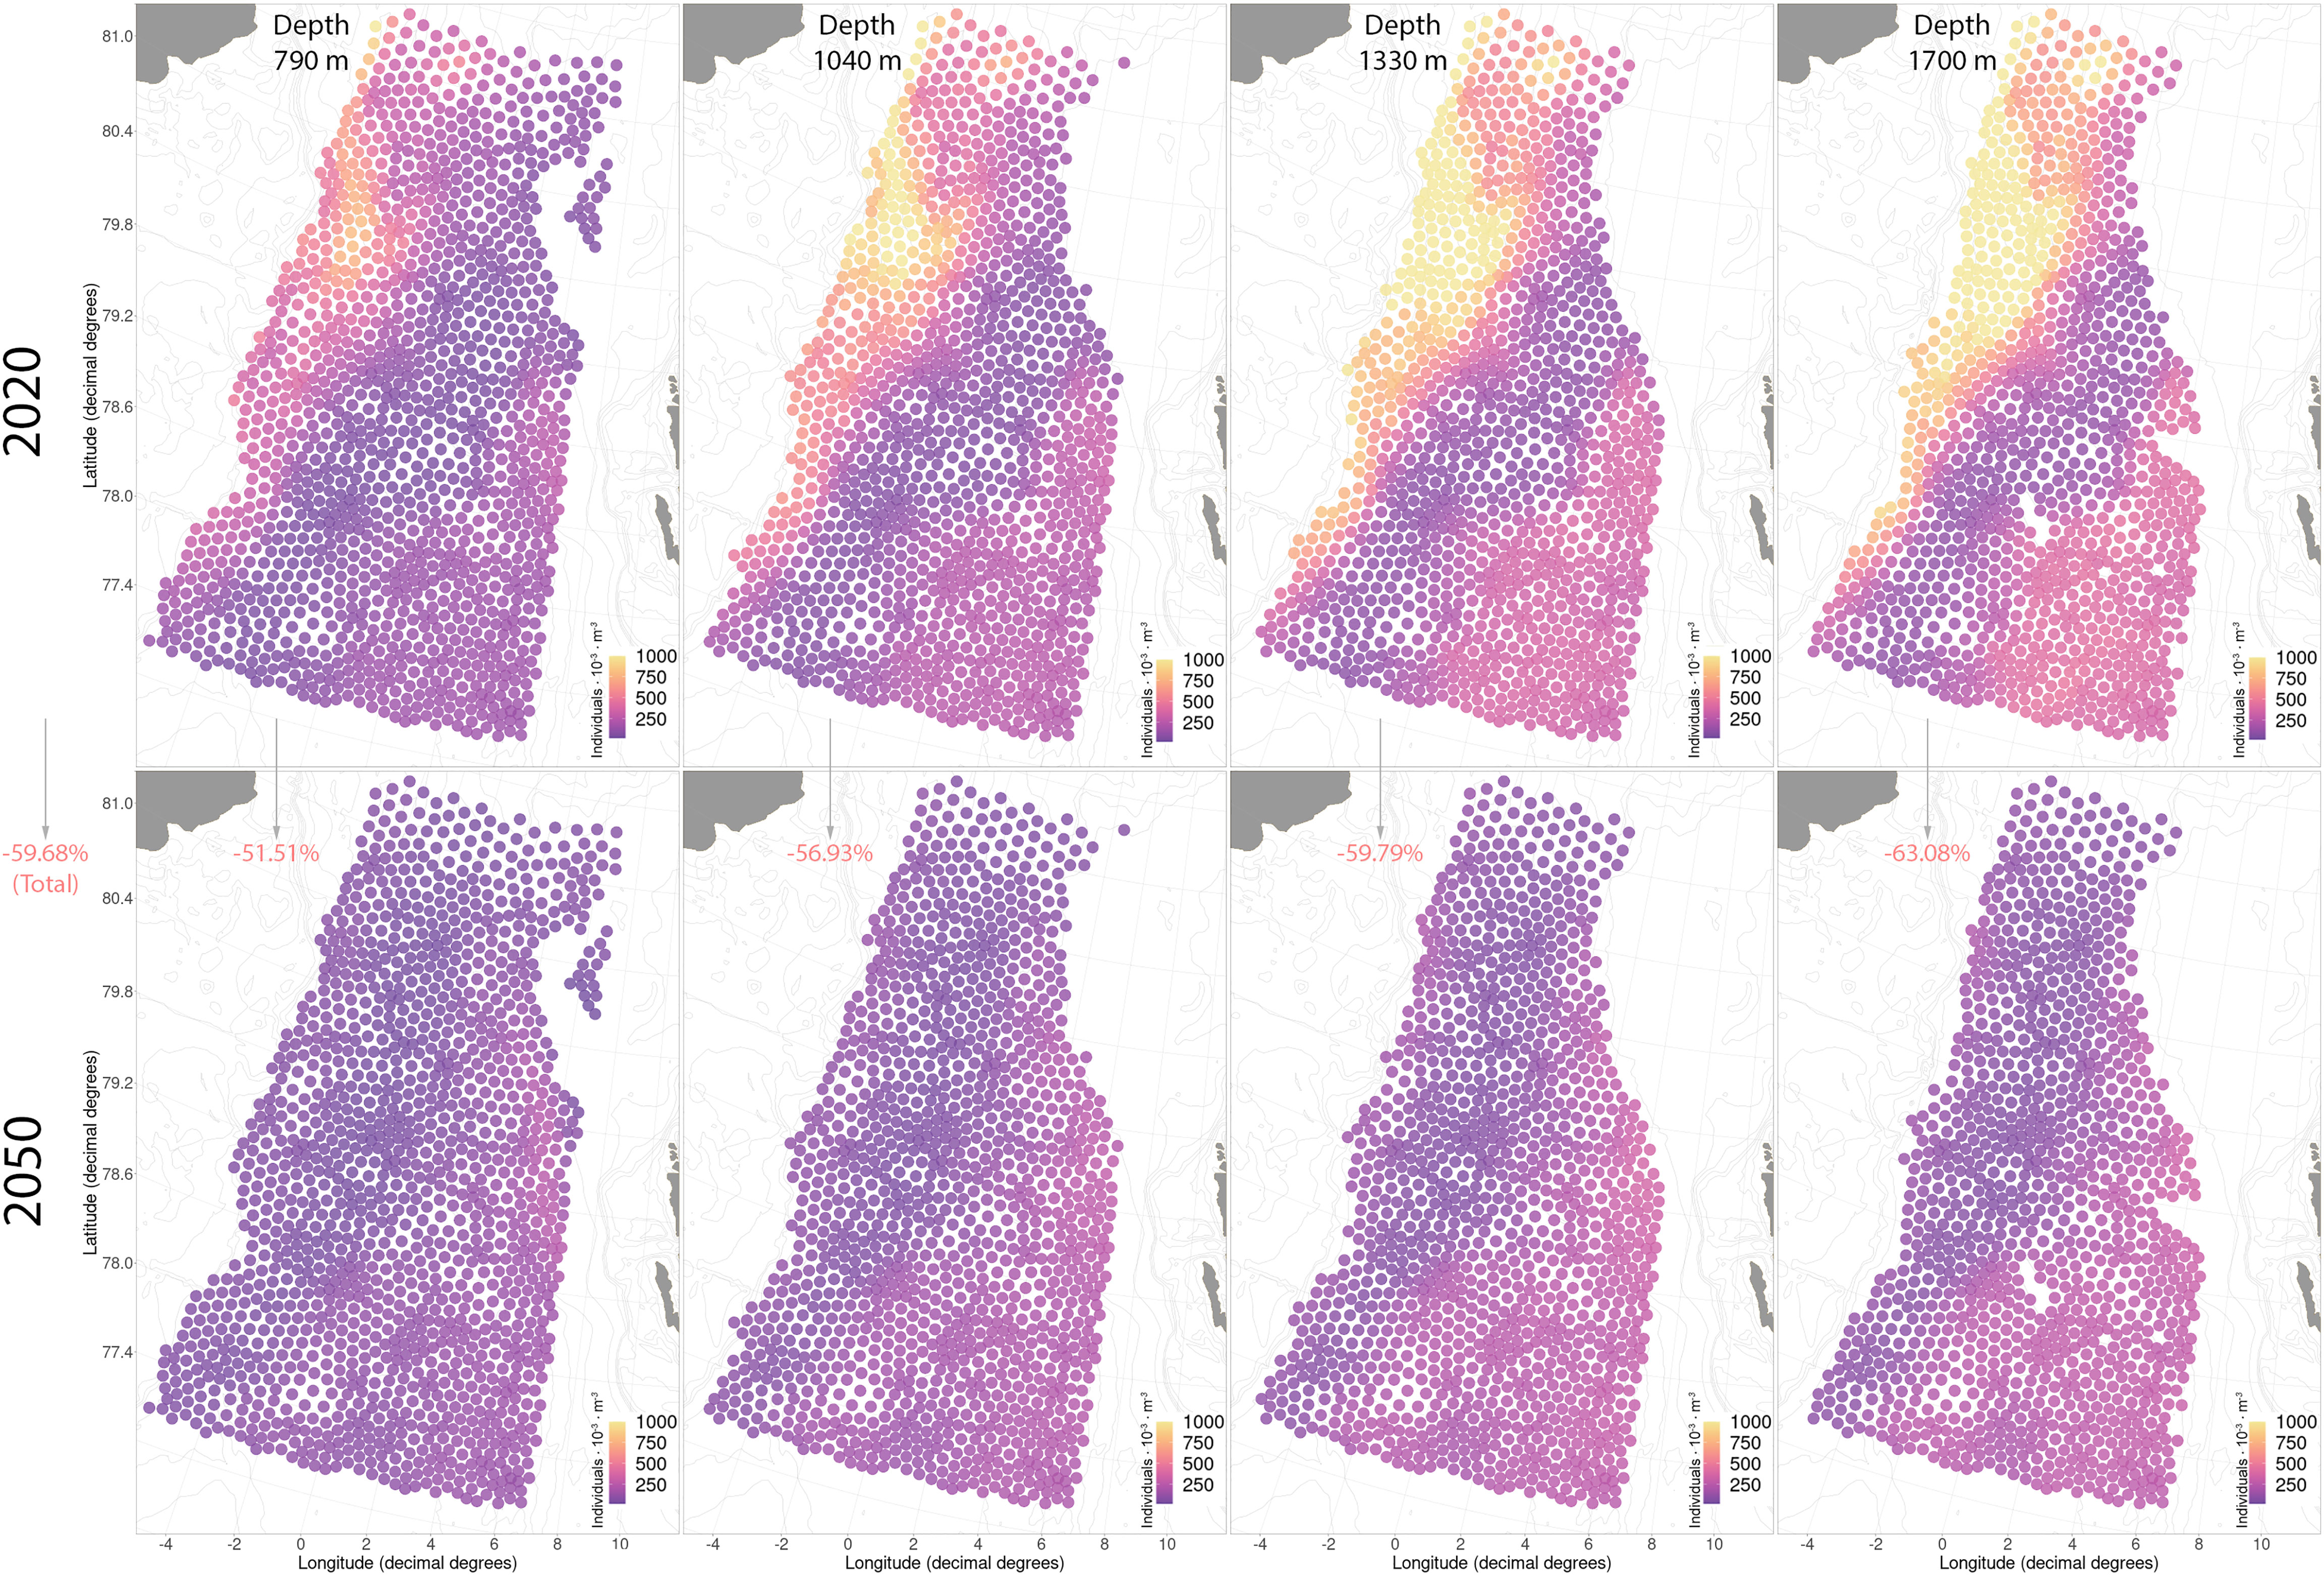
Figure 9 Current and future distributions of Sminthea arctica in the studied region. The red/green values in parentheses give a comparative measure of the retreat/increase in abundance of the selected taxa (summer season of 2050 compared to 2020).
Siphonophorae order
Physonectae spp. will experience a reduction in abundance by 17.62% across all vertical strata by 2050 (Figures S10, S11). The highest abundance of Physonectae spp. is found present in layers of 580 and 790 m in the northeastern part of the region in 2020 (Figure S11). Until 2050, spatial patterns in these depth layers will not undergo strong transformations (Figure S11). In the layers of 1040 and 1330 m, the highest abundances of Physonectae spp. are observed in the southeastern part of the region, which will also not be submitted to strong changes on the temporal scale (Figure S11). However, by 2050, an increase of the Physonectae spp. abundances will be observed in the northwestern part of the region (Figure S11).
Discussion
Gelatinous zooplankton data and modelling
Gelatinous zooplankton in the Fram Strait has previously been studied via multiple-open-and-closing nets in epipelagic and mesopelagic layers (Mańko et al., 2020). Our study is the first survey in mesopelagic and bathypelagic layers of the Fram Strait using a video-transect approach, which in combination with joint distribution modelling allowed us to reconstruct a three-dimensional structure of mesopelagic and bathypelagic GZ diversity and abundance. Monitoring via video-transects with ROVs (e.g., Robison et al., 2010) is a well-established method in the deep sea and has advantages over traditional multiple-open-and-closing nets in that it provides a precise spatial position of the detected object as well as the corresponding environmental data (Robison, 2004; Hoving et al., 2019). Some GZ taxa can only be observed or more reliably identified with in situ surveys as they are damaged or fragmented in nets due to their fragility (Raskoff et al., 2003; Hosia et al., 2017; Hoving et al., 2020a). Despite their many advantages, deep-sea video transects also have their limitations. For some taxonomic groups, the video resolution did not allow identification to the species level (e.g., for the suborders Calycophorae and Physonectae). To enhance the reliability/resolution of the taxonomic data, future surveys in the area could combine the use of ROV and PELAGIOS for close-range observations and subsequent sampling.
Generally, studies identifying preferred niche conditions for some GZ species in the Fram Strait are presented only as part of global species biodiversity distribution projects (e.g., Palomares and Pauly, 2021), with maps based only on presence data obtained from public datasets (e.g., OBIS, GBIF). Due to the lack of traceability and quality control of the data on GZ in these databases, the subsequent modelling is accompanied by a strong bias, and, as a consequence, these results should be treated with care (Lindsay et al., 2017). Such models produce output in a probabilistic form and are mainly done on a two-dimensional scale. Neglecting depth in the modelling process can lead to incorrect and potentially misleading results (Duffy and Chown, 2017). Due to the accurate spatial in situ data on the GZ community obtained with PELAGIOS, we were able to apply a joint species distribution modelling approach (HMSC). Based on this, we were able to project the model results of the three taxa with the highest predictive power (A. digitale, S. arctica, Physonectae spp.) onto three-dimensional oceanographic grids from the FESOM model. Despite good predictive power for some taxa, the predictive curves for the deep-sea taxa A. tenella and B. bouilloni showed a rather weak fit with the raw data. By adding data from upcoming expeditions, the predictive response of less abundant taxa should increase and will allow us to conduct spatio-temporal projections also for these species.
Current state of the knowledge on gelatinous zooplankton in the Fram Strait
The taxonomic composition of the GZ communities in our study area are consistent with previous studies of mesopelagic and deep-water GZ communities in the Arctic Ocean (Raskoff et al., 2005; Raskoff et al., 2010) and in particular in the Fram Strait (Mańko et al., 2020). However, a discrepancy with the previously mentioned studies can be found for the epipelagic layer. Light disturbance and large amounts of particulate organic matter decreased the quality of the video transects in the epipelagic zone. Hence, ctenophore diversity could not be estimated for the epipelagic layer, where this group is known to be abundant (Raskoff et al., 2010). It is likely that the epipelagic ctenophores, recorded and annotated under Ctenophora spp., mainly represented the species Mertensia ovum. The latter is known to be the most common ctenophore species in the epipelagic layer of the Arctic Ocean (Raskoff et al., 2005; Raskoff et al., 2010), particularly in the Fram Strait (Mańko et al., 2020). Due to their similar morphological traits, these ctenophores may consist of different, hitherto undescribed, closely related cryptic species (Majaneva and Majaneva, 2013). Since studies focusing on Arctic GZ connectivity and assessing species status with molecular tools are limited, it is likely that several of the species considered in this study could be complexes of overlooked, or cryptic, species. As an example, recent findings combining molecular and morphological tools have revealed several new species in the genus Atolla in the Pacific (Matsumoto et al., 2022).
Overall, PELAGIOS provided a greater understanding of the diversity and abundance of the mesopelagic and deep-sea GZ communities. We observed the genuine Arctic deep-sea Narcomedusae species B. bouilloni, which was considered to be absent in the Fram Strait (Ronowicz et al., 2015; Mańko et al., 2020). Surprisingly, we recorded a relatively high abundance at the northern and north-western stations. Another representative of the order Narcomedusae, S. bitentaculata, was observed with PELAGIOS at all stations in the depth range 600-2200 m, but it is rarely sampled with nets. These depths were however well sampled in this region using multinets (Mańko et al., 2020; Havermans et al., 2021); such an undersampling with nets may be due to their relatively low density in the water column and active escape reaction.
Our data support the suggested prevalence of Arcto-boreal taxa in the Fram Strait (Table S2). Among all taxa, we recorded only two true Arctic species, B. bouilloni and A. tenella. All other species mainly represented Arcto-boreal or cosmopolitan taxa (according to the classification by Ronowicz et al., 2015). Pronounced niche segregation along the temperature gradient was found among both the true Arctic and cosmopolitan species of the order Narcomedusae. Namely, B. bouilloni, which is a true deep-sea Arctic species, was found in the lowest temperature conditions and deeper depths. In contrast, S. bitentaculata, which is a cosmopolitan species (although it has been suggested it may be actually composed of multiple cryptic species; (Lindsay et al., 2017; Verhaegen et al., 2021), was found across a wider temperature and depths ranges.
The effect of environmental drivers on gelatinous zooplankton
Temperature and depth were the major explanatory variables in the distribution of GZ. This coincides with the results of another community modelling study of GZ by Luo et al. (2014) in the Southern California Bight which revealed similar patterns, with temperature and depth having a large influence on GZ population dynamics in the epipelagic layer. We found that the majority of GZ taxa belong to the class of Hydrozoa (12 out of 20 identified taxa) and their distribution patterns were predominantly explained by the temperature gradient. The high explanatory power of temperature on hydrozoan abundance could be explained by increased respiration and growth rates associated with warmer waters (Ma and Purcell, 2005; Møller and Riisgård, 2007). Although salinity has been stated to clearly affect the distribution of GZ (Mills, 1984), it only had a minor influence on the distribution of GZ in a previous modelling study by Luo et al. (2014). Similarly, in our study, salinity only played a minor role among the explanatory variables. While the overall contribution of salinity to the explanatory power of the models was low, this factor influenced the distribution of the order Siphonophorae in the Poisson model. Similar patterns were observed by Luo et al. (2014); one possible explanation for this may come from the fact that the buoyancy of siphonophores is driven by passive osmotic accommodation in response to changes in the salinity of the medium, rather than active density regulation (Mackie et al., 1988). The explanatory power of the sea-ice on the distribution and abundance of GZ was low, and only had minor importance for taxa that occurred in the upper water column such as Calycophorae spp. A possible explanation is the spatial and temporal mismatch between PELAGIOS sampling stations and data obtained from satellites, as well as the limited number of dives. In addition, sea-ice indirectly affects the abundance and distribution of GZ and alternates more direct proxies such as energy and carbon flux in the water column. The inclusion of more direct proxies, such as values of particulate organic carbon at different depths in combination with sea-ice concentrations, could potentially increase the explanatory power of the models.
Vertical niche segregation and current spatial patterns of gelatinous zooplankton
The total diversity of GZ tends to increase with depth (Kosobokova et al., 2011; Gluchowska et al., 2017; Mańko et al., 2020). Our study corroborated this result: the highest taxa richness was found at 1100-1200 m depth. GZ taxa often aggregate and feed at pycnoclines and convergence zones (Youngbluth and Båmstedt, 2001; Toyokawa et al., 2003; Youngbluth et al., 2008). On the projected spatial grids the highest taxa richness in the mesopelagic layer was found at the convergence zone of Arctic and Atlantic water masses. Similar patterns were found by the spatio-temporal projection of both taxa richness and abundance of selected taxa.
Gelatinous zooplankton tends to occupy relatively narrow depth ranges that often do not overlap between species (Lindsay and Hunt, 2005; Hoving et al., 2020a). Distinctive vertical niche segregation was found within the family of Rhopalonematidae (A. digitale, S. arctica) and the order of Siphonophorae (Physonectae spp., Calycophorae spp.). In addition to the vertical niche segregation of A. digitale and S. arctica, a clear separation was found in the horizontal dimension, in the layers where their vertical niches partially intersect (580 and 1040 m; based on the FESOM grids for the year 2020). Aglantha digitale is mainly occurring in the northeastern parts of the region where the warmer West Spitsbergen Current is present, while S. arctica is occurring in the western and southeastern parts of the region where the colder East Greenland Current is dominant. The most prominent separation is observed at the convergence zone of the warm West Spitsbergen Current and the East Greenland Current, characterized by higher sea-ice coverage, in the northeastern part of the Fram Strait.
Siphonophores are also well known for their mutually exclusive depth distribution ranges among species (Musayeva, 1976), in particular in the Arctic Ocean (Raskoff et al., 2010; Mańko et al., 2020). A study in the Canada Basin of the Arctic Ocean showed a distinctive vertical niche segregation of siphonophores with Physonectae spp. found in the shallower water column, while Calycophorae spp. inhabit deeper layers by (Raskoff et al., 2005). The inverse vertical distribution of these siphonophores was found in Fram Strait (Mańko et al., 2020). The latter is in agreement with our data, as we found Calycophorae and Physonectae spp. peaking in abundances at 750-800 and 950-1000 m, respectively. The difference in vertical distribution with the Pacific sector most likely lies in the fact that Atlantic water in the Beaufort Sea extends deeper into the water column (Raskoff et al., 2005). Moreover, different developmental stages of Calycophorae spp. tend to aggregate in different parts of the water column (Mańko et al., 2020). To clarify the distribution of these suborders, additional information on the species composition and life cycle stages is needed.
Gelatinous zooplankton in a changing Arctic
In recent decades, an increase in the inflow of warmer Atlantic water into the Arctic through the Fram Strait has been recorded (Polyakov et al., 2017), which in turn leads to ecosystem responses, including increased production and poleward expansion of boreal species (Ingvaldsen et al., 2021). Based on the results of the FESOM oceanographic model from CMIP6 (Semmler et al., 2018), the trend of an Atlantification of water masses in the Fram Strait will continue with increasing force in the coming decades, with changes in mean temperature being particularly pronounced in the mesopelagic layer. As a result, the region is expected to harbor more abundant, but less diverse GZ communities (Mańko et al., 2020). Our study supports this hypothesis, the highest richness on the predictive gradient was found at 0.3-0.4°C, which correlates to Arctic water. Moreover, spatial modelling results based on the FESOM model indicate that the average change in total richness in the region will be a decrease of ~ 14% by the year 2050 (during the summer season). This decline will be more pronounced in the mesopelagic zone, compared to a milder decline in the bathypelagic zone. On the other hand, based on the Poisson model, we can hypothesize that GZ may become more abundant in these waters. The most abundant communities were found in the temperature range of 1.2-1.3°C, which corresponds to transformed Atlantic water (Beszczynska-Möller et al., 2011). This type of water mass will be more abundant by the end of 2050 compared to 2020 (based on FESOM data). The recovery of spatio-temporal patterns of GZ abundance from the Poisson model appears rather difficult owing to the model’s high sensitivity to values of environmental variables beyond the limits of the trained data.
Based on the study by Mańko et al. (2020), A. digitale is a likely climate change winner, benefiting from the Atlantification. In our study, we found that despite a slight overall increase in the abundance of A. digitale by 2% by 2050, the preferred niche conditions will narrow from 240-790 m to 410-580 m. In contrast, in a long-term study (Hop et al., 2019), A. digitale abundance in the Fram Strait showed a non-linear trend, with their numbers decreasing at offshore stations while increasing at coastal stations. A possible explanation is that the highest abundance of the A. digitale occurs under marginal sea-ice conditions. As stated earlier, we observed a higher abundance of GZ in marginal sea-ice zones. However, with subsequent warming the sea-ice will further retreat, which will reduce the duration of the sea-ice bloom and, consequently, could cause a potential decrease in productivity. Thus, predicting the future spatio-temporal abundance of A. digitale in the offshore zones of the Fram Strait is difficult and would require further studies, including time series data and the inclusion of additional predictive factors (e.g., proxies for organic matter).
Conclusions
Our approach, combining underwater camera-born observations and Bayesian Joint Species Distribution Modelling, revealed the diversity and abundance of mid- and deep-water GZ communities in Fram Strait. The study showed that temperature and depth are the main explanatory factors influencing GZ abundance and taxon diversity. By coupling the model with climate scenarios of environmental changes, we were able to project potential changes in the spatial distribution and composition of gelatinous communities to the year 2050 (during the summer season). The future projections predicted a decrease in the total richness of GZ species in the Fram Strait of 14% by 2050. The decline of taxa richness will be more pronounced in the mesopelagic layer, while changes in the bathypelagic layer will be less pronounced. The abundance of the A. digitale in the Fram Strait will increase by 2% by 2050, however, its preferred niche conditions will narrow throughout the water column. In contrast, the abundance of S. arctica will decrease across the whole water column with an average decline of 60%. The results of these projections can be used to adjust expeditionary efforts to target those areas that would be considered most susceptible to change. With further automation of such surveys, for example, using autonomous underwater observation systems, as well as models for auto-recognition of taxa from the cameras, we will be able to get the most complete picture of the functioning of GZ communities in the Fram Strait.
Data availability statement
The original contributions presented in the study are included in the article/Supplementary Material. Further inquiries can be directed to the corresponding authors.
Author contributions
The idea of this study was conceived by CH, H-JH, and DP. DP, GV, and PN performed visual identification of the PELAGIOS dives. DP performed all analyses, with methodological input of CK, KJ, and GV. DP was responsible for writing, after which extensive input from all authors resulted in the final version. All authors contributed to the article and approved the submitted version.
Funding
This study has been conducted in the framework of the Helmholtz Young Investigator Group “ARJEL – Arctic Jellies” with the project number VH-NG-1400, funded by the Helmholtz Society and the Alfred Wegener Institute Helmholtz Centre for Polar and Marine Research. H-JH received funding from the Deutsche Forschungsgemeinschaft (DFG) under grant HO 5569/2-1, an Emmy Noether Junior Research Group awarded to HJH. GV was funded by the DFG research project VE 1192/1-1. Data for this manuscript was produced as part of the CARCASS and FramJelly projects with the following Polarstern project IDs: AWI_PS121_04 (CARCASS, PI Hoving) and AWI_PS126_09 (FramJelly, PI Havermans).
Acknowledgments
We are grateful to Hendrik Hampe (GEOMAR) whose help with PELAGIOS deployments was crucial during PS121 and PS126. We thank the captains, the crew and chief scientists on board the R/V Polarstern expeditions PS121 and PS126. We are grateful to Dr. Nikolay Koldunov (AWI) for his maintenance of the pyfesom2 project on github (https://github.com/FESOM/pyfesom2).
Conflict of interest
The authors declare that the research was conducted in the absence of any commercial or financial relationships that could be construed as a potential conflict of interest.
Publisher’s note
All claims expressed in this article are solely those of the authors and do not necessarily represent those of their affiliated organizations, or those of the publisher, the editors and the reviewers. Any product that may be evaluated in this article, or claim that may be made by its manufacturer, is not guaranteed or endorsed by the publisher.
Supplementary material
The Supplementary Material for this article can be found online at: https://www.frontiersin.org/articles/10.3389/fmars.2023.987700/full#supplementary-material
References
Alfred-Wegener-Institute, Helmholtz-Zentrum für Polar- und Meeresforschung (2017). Polar research and supply vessel POLARSTERN operated by the Alfred-Wegener-Institute. J. large-scale Res. facilities JLSRF 3, A119. doi: 10.17815/jlsrf-3-163
Arrigo K. R., van Dijken G. L. (2015). Continued increases in Arctic ocean primary production. Prog. Oceanogr. 136, 60–70. doi: 10.1016/j.pocean.2015.05.002
Arrigo K. R., van Dijken G., Pabi S. (2008). Impact of a shrinking Arctic ice cover on marine primary production. Geophys. Res. Lett. 35 (19), L19603. doi: 10.1029/2008gl035028
Basedow S. L., Sundfjord A., Von Appen W. J., Halvorsen E., Kwasniewski S., Reigstad M. (2018). Seasonal variation in transport of zooplankton into the arctic basin through the Atlantic gateway, fram strait. Front. Mar. Sci. 5. doi: 10.3389/fmars.2018.00194
Beszczynska-Möller A., Fahrbach E., Schauer U., Hansen E. (2012). Variability in Atlantic water temperature and transport at the entrance to the Arctic ocean 1997–2010. ICES J. Mar. Sci. 69 (5), 852–863. doi: 10.1093/icesjms/fss056
Beszczynska-Möller A., Woodgate R. A., Lee C., Melling H., Karcher M. (2011). A synthesis of exchanges through the main oceanic gateways to the Arctic ocean. Oceanography 24 (3), 82–99. doi: 10.5670/oceanog.2011.59
Boero F., Bouillon J., Gravili C., Miglietta M. P., Parsons T., Piraino S. (2008). Gelatinous plankton: irregularities rule the world (sometimes). Mar. Ecol. Prog. Ser. 356, 299–310. doi: 10.3354/meps07368
Brodeur R. D., Decker M. B., Ciannelli L., Purcell J. E., Bond N. A., Stabeno P. J., et al. (2008). Rise and fall of jellyfish in the eastern Bering Sea in relation to climate regime shifts. Prog. Oceanogr. 77 (2), 103–111. doi: 10.1016/j.pocean.2008.03.017
Brodeur R. D., Mills C. E., Overland J. E., Walters G. E., Schumacher J. D. (1999). Evidence for a substantial increase in gelatinous zooplankton in the Bering Sea, with possible links to climate change. Fish. Oceanogr. 8 (4), 296–306. doi: 10.1046/j.1365-2419.1999.00115.x
Buchholz F., Buchholz C., Weslawski J. M. (2010). Ten years after: krill as indicator of changes in the macro-zooplankton communities of two Arctic fjords. Polar Biol. 33 (1), 101–113. doi: 10.1007/s00300-009-0688-0
Choy C. A., Haddock S. H., Robison B. H. (2017). Deep pelagic food web structure as revealed by in situ feeding observations. Proc. R. Soc B: Biol. Sci. 284 (1868), 20172116. doi: 10.1098/rspb.2017.2116
Condon R. H., Duarte C. M., Pitt K. A., Robinson K. L., Lucas C. H., Sutherland K. R., et al. (2013). Recurrent jellyfish blooms are a consequence of global oscillations. Proc. Natl. Acad. Sci. U.S.A. 110 (3), 1000–1005. doi: 10.1073/pnas.121092011
Condon R. H., Graham W. M., Duarte C. M., Pitt K. A., Lucas C. H., Haddock S. H., et al. (2012). Questioning the rise of gelatinous zooplankton in the world’s oceans. Bioscience 62 (2), 160–169. doi: 10.1525/bio.2012.62.2.9
Constable A. J., Harper S., Dawson J., Holsman K., Mustonen T., Piepenburg D., et al. (2022). “Cross-chapter paper 6: polar regions,” in IPCC AR WGII (Cambridge University Press).
Decker M. B., Cieciel K., Zavolokin A., Lauth R., Brodeur R. D., Coyle K. O. (2014). “Population fluctuations of jellyfish in the Bering Sea and their ecological role in this productive shelf ecosystem,” in Jellyfish blooms. Eds. Pitt K. A., Lucas C. H. (Dordrecht: Springer Netherlands), 153–183. doi: 10.1007/978-94-007-7015-7_7
Duffy G. A., Chown S. L. (2017). Explicitly integrating a third dimension in marine species distribution modelling. Mar. Ecol. Prog. Ser. 564, 1–8. doi: 10.3354/meps12011
Eriksen E., Prozorkevich D., Trofimov A., Howell D. (2012). Biomass of scyphozoan jellyfish, and its spatial association with 0-group fish in the barents Sea. PloS One 7 (3), E33050. doi: 10.3354/meps12011
EUMETSAT Ocean, Sea Ice Satellite Application Facility Global sea ice concentration climate data record 1979-2015 (v2.0, 2017) (Northern Hemisphere: Copernicus Climate Change Service Climate Data Store). Available at: https://cds.climate.copernicus.eu/cdsapp#!/dataset/satellite-sea-ice-concentration (Accessed January 2022). OSI-450.
FFmpeg Developers (2006) Ffmpeg tool [Software]. Available at: http://ffmpeg.org/.
Field C. B., Van Aalst M., Adger W. N., Arent D., Barnett J., Betts R., et al. (2014). “Part a: global and sectoral aspects: volume 1, global and sectoral aspects: working group II contribution to the fifth assessment report of the intergovernmental panel on climate change,” in Climate change 2014: impacts, adaptation, and vulnerability (IPCC), 1–1101. Available at: http://www.ipcc.ch/report/ar5/wg2/.
Fox-Kemper B., Hewitt H. T., Xiao C., Aðalgeirsdóttir G., Drijfhout S. S., Edwards T. L., et al. (2021). Ocean, Cryosphere and Sea Level Change. In Masson-Delmotte V., Zhai P., Pirani A., Connors S. L., Péan C., Berger S., et al. (Eds.), Climate Change 2021: The Physical Science Basis. Contribution of Working Group I to the Sixth Assessment Report of the Intergovernmental Panel on Climate Change. (Cambridge: Cambridge University Press) pp. 1211–1362. doi: 10.1017/9781009157896.011
Frainer A., Primicerio R., Kortsch S., Aune M., Dolgov A. V., Fossheim M., et al. (2017). Climate-driven changes in functional biogeography of Arctic marine fish communities. Proc. Natl. Acad. Sci. 114 (46), 12202–12207. doi: 10.1073/pnas.1706080114
Gelman A., Rubin D. B. (1992). Inference from iterative simulation using multiple sequences. Stat. Sci. 7, 457–511. doi: 10.1214/ss/1177011136
Geoffroy M., Berge J., Majaneva S., Johnsen G., Langbehn T. J., Cottier F., et al. (2018). ). increased occurrence of the jellyfish Periphylla periphylla in the European high Arctic. Polar Biol. 41 (12), 2615–2619. doi: 10.1007/s00300-018-2368-4
Gluchowska M., Trudnowska E., Goszczko I., Kubiszyn A. M., Blachowiak-Samolyk K., Walczowski W., et al. (2017). Variations in the structural and functional diversity of zooplankton over vertical and horizontal environmental gradients en route to the Arctic ocean through the fram strait. PloS One 12 (2), e0171715. doi: 10.1371/journal.pone.0171715
Havermans C., Dischereit A., Hampe H., Merten V., Pantiukhin D., Verhaegen G., et al. (2021). “FRAMJELLY: gelatinous zooplankton in the gateway to the Arctic: advanced methods to study their diversity, distribution and role in the fram strait food web,” in The expedition PS126 of the research vessel POLARSTERN to the fram strait in 2021, vol. 757 . Ed. Soltwedel T. (Cruise report: Berichte zur Polar- und Meeresforschung), 96–109.
Hays G. C., Doyle T. K., Houghton J. D. R. (2018). A paradigm shift in the trophic importance of jellyfish? Trends. Ecol. Evol. 33 (11), 874–884. doi: 10.1016/j.tree.2018.09.001
Hijmans R. (2022) Raster: geographic data analysis and modeling. Available at: https://CRAN.R-project.org/package=raster.
Hop H., Wold A., Meyer A., Bailey A., Hatlebakk M., Kwasniewski S., et al. (2021). Winter-spring development of the zooplankton community below sea ice in the Arctic ocean. Front. Mar. Sci. 8. doi: 10.3389/fmars.2021.609480
Hop H., Wold A., Vihtakari M., Daase M., Kwasniewski S., Gluchowska M., et al. (2019). Zooplankton in kongsfjorden, (1996–2016) in relation to climate change. Ecos. Kongsfjorden Svalbard 2, 229–300. doi: 10.1007/978-3-319-46425-1_7
Hosia A., Falkenhaug T., Baxter E. J., Pagès F. (2017). Abundance, distribution and diversity of gelatinous predators along the northern mid-Atlantic ridge: a comparison of different sampling methodologies. PloS One 12 (1), e0187491. doi: 10.1371/journal.pone.0187491
Hoving H. J., Christiansen S., Fabrizius E., Hauss H., Kiko R., Linke P., et al. (2019). The pelagic in situ observation system (PELAGIOS) to reveal biodiversity, behavior, and ecology of elusive oceanic fauna. Ocean Sci. 15 (5), 1327–1340. doi: 10.5194/os-15-1327-2019
Hoving H. J. T., Haddock S. H. D. (2017). The giant deep-sea octopus Haliphron atlanticus forages on gelatinous fauna. Sci. Rep. 7 (1), 1–4. doi: 10.1038/srep44952
Hoving H. J., Hampe H., Merten V. (2020b). “CARCASS – carbon transport via Arctic pelagic animals sinking to the deep-seafloor,” in The expedition PS121 of the research vessel POLARSTERN to the fram strait in 2019, vol. 738 . Ed. Metfies K. (Cruise report: Berichte zur Polar- und Meeresforschung), 47–52.
Hoving H. J. T., Neitzel P., Hauss H., Christiansen S., Kiko R., Robison B. H., et al. (2020a). In situ Observations show vertical community structure of pelagic fauna in the eastern tropical north Atlantic off cape Verde. Sci. Rep. 10 (1), 21798. doi: 10.1038/s41598-020-78255-9
Hoving H.-J., Neitzel P., Robison B. (2018). In situ Observations lead to the discovery of the large ctenophore Kiyohimea usagi (Lobata: eurhamphaeidae) in the eastern tropical Atlantic. Zootaxa. 4526 (2), 232–238. doi: 10.11646/zootaxa.4526.2.8
Ingvaldsen R. B., Assmann K. M., Primicerio R., Fossheim M., Polyakov I. V., Dolgov A. V. (2021). Physical manifestations and ecological implications of Arctic atlantification. Nat. Rev. Earth. Environ. 2 (12), 874–889. doi: 10.1038/s43017-021-00228-x
Kahru M., Lee Z., Mitchell B. G., Nevison C. D. (2016). Effects of sea ice cover on satellite-detected primary production in the Arctic ocean. Biol. Lett. 12 (11), 20160223. doi: 10.1098/rsbl.2016.0223
Kosobokova K. N., Hopcroft R. R., Hirche H.-J. (2011). Patterns of zooplankton diversity through the depths of the arctic’s central basins. Mar. Biodivers. 41, 29–50. doi: 10.1007/s12526-010-0057-9
Kraft A., Nöthig E. M., Bauerfeind E., Wildish D. J., Pohle G. W., Bathmann U. V., et al. (2013). First evidence of reproductive success in a southern invader indicates possible community shifts among Arctic zooplankton. Mar. Ecol. Prog. Ser. 493, 291–296. doi: 10.3354/meps10507
Lindsay D. J., Grossmann M. M., Bentlage B., Collins A. G., Minemizu R., Hopcroft R. R., et al. (2017). The perils of online biogeographic databases: a case study with the ‘monospecific’ genus Aegina (Cnidaria, hydrozoa, narcomedusae). Mar. Biol. Res. 13 (5), 494–512. doi: 10.1080/17451000.2016.1268261
Lindsay D. J., Hunt J. C. (2005). Biodiversity in midwater cnidarians and ctenophores: submersible-based results from deep-water bays in the Japan Sea and north-western pacific. J. Mar. Biol. Assoc. Uk. 85 (3), 503–517. doi: 10.1017/s0025315405011434
Lucas C. H., Jones D. O., Hollyhead C. J., Condon R. H., Duarte C. M., Graham W. M., et al. (2014). Gelatinous zooplankton biomass in the global oceans: geographic variation and environmental drivers. Global Ecol. Biogeogr. 23 (7), 701–714. doi: 10.1111/geb.12169
Luo J. Y., Grassian B., Tang D., Irisson J. O., Greer A. T., Guigand C. M., et al. (2014). Environmental drivers of the fine-scale distribution of a gelatinous zooplankton community across a mesoscale front. Mar. Ecol. Prog. Ser. 510, 129–149. doi: 10.3354/meps10908
Møller L. F., Riisgård H. U. (2007). Respiration in the scyphozoan jellyfish aurelia aurita and two hydromedusae (Sarsia tubulosa and Aequorea vitrina): effect of size, temperature and growth. Mar. Ecol. Prog. Ser. 330, 149–154. doi: 10.3354/meps330149
Ma X., Purcell J. E. (2005). Temperature, salinity, and prey effects on polyp versus medusa bud production by the invasive hydrozoan Moerisia lyonsi. J. Mar. Bio. 147, 225–234. doi: 10.1007/s00227-004-1539-8
Mackie G. O., Pugh P. R., Purcell J. E. (1988). “Siphonophore biology,” in Adv. mar. biol. Eds. Blaxter J. H. S., Southward A. J. (Academic Press), 97–262.
Majaneva S., Majaneva M. (2013). Cydippid ctenophores in the coastal waters of Svalbard: is it only Mertensia ovum? Polar Biol. 36 (11), 1681–1686. doi: 10.1007/s00300-013-1377-6
Mańko M. K., Gluchowska M., Weydmann-Zwolicka A. (2020). Footprints of atlantification in the vertical distribution and diversity of gelatinous zooplankton in the fram strait (Arctic ocean). Prog. Oceanogr. 189, 102414. doi: 10.1016/j.pocean.2020.102414
Matsumoto G. I., Christianson L. M., Robison B. H., Haddock S. H. D., Johnson S. B. (2022). Atolla reynoldsi Sp. nov. (Cnidaria, scyphozoa, coronatae, atollidae): a new species of coronate scyphozoan found in the Eastern north pacific ocean. Animals 12, 742. doi: 10.3390/ani12060742
Meinshausen M., Nicholls Z. R., Lewis J., Gidden M. J., Vogel E., Freund M., et al. (2020). The shared socio-economic pathway (SSP) greenhouse gas concentrations and their extensions to 2500. Geoscientific Model. Dev. 13 (8), 3571–3605. doi: 10.5194/gmd-13-3571-2020
Mills C. E. (1984). Density is altered in hydromedusae and ctenophores in response to changes in salinity. Biol. Bull. 166 (1), 206–215. doi: 10.2307/1541442
Moore S. E., Stabeno P. J. (2015). Synthesis of Arctic research (SOAR) in marine ecosystems of the pacific Arctic. Prog. Oceanogrp. 136, 1–11. doi: 10.1016/j.pocean.2015.05.017
Musayeva E. I. (1976). Distribution of siphonophores in the eastern part of the Indian ocean. Trans. Inst. Oceanol. 105, 171–197.
Neitzel P., Hosia A., Piatkowski U., Hoving H. J. (2021). Pelagic deep-sea fauna observed on video transects in the southern Norwegian Sea. Polar Biol. 44 (5), 887–898. doi: 10.1007/s00300-021-02840-5
Neukermans G., Oziel L., Babin M. (2018). Increased intrusion of warming Atlantic water leads to rapid expansion of temperate phytoplankton in the Arctic. Glob. Change Biol. 24 (6), 2545–2553. doi: 10.1111/gcb.14075
Ovaskainen O., Abrego N. (2020). Joint species distribution modelling: with applications in r (Cambridge University Press). Available at: https://researchportal.helsinki.fi/en/publications/joint-species-distribution-modelling-with-applications-in-r.
Ovaskainen O., Tikhonov G., Norberg A., Guillaume Blanchet F., Duan L., Dunson D., et al (2017). How to make more out of community data? A conceptual framework and its implementation as models and software. Ecology Lett. 20 (5), 561–576.
Palomares M.L.D., Pauly D. (2021) SeaLifeBase. electronic publication on the world wide web. Available at: www.sealifebase.org (Accessed January 2022).
Pantiukhin D., Verhaegen G., Kraan C., Jerosch K., Neitzel P., Havermans C., et al. (2023a). Gelatinous zooplankton annotations of pelagic video transects in the fram strait during the R/V POLARSTERN expedition PS121 (PANGAEA). doi: 10.1594/PANGAEA.953752
Pantiukhin D., Verhaegen G., Kraan C., Jerosch K., Neitzel P., Hoving H.-J. T., et al. (2023b). Gelatinous zooplankton annotations of pelagic video transects in the fram strait during the R/V polarstern expedition PS126 (PANGAEA). doi: 10.1594/PANGAEA.953888
Pearce J., Ferrier S. (2000). An evaluation of alternative algorithms for fitting species distribution models using logistic regression. Ecol. Modell. 128 (2-3), 127–147. doi: 10.1016/S0304-3800(99)00227-6
Pecuchet L., Blanchet M. A., Frainer A., Husson B., Jørgensen L. L., Kortsch S., et al. (2020). Novel feeding interactions amplify the impact of species redistribution on an Arctic food web. Glob. Change Biol. 26 (9), 4894–4906. doi: 10.1111/gcb.15196
Polyakov I. V., Pnyushkov A. V., Alkire M. B., Ashik I. M., Baumann T. M., Carmack E. C., et al. (2017). Greater role for Atlantic inflows on sea-ice loss in the Eurasian basin of the Arctic ocean. Science 356 (6335), 285–291. doi: 10.1126/science.aai8204
Polyakov I. V., Pnyushkov A. V., Timokhov L. A. (2012). Warming of the intermediate Atlantic water of the Arctic ocean in the 2000s. J. Climate 25 (23), 8362–8370. doi: 10.1175/JCLI-D-12-00266.1
Purcell J. E. (2012). Jellyfish and ctenophore blooms coincide with human proliferations and environmental perturbations. Annu. Rev. Mar. Sci. 4, 209–235. doi: 10.1146/annurev-marine-120709-142751
Rantanen M., Karpechko A. Y., Lipponen A., Nordling K., Hyvarinen O., Ruosteenoja K., et al. (2022). The Arctic has warmed nearly four times faster than the globe since 1979. Commun. Earth Environ. 3, 168. doi: 10.1038/s43247-022-00498-3
Raskoff K. A., Hopcroft R. R., Kosobokova K. N., Purcell J. E., Youngbluth M. (2010). Jellies under ice: ROV observations from the Arctic 2005 hidden ocean expedition. Deep Sea Res. 2 Top. Stud. Oceanogr. 57 (1-2), 111–126. doi: 10.1016/j.dsr2.2009.08.010
Raskoff K. A., Purcell J. E., Hopcroft R. R. (2005). Gelatinous zooplankton of the Arctic ocean: in situ observations under the ice. Polar Biol. 28, 207–217. doi: 10.1007/s00300-004-0677-2
Raskoff K. A., Sommer F. A., Hamner W. M., Cross K. M. (2003). Collection and culture techniques for gelatinous zooplankton. Biol. Bull. 204 (1), 68–80. doi: 10.2307/1543497
R Core Team (2022). R: a language and environment for statistical computing (Vienna, Austria: R Foundation for Statistical Computing). Available at: https://www.R-project.org/.
Remsen A., Hopkins T. L., Samson S. (2004). What you see is not what you catch: a comparison of concurrently collected net, optical plankton counter, and shadowed image particle profiling evaluation recorder data from the northeast gulf of Mexico. Deep Sea Res. 1 Oceanogr. Res. Pap. 51 (1), 129–151. doi: 10.1016/j.dsr.2003.09.008
Riisgård H. U., Madsen C. V., Barth-Jensen C., Purcell J. E. (2012). Population dynamics and zooplankton-predation impact of the indigenous scyphozoan Aurelia aurita and the invasive ctenophore Mnemiopsis leidyi in limfjorden (Denmark). Aquat. Invasions 7 (2), 147–162. doi: 10.3391/ai.2012.7.2.001
Robison B. H. (2004). Deep pelagic biology. J. Exp. Mar. Biol. Ecol. 300 (1-2), 253–272. doi: 10.1016/j.jembe.2004.01.012
Robison B. H., Sherlock R. E., Reisenbichler K. R. (2010). The bathypelagic community of Monterey canyon. Deep Sea Res. 2 Top. Stud. Oceanogr. 57 (16), 1551–1556. doi: 10.1016/j.dsr2.2010.02.021
Ronowicz M., Kukliński P., Mapstone G. M. (2015). Trends in the diversity, distribution and life history strategy of Arctic hydrozoa (Cnidaria). PloS One 10 (3), e0120204. doi: 10.1371/journal.pone.0120204
Schlining B. M., Stout N. J. (2006). “MBARI's video annotation and reference system,” in OCEANS 2006. (Boston, MA, USA: IEEE), 1–5. doi: 10.1109/oceans.2006.306879
Schröter F., Havermans C., Kraft A., Knüppel N., Beszczynska-Möller A., Bauerfeind E., et al. (2019). Pelagic amphipods in the Eastern fram strait with continuing presence of themisto compressa based on sediment trap time series. Front. Mar. Sci. 6. doi: 10.3389/fmars.2019.00311
Semmler T., Danilov S., Rackow T., Sidorenko D., Barbi D., Hegewald J., et al. (2018). AWI AWI-CM1.1MR model output prepared for CMIP6 CMIP (Earth System Grid Federation). doi: 10.22033/ESGF/CMIP6.359
Soltwedel T., Bauerfeind E., Bergmann M., Budaeva N., Hoste E., Jaeckisch N., et al. (2005). HAUSGARTEN: multidisciplinary investigations at a deep-sea, long-term observatory in the Arctic ocean. Oceanography 18 (3). doi: 10.5670/oceanog.2005.24
Stöckli R., Vermote E., Saleous N., Simmon R., Herring D.. (2006). The Blue Marble Next Generation—A true color Earth dataset including seasonal dynamics from MODIS. EOS 87 (5), 49–55. NASA Earth Observatory. Available at: visibleearth.nasa.gov.
Swift H. F., Hamner W. M., Robison B. H., Madin L. P. (2009). Feeding behavior of the ctenophore Thalassocalyce inconstans: revision of anatomy of the order thalassocalycida. Mar. Biol. 156, 1049–1056. doi: 10.1007/s00227-009-1149-6
Taiyun W., Viliam S. (2021) R package 'corrplot': visualization of a correlation matrix (Version 0.92). Available at: https://github.com/taiyun/corrplot.
Tikhonov G., Opedal Ø.H., Abrego N., Lehikoinen A., de Jonge M. M., Oksanen J., et al. (2020). Joint species distribution modelling with the r-package hmsc. Methods Ecol. Evol. 11 (3), 442–447. doi: 10.1111/2041-210X.13345
Tittensor D. P., Mora C., Jetz W., Lotze H. K., Ricard D., Berghe E. V., et al. (2010). Global patterns and predictors of marine biodiversity across taxa. Nature 466 (7310), 1098–1101. doi: 10.1038/nature09329
Tjur T. (2009). Coefficients of determination in logistic regression models–a new proposal: the coefficient of discrimination. Amer. Statist. 63 (4), 366–372. doi: 10.1198/tast.2009.08210
Toyokawa M., Toda T., Kikuchi T., Miyake H., Hashimoto J. (2003). Direct observations of a dense occurrence of Bolinopsis infundibulum (Ctenophora) near the seafloor under the oyashio and notes on their feeding behavior. Deep Sea Res. 1 Oceanogr. Res. Pap. 50 (6), 809–813. doi: 10.1016/s0967-0637(03)00056-6
Urban P., Præbel K., Bhat S., Dierking J., Wangensteen O. S. (2022). DNA Metabarcoding reveals the importance of gelatinous zooplankton in the diet of. Pandalus borealis keystone species Arctic. Mol. Ecol. 31 (5), 1562–1576. doi: 10.1111/mec.16332
Verhaegen G., Cimoli E., Lindsay D. (2021). Life beneath the ice: jellyfish and ctenophores from the Ross Sea, Antarctica, with an image-based training set for machine learning. Biodivers. Data J. 9, e69374. doi: 10.3897/BDJ.9.e69374
Verity P. G., Smetacek V. (1996). Organism life cycles, predation, and the structure of marine pelagic ecosystems. Mar. Ecol. Prog. Ser. 130, 277–293. doi: 10.3354/meps130277
Vihtakari M. (2020) PlotSvalbard: PlotSvalbard - plot research data from Svalbard on maps. Available at: https://github.com/MikkoVihtakari/PlotSvalbard.
Walczowski W., Piechura J., Goszczko I., Wieczorek P. (2012). Changes in Atlantic water properties: an important factor in the European Arctic marine climate. ICES J. Mar. Science 69 (5), 864–869. doi: 10.1093/icesjms/fss068
Wassmann P., Duarte C. M., Agusti S., Sejr M. K. (2011). Footprints of climate change in the Arctic marine ecosystem. Global Change Biol. 17 (2), 1235–1249. doi: 10.1111/j.1365-2486.2010.02311.x
Watanabe S. (2013). A widely applicable Bayesian information criterion. J. Mach. Learn. Res. 14 (1), 867–897. doi: 10.48550/arXiv.1208.6338
Wickham H. (2016). ggplot2: elegant graphics for data analysis (Springer-Verlag New York). Available at: https://github.com/tidyverse/ggplot2.
Yaragina N. A., Stige L. C., Langangen Ø. (2022). Bycatch data from ichthyoplankton surveys reveal long-term trends in gelatinous zooplankton in the Norwegian and barents seas. ICES J. Mar. Sci. 79 (3), 868–881. doi: 10.1093/icesjms/fsab225
Youngbluth M. J., Båmstedt U. (2001). Distribution, abundance, behavior and metabolism of Periphylla periphylla, a mesopelagic coronate medusa in a Norwegian fjord. Jellyfish Blooms: Ecol. Soc Importance 155, 321–333. doi: 10.1007/978-94-010-0722-1_27
Keywords: gelatinous zooplankton, optical in situ observations, distribution modelling, spatio-temporal projections, environmental changes, Fram Strait, Arctic Ocean
Citation: Pantiukhin D, Verhaegen G, Kraan C, Jerosch K, Neitzel P, Hoving H-JT and Havermans C (2023) Optical observations and spatio-temporal projections of gelatinous zooplankton in the Fram Strait, a gateway to a changing Arctic Ocean. Front. Mar. Sci. 10:987700. doi: 10.3389/fmars.2023.987700
Received: 06 July 2022; Accepted: 21 April 2023;
Published: 05 May 2023.
Edited by:
Daniela Zeppilli, Institut Français de Recherche pour l’Exploitation de la Mer (IFREMER), FranceReviewed by:
Maciej Mańko, University of Gdansk, PolandElizaveta Ershova, UiT The Arctic University of Norway, Norway
Guðjón Már Sigurðsson, Marine and Freshwater Research Institute, Iceland
Copyright © 2023 Pantiukhin, Verhaegen, Kraan, Jerosch, Neitzel, Hoving and Havermans. This is an open-access article distributed under the terms of the Creative Commons Attribution License (CC BY). The use, distribution or reproduction in other forums is permitted, provided the original author(s) and the copyright owner(s) are credited and that the original publication in this journal is cited, in accordance with accepted academic practice. No use, distribution or reproduction is permitted which does not comply with these terms.
*Correspondence: Dmitrii Pantiukhin, dmitrii.pantiukhin@awi.de; dmitrii.pantiu@gmail.com
†These authors share senior authorship