Nematode communities along a bathymetric transect in the deep eastern Fram Strait (Arctic Ocean): interrelations between diversity, function and environment
 Jannik Schnier
 Christiane Hasemann
 Vadim Mokievsky
 Pedro Martínez Arbizu
 Thomas Soltwedel
- 1Helmholtz Gemeinschaft – Max Planck Gesellschaft Joint Research Group for Deep-Sea Ecology and Technology, Alfred Wegener Institute Helmholtz-Centre for Polar and Marine Research, Bremerhaven, Germany
- 2Pyotr Petrovich Shirshov Institute of Oceanology, Russian Academy of Sciences, Moscow, Russia
- 3German Centre for Marine Biodiversity Research (DZMB), Senckenberg am Meer, Wilhelmshaven, Germany
As an expansion of a time-series study on meiobenthos in the Arctic deep sea, the diversity of free-living nematode communities along nine stations along a bathymetric transect was investigated morphologically in taxonomic and functional regards (feeding-type composition, life-history traits, tail-shape composition) and compared with previous studies of the same transect to investigate possible changes in the nematode community composition. Special emphasis was given on the analysis of sedimentary environmental parameters, which are used as proxies for food availability and sediment porosity. Multivariate statistics performed on nematode abundance data revealed a bathymetric zonation into four bathymetric zones: upper bathyal (1300 – 2000 m), lower bathyal (2500 - 3500 m), abyssal (5100 – 5600 m) and an additional ‘outgroup’ consisting of two stations with low nematode densities. Nematode densities generally decreased with increasing depth. Taxonomic diversity (EG(50), H’(log2), J’) decreased in a unimodal pattern peaking in the lower bathyal zone. A distance-based linear model revealed that 44% of the total variation in nematode abundances could be explained by the measured environmental parameters. Microbial feeders are the dominant feeding type along the transect with increasing dominance in the abyssal zone. The maturity index, a measure of environmental disturbance, decreased with depth, indicating a more colonizer-dominated community in the abyssal zone. Nematodes with long conico-cylindrical tails also become more dominant in the abyssal zone. A previous study of the same transect conducted in 2005 found a similar bathymetric zonation, but with a strikingly different dominant feeding type, i.e. epistrate feeders. Between the 2005 study and the year 2010 we conducted our study, the composition of the plankton community in the Fram Strait changed significantly due to a warm water anomaly in the region. We argue that through bentho-pelagic coupling, effects of this warm water anomaly on plankton communities could be a reason for the drastic change in dominant nematode feeding types.
1 Introduction
Approximately 63% of the Earth’s surface is covered by at least 1000 m of seawater, making the deep-sea floor the largest habitat on Earth (Tyler et al., 2016). It harbors a rich biodiversity and plays a vital role in nutrient recycling (e.g. Thurber et al., 2014), however collecting benthic samples from the deep sea is typically a costly and logistically challenging endeavor and thus the amount of sampling is still in sharp contrast to the vastness of the habitat. This discrepancy is particularly evident in meiobenthic research: Mokievsky et al. (2007) state that the total area sampled for deep-sea meiobenthos accumulates to approximately 10 m2 worldwide. However, meiobenthos is ubiquitous and usually the dominant metazoan group in terms of abundance and biomass towards abyssal depths (Rex et al., 2006). Within the deep-sea metazoan meiobenthos, free-living nematodes are the dominant taxon with relative abundances regularly exceeding 90% (Vanaverbeke et al., 1997; Górska et al., 2014; Soltwedel et al., 2020). Therefore, nematode abundances and their taxonomic and functional diversity have been studied in the past in a variety of different deep-sea areas worldwide (Boucher and Lambshead, 1995; Soltwedel, 2000; Mokievsky et al., 2007).
Food availability is a potential limiting factor for meiobenthos distribution in the deep sea (Danovaro et al., 2000). Apart from chemosynthetic systems (Boetius et al., 2000; Van Gaever et al., 2006), all food is derived from primary production in surface waters and is exported to the seafloor, either directly as phytodetritus, or indirectly, e.g. in the form of zooplankton fecal pellets or larger food falls of organic material (Shatova et al., 2012; Herndl and Reinthaler, 2013; Soltwedel et al., 2018; Hoving et al., 2023). Sinking detritus also transports associated microbial communities to the deep seafloor. In combination with benthic microbial communities these microbes are the preferred food source for nematodes in polar seas (Cho and Azam, 1988; Leduc and Probert, 2009; Ingels et al., 2010; Herndl and Reinthaler, 2013). As food is remineralized in the upper water layers (Buesseler et al., 2007), its availability and quality decreases with increasing water depth. The remaining 0.5 – 2% of net primary production that reach abyssal depths lead to a competition for energy which is considered to have the greatest impact on (meio)benthic diversity (Smith et al., 2008; Woolley et al., 2016). This food dependence also makes the abyssal ecosystem very sensitive to nutrient inputs at the base of the food web compared to other ecosystems (Smith et al., 2008). While food availability tends to have the greatest impact on nematode diversity and abundance, other sediment parameters such as oxygen concentration, temperature, topography, disturbance and biogenic interactions also change regionally and with increasing depth and their effects on nematode communities are not yet fully understood (McClain and Barry, 2010; McClain and Rex, 2015).
Nematode abundance generally decreases with increasing water depth (Mokievsky et al., 2007), with the exception of ocean trenches and canyons, where elevated nematode abundances and biomass can occur (e.g. Leduc et al., 2014). Taxonomic nematode diversity varies with depth and is dependent on the specific local environmental conditions. Studies report either a unimodal trend in taxonomic diversity, with its peak in intermediate bathyal water depths (Jensen, 1988; Boucher and Lambshead, 1995; Liao et al., 2020), a more linear decrease with depth (Trebukhova et al., 2013; Grzelak et al., 2017), no correlation of diversity with water depth (Danovaro et al., 2013; Gambi et al., 2014), or even an increase of diversity with depth (dos Santos et al., 2020). Considering functional descriptors in addition to taxonomic diversity allows for a more comprehensive understanding of nematode community dynamics in interplay with their environment. Feeding strategies of the nematode community can be morphologically determined (Wieser, 1953) and provide insight in benthic nutrient recycling (e.g. Pape et al., 2013c). A measure of nematode community succession is the ratio of colonizers to persisters in a sample (Bongers, 1990) and nematode tail shapes are an indicator for their mobility and lifestyle (Riemann, 1974; Platt and Warwick, 1983; Thistle and Sherman, 1985) and provide ecological information (Thistle et al., 1995). Changes in functional nematode diversity can be decoupled from changes in their taxonomic diversity, even when different descriptors are considered (Baldrighi and Manini, 2015). Trends in functional nematode diversity are also not uniform and reflect regional differences. For example, a deep-sea study on the Espírito Santo slope off southeastern Brazil reports a significant increase of functional descriptors with increasing water depth, while nematode density and biomass decreased with depth (dos Santos et al., 2020). Another study reports decreased functional descriptors in the high-energy Gaoping Submarine Canyon in the southwestern Taiwanese deep sea, compared to upper slopes of the canyon (Liao et al., 2020). All this suggests that nematode community composition, both taxonomically and functionally, is largely influenced and driven by local habitat conditions (Moens et al., 2014).
The transition zones of permanently ice-covered areas and ice-free areas, the marginal ice zones (MIZ), are among the most productive areas in polar seas and with varying ice coverage throughout the year, MIZ are also highly dynamic regions (Smith, 1987). Melting sea ice in spring facilitates algal blooms in the upper water column of the MIZ (Smith, 1987; Longhurst, 1995) and subsequently enhanced fluxes of organic matter to the seafloor, resulting in higher benthic nematode abundance and richness in ice-free areas compared to ice-covered areas (Fonseca and Soltwedel, 2007). The MIZ located in the Fram Strait between West Svalbard and East Greenland is in the focus of the present study. It is also the only deep-water link into the Arctic Ocean with a bathymetric range from shelf and slope regions off Spitsbergen and Greenland, to abyssal depths of 5600 m in the Molloy Hole, the deepest known seafloor depression above 60°N (Klenke and Schenke, 2002). The Fram Strait is the most important region for heat exchange between the North Atlantic and the Arctic Ocean, with the West Spitsbergen current transporting warmer, nutrient-rich Atlantic water northwards and the East Greenland current transporting cold, polar water southwards (Beszczynska-Möller et al., 2012). In this area of the Fram Strait, the Alfred Wegener Institute Helmholtz Center for Polar and Marine Research established the Long-Term Ecological Research (LTER) observatory HAUSGARTEN (approx. 78°N-80°N, 05°W-11°E), which is sampled annually in each Arctic summer since 1999 (Soltwedel et al., 2005; Soltwedel et al., 2016). The multidisciplinary long-term research detected a warm water anomaly (WWA) in the years from 2005 to 2007, which had strong effects on the plankton composition in HAUSGARTEN (Bauerfeind et al., 2009; Beszczynska-Möller et al., 2012; Lalande et al., 2013; Nöthig et al., 2015; Nöthig et al., 2020). Meiobenthic research with a special focus on nematode communities is an integral part of the HAUSGARTEN time-series work since its inception, providing insights into processes and dynamics of meiobenthic communities at the deep seafloor over the past 24 years. Previous studies of the same transect revealed a bathymetric zonation of nematode communities in HAUSGARTEN (Hoste et al., 2007; Górska et al., 2014; Grzelak et al., 2017). However, to date and for this transect, these studies are the only in-depth investigations of nematode diversity on genus level. The present study was conducted with samples collected in 2010, five years after Grzelak et al. (2017). In the present study, we investigate the nematode communities of HAUSGARTEN in the year 2010 based on the following three hypotheses:
1. Community structure, taxonomic and functional diversity of the nematode communities are similar to a study of the same transect sampled five years prior to the present study and change significantly with depth.
2. Functional diversity of nematodes by means of feeding-type composition, colonizer-persister ratio and tail-shape composition changes significantly with depth along a bathymetric transect.
3. Food availability in the sediments is the main driver for nematode community composition along the bathymetric transect.
2 Materials and methods
2.1 Study area
For the present study, nine sampling sites of LTER observatory HAUSGARTEN (HG-I to HG-IX) were considered along a latitudinal bathymetric transect, covering an area from the Vestnesa Ridge, the Molloy Transform Fault and Molloy Ridge System to the Molloy Hole (Figure 1; Supplementary Table 1). The shallowest station HG-I is located on the Vestnesa Ridge at a depth of 1283 m, the deepest station HG-IX, is located in the Molloy Hole at 5596 m water depth. An increase in HG- station number corresponds to an increase in water depth of approximately 500 m.
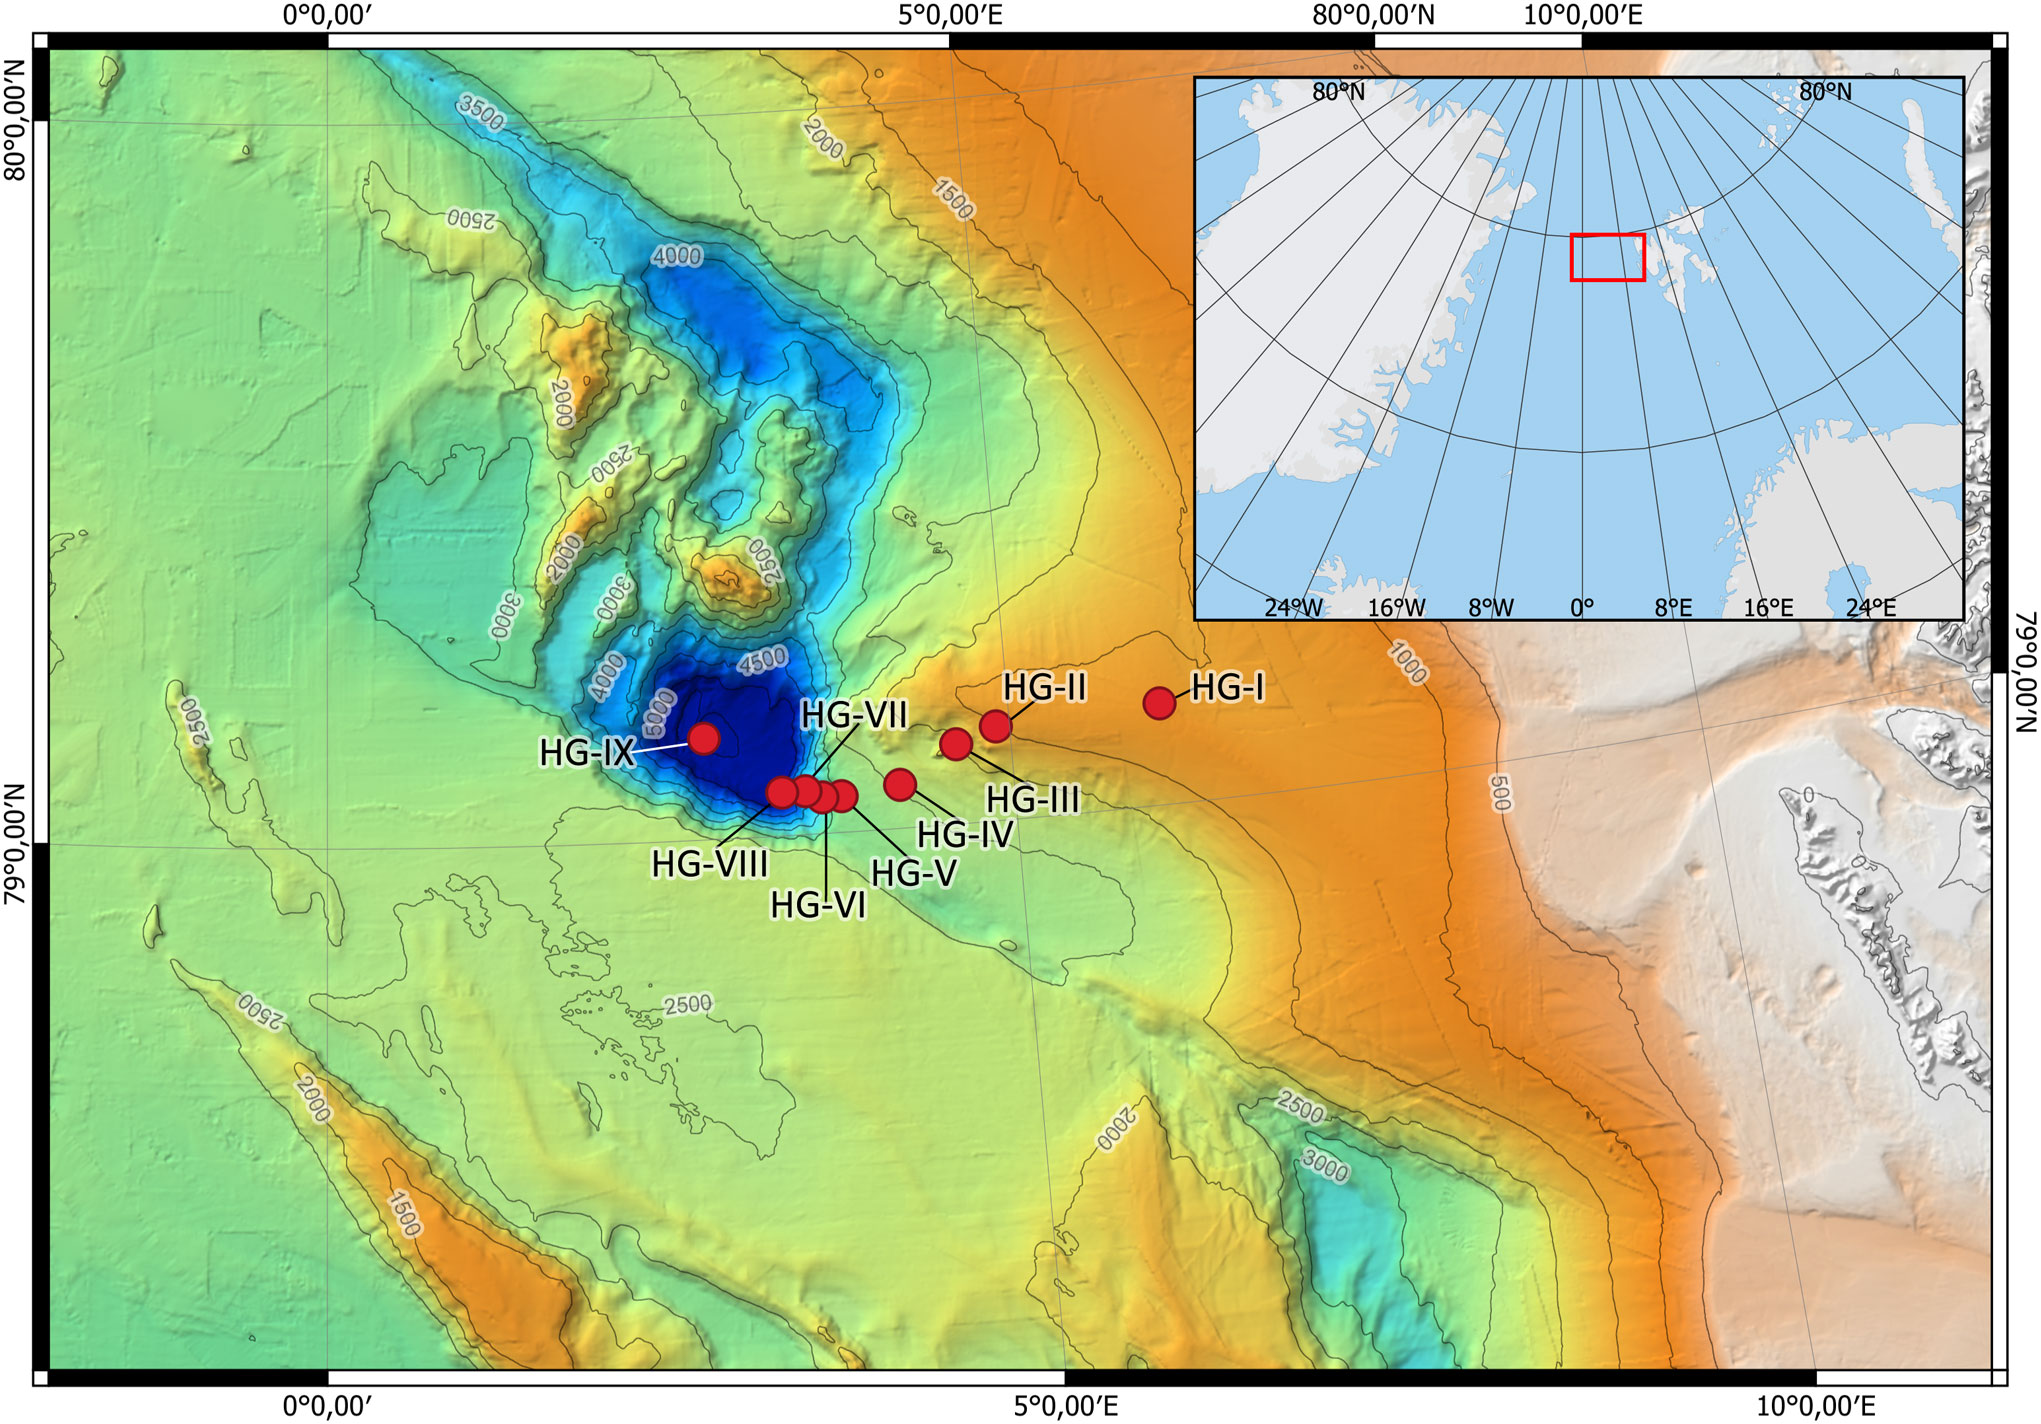
Figure 1 General location of LTER-HAUSGARTEN (red square in embedded map) and detailed overview of the stations along the bathymetric transect (large map). Water depths: HG-I at 1283 m; HG-VII at 1548 m; HG-VIII at 1907 m; HG-IV at 2472 m; HG-V at 2860 m; HG-VI at 3442 m; HG-VII at 4085 m; HG-VIII at 5141 m; HG-IX at 5596 m.
2.2 Sampling
Seafloor samples for meiofauna- and environmental analyses were obtained during the ARK-XXV/2 expedition of the German research icebreaker R/V POLARSTERN (Knust, 2017), which took place from the 30th of June to the 29th of July 2010 (Soltwedel, 2010). Virtually undisturbed sediment samples were collected by using a video-guided multiple corer carrying eight sampling tubes with an internal diameter of 10 cm. At each station, the upper five sediment centimeters were subsampled with cut-off syringes. Three pseudo-replicate samples for analyses of meiofauna (except for HG-VII) and different biogenic sediment parameters (see 2.3.3 Environmental parameters) were collected from different cores of the same multiple corer deployment. At HG-VII, only one sample is available for meiofauna analysis.
2.3 Sample processing
2.3.1 Meiofauna
Meiofauna was subsampled with 20 ml cut-off syringes (ø = 2.2 cm). Immediately after subsampling, meiofauna samples were sliced in 1-cm sediment layers, fixed in 4% borax-buffered formaldehyde/filtered seawater solution (v/v) and stored until further preparation in a land-based laboratory. There, formaldehyde was removed for subsequent centrifugation by rinsing the samples in freshwater over a sieve with 32 µm mesh size. Density gradient centrifugation at 900 rpm for 15 minutes was carried out twice for each sample in Ludox® colloidal-silica with a specific gravity of 1.18 g/cm3 (LUDOX® TM-50, Sigma-Aldrich 420778) (for method see Heip et al., 1985). After each centrifugation, the supernatant containing the meiofauna was rinsed with freshwater over a 32 µm sieve and transferred with freshwater and a few drops of Rose Bengal into a petri dish. Meiofauna was identified to major taxa using the identification guide of Schmidt-Rhaesa (2020) and counted using an OLYMPUS SZX16 stereo microscope. All nematodes were handpicked and mounted as permanent slides in anhydrous glycerin (see Pfannkuche and Thiel, 1988).
2.3.2 Microscopic examination and functional classification of nematode specimens
Nematode specimens were determined to genus level using the keys of Platt and Warwick (1983; 1988), Warwick et al. (1998), and Schmidt-Rhaesa (2014). Genera names were checked for taxonomic validity and synonyms with Nemys (Nemys Eds, 2023). For comparison with previous studies we retain the now unaccepted generic name Diplopeltula, which includes at least the two valid genera Diplopeltoides and Neodiplopeltula (Holovachov and Boström, 2018). An OLYMPUS BX53 light microscope and an OLYMPUS DP28 digital camera combined with the OLYMPUS cellSens Entry v3.2 software was used for image acquisition.
Functional diversity of nematodes was analyzed using different descriptors. Nematode feeding types were assigned to the four feeding types classified by Wieser (1953) based on the morphology of the buccal cavity: selective feeders (1A), non-selective feeders (1B), epistrate feeders (2A) and omnivores/predators (2B). Feeding types 1A and 1B express a minute, unarmed buccal cavity and feed on microorganisms, while 2A-types uses tooth-like structures to scrape-off biofilms and 2B-types have large buccal cavities, usually with multiple ‘teeth’ to hunt and hold prey (Wieser, 1953). We acknowledge the new classification of feeding types introduced by Hodda (2022), but have decided to use Wiesers (1953) classification for this study in order to achieve a better comparability with previous studies of HAUSGARTENs bathymetric transect.
As an indicator of the trophic structure, the index of trophic diversity (ITD, Θ) for Wiesers (1953) classification was calculated for the feeding types according to the following formula:
where q1 is the proportion of feeding type i in the community and n is the amount of feeding types (Heip et al., 1985). The ITD ranges from 0.25 for highest trophic diversity (all four feeding types are equally abundant) to 1.0 for lowest trophic diversity (only one feeding type is present).
Tail shape has an important part in locomotion, feeding and reproduction of nematodes (Thistle and Sherman, 1985; Thistle et al., 1995; Semprucci et al., 2022). For example, for nematodes with long conico-cylindrcal and filiform tails, a hemisessile lifestyle is proposed, where the nematodes use their tails to anchor themselves to sediment particles (Riemann, 1974; Thistle and Sherman, 1985; Miljutin and Miljutina, 2016). Nematode tail shapes were morphologically determined and assigned to five groups based on a combination of the classifications of Platt and Warwick (1983); Thistle and Sherman (1985) and Thistle et al. (1995) to better fit to the observed tail shape morphology. Five groups were defined: short-round (1), conical (2), clavate (3), conico-cylindrical (4) and filiform (5). Our definitions of short-round (1) and conical (2) correspond to the classification of Platt and Warwick (1983). Tail shapes 3 – 5 refer to Thistle and Sherman (1985): Clavate (3) corresponds to ‘paddle’, conico-cylindrical (4) corresponds to ‘hemisessile’ and filiform (5) corresponds to ‘whip’ (see Figure 3 of Thistle and Sherman, 1985).
Nematode community structure can be described with the ratio of ‘colonizers’ (c) to ‘persisters’ (p), sensu lato, the ratio of r-strategists to K-strategists in a sample (Bongers, 1990). Colonizers are defined by short generation times with high colonization ability, persisters are defined by long generation times with low colonization ability and both groups represent two ends of the c-p scale ranging from 1 – 5 respectively (Bongers, 1990). We assigned c-p values on genus level based on the classifications by Bongers et al. (1991; 1995) and Bongers and Bongers (1998). For genera not listed in Bongers et al. (1991; 1995) and Bongers and Bongers (1998), we decided to assign the c-p value to which the majority of genera in that family belonged. The weighted mean of the individual c-p values is calculated as the Maturity Index (MI) according to the formula given by Bongers (1990): , where v(i) is the c-p value of genus i and f(i) is the frequency of that genus in the sample.
2.3.3 Environmental parameters
Subsamples for analyses of sediment-bound phospholipids (PL) as a proxy for microbial biomass in the sediments, the ash-free dry weight (AFDW) as a proxy for total organic content in the sediment, and the sediment water content (H2O) as a proxy for porosity of the sediment were taken with 20 ml cut-off syringes (ø = 2.2 cm). Subsamples for measuring chloroplastic pigment equivalents (CPE), exo-enzymatic bacterial activity (FDA), for counting the total bacteria number (TBN), particulate proteins (PP) and organic carbon content (C-org) were taken with 5 ml cut-off syringes (ø = 1.2 cm).
A potential food source for meiobenthic organisms is the organic matter derived from primary production in surface waters. The amount of phytodetrital matter at the seafloor was estimated from sediment-bound chloroplastic pigment concentrations (chloroplastic pigment equivalents, CPE; Thiel, 1978; Greiser and Faubel, 1988). The CPE content of the sediment was estimated by quantifying chlorophyll a (Chl a) and its degradation products (phaeopigments, Phaeo), by pigment extraction in 90% acetone and subsequent concentration measurement in a Turner fluorometer (Yentsch and Menzel, 1963; for detailed methods see Holm-Hansen et al., 1965). An indicator for the ‘freshness’ of sediment-bound pigments is the ratio of chlorophyll a to phaeopigment (Chl a:Phaeo) (Yentsch, 1967). Microorganisms are another potential food source for meiobenthic fauna (Greiser and Faubel, 1988). They were estimated as the total microbial biomass by analyzing phospholipid concentrations (PL) in the sediments. This includes the entire small-sized benthic biota, like bacteria, fungi, protozoans, and the metazoan meiofauna inhabiting the sediment (Findlay et al., 1989). Particulate proteins (PP), defined as γ-globulin equivalents were analyzed as an indicator for the bulk of living- and dead biomass in the sediments following the protocol of Greiser and Faubel (1988). Samples to assess total bacteria numbers (TBN) were fixed in 2% formalin/filtered seawater solution (v/v). Bacteria were counted after Acridine Orange staining (Strugger, 1948) under an OLYMPUS BX60 epifluorescence microscope. Exo-enzymatic bacterial activity was measured with the fluorogenic substrate fluorescein-di-acetate (FDA; Köster et al., 1991), directly after retrieval of the sediment cores. The total of available organic hydrocarbons in the sediment was assessed by measuring the organic carbon content (C-org) via gas chromatography in a CNS element analyzer (Kirsten, 1979). A proxy for the amount of organic content in the sediment is the ash-free dry weight (AFDW). It was weighted after combustion of the samples for 2 h at 500°C. Sediment porosity was estimated from the water content (H2O) in the sediment. The sediment was weighted before (wet) and after (dry) desiccation for 4 h at 470°C and the H2O content was derived from the difference in weight.
2.4 Data analysis
All parameters and abundances were standardized to an area of 10 cm2 seafloor for further analyses. The nematode community was described along the bathymetric transect (sediment depth integrated) with different diversity indices. The Shannon diversity H’(log2) (Shannon, 1948), the evenness of genus distribution J’ after Pielou (1966) as well as a rarefaction for an expected number of 50 genera EG(50) (Sanders, 1968; Hurlbert, 1971) were calculated.
We performed a hierarchical cluster analysis (group-average linkage) and similarity profile test (SIMPROF) on a Bray-Curtis similarity matrix of square root transformed nematode abundance data to test for significant bathymetric grouping of our samples (Clarke and Warwick, 2001; Clarke et al., 2008). SIMPROF was run with each mean profile estimated from 1000 permutations and 9999 permutations were used for simulation (5% significance level). Differences in the communities between stations were visualized by the use of non-metric multidimensional scaling (nMDS). Additionally, many singleton individuals we determined were in bad condition and thus not undoubtedly assignable to a genus (labelled as cf genera in Supplementary Table 1). We decided to include these genera in the statistical analysis nevertheless.
Environmental parameters were visualized using scatterplots with a linear regression and box plots. A Spearman rank correlation coefficient (rs) was calculated for each parameter. The Kruskal-Wallis test (Kruskal and Wallis, 1952) was used to test for significant differences in environmental parameters between bathymetric zones. The relationships of nematode abundance and environmental parameters were investigated using a distance-based linear model (DistLM) (selection criterion: Adjusted R2, selection procedure: All specified, 9999 permutations). Draftsman plots were calculated using the non-parametric Spearman rank correlation coefficient (rs) to test for collinearity of predictor variables. The DistLM was visualized by plotting a distance-based redundancy analysis (dbRDA) including normalized predictor variables.
All analyses were carried out using PRIMER 6 (version 6.1.15) with the PERMANOVA+ addon (version 1.0.5) (Clarke and Gorley, 2006; Anderson et al., 2008). The nMDS and dbRDA plots were created with PRIMER 6. For bar plots, scatter plots and box plots, R version 4.4.2 (R Core Team, 2022), RStudio version 2023.3.0.386 (Posit team, 2023) and the R packages ‘ggplot2’ (Wickham, 2016), ‘ggpmisc’ (Aphalo, 2022), ‘ggpubr’ (Kassambara, 2023), ‘forcats’ (Wickham, 2023), ‘hrbrthemes’ (Rudis, 2020), ‘svglite’ (Wickham et al., 2023) and ‘viridis’ (Garnier et al., 2021) were used. QGIS version 3.30.1 (QGIS Development Team, 2009) was used for creating the HAUSGARTEN map.
3 Results
3.1 Meiofauna composition
Nematodes dominated the metazoan meiofauna community along the HAUSGARTEN bathymetric transect with a total of 10,404 specimens, representing a relative abundance of 97% of the total meiofauna (Supplementary Table 2). The second most abundant taxon was copepods with 170 individuals, representing on average 1.6% of the relative abundance. Nauplii followed in third place with 74 individuals and an average relative abundance of 0.7%. All other meiofaunal taxa (Polychaeta, Kinorhyncha, Gastrotricha, Bivalvia, Tardigrada, Protohydra, Ostracoda, Halacaroidea, Isopoda and Tanaidacea) found along the bathymetric transect occurred with relative abundances below 0.3% on average (Supplementary Table 2).
3.2 Nematode abundance and community structure
Of the 10,404 nematodes found, 10,147 specimens were identified to 39 families and 178 genera (Supplementary Table 1). The condition of 257 specimens was not sufficient enough to assign them unambiguously to any family morphologically and were therefore excluded from further analysis. A total of 53 genera were singletons; 16 genera occurred as doubletons. The genus with the highest total abundance was Amphimonhystera (4803 ind./10 cm2), followed by Acantholaimus (3355 ind./10 cm2) and Tricoma (1872 ind./10 cm2). Nematodes were most abundant at station HG-III (2609 ± 278 ind./10 cm2), and least abundant at station HG-IV (421 ± 90 ind./10 cm2) (Table 1).
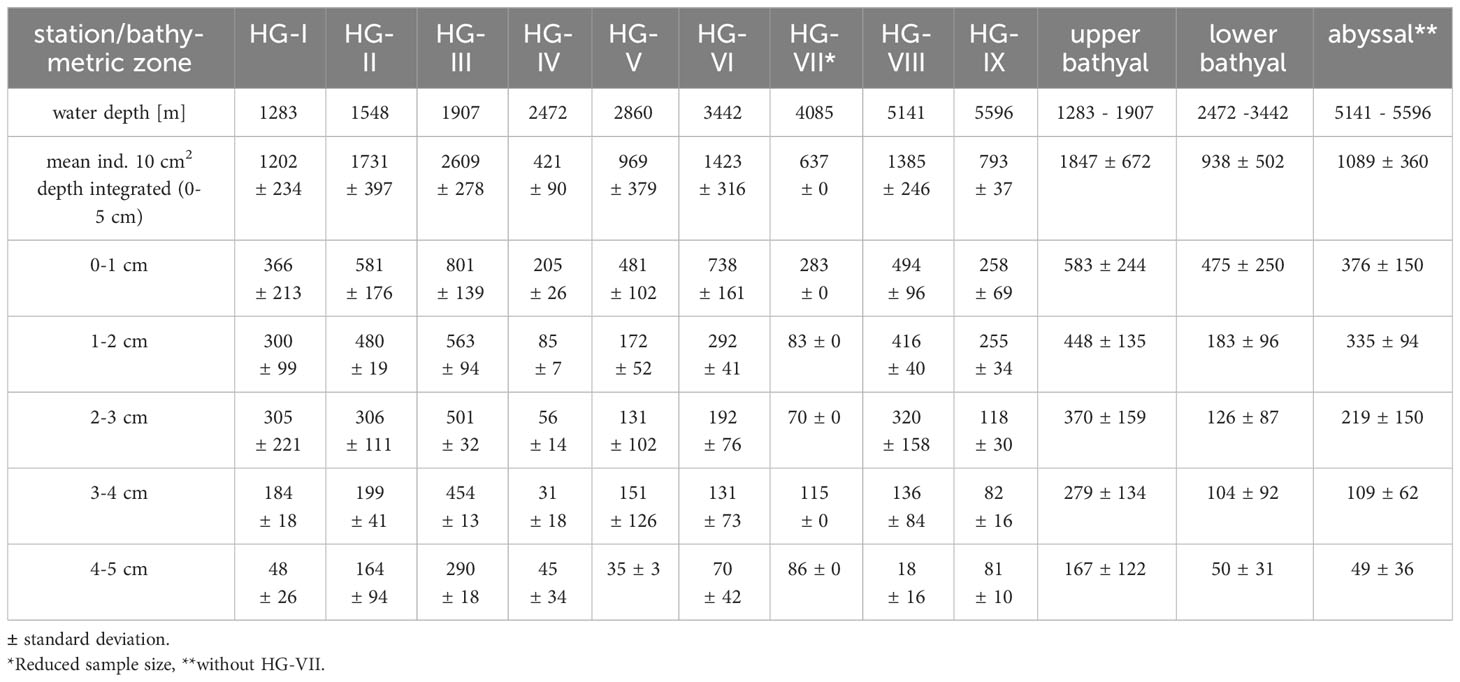
Table 1 Mean nematode abundances for HAUSGARTEN stations (HG-I – HG-IX) along the bathymetric transect, sediment layer (0-5 cm) and three bathymetric zones (upper bathyal, lower bathyal, abyssal).
The sample statistic of the similarity profile test (SIMPROF) for the nematode abundance data revealed a multivariate structure over the set of stations along the bathymetric transect (Supplementary Figure 1). SIMPROF identified three groups, which are also reflected in the nMDS plot (Figure 2). The first group consists of the stations HG-IV and HG-VII and is separated from all other stations with a similarity of 51.3% (Pi: 4. 7; Sig (%): 0.1). The second group consists of the stations HG-VIII and HG-IX and is separated from the other stations by a similarity of 53.2% (Pi: 4.6; Sig (%): 0.1). With a similarity of 62.5% (Pi: 2.5; Sig (%): 0.1) the stations split into a HG-VI and HG-V group and into a HG-III, HG-II and HG-I group. The stations could be assigned to three different bathymetric zones with a similarity of 62.5% according to their respective water depth: The upper bathyal (stations HG-I, HG-II, and HG-III, 1300 – 2000 m depth), the lower bathyal (stations HG-IV, HG-V and HG-VI, 2500 – 3500 m depth) and the abyssal (stations HG-VIII and HG-IX, 5100 – 5600 m depth). We decided to exclude HG-VII from the abyssal zone due to its reduced sample size (see 2.2 Sampling). Nematodes had the highest densities at the upper bathyal stations with 1847 ± 672 ind./10 cm2. In the lower bathyal, nematode density decreased to 938 ± 502 ind./10 cm2 and increased again in the abyssal zone to 1089 ± 360 ind./10 cm2 (excluding HG-VII) (Table 1).
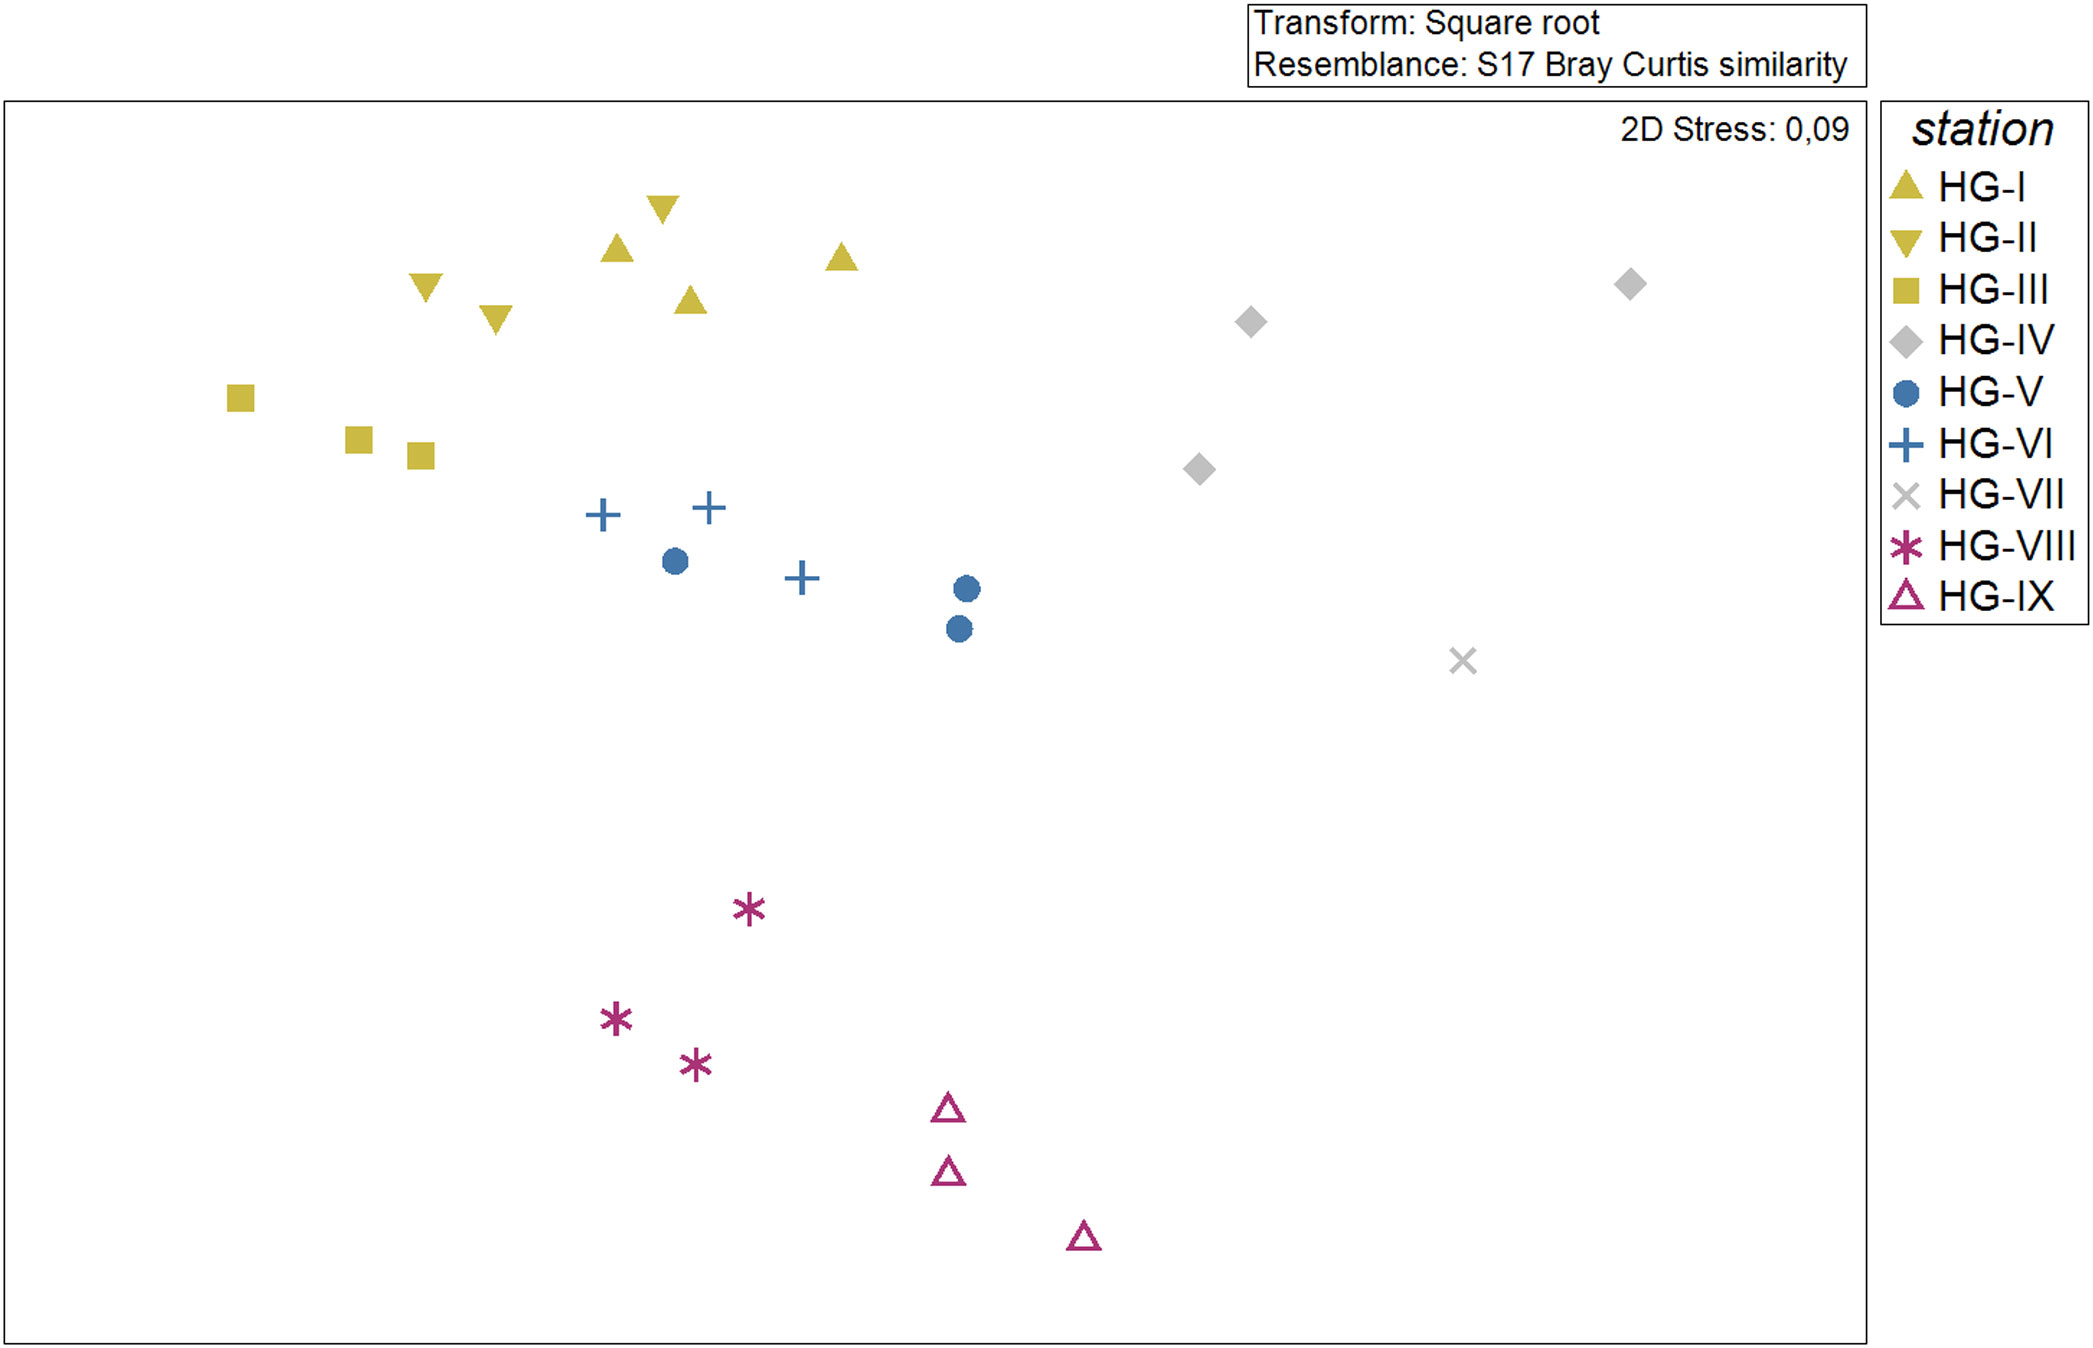
Figure 2 nMDS plot showing similarities (Bray Curtis similarity) in nematode community composition at the HAUSGARTEN stations along the bathymetric transect based on square root transformed abundance data. Colors match the bathymetric zonation at 62.53% similarity (derived from SIMPROF cluster).
Of the 178 nematode genera found, 11 genera occurred at least at one station with a relative abundance of ≥ 5% and were therefore considered as dominant (Figure 3; Supplementary Table 3). These genera were Acantholaimus, Aegialoalaimus, Amphimonhystera, Amphimonhystrella, Desmoscolex, Halalaimus, Microlaimus, Monhystrella, Sabatieria, Thalassomonhystera and Tricoma. In total they represented 63.8% of all genera encountered along the bathymetric transect. These genera belong to eight different families (Aegialoalaimidae, Chromadoridae, Comesomatidae, Desmoscolecidae, Microlaimidae, Monhysteridae, Oxystominidae and Xyalidae), representing 81.1% of the families found along the bathymetric transect.
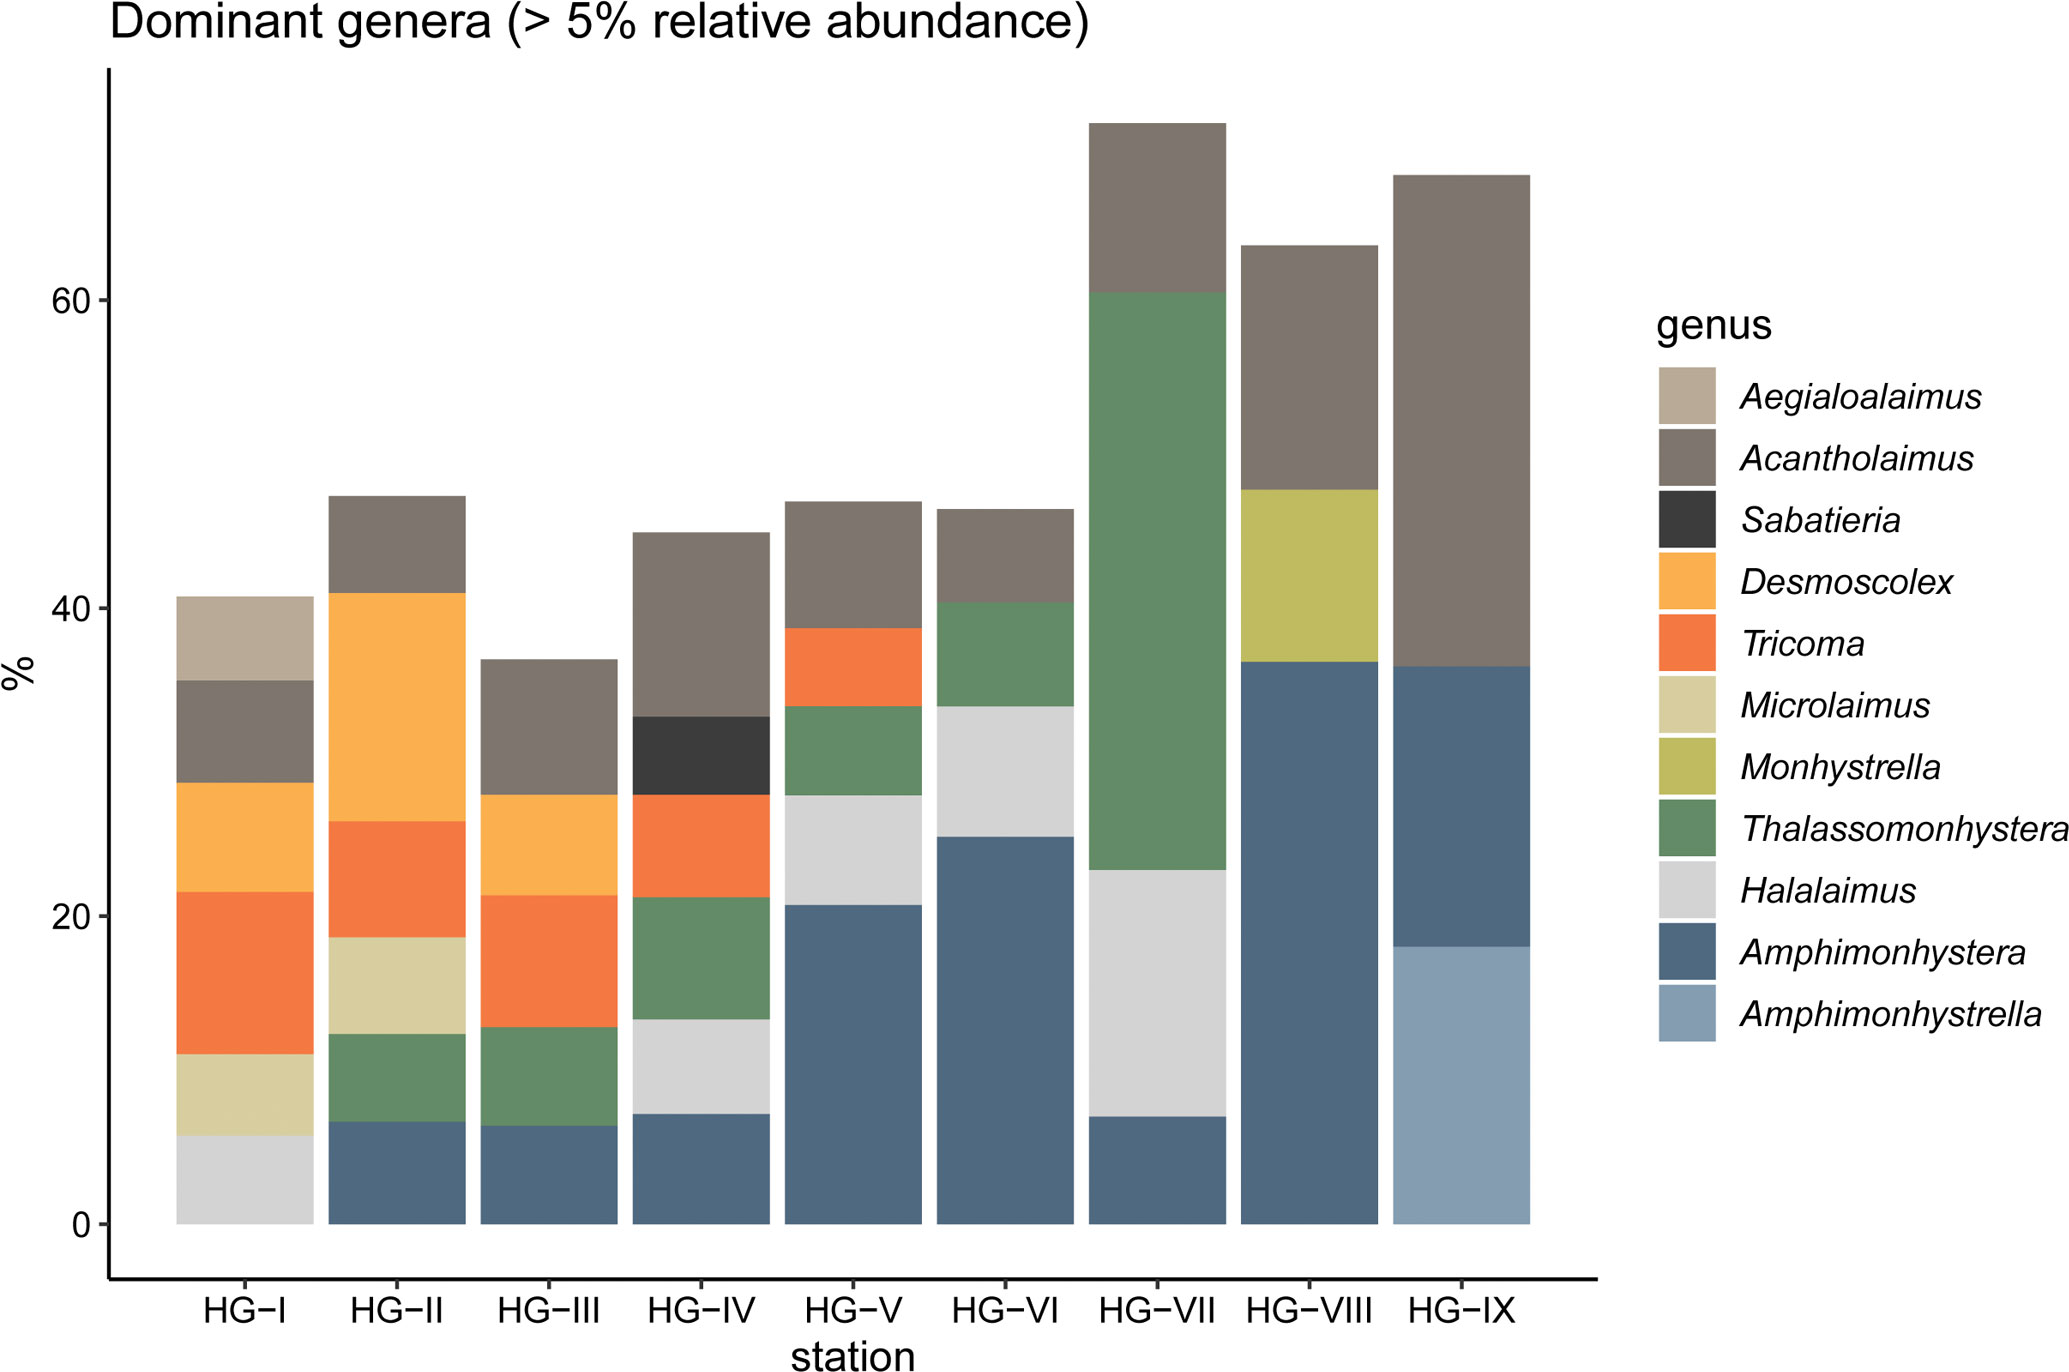
Figure 3 Stacked barplot of the eleven dominant nematode genera (>5% relative abundance) at the HAUSGARTEN stations along the bathymetric transect.
The only dominant genera at all bathymetric zones were Acantholaimus and Amphimonhystera. Both genera showed an increase in dominance with increasing depth. In the upper bathyal, Acantholaimus had a mean dominance of 7.3 ± 1.4%, Amphimonhystera of 5.9 ± 1.1%. In the lower bathyal, Acantholaimus had a mean dominance of 8.8 ± 3.0%, Amphimonhystera of 17.7 ± 9.4% and in the abyssal, the mean dominance of Acantholaimus increased to 23.9 ± 11.3% and Amphimonhystera to 27.3 ± 13.0%. Other dominant genera in the upper bathyal were Desmoscolex (9.5 ± 4.6%), Tricoma (8.9 ± 1.5%) and Microlaimus (5.1 ± 1.3%), in the lower bathyal Halalaimus (7.2 ± 1.2%), Thalassomonhystera (6.8 ± 1.1%) and Tricoma (5.5 ± 1.0%) and in the abyssal Amphimonhystrella (11.5 ± 9.3%) and Monhystrella (6.7 ± 6.3%) (Figure 3; Supplementary Table 3).
3.3 Nematode diversity
The total number of genera G, the expected number of genera for 50 individuals EG(50), and heterogeneity H’(log2) of the nematode communities were highest at HG-III (G = 77.3 ± 5.0 ind./10 cm2; EG(50) = 24.7 ± 1.5 ind./10 cm2; H’(log2) = 5.1 ± 0.2) and lowest at HG-IX (G = 24.3 ± 2.1 ind./10 cm2; EG(50) = 12.4 ± 1.4 ind./10 cm2; H’(log2) = 3.2 ± 0.3) (Table 2). Pielou’s evenness J’ was highest at HG-IV (0.88 ± 0.00) and lowest at HG-VIII (0.66 ± 0.03) (Table 2). Comparing the three depth zones, total number of genera, expected number of genera and heterogeneity of the nematode communities decreased with increasing depth (Table 2). Communities in the upper bathyal expressed the highest values (G = 66.8 ± 9.4 ind./10 cm2; EG(50) = 23.6 ± 1.5 ind./10 cm2; H’(log2) = 4.9 ± 0.2), followed by communities in the lower bathyal (G = 49.4 ± 9.7 ind./10 cm2; EG(50) = 21.8 ± 1.1 ind./10 cm2; H’(log2) = 4.6 ± 0.2) and the abyssal (G = 29.2 ± 5.6 ind./10 cm2; EG(50) = 13.2 ± 1.4 ind./10 cm2; H’(log2) = 3.3 ± 0.3). Evenness was almost identical in the upper bathyal (J’ = 0.81 ± 0.03) and lower bathyal (J’ = 0.82 ± 0.05). It decreased in the abyssal (J’ = 0.67 ± 0.04) (Table 2).
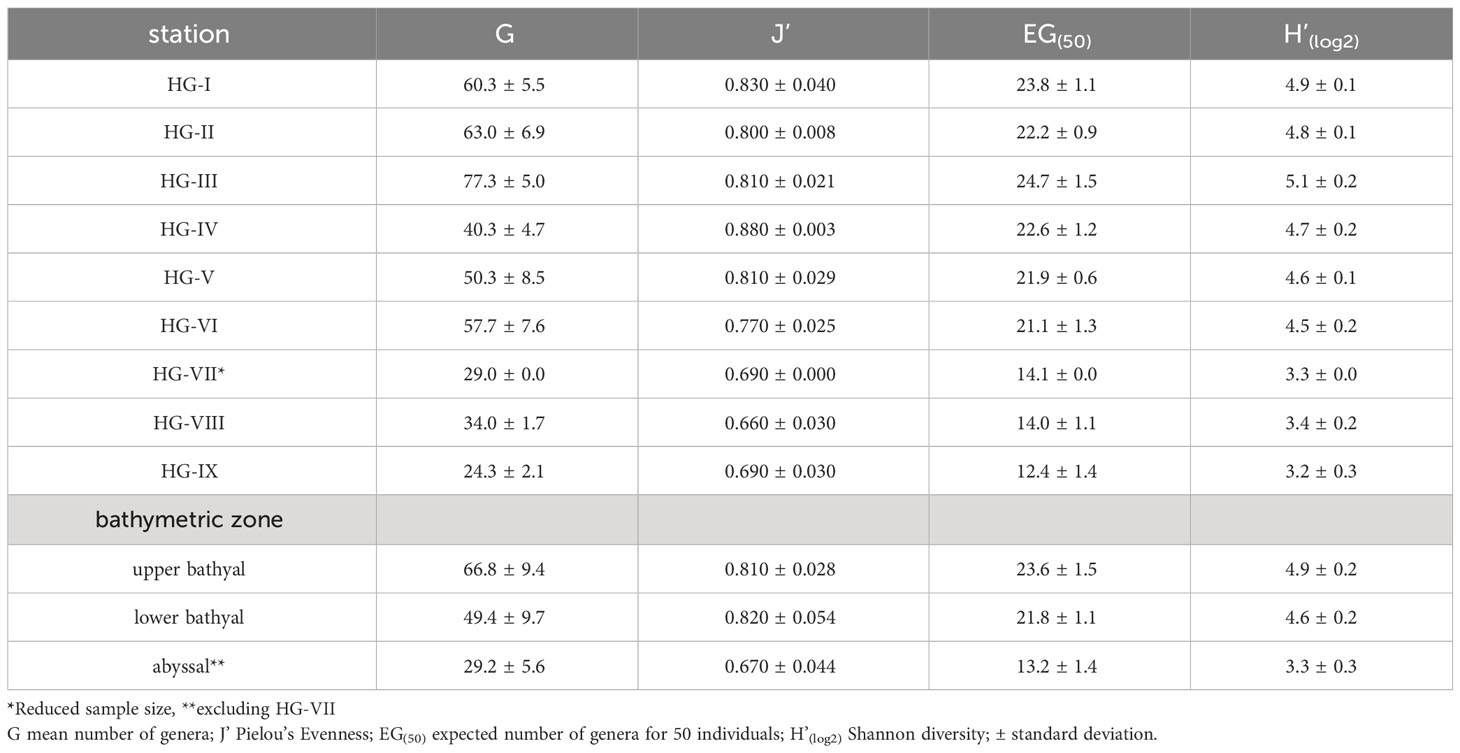
Table 2 Taxonomic/abundance-based diversity measures of nematode communities at HAUSGARTEN stations (HG-I – HG-IX) along the bathymetric transect.
3.4 Nematode feeding types
The composition of nematode feeding types across the bathymetric transect at all stations was dominated by non-selective feeders (1B: 48.1 ± 13.3%), followed by selective feeders (1A: 27.3 ± 11.8%). Epistrate feeders (2A: 20.5 ± 5.3%) and predators/omnivores (2B: 4.1 ± 2.5%) had the lowest average dominance (Figure 4; Supplementary Table 4). Increased dominance of predators/omnivores (2B) was found at stations HG-I (5.4 ± 2.4%), HG-II (5.3 ± 2.5%) and HG-IX (4.8 ± 1.2%). Selective feeders (1A) remained dominant at similar levels in the upper (37.1 ± 5.9%) and the lower bathyal (31.4 ± 1.6%) and decreased in the abyssal (9.5 ± 5.6%). The dominance of non-selective feeders (1B) gradually increased from 36.5 ± 7.5% in the upper bathyal and 47.5 ± 3.2% in the lower bathyal to 62.0 ± 20.6% in the abyssal. The dominance of epistrate feeders (2A) and predators/omnivores (2B) showed a similar pattern in all depth zones along the bathymetric transect: upper bathyal (2A: 22.0 ± 1.9%; 2B: 4.4 ± 2.0%), lower bathyal (2A: 17.9 ± 2.7%; 2B: 3.3 ± 2.2%) and abyssal (2A: 24.8 ± 10.5%; 2B: 3.7 ± 4.6%). The index of trophic diversity (ITD) calculated for the nematode communities along the depth transect remained almost constant in the bathyal zones, ranging from 0.3 ± 0.0 at HG-I in the upper bathyal to 0.4 ± 0.0 at HG-VI in the lower bathyal. In the abyssal, the ITD increased to 0.6 ± 0.1 at HG-VIII and to 0.4 ± 0.0 at HG-IX (Supplementary Table 4).
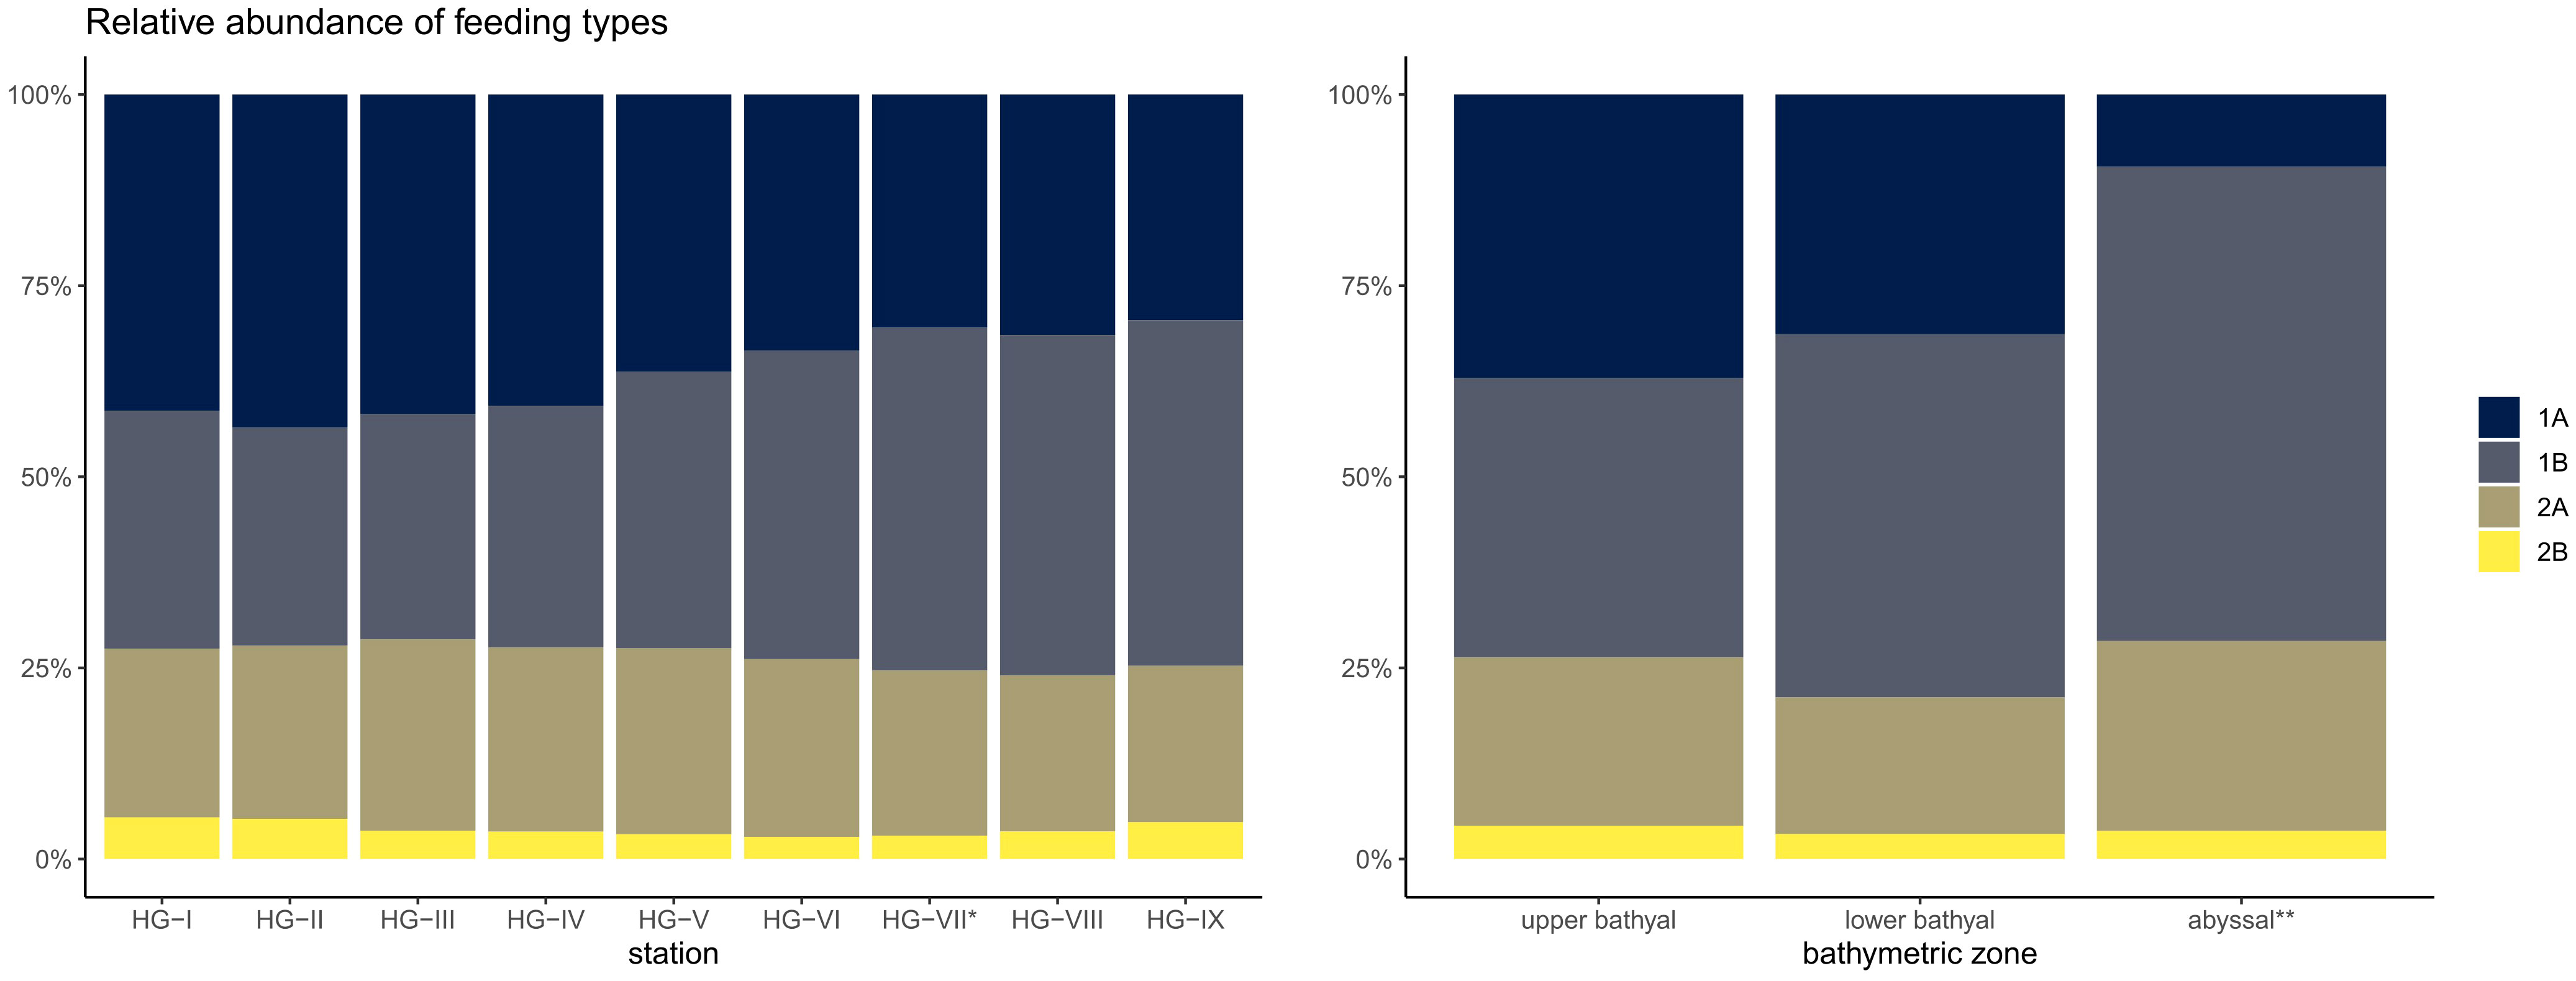
Figure 4 Stacked barplot of the relative abundances of the four different feeding types after Wieser (1953) at the HAUSGARTEN stations and in each bathymetric zone. 1A non-selective feeders; 1B selective feeders; 2A epistrate feeders; 2B omnivores/predators; * reduced sampling size; ** excluding HG-VII.
3.5 Nematode tail shapes
The nematode community across the bathymetric transect (excluding HG-VII) was dominated by nematodes with conical and conico-cylindrical tails, with relative abundances ranging from 17.2 ± 3.9% to 57.4 ± 4.5% (conical) and 18.5 ± 6.8% to 60.7 ± 6.4% (conico-cylindrical), respectively (Figure 5; Supplementary Table 5). Nematodes with filiform (4.3 ± 3.7% to 14.5 ± 8.9%) and short-round (1.0 ± 0.2% to 8.6 ± 2.9%) tails were less common. Clavate-tailed nematodes were found from HG-I to HG-VIII with relative abundances ranging from 5.1 ± 1.5% to 10.9 ± 5.3%, with an increasing dominance to 20.8 ± 3.5% at HG-IX. In the upper bathyal, nematodes with conical tails contributed 53.4 ± 6.8% and those with conico-cylindrical tails 21.7 ± 5.1% to the diversity of tail shapes. In the lower bathyal, the mean percentages of nematodes with conical and conico-cylindrical tail shapes converged (conical 44.5 ± 10.3%, conico-cylindrical 37.0 ± 11.8%) and were reversed in the abyssal (conical 18.4 ± 3.0%, conico-cylindrical 57.2 ± 7.7%). The abundance of short, round-tailed nematodes decreased with increasing depth of the bathymetric zones from 6.4 ± 2.8% in the upper bathyal and 3.4 ± 2.8% in the lower bathyal to 1.3 ± 1.4% in the abyssal. The relative abundance of nematodes with filiform tails remained at a similar level with 10.0 ± 4.3% in the upper bathyal and 9.4 ± 8.3% in the abyssal with a slight decrease to 7.6 ± 4.9% in the lower bathyal. Clavate-tailed nematodes increased in relative abundance from 8.5 ± 3.1% in the upper bathyal and 7.4 ± 3.8% in the lower bathyal to 13.7 ± 8.1% relative abundance in the abyssal (Figure 5; Supplementary Table 5).
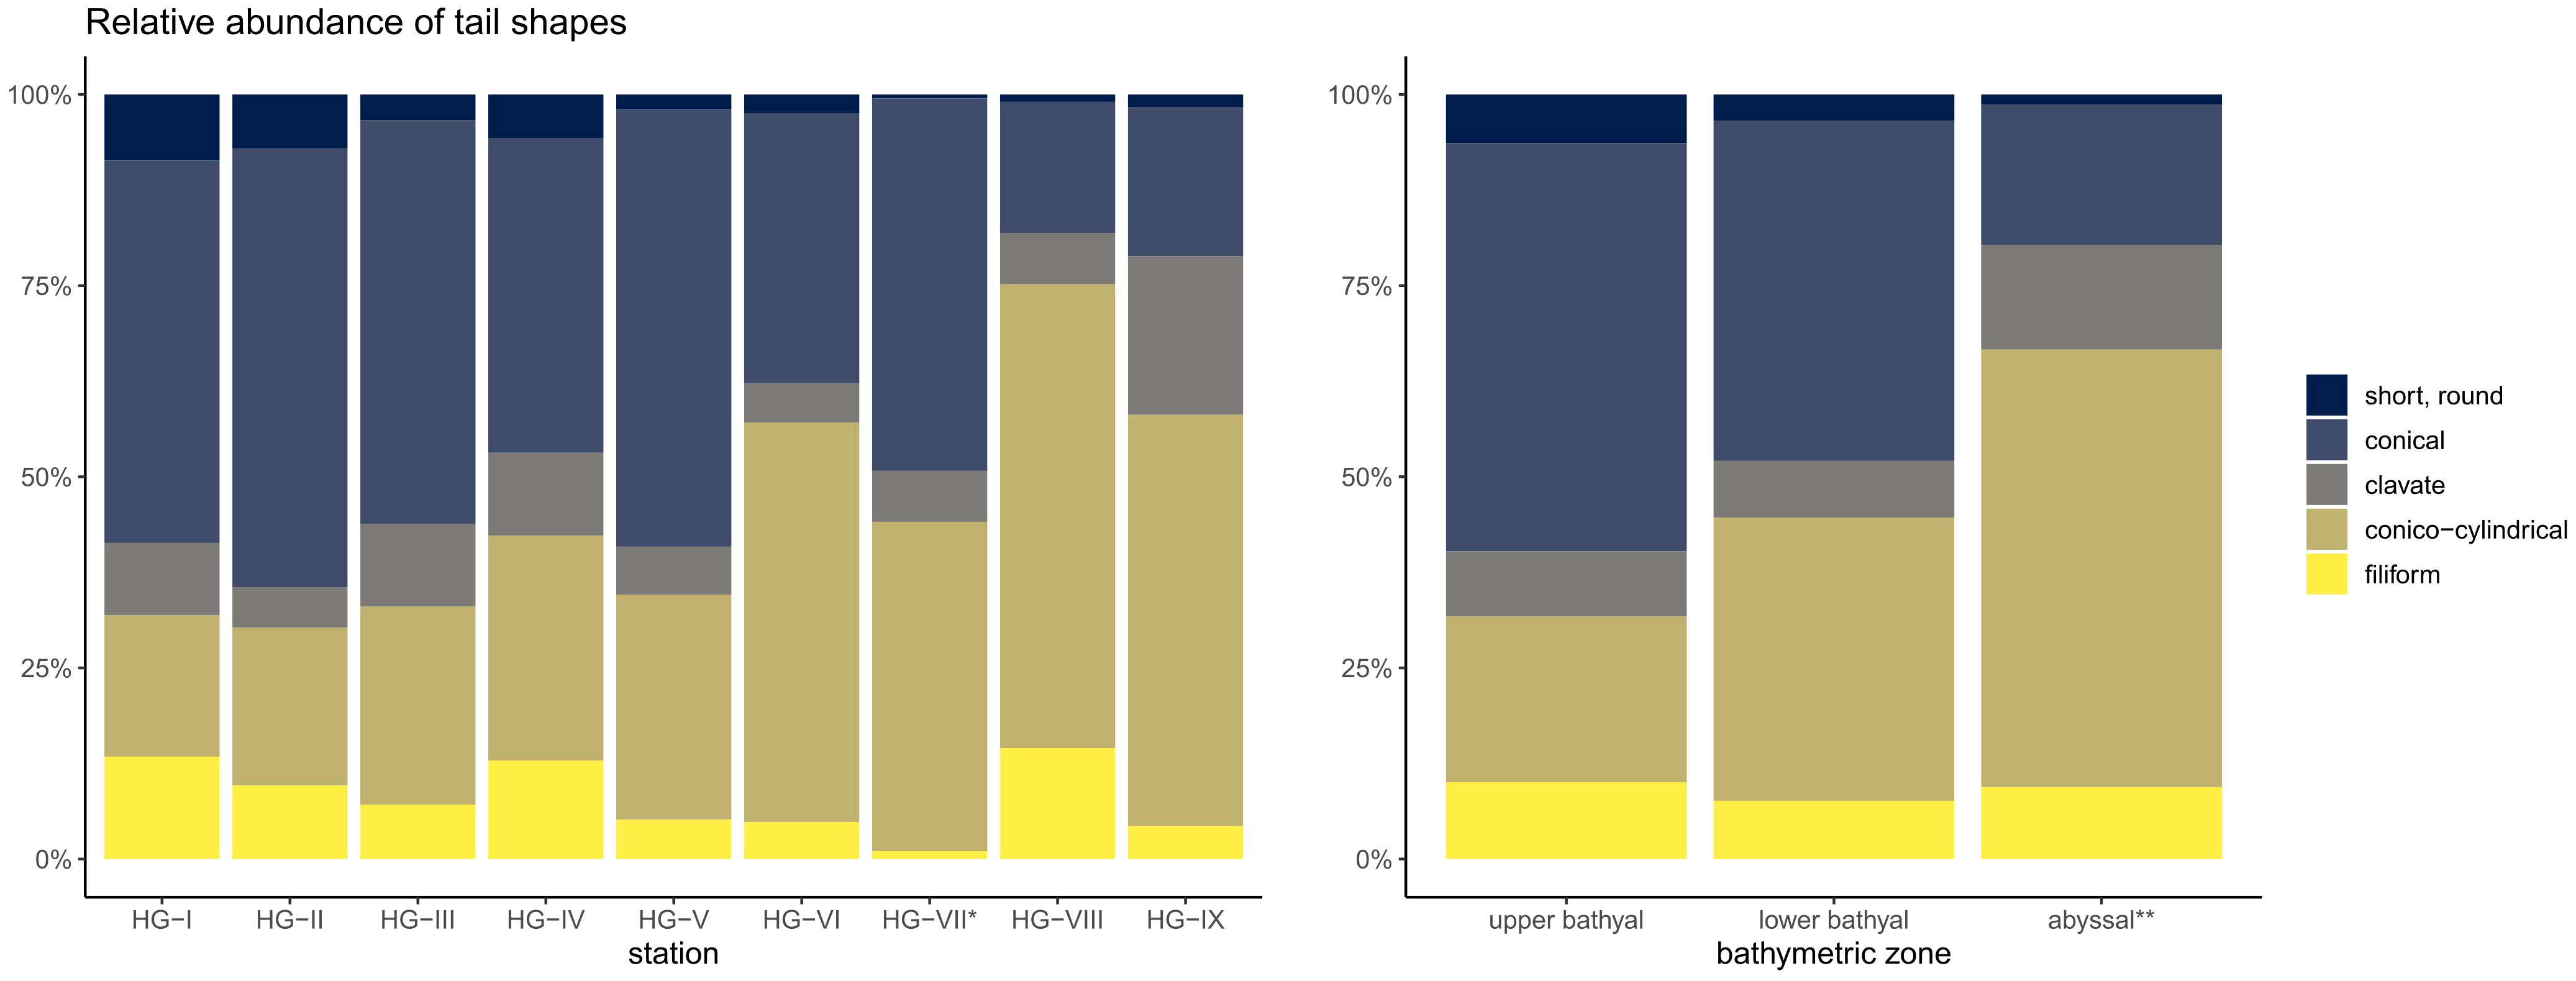
Figure 5 Stacked barplot of the relative abundance of nematode tail shapes at the HAUSGARTEN stations and the three bathymetric zones. * reduced sampling size; ** excluding HG-VII.
3.6 c-p values
Nematodes assigned to a c-p value 2 dominated the bathymetric transect with 55.8% (Figure 6; Supplementary Table 6). Nematodes classified as c-p value 4 (22.6%) and c-p value 3 (21.5%) were the second and third most abundant. Very small proportions of the nematodes were assigned with c-p value 5 (0.04%). Nematodes with c-p value 1 were not found. Comparing the bathymetric zones, the dominance of nematodes with c-p 2 increased from 47.2 ± 1.0% in the upper bathyal and 57.1 ± 0.5% in the lower bathyal to 66.5 ± 1.4% in the abyssal. A strong decrease in dominance with depth was found for nematodes with c-p 4, with 32.2 ± 5.1% in the upper bathyal, 21.9 ± 0.8% in the lower bathyal and 3.0 ± 1.2% in the abyssal. Nematodes with c-p 3 were relatively evenly distributed across the bathymetric zones with 20.6 ± 1.6% in the upper bathyal, 21.0 ± 2.4% in the lower bathyal and 30.6 ± 14.9% in the abyssal. Nematodes with c-p 5 were also relatively evenly distributed with low relative abundances in the bathymetric zones with 0.02 ± 0.03% in the upper bathyal, 0.03 ± 0.05% in the lower bathyal and 0.00 ± 0.00% in the abyssal.
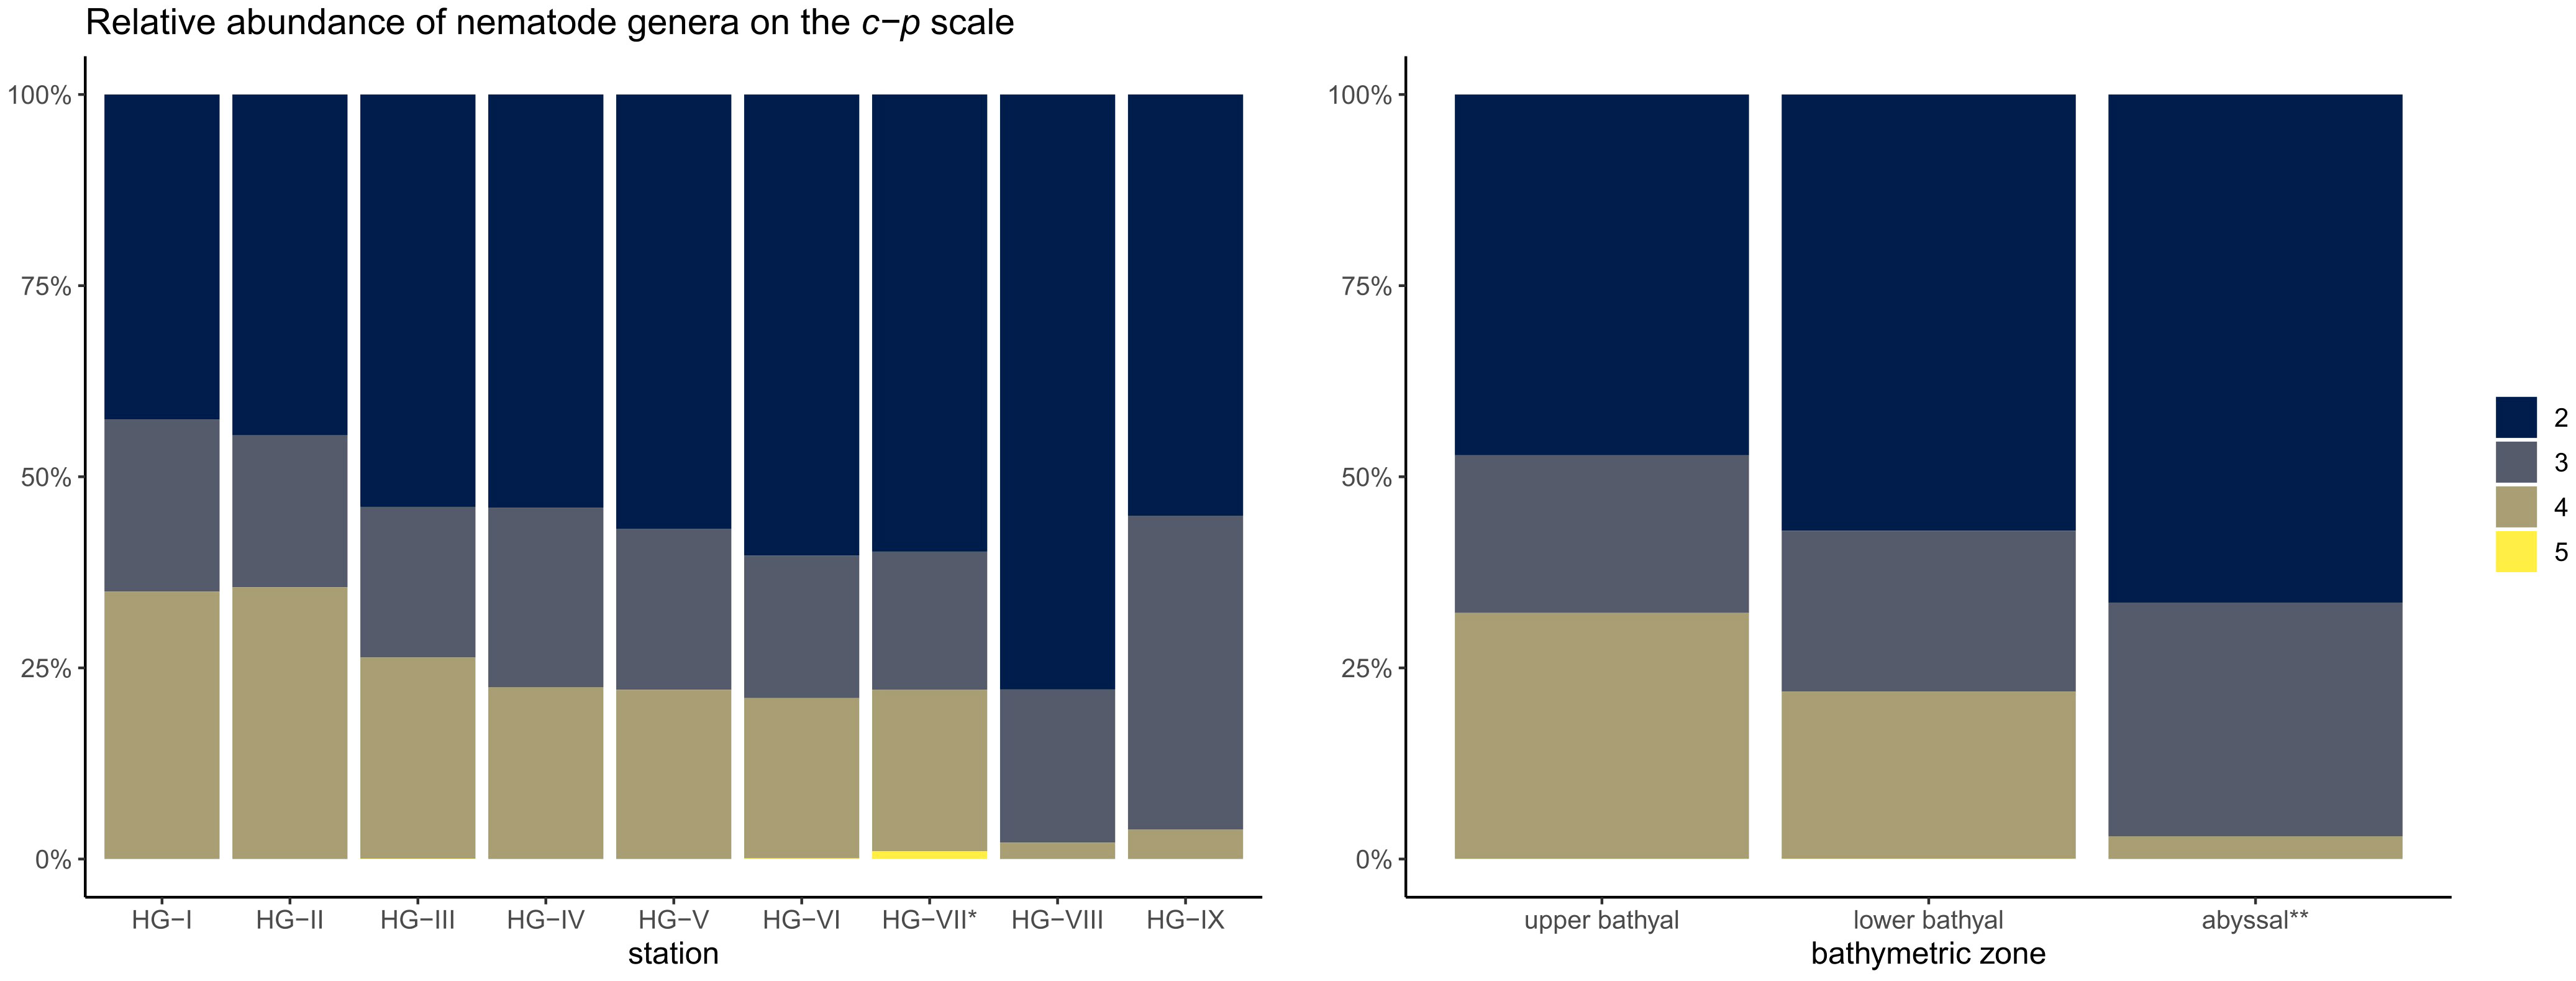
Figure 6 Stacked barplot of the relative abundance of nematode genera on the c-p scale at the HAUSGARTEN stations and the three bathymetric zones. The scale ranges from 2-5, since we did not encounter a single individual belonging to c-p 1. * reduced sampling size; ** excluding HG-VII.
The maturity index (MI) showed a slight decrease with increasing water depth from HG-I (2.92 ± 0.13) to HG-VIII (2.24 ± 0.07) (Supplementary Table 6). At HG-IX, it increased slightly to 2.49 ± 0.07. Comparing the bathymetric zones, the MI decreased from 2.85 ± 0.13 in the upper bathyal and 2.65 ± 0.07 in the lower bathyal to 2.37 ± 0.15 in the abyssal.
3.7 Environmental parameters
CPE concentrations decreased with increasing water depth and were highest in sediments from the shallowest station HG-I (113.96 ± 10.64 µg/ml). Values ranged from 89.79 ± 9.07 µg/ml at HG-III to 35.24 ± 3.94 µg/ml at station HG-VII. At the deepest station (HG-IX), the CPE concentration increased to 53.34 ± 8.70 µg/ml. The proportion of Chl a of the total pigment content (CPE) varied with water depth, being highest at HG-III (23.8%) and HG-VII (23.7%) and lowest at HG-I (9.7%). At HG-IX, Chl a contributed 16.9% to the CPE content. Significantly higher Chl a (p = 0.0037) and Phaeo (p = 0.00024) concentrations were measured in the upper bathyal, compared to the other bathymetric zones (Figure 7A).
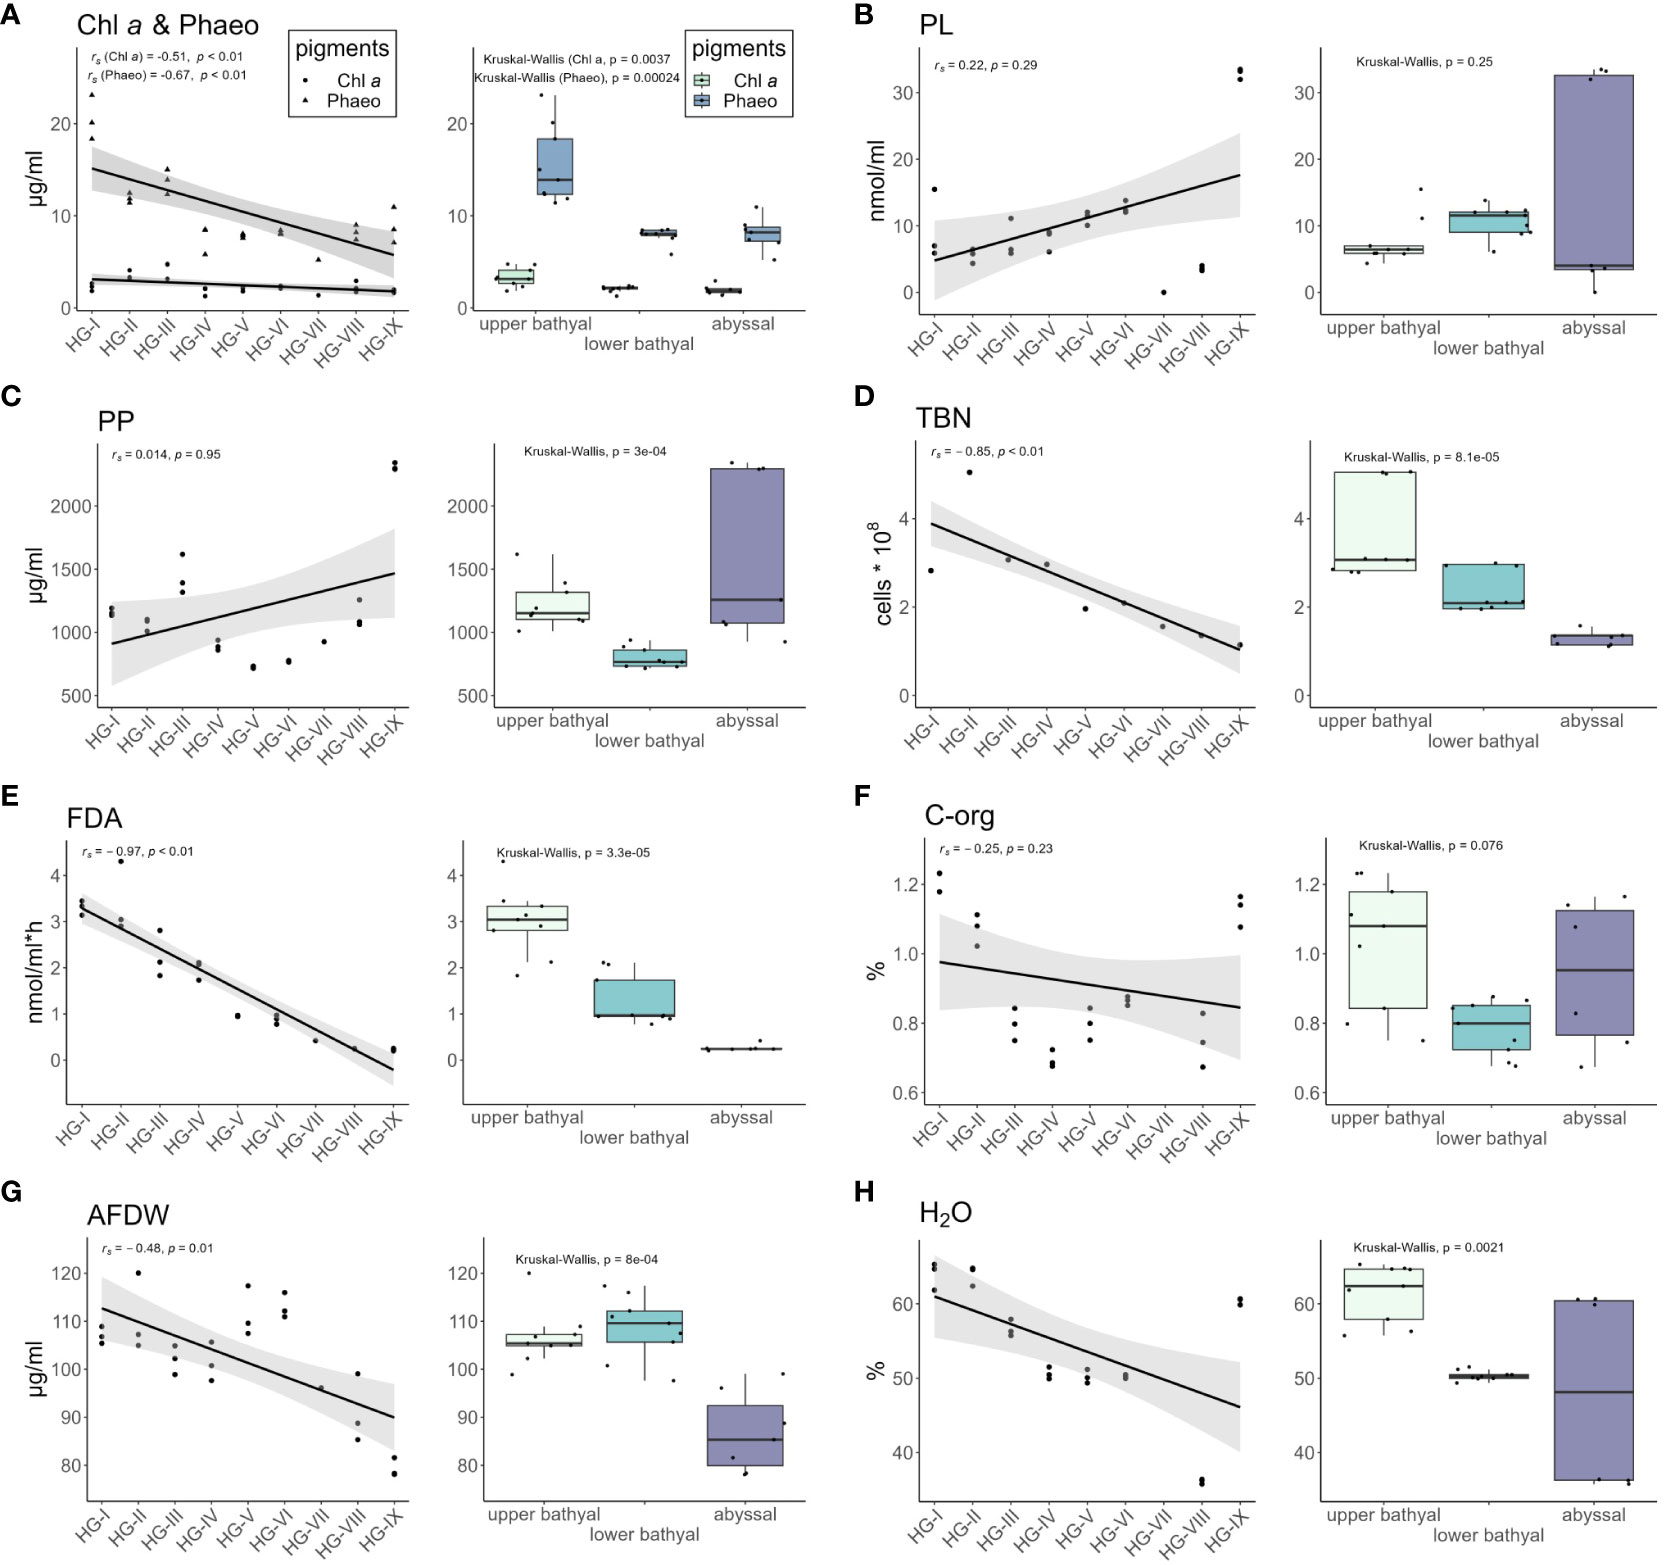
Figure 7 Concentrations of the different environmental parameters measured at each station shown by scatter plots (left) and for the three bathymetric zones (upper bathyal, lower bathyal, abyssal) shown by box plots (right). Grey area around the regression lines in the scatter plot represents 95% confidence interval. Whiskers in box plots represent variation range. (A) Chlorophyll a (Chl-a) and phaeopigments (Phaeo); (B) Phospholipids (PL); (C) Particulate proteins (PP); (D) Total bacterial number (TBN); (E) bacterial activity [measured as turnover of fluorescein-di-acetate (FDA)]; (F) Organic carbon (C-org); (G) Ash-free dry weight of the sediment (AFDW); (H) Sedimentary water content (H2O).
Phospholipid (PL) concentration increased with increasing water depth, with the highest PL concentrations measured at the deepest station (HG-IX) with 164.49 ± 35.54 nmol/ml and the lowest concentrations at HG-VIII with 18.09 ± 1.88 nmol/ml. At the other stations along the bathymetric transect, PL concentration ranged from 27.70 ± 5.42 nmol/ml to 83.40 ± 26.65 nmol/ml (no data available for HG-VII). A gradual increase in PL concentrations was measured from the upper bathyal to the lower bathyal. In the abyssal, PL concentrations fluctuated strongly from HG-VIII with 3.4 nmol/ml to HG-IX with 33.9 nmol/ml. The difference of PL concentrations between the bathymetric zones was not significant in the Kruskal-Wallis test (p = 0.25) (Figure 7B).
Particulate protein (PP) concentrations ranged from 3.63 ± 0.04 µg/ml to 11.55 ± 0.12 µg/ml. Lower PP concentrations were measured at lower bathyal stations compared to upper bathyal and abyssal stations. The difference between the bathymetric zones was significant (p = 3e-4) (Figure 7C).
Total bacterial numbers (TBN) within the sediments gradually decreased with increasing water depth. Highest TBN were recorded at HG-II with 5.04 * 108 cells per cm3 and lowest at station HG-IX with 1.14 cm3 * 108 cells per cm3. Values at the other stations ranged from 1.36 to 3.40 cm3 * 108 cells per cm3. TBN was highest in the upper bathyal zone and decreased significantly (p = 8.1e-5) with increasing depth of the bathymetric zones (Figure 7D).
Bacterial activity, as indicated by FDA turnover, showed a strong negative trend along the bathymetric transect. The highest activity was measured at HG-II with 17.08 nmol/ml*h-1 and the lowest activity at HG-IX with 1.15 nmol/ml*h-1. FDA turnover decreased significantly (p = 3.3e-5) decreased with increasing depth of the bathymetric zones (Figure 7E).
The organic carbon (C-org) content of the sediments was highest at HG-I with 1.26 ± 0.03%, followed by HG-IX with 1.13 ± 0.05% and HG-II with 1.07 ± 0.05%. At the other stations, the C-org contents ranged from 0.55 ± 0.01% to 0.80 ± 0.01%. The differences in C-org concentrations were not significant in the Kruskal-Wallis test (p = 0.078) (Figure 7F).
The ash-free dry weight (AFDW) of the sediments was highest at HG-V with 111.47 ± 4.26 µg/ml and lowest at HG-IX with 79.32 ± 1.60 µg/ml. At the other stations AFDW ranged from 110.75 ± 6.63 µg/ml to 90.37 ± 5.37 µg/ml. AFDW differed significantly (p = 8e-4) between the bathymetric zones (Figure 7G).
Sediment water contents were highest at HG-I (63.93 ± 1.50%), HG-II (63.92 ± 1.09%) and HG-IX (60.37 ± 0.36%). At the other stations the water content ranged from 35.72 ± 1.40% to 56.65 ± 0.93%. The water content differed significantly between the bathymetric zones (p = 0.0017) and decreased from the upper bathyal to the abyssal (Figure 7H).
3.8 Relationship between nematode diversity and environmental parameters
Pairwise scatter plots (Draftsman plots) with all environmental parameters identified collinearity between pairs of environmental parameters. The strongest collinearity of parameters in all Draftsman plots was rs = 0.86 for FDA and TBN. This is below the cut-off threshold of 0.95 given by Anderson et al. (2008), therefore FDA and TBN were included in the calculation of the DistLM.
The two axes of the distance-based redundancy analysis (dbRDA) plot to visualize the DistLM results showed 65.6% of the fitted and 44.0% of the total variation (Figure 8). All predictor variables were significant in the marginal tests. In the sequential tests, the predictor variables H2O (p = 0.1866), PL (p = 0.6530), PP (p = 0.5508), and FDA (p = 0.0565) did not contribute significantly to the variation explained by the model (Supplementary Table 7). The grouping of stations in the dbRDA plot (Figure 8) corresponded to the results of the cluster analysis of the nematode abundance data (Supplementary Figure 1) (see 3.2 Nematode abundance and community structure). Nematode community composition in the upper and lower bathyal was more influenced by Chl a, Phaeo, TBN, FDA, AFDW and H2O compared to the abyssal, where nematode community composition was more influenced by PP and PL concentrations.
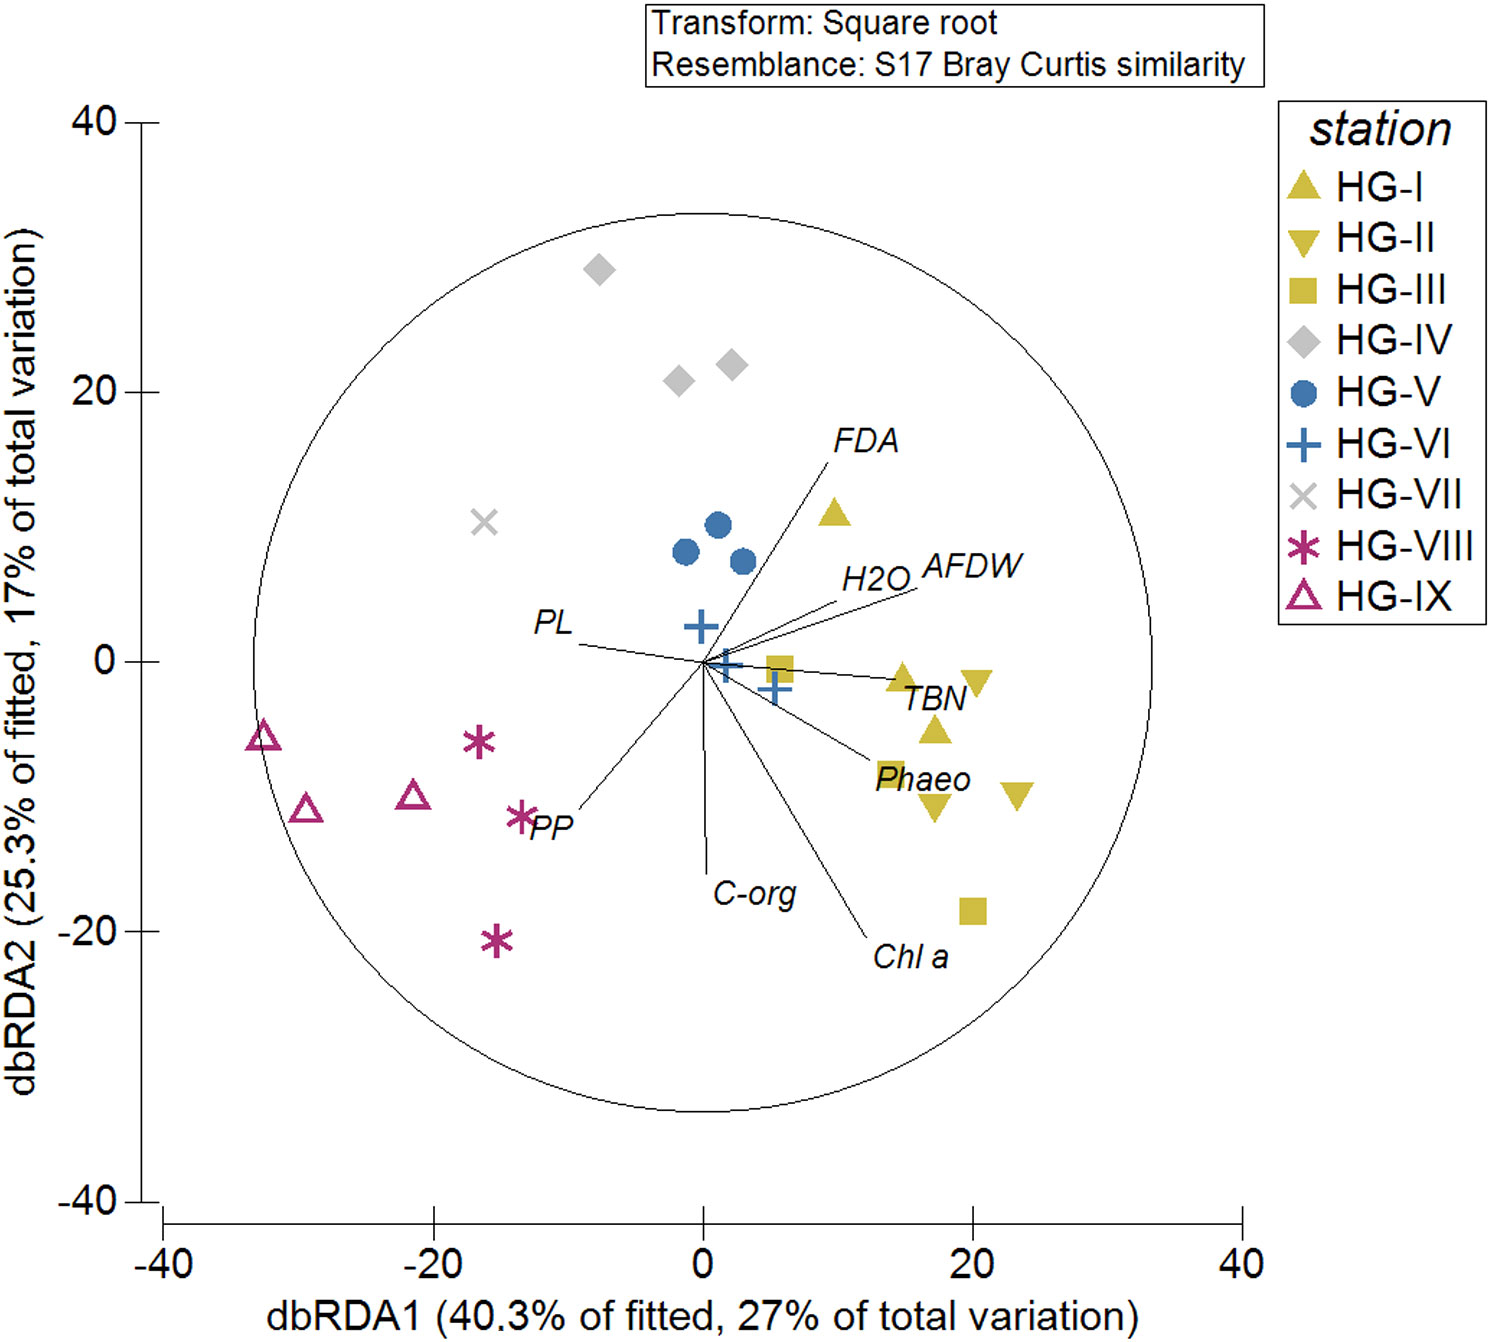
Figure 8 Results of a distance-based Linear Model (distLM) visualized by a distance-based redundancy analysis ordination to investigate the relationship between environmental variables and nematode communities at the HAUSGARTEN station along the bathymetric transect. The symbol color refers to the SIMPROF groups at 62.53% similarity. In black lines and letters are the different descriptor variables: AFDW, ash-free dry weight of the sediment; Chl-a, Chlorophyll a; C-org, Organic carbon; FDA, bacterial activity (measured as turnover of fluorescein-di-acetate); H2O, sedimentary water content; Phaeo, phaeopigments; PL, phospholipids; PP, particulate proteins; TBN, total bacterial number.
4 Discussion
4.1 Nematode abundance and taxonomic diversity along the bathymetric transect
With the results we present, hypothesis 1 can be accepted, if only community structure and taxonomic diversity are considered for the comparison with previous studies. The general decrease in the nematode dominated meiofauna abundance with increasing depth is consistent with previous data from the long-term meiofauna time series at HAUSGARTEN (Hoste et al., 2007; Górska et al., 2014; Grzelak et al., 2017; Soltwedel et al., 2020). Nematode communities at different water depths along the bathymetric transect were statistically distinct from each other and followed a bathymetric zonation pattern already described for HAUSGARTEN by Hoste et al. (2007) and Grzelak et al. (2017). However, in our study, station HG-IV did not group with the other stations in the lower bathyal and also station HG-VII did not group with the other abyssal stations. The relatively low density of nematodes at both stations (at station HG-VII due to the small sample size) seems to be the reason for this. Mean nematode densities varied considerably among the stations and between the bathymetric zones. In fact, we found the lowest nematode densities in intermediate water depths of about 2500 m – 3500 m in the lower bathyal zone and an increase in mean nematode densities in depths of about 4500 m – 5600 m in the abyssal zone, with the second to deepest station HG-VIII having higher mean nematode densities than the shallowest station HG-I (Table 1). Grzelak et al. (2017) found a more linear decrease of nematode abundances with water depth. The depressed nematode densities we found in the lower bathyal may be a result of the steep seafloor slope between stations HG-V and HG-VIII (Soltwedel et al., 2005). Turbidites on the slope would contribute to the physical disturbance of the upper sediment layers and the displacement of food to greater depths, thus also affecting nematode communities. Increased mean nematode densities at HG-IX in the Molloy Hole have been reported previously in several studies (Hoste et al., 2007; Górska et al., 2014; Grzelak et al., 2017). A more even distribution of genera in the upper and lower bathyal, combined with an increase of few dominant genera in the abyssal resulted in the bathymetric pattern among nematode diversity and composition into the three zones. In the abyssal, only Acantholaimus, Monhystrella, Amphimonhystera and Amphimonhystrella occurred with > 5% dominance and expressed a combined dominance of 69.39% (Supplementary Table 3). These genera are typical for abyssal depths (Vanreusel et al., 2010; Miljutin and Miljutina, 2016) and were also found by Grzelak et al. (2017) with increasing dominance in abyssal depths at HAUSGARTEN. Other typical deep-sea genera, such as Desmoscolex and Tricoma were dominant only on the slopes of the upper and lower bathyal. This was also reported by Grzelak et al. (2017), with such increased abundances of these genera typically found in areas with higher Chl a concentrations (Lins et al., 2015). Interestingly, the genera Microlaimus and Sabatieria were only dominant in the upper bathyal or at HG-IV in the lower bathyal respectively, which in Grzelak et al. (2017) were only among the top 10 dominant genera at HG-IV (but still below 5% dominance). The genera Thalassomonhystera and Halalaimus were only dominant in the lower bathyal, although both genera were also dominant at individual stations in the upper bathyal. Monhysteridae and Oxystominidae are commonly found in deep-sea and slope communities (Tietjen, 1989). Conspicuously, Theristus considered as a typical abyssal nematode (Soetaert and Heip, 1995; Grzelak et al., 2017) was not among the dominant genera at any station, even though other Xyalidae (Amphimonhystera, Amphimonhystrella) were found in high abundance in the abyssal zone. The variation in nematode density and dominance compared to Grzelak et al. (2017) may be explained by inter-annual variability in meiofaunal densities at HAUSGARTEN (Soltwedel et al., 2020). The variation in nematode community patterns along the bathymetric transect we found may also be related to small-scale heterogeneity in nematode distribution in connection with food availability the sediments (Gallucci et al., 2009; Hasemann and Soltwedel, 2011; Rosli et al., 2018; Soltwedel et al., 2020).
For the different diversity indices calculated, these fluctuations were not pronounced and followed a more unimodal trend with its peak at HG-III (EG(50), H’(log2)) and HG-IV (J’) in the upper and lower bathyal respectively (Table 2). This unimodality at intermediate water depths is comparable to findings from other meiobenthic studies of slope and deep-sea communities (e.g. Jensen, 1988; Boucher and Lambshead, 1995; Liao et al., 2020), although the change in diversity with depth is highly dependent on specific habitat conditions. In some cases, a more linear decrease in diversity with depth (Trebukhova et al., 2013; Grzelak et al., 2017), no correlation between diversity and depth (Danovaro et al., 2009; Armenteros et al., 2022) or even an increase in diversity with depth (dos Santos et al., 2020) have been reported. Hydrodynamic regimes at local scales that regulate the food availability for meiobenthos have been discussed as one of the drivers behind this phenomenon (dos Santos et al., 2020; Pereira et al., 2022). Apart from the more linear decline in diversity and the use of Hill diversity (Hill, 1973) instead of Shannon diversity by Grzelak et al. (2017), the magnitude of the decline of the different indices is comparable to our results. The expected number of genera for 50 individuals EG(50) in Grzelak et al. (2017) are with 23.4 ± 0.5 (upper bathyal), 19.8 ± 0.5 (lower bathyal) and 11.0 ± 3.6 (abyssal) almost identical to our EG(50) with 23.6 ± 1.5 (upper bathyal), 21.8 ± 1.1 (lower bathyal) and 13.2 ± 1.4 (abyssal). This indicates that the overall heterogeneity and number of genera in all depth zones, in contrast to nematode densities, did not change substantially between 2005 and 2010. We found the highest evenness with J’ = 0.88 ± 0.003 at HG-IV in the lower bathyal, and although we found low nematode densities at HG-IV, the high EG(50) of 22.6 ± 1.2 is indicative of a diverse nematode community. The decrease in all measured taxonomic diversity indices with depth is caused by the increase in dominance of Acantholaimus, Monhystrella, Amphimonhystera and Amphimonhystrella in the abyssal, indicating more favorable environmental conditions for these genera.
4.2 Trophic structure of the nematode communities in relation to environmental parameters
Considering the investigated functional descriptors, hypothesis 2 can be accepted. However, hypothesis 1 can be rejected for the trophic structure of the nematode communities [c-p values and tail shapes were not investigated by Grzelak et al. (2017)]. The increase in the ITD at the abyssal stations HG-VIII and HG-IX compared to the bathyal stations can be explained by an increase in the dominance of non-selective feeders and a decrease in epistrate feeders at these stations. In the year 2005, five years before the present study, Grzelak et al. (2017) investigated the nematode feeding types at the same stations along the bathymetric transect in HAUSGARTEN. Grzelak et al. (2017) also found an increase in the ITD at HG-VIII and HG-IX as well, that was caused by an increase in the dominance of epistrate feeding nematodes and a decrease of non-selective feeders. In general, comparing the relative abundances of feeding types across all stations, the bathymetric transect in the year 2005 is dominated by epistrate feeders (33.6%), slightly outnumbering selective deposit feeders (31.1%) (Grzelak et al., 2017). In the year 2010 (present study), non-selective deposit feeders (48.1%) and selective deposit feeders (27.3%) dominated. While the inter-annual variability and small-scale spatial heterogeneity of the nematode communities are also likely to have an effect on the trophic structure, another possible explanation for the change in feeding type composition could be related to a warm water anomaly (WWA) and its ecological consequences in the pelagic realm of HAUSGARTEN, which has been detected in the timeframe from 2005 to 2007 (Beszczynska-Möller et al., 2012). With water temperatures >3°C at a depth of 250 m throughout 2006 and increasing mean temperatures since summer 2009, following a short cooling period in 2008 (Beszczynska-Möller et al., 2012), the WWA had a significant impact on plankton composition, which can directly affect benthic meiofauna at great depths through bentho-pelagic coupling (Pape et al., 2013b; Lins et al., 2015; Zhulay et al., 2023). During the WWA, smaller sized zooplankton dominated in HAUSGARTEN, as indicated by smaller sized fecal pellets (Lalande et al., 2013). Phytoplankton composition shifted from a dominance of large diatoms to a dominance of small Phaeocystis, coccolithophores and other pico- and nanoplanktonic organisms (Bauerfeind et al., 2009; Lalande et al., 2013; Nöthig et al., 2015). Although Phaeocystis is mostly remineralized and predated by zooplankton in the upper water column (Riebesell et al., 1995), direct export of Phaeocystis to abyssal depths can be facilitated on short time scales by the forming of larger Phaeocystis agglomerations and ballasting with cryogenic gypsum derived from melting sea ice (Wollenburg et al., 2018). In addition, the hydrogels produced by Phaeocystis through exocytosis of mucopolysaccharides are a potential hotspot for bacteria (Alderkamp et al., 2007).
Bacterial degradation of sinking detritus is an important aspect of the bentho-pelagic coupling, with detritus acting as a vector for bacteria to the seafloor (Cho and Azam, 1988; Herndl and Reinthaler, 2013). In Antarctic waters, this bacterial degradation of detritus is the main pathway for food into benthic systems and may serve as a year-round ‘food bank’ for benthic organisms (Campanyà-Llovet et al., 2017). In one experimental setup, nematodes from polar deep seas preferred feeding on bacteria to feeding on fresh phytodetritus (Ingels et al., 2010) and another mesocosm experiment showed that the presence of microbial-feeding nematodes significantly reduced the microbial decomposition time of algal detritus (Rieper-Kirchner, 1989), highlighting the importance of microbial feeding for nematode communities. The observed changes in the bentho-pelagic coupling at HAUSGARTEN may explain the high relative abundances of both microbial feeding types in our study throughout the entire transect compared to the dominance of epistrate feeders in Grzelak et al. (2017). The shift towards the strong dominance of microbial feeders (1A & 1B) in the abyssal zone might be related to the high concentrations of PP, PL (indicative of living and dead microbial biomass) and C-org that we measured at HG-IX in Molloy Hole. However, TBN and FDA were low in the abyssal and PL, PP and FDA were not even significant parameters in the sequential tests of the DistLM, so their contribution to explaining the variation in nematode communities is rather small. Elevated PL, PP and C-org concentrations at HG-IX indicate a possible accumulation of organic matter and a slowed decomposition, as indicated by low TBN and FDA. As we did not measure C:N:P ratios, we cannot directly assess food quality. Food quality most likely influences feeding type diversity, as lower trophic groups show significant relationships with food quality and meiofauna in general seem to be more sensitive to food quality and quantity compared to bigger-sized faunal groups (Campanyà-Llovet et al., 2017). Low abundances of feeding type 2B ‘omnivores/predators’ are typical in deep-sea environments, as their active way of life is often very costly from an energy point of view (Bussau et al., 1995).
Nevertheless, with 65.6% of the fitted and 44.0% of the total variation, the DistLM (Figure 8) showed that a high proportion of the variability in nematode community composition along the HAUSGARTEN bathymetric transect is explained by the available food. Thus, we could accept hypothesis 3, but it has to be mentioned that 66.0% of the total variation in the community is not explained by our model, indicating that there are still forcing factors on the community that we have not accounted for. The DistLM also shows a bathymetric zonation comparable to the zonation based on the multivariate analyses of nematode abundance data. This suggests that the bathymetric zonation represents a gradient in the availability of different food sources.
4.3 C-p range of nematode communities at the bathymetric transect
Although the c-p scale was originally invented to address the recovery status of soil habitats (Bongers, 1990), it can also be applied to describe the successional status of deep-sea nematode communities (Gambi et al., 2003; Pape et al., 2013a; Gambi and Danovaro, 2016). The decrease in maturity index (MI) with increasing depth of the bathymetric zones indicates a shift from a more persister-dominated community in the upper bathyal to a more colonizer-dominated community in the abyssal, caused by an increase in dominance of c-p 2 and 3 nematodes and a decrease in c-p 4 nematodes with increasing depth (Figure 6; Supplementary Table 6). This is also conditionally related to the decrease in taxonomic diversity and genus dominance with increasing depth, resulting in increasing functional dominance of a few genera with the same c-p value. A possible explanation could be the higher concentrations of fresh phytodetritus in bathyal depths (Figure 7A) which indicate more stable habitat conditions and therefore could support diverse communities in more advanced successional stages. In contrast, the limited and patchy food supply at abyssal depths seems to favor a colonizing lifestyle. Decreasing MI values with depth have been reported by other studies (Gambi et al., 2003; Vanhove et al., 2004; Zeppilli et al., 2014; Liao et al., 2020) and more diverse feeding guilds, successional stages and tail shapes were found on slopes compared to adjacent canyon assemblages (Liao et al., 2020).
4.4 Nematode tail shape diversity
The increase in dominance of Acantholaimus and Amphimonhystera, combined with the decrease in dominance of Desmoscolex and Tricoma led to an increase of nematodes with conico-cylindrical tails and the decrease of nematodes with conical tails towards the abyssal zone (Figure 5). Acantholaimus is almost exclusively reported from fine, muddy sediments (Miljutin and Miljutina, 2016). With its long tail, Acantholaimus anchors itself to the sediment and follows a semi-sessile life strategy, allowing it to move through deep-sea sediments with narrow interstices (Riemann, 1974; Thistle and Sherman, 1985; Miljutin and Miljutina, 2016). The sediment with relatively high H2O content of about 60% we found at HG-IX (Figure 7H) seems to provide a favorable environment for nematodes with elongated conico-cylindrical tails and such a hemi-sessile lifestyle. Interestingly, the relative abundance of nematodes with long, filiform tails (mainly Monhystrella and Halalaimus) did not change significantly throughout the entire transect. In the upper bathyal zone at stations HG-I and HG-II, Comesomatidae (mainly Sabatieria) contribute most to the number of nematodes with clavate tails. The slight increase in dominance of clavate-tailed nematodes in the abyssal zone is the result of an increasing in dominances of Amphimonhystrella replacing Sabatieria with depth. Nematodes with short round tails were the least dominant at all stations and depth zones and showed a negative trend with increasing depth. Aegialoalaimus was the largest contributor to the short-round-tailed nematodes and was only among the dominant genera at HG-I. This pattern seems to be similar to that observed for the conical tails, where the upper bathyal seems to provide a better environment for nematodes with this lifestyle. Since the sediment H2O contents of HG-I, HG-II, and HG-IX are comparable it seems that the effect of sediment porosity on tail shape diversity plays a minor role and is outweighed by other factors, such as food availability, which is conditioned by water depth.
5 Conclusions
With our study we were able to confirm that the bathymetric transect in Fram Strait can be divided into three different depth zones based on nematode community structure and taxonomic diversity, which were already described in the previous studies of Grzelak et al. (2017). By examing the functional diversity, we were able to detect changes in the nematode community composition that would not be apparent by analyzing taxonomic diversity alone. Comparing the functional diversity, we found a change in the dominant feeding types along the HAUSGARTEN bathymetric transect, from a dominance of epistrate and selective deposit feeders reported by Grzelak et al. (2017), to a dominance of non-selective and selective deposit feeders in the present study. This change is particularly pronounced in the abyssal zone where nematodes with a colonizing, hemisessile lifestyle also dominate. We have shown that food is the main driver of variation in nematode communities in the different bathymetric zones. Food availability and quality along the transect may be related to changes in the plankton composition caused by a warm water anomaly and rising mean temperatures in the upper water column (Bauerfeind et al., 2009; Beszczynska-Möller et al., 2012; Lalande et al., 2013; Nöthig et al., 2015; Nöthig et al., 2020) and thus could have affected the trophic conditions of nematode communities through bentho-pelagic coupling. This possible link, however, needs further investigation, since there is a gap of about a year between the end of the anomaly and our sampling period. As we have found that colonizers with short generation times become more dominant in the abyssal zone and turnover rates of meiobenthic communities are high in general (Gerlach, 1971), more frequent and detailed investigations over longer time scales are needed to disentangle turnover effects from the effects of bentho-pelagic coupling and to unravel the other as yet undiscovered forcing factors on the nematode communities in deep-sea sediments.
Data availability statement
The original contributions presented in the study are included in the article/Supplementary Material. Further inquiries can be directed to the corresponding author.
Ethics statement
The manuscript presents research on animals that do not require ethical approval for their study.
Author contributions
JS: Writing – original draft, Investigation, Methodology. CH: Conceptualization, Investigation, Supervision, Writing – review & editing. VM: Investigation, Validation, Writing – review & editing. PA: Writing – review & editing, Supervision. TS: Conceptualization, Supervision, Writing – review & editing.
Funding
The author(s) declare financial support was received for the research, authorship, and/or publication of this article. JS was partly funded through the EU project INTAROS - INTegrated ARctic Observation System (grant agreement ID: 727890).
Acknowledgments
We want to gratefully acknowledge the captain and crew of RV POLARSTERN of the HAUSGARTEN expedition ARK-XXV/2 that took place in summer 2010. Anja Pappert and the FÖJs, who assisted with measuring environmental parameters, are also gratefully acknowledged. Sincere thanks also to Lilian Böhringer and Jennifer Dannheim for their help with QGIS and R. Finally, we would like to thank the two reviewers for their valuable comments on the manuscript, which have greatly improved its quality. We explicitly acknowledge the support by the Open Access Publication Funds of Alfred-Wegener-Institute Helmholtz-Centre for Polar and Marine Research.
Conflict of interest
The authors declare that the research was conducted in the absence of any commercial or financial relationships that could be construed as a potential conflict of interest.
Publisher’s note
All claims expressed in this article are solely those of the authors and do not necessarily represent those of their affiliated organizations, or those of the publisher, the editors and the reviewers. Any product that may be evaluated in this article, or claim that may be made by its manufacturer, is not guaranteed or endorsed by the publisher.
Supplementary material
The Supplementary Material for this article can be found online at: https://www.frontiersin.org/articles/10.3389/fmars.2023.1271447/full#supplementary-material
Supplementary Figure 1 | Cluster diagram for the results from a similarity profile test (SIMPROF) for group average linking based on Bray-Curtis similarities of nematode genera/communities at the HAUSGARTEN stations along the bathymetric transect. Solid black lines represent significant links. Dotted red lines represents non-significant links. Coloration of the station symbols match the groups at 62.53% similarity.
References
Alderkamp A.-C., Buma A. G. J., van Rijssel M. (2007). “The carbohydrates of Phaeocystis and their degradation in the microbial food web,” in Phaeocystis, Major Link in the Biogeochemical Cycling of Climate-Relevant Elements (Dordrecht: Springer Netherlands), 99–118.
Anderson M., Gorley R. N., Clarke K. R. (2008). Permanova+ for PRIMER: Guide to software and statistical methods (Plymouth, UK: Primer-E Limited).
Aphalo P. J. (2022). ggpmisc: Miscellaneous extensions to “ggplot2”. Available at: https://CRAN.R-project.org/package=ggpmisc.
Armenteros M., Quintanar-Retama O., Gracia A. (2022). Depth-related patterns and regional diversity of free-living nematodes in the deep-sea Southwestern Gulf of Mexico. Front. Mar. Sci. 9. doi: 10.3389/fmars.2022.1023996
Baldrighi E., Manini E. (2015). Deep-sea meiofauna and macrofauna diversity and functional diversity: are they related? Mar. Biodiversity 45, 469–488. doi: 10.1007/s12526-015-0333-9
Bauerfeind E., Nöthig E. M., Beszczynska A., Fahl K., Kaleschke L., Kreker K., et al. (2009). Particle sedimentation patterns in the eastern Fram Strait during 2000-2005: results from the Arctic long-term observatory HAUSGARTEN. Deep-Sea Res. Part I.: Oceanographic Res. Papers 56, 1471–1487. doi: 10.1016/j.dsr.2009.04.011
Beszczynska-Möller A., Fahrbach E., Schauer U., Hansen E. (2012). Variability in Atlantic water temperature and transport at the entrance to the Arctic Ocean 1997-2010. ICES J. Mar. Sci. 69, 852–863. doi: 10.1093/icesjms/fss056
Boetius A., Ravenschlag K., Schubert C. J., Rickert D., Widdel F., Gleseke A., et al. (2000). A marine microbial consortium apparently mediating anaerobic oxidation of methane. Nature 407, 623–626. doi: 10.1038/35036572
Bongers T. (1990). The maturity index: an ecological measure of environmental disturbance based on nematode species composition. Oecologia 83, 14–19. doi: 10.1007/BF00324627/METRICS
Bongers T., Alkemade R., Yeates G. W. (1991). Interpretation of disturbance-induced maturity decrease in marine nematode assemblages by means of the Maturity Index. Mar. Ecol. Prog. Ser., 135–142. doi: 10.3354/meps076135
Bongers T., Bongers M. (1998). Functional diversity of nematodes. Appl. Soil Ecol. 10, 239–251. doi: 10.1016/S0929-1393(98)00123-1
Bongers T., De Goede R. G. M., Korthals G. W., Yeates G. W. (1995). Proposed changes of cp classification for nematodes. Russian J. Nematol. 3, 61–62.
Boucher G., Lambshead P. J. D. (1995). Ecological biodiversity of marine nematodes in samples from temperate, tropical, and deep-sea regions. Conserv. Biol. 9, 1594–1604. doi: 10.1046/J.1523-1739.1995.09061594.X
Buesseler K. O., Lamborg C. H., Boyd P. W., Lam P. J., Trull T. W., Bidigare R. R., et al. (2007). Revisiting carbon flux through the ocean’s twilight zone. Science 316, 567–570. doi: 10.1126/science.1137959
Bussau C., Schriever G., Thiel H. (1995). Evaluation of abyssal metazoan meiofauna from a manganese nodule area of the eastern South Pacific. Vie Milieu/Life Environ. 45 (1), 39–48.
Campanyà-Llovet N., Snelgrove P. V. R., Parrish C. C. (2017). Rethinking the importance of food quality in marine benthic food webs. Prog. Oceanography 156, 240–251. doi: 10.1016/j.pocean.2017.07.006
Cho B. C., Azam F. (1988). Major role of bacteria in biogeochemical fluxes in the ocean’s interior. Nature 332, 441–443. doi: 10.1038/332441a0
Clarke K. R., Gorley R. N. (2006). PRIMER v6: User Manual/Tutorial. Plymouth Routines in Multivariate Ecological Research. (Plymouth, UK: PRIMER-E Limited).
Clarke K. R., Somerfield P. J., Gorley R. N. (2008). Testing of null hypotheses in exploratory community analyses: similarity profiles and biota-environment linkage. J. Exp. Mar. Biol. Ecol. 366, 56–69. doi: 10.1016/J.JEMBE.2008.07.009
Clarke K. R., Warwick R. M. (2001). Change in marine communities: An approach to statistical analysis and interpretation, 2nd edition. (Plymouth, UK: PRIMER-E Limited).
Danovaro R., Bianchelli S., Gambi C., Mea M., Zeppilli D. (2009). α-, β-, γ-, δ- and ϵ-diversity of deep-sea nematodes in canyons and open slopes of Northeast Atlantic and Mediterranean margins. Mar. Ecol. Prog. Ser. 396, 197–209. doi: 10.3354/MEPS08269
Danovaro R., Carugati L., Corinaldesi C., Gambi C., Guilini K., Pusceddu A., et al. (2013). Multiple spatial scale analyses provide new clues on patterns and drivers of deep-sea nematode diversity. Deep Sea Res. Part II: Topical Stud. Oceanography 92, 97–106. doi: 10.1016/J.DSR2.2013.03.035
Danovaro R., Tselepides A., Otegui A., Della Croce N. (2000). Dynamics of meiofaunal assemblages on the continental shelf and deep-sea sediments of the Cretan Sea (NE Mediterranean): relationships with seasonal changes in food supply. Prog. Oceanography 46, 367–400. doi: 10.1016/S0079-6611(00)00026-4
dos Santos G. A. P., Silva A. C., Esteves A. M., Ribeiro-Ferreira V. P., Patricia. F., Valdes Y., et al. (2020). Testing bathymetric and regional patterns in the southwest Atlantic deep sea using infaunal diversity, structure, and function. Diversity 12, 485. doi: 10.3390/d12120485
Findlay R. H., King G. M., Watling L. (1989). Efficacy of phospholipid analysis in determining microbial biomass in sediments. Appl. Environ. Microbiol. 55, 2888–2893. doi: 10.1128/aem.55.11.2888-2893.1989
Fonseca G., Soltwedel T. (2007). Deep-sea meiobenthic communities underneath the marginal ice zone off Eastern Greenland. Polar Biol. 30, 607–618. doi: 10.1007/S00300-006-0220-8/FIGURES/6
Gallucci F., Moens T., Fonseca G. (2009). Small-scale spatial patterns of meiobenthos in the Arctic deep sea. Mar. Biodiversity 39, 9–25. doi: 10.1007/s12526-009-0003-x
Gambi C., Danovaro R. (2016). Biodiversity and life strategies of deep-sea meiofauna and nematode assemblages in the Whittard Canyon (Celtic margin, NE Atlantic Ocean). Deep Sea Res. Part I.: Oceanographic Res. Papers 108, 13–22. doi: 10.1016/j.dsr.2015.12.001
Gambi C., Pusceddu A., Benedetti-Cecchi L., Danovaro R. (2014). Species richness, species turnover and functional diversity in nematodes of the deep Mediterranean Sea: Searching for drivers at different spatial scales. Global Ecol. Biogeography 23, 24–39. doi: 10.1111/GEB.12094/SUPPINFO
Gambi C., Vanreusel A., Danovaro R. (2003). Biodiversity of nematode assemblages from deep-sea sediments of the Atacama Slope and Trench (South Pacific Ocean). Deep-Sea Res. Part I.: Oceanographic Res. Papers 50, 103–117. doi: 10.1016/S0967-0637(02)00143-7
Garnier S., Ross N., Rudis R., Camargo P. A., Sciaini M., Scherer C. (2021). viridis - Colorblind-friendly color maps for R. doi: 10.5281/zenodo.4679424
Gerlach S. A. (1971). On the importance of marine meiofauna for benthos communities. Oecologia 6, 176–190. doi: 10.1007/BF00345719
Górska B., Grzelak K., Kotwicki L., Hasemann C., Schewe I., Soltwedel T., et al. (2014). Bathymetric variations in vertical distribution patterns of meiofauna in the surface sediments of the deep Arctic ocean (HAUSGARTEN, Fram Strait). Deep-Sea Res. Part I.: Oceanographic Res. Papers 91, 36–49. doi: 10.1016/j.dsr.2014.05.010
Greiser N., Faubel A. (1988). “6. Biotic factors,” in Introduction to the study of meiofauna. Eds. Higgins R. P., Thiel H. (Washington D.C., London: Smithsonian Institution Press), 79–144.
Grzelak K., Kotwicki L., Hasemann C., Soltwedel T. (2017). Bathymetric patterns in standing stock and diversity of deep-sea nematodes at the long-term ecological research observatory HAUSGARTEN (Fram Strait). J. Mar. Syst. 172, 160–177. doi: 10.1016/j.jmarsys.2017.02.003
Hasemann C., Soltwedel T. (2011). Small-scale heterogeneity in deep-sea nematode communities around biogenic structures. PloS One 6, 1–13. doi: 10.1371/JOURNAL.PONE.0029152
Heip C., Vincx M., Vranken G. (1985). “The ecology of marine nematodes”, in: Oceanography and Marine Biology: An Annual Review. Eds. Barnes H. B., Barnes M.. (Aberdeen: Aberdeen University Press) 23, 399–489.
Herndl G. J., Reinthaler T. (2013). Microbial control of the dark end of the biological pump. Nat. Geosci. 6, 718–724. doi: 10.1038/ngeo1921
Hill M. O. (1973). Diversity and evenness: A unifying notation and its consequences. Ecology 54, 427–432. doi: 10.2307/1934352
Hodda M. (2022). Phylum Nematoda: Feeding habits for all valid genera using a new, universal scheme encompassing the entire phylum, with descriptions of morphological characteristics of the stoma, a key, and discussion of the evidence for trophic relationships. Zootaxa 5114, 318–451. doi: 10.11646/zootaxa.5114.1.3
Holm-Hansen O., Lorenzen C. J., Holmes R. W., Strickland J. D. H. (1965). Fluorometric determination of chlorophyll. ICES J. Mar. Sci. 30, 3–15. doi: 10.1093/ICESJMS/30.1.3
Holovachov O., Boström S. (2018). Neodiplopeltula gen. nov. from the west coast of Sweden and reappraisal of the genus Diplopeltula Gerlach, 1950 (Nematoda, Diplopeltidae). Eur. J. Taxonomy. 458. doi: 10.5852/ejt.2018.458
Hoste E., Vanhove S., Schewe I., Soltwedel T., Vanreusel A. (2007). Spatial and temporal variations in deep-sea meiofauna assemblages in the Marginal Ice Zone of the Arctic Ocean. Deep Sea Res. Part I.: Oceanographic Res. Papers 54, 109–129. doi: 10.1016/J.DSR.2006.09.007
Hoving H.-J., Boetius A., Dunlop K., Greinert J., Haeckel M., Jones D. O. B., et al. (2023). Major fine-scale spatial heterogeneity in accumulation of gelatinous carbon fluxes on the deep seabed. Front. Mar. Sci. 10. doi: 10.3389/fmars.2023.1192242
Hurlbert S. H. (1971). The nonconcept of species diversity: A critique and alternative parameters. Ecology 52, 577–586. doi: 10.2307/1934145
Ingels J., Van Den Driessche P., De Mesel I., Vanhove S., Moens T., Vanreusel A. (2010). Preferred use of bacteria over phytoplankton by deep-sea nematodes in polar regions. Mar. Ecol. Prog. Ser. 406, 121–133. doi: 10.3354/meps08535
Jensen P. (1988). Nematode assemblages in the deep-sea benthos of the Norwegian Sea. Deep Sea Res. Part A. Oceanographic Res. Papers 35, 1173–1184. doi: 10.1016/0198-0149(88)90008-8
Kassambara A. (2023). ggpubr: “ggplot2” based publication ready plots. Available at: https://CRAN.R-project.org/package=ggpubr.
Kirsten W. J. (1979). Automatic methods for the simultaneous determination of carbon, hydrogen, nitrogen, and sulfur, and for sulfur alone in organic and inorganic materials. Analytical Chem. 51, 1173–1179. doi: 10.1021/ac50044a019
Klenke M., Schenke H. W. (2002). A new bathymetric model for the central Fram Strait. Mar. Geophysical Res. 23, 367–378. doi: 10.1023/A:1025764206736
Knust R. (2017). Polar research and supply vessel POLARSTERN operated by the alfred-wegener-institute. J. Large-scale Res. Facilities 3, 1–8. doi: 10.17815/jlsrf-3-163
Köster M., Jensen P., Meyer-Reil L.-A. (1991). “Hydrolytic activities of organisms and biogenic structures in deep-sea sediments,” in Microbial Enzymes in Aquatic Environments. Ed. Chróst R. J. (New York: Brock/Springer Series in Contemporary Bioscience), 298–310.
Kruskal W. H., Wallis W. A. (1952). Use of ranks in one-criterion variance analysis. J. Am. Stat. Assoc. 47, 583–621. doi: 10.1080/01621459.1952.10483441
Lalande C., Bauerfeind E., Nöthig E. M., Beszczynska-Möller A. (2013). Impact of a warm anomaly on export fluxes of biogenic matter in the eastern Fram Strait. Prog. Oceanography 109, 70–77. doi: 10.1016/j.pocean.2012.09.006
Leduc D., Probert P. K. (2009). The effect of bacterivorous nematodes on detritus incorporation by macrofaunal detritivores: A study using stable isotope and fatty acid analyses. J. Exp. Mar. Biol. Ecol. 371, 130–139. doi: 10.1016/J.JEMBE.2009.01.011
Leduc D., Rowden A. A., Nodder S. D., Berkenbusch K., Probert P. K., Hadfield M. G. (2014). Unusually high food availability in Kaikoura Canyon linked to distinct deep-sea nematode community. Deep Sea Res. Part II: Topical Stud. Oceanography 104, 310–318. doi: 10.1016/J.DSR2.2013.06.003
Liao J. X., Wei C. L., Yasuhara M. (2020). Species and functional diversity of deep-sea nematodes in a high energy submarine canyon. Front. Mar. Sci. 7, 520186. doi: 10.3389/FMARS.2020.00591/BIBTEX
Lins L., da Silva M. C., Hauquier F., Esteves A. M., Vanreusel A. (2015). Nematode community composition and feeding shaped by contrasting productivity regimes in the Southern Ocean. Prog. Oceanography 134, 356–369. doi: 10.1016/j.pocean.2015.03.006
Longhurst A. (1995). Seasonal cycles of pelagic production and consumption. Prog. Oceanography 36, 77–167. doi: 10.1016/0079-6611(95)00015-1
McClain C. R., Barry J. P. (2010). Habitat heterogeneity, disturbance, and productivity work in concert to regulate biodiversity in deep submarine canyons. Ecology 91, 964–976. doi: 10.1890/09-0087.1
McClain C. R., Rex M. A. (2015). Toward a conceptual understanding of β-diversity in the deep-sea benthos. Annu. Rev. Ecol. Evol. Syst. 46, 623–642. doi: 10.1146/ANNUREV-ECOLSYS-120213-091640
Miljutin D. M., Miljutina M. A. (2016). Review of acantholaimus allgén 1933 (Nematoda: Chromadoridae), a genus of marine free-living nematodes, with a tabular key to species. Nematology 18, 537–558. doi: 10.1163/15685411-00002976
Moens T., Braeckman U., Derycke S., Fonseca G., Gallucci F., Gingold R., et al. (2014). “Ecology of free-living marine nematodes,” in Handbook of Zoology. Gastrotricha, Cycloneuralia and Gnathifera. Ed. Schmidt-Rhaesa A. (Berlin, Boston: De Gruyter), 109–152.
Mokievsky V. O., Udalov A. A., Azovsky A. I. (2007). Quantitative distribution of meiobenthos in deep-water zones of the World Ocean. Oceanology 47, 797–813. doi: 10.1134/S0001437007060057/METRICS
Nemys Eds (2023). Nemys: World Database of Nematodes. Available at: https://nemys.ugent.be (Accessed 2023-05-02).
Nöthig E.-M., Bracher A., Engel A., Metfies K., Niehoff B., Peeken I., et al. (2015). Summertime plankton ecology in Fram Strait - a compilation of long- and short-term observations. Polar Res. 34. doi: 10.3402/polar.v34.23349
Nöthig E.-M., Ramondenc S., Haas A., Hehemann L., Walter A., Bracher A., et al. (2020). Summertime chlorophyll a and particulate organic carbon standing stocks in surface waters of the Fram Strait and the Arctic Ocean, (1991–2015). Front. Mar. Sci. 7. doi: 10.3389/fmars.2020.00350
Pape E., Bezerra T. N., Jones D. O. B., Vanreusel A. (2013a). Unravelling the environmental drivers of deep-sea nematode biodiversity and its relation with carbon mineralisation along a longitudinal primary productivity gradient. Biogeosciences 10, 3127–3143. doi: 10.5194/bg-10-3127-2013
Pape E., Jones D. O. B., Manini E., Bezerra T. N., Vanreusel A. (2013b). Benthic-pelagic coupling: effects on nematode communities along southern European continental margins. PloS One 8, 59954. doi: 10.1371/journal.pone.0059954
Pape E., van Oevelen D., Moodley L., Soetaert K., Vanreusel A. (2013c). Nematode feeding strategies and the fate of dissolved organic matter carbon in different deep-sea sedimentary environments. Deep-Sea Res. Part I.: Oceanographic Res. Papers 80, 94–110. doi: 10.1016/j.dsr.2013.05.018
Pereira T. J., Castellões P. V., Netto S. A. (2022). Amazon River discharge impacts deep-sea meiofauna. Limnol. Oceanography 67, 2190–2203. doi: 10.1002/lno.12197
Pfannkuche O., Thiel H. (1988). “9. Sample processing,” in Introduction to the study of meiofauna. Eds. Higgins R. P., Thiel H. (Washington D.C., London: Smithsonian Institution Press), 134–145.
Pielou E. C. (1966). The measurement of diversity in different types of biological collections. J. Theor. Biol. 13, 131–144. doi: 10.1016/0022-5193(66)90013-0
Platt H. M., Warwick R. M. (1983). Free-living Marine Nematodes. Part I: British Enoplids. Pictorial key to world genera and notes for the identification of British species. Eds. Kermack D. M., Barnes R. S. K. (Cambridge, London, New York, New Rochelle, Melbourne, Sydney: Cambridge University press, for the Linnean Society of London and the estuarine and brackish-water sciences association).
Platt H. M., Warwick R. M. (1988). Free living Marine Nematodes. Part II: British Chromadorids. Pictorial key to world genera and notes for identification of British species. Eds. Kermack D. M., Barnes Leiden R. S. K. (New York, København, Köln: Cambridge University press, for the Linnean Society of London and the estuarine and brackish-water sciences association).
Posit team (2023). RStudio: Integrated development environment for R. Available at: http://www.posit.co/ (Accessed August 23, 2023).
QGIS Development Team (2009). QGIS Geographic Information System. Available at: http://qgis.osgeo.org.
R Core Team (2022). R: A language and environment for statistical computing. Available at: https://www.R-project.org/.
Rex M. A., Etter R. J., Morris J. S., Crouse J., McClain C. R., Johnson N. A., et al. (2006). Global bathymetric patterns of standing stock and body size in the deep-sea benthos. Mar. Ecol. Prog. Ser. 317, 1–8. doi: 10.3354/MEPS317001
Riebesell U., Reigstad M., Wassmann P., Noji T., Passow U. (1995). On the trophic fate of Phaeocystis pouchetii (hariot): VI. Significance of Phaeocystis-derived mucus for vertical flux. Netherlands J. Sea Res. 33, 193–203. doi: 10.1016/0077-7579(95)90006-3
Riemann F. (1974). On hemisessile nematodes with flagelliform tails living in marine soft bottoms and on micro-tubes found in deep sea sediments. Mikrofauna Meeresboden 40, 1–15.
Rieper-Kirchner M. (1989). Microbial degradation of North Sea macroalgae: Field and laboratory studies. Botanica Marina 32, 241–252. doi: 10.1515/botm.1989.32.3.241
Rosli N., Leduc D., Rowden A. A., Probert P. K., Clark M. R. (2018). Regional and sediment depth differences in nematode community structure greater than between habitats on the New Zealand margin: Implications for vulnerability to anthropogenic disturbance. Prog. Oceanography 160, 26–52. doi: 10.1016/J.POCEAN.2017.11.006
Rudis B. (2020). hrbrthemes: Additional themes, theme components and utilities for “ggplot2”. Available at: https://CRAN.R-project.org/package=hrbrthemes.
Sanders H. L. (1968). Marine benthic diversity: A comparative study. Am. Nat. 102, 243–282. doi: 10.1086/282541
Schmidt-Rhaesa A. (2014). Handbook of Zoology. Gastrotricha, Cycloneuralia and Gnathifera. Ed. Schmidt-Rhaesa A. (Berlin, Boston: De Gruyter).
Schmidt-Rhaesa A. (2020). Guide to the identification of marine meiofauna (München: Verlag Dr. Friedrich Pfeil).
Semprucci F., Grassi E., Balsamo M. (2022). Simple is the best: An alternative method for the analysis of free-living nematode assemblage structure. Water 14, 1114. doi: 10.3390/w14071114
Shannon C. E. (1948). A mathematical theory of communication. Bell Syst. Tech. J. 27, 379–423. doi: 10.1002/j.1538-7305.1948.tb01338.x
Shatova O., Koweek D., Conte M. H., Weber J. C. (2012). Contribution of zooplankton fecal pellets to deep ocean particle flux in the Sargasso Sea assessed using quantitative image analysis. J. Plankton Res. 34, 905–921. doi: 10.1093/PLANKT/FBS053
Smith W. O. Jr (1987). Phytoplankton dynamics in marginal ice zones. Oceanography Mar. Biol. 25, 11–38.
Smith C. R., De Leo F. C., Bernardino A. F., Sweetman A. K., Arbizu P. M. (2008). Abyssal food limitation, ecosystem structure and climate change. Trends Ecol. Evol. 23, 518–528. doi: 10.1016/j.tree.2008.05.002
Soetaert K., Heip C. (1995). Nematode assemblages of deep-sea and shelf break sites in the North Atlantic and Mediterranean Sea. Mar. Ecol. Prog. Ser. 125, 171–183. doi: 10.3354/meps125171
Soltwedel T. (2000). Metazoan meiobenthos along continental margins: A review. Prog. Oceanography 46, 59–84. doi: 10.1016/S0079-6611(00)00030-6
Soltwedel T. (2010). The expedition of the research vessel “Polarstern” to the arctic in 2010 (ARK-XXV/2). Berichte zur Polar- und Meeresforschung (Reports on Polar and Marine Research) 624, 1–107. doi: 10.2312/BzPM_0624_2010
Soltwedel T., Bauerfeind E., Bergmann M., Bracher A., Budaeva N., Busch K., et al. (2016). Natural variability or anthropogenically-induced variation? Insights from 15 years of multidisciplinary observations at the Arctic marine LTER site HAUSGARTEN. Ecol. Indic. 65, 89–102. doi: 10.1016/j.ecolind.2015.10.001
Soltwedel T., Bauerfeind E., Bergmann M., Budaeva N., Hoste E., Jaeckisch N., et al. (2005). HAUSGARTEN: Multidisciplinary investigations at a deep-sea, long-term observatory in the Arctic Ocean. Oceanography 18, 46–61. doi: 10.5670/oceanog.2005.24
Soltwedel T., Grzelak K., Hasemann C. (2020). Spatial and temporal variation in deep-sea meiofauna at the LTER observatory HAUSGARTEN in the Fram Strait (Arctic Ocean). Diversity 12. doi: 10.3390/d12070279
Soltwedel T., Guilini K., Sauter E., Schewe I., Hasemann C. (2018). Local effects of large food-falls on nematode diversity at an arctic deep-sea site: Results from an in situ experiment at the deep-sea observatory HAUSGARTEN. J. Exp. Mar. Biol. Ecol. 502, 129–141. doi: 10.1016/j.jembe.2017.03.002
Strugger S. (1948). Fluorescence microscope examination of bacteria in soil. Can. J. Res. 26, 188–193. doi: 10.1139/cjr48c-019
Thiel H. (1978). “Benthos in upwelling regions,” in Upwelling Ecosystems. Eds. Boje R., Tomczak M. (Berlin: Springer Verlag), 124–138.
Thistle D., Lambshead P. D., Sherman K. M. (1995). Nematode tail-shape groups respond to environmental differences in the deep sea. Vie Milieu/Life Environ. 45 (2), 107–115.
Thistle D., Sherman K. M. (1985). The nematode fauna of a deep-sea site exposed to strong near-bottom currents. Deep Sea Res. Part A. Oceanographic Res. Papers 32, 1077–1088. doi: 10.1016/0198-0149(85)90063-9
Thurber A. R., Sweetman A. K., Narayanaswamy B. E., Jones D. O. B., Ingels J., Hansman R. L. (2014). Ecosystem function and services provided by the deep sea. Biogeosciences 11, 3941–3963. doi: 10.5194/bg-11-3941-2014
Tietjen J. H. (1989). Ecology of deep-sea nematodes from the Puerto Rico trench area and Hatteras Abyssal plain. Deep Sea Res. Part A. Oceanographic Res. Papers 36, 1579–1594. doi: 10.1016/0198-0149(89)90059-9
Trebukhova Y. A., Miljutin D. M., Pavlyuk O. N., Mar’yash A. A., Brenke N. (2013). Changes in deep-sea metazoan meiobenthic communities and nematode assemblages along a depth gradient (North-western Sea of Japan, Pacific). Deep-Sea Res. Part II: Topical Stud. Oceanography 86–87, 56–65. doi: 10.1016/j.dsr2.2012.08.015
Tyler P. A., Baker M., Ramirez-Llodra E. (2016). “Deep-sea benthic habitats,” in Biological Sampling in the Deep Sea. Eds. Clark M. R., Consalvey M., Rowden A. A. (Chichester, UK: John Wiley & Sons, Ltd), 1–15.
Vanaverbeke J., Soetaert K., Heip C., Vanreusel A. (1997). The metazoan meiobenthos along the continental slope of the Goban Spur (NE Atlantic). J. Sea Res. 38, 93–107. doi: 10.1016/S1385-1101(97)00038-5
Van Gaever S., Moodley L., De Beer D., Vanreusel A. (2006). Meiobenthos at the Arctic Håkon Mosby Mud Volcano, with a parental-caring nematode thriving in sulphide-rich sediments. Mar. Ecol. Prog. Ser. 321, 143–155. doi: 10.3354/MEPS321143
Vanhove S., Vermeeren H., Vanreusel A. (2004). Meiofauna towards the South Sandwich Trench (750-6300 m), focus on nematodes. Deep-Sea Res. Part II: Topical Stud. Oceanography 51, 1665–1687. doi: 10.1016/J.DSR2.2004.06.029
Vanreusel A., Fonseca G., Danovaro R., Da Silva M. C., Esteves A. M., Ferrero T., et al. (2010). The contribution of deep-sea macrohabitat heterogeneity to global nematode diversity. Mar. Ecol. 31, 6–20. doi: 10.1111/J.1439-0485.2009.00352.X
Warwick R. M., Platt H. M., Somerfield P. J. (1998). Free-living Marine Nematodes. Part III: Monhysterids. Pictorial key to world genera and notes for the identification of British species. Eds. Barnes R. S. K., Crothers J. H. (Shrewsbury: The Linnean Society of London and the Estuarine and Coastal Sciences Association).
Wickham H. (2016). ggplot2: Elegant graphics for data analysis (New York: Springer-Verlag). Available at: https://ggplot2.tidyverse.org.
Wickham H. (2023). forcats: Tools for working with categorical variables (factors) (Available at: https://CRAN.R-project.org/package=forcats).
Wickham H., Henry L., Pedersen T. L., Luciani T. J., Decorde M., Lise V. (2023). svglite: An “SVG” graphics device. Available at: https://CRAN.R-project.org/package=svglite.
Wieser W. (1953). Die Beziehungen zwischen Mundhöhlengestalt, Ernährungsweise und Vorkommen bei freilebenden marinen Nematoden. Arkiv För Zoologi 4, 439–484.
Wollenburg J. E., Katlein C., Nehrke G., Nöthig E. M., Matthiessen J., Wolf-Gladrow D. A., et al. (2018). Ballasting by cryogenic gypsum enhances carbon export in a Phaeocystis under-ice bloom. Sci. Rep. 8. doi: 10.1038/s41598-018-26016-0
Woolley S. N. C., Tittensor D. P., Dunstan P. K., Guillera-Arroita G., Lahoz-Monfort J. J., Wintle B. A., et al. (2016). Deep-sea diversity patterns are shaped by energy availability. Nature 533, 393–396. doi: 10.1038/nature17937
Yentsch C. S. (1967). “The measurement of chloroplastic pigments - thirty years of progress?”, in Chemical Environment in the Aquatic Habitat. Eds. Golterman H. C., Clymo R. S. (Amsterdam: North-Holland), 225–270.
Yentsch C. S., Menzel D. W. (1963). A method for the determination of phytoplankton chlorophyll and phaeophytin by fluorescence. Deep Sea Research and Oceanographic Abstracts 10 (3), 221–231. doi: 10.1016/0011-7471(63)90358-9
Zeppilli D., Bongiorni L., Serrão Santos R., Vanreusel A. (2014). Changes in nematode communities in different physiographic sites of the Condor Seamount (North-East Atlantic Ocean) and adjacent sediments. PloS One 9, e115601. doi: 10.1371/journal.pone.0115601
Keywords: meiofauna, benthos, Fram Strait, deep sea, LTER HAUSGARTEN, time series, bentho-pelagic coupling, ocean warming
Citation: Schnier J, Hasemann C, Mokievsky V, Martínez Arbizu P and Soltwedel T (2023) Nematode communities along a bathymetric transect in the deep eastern Fram Strait (Arctic Ocean): interrelations between diversity, function and environment. Front. Mar. Sci. 10:1271447. doi: 10.3389/fmars.2023.1271447
Received: 02 August 2023; Accepted: 15 November 2023;
Published: 08 December 2023.
Edited by:
Ana Colaço, University of the Azores, PortugalReviewed by:
Bodil Annikki Bluhm, UiT The Arctic University of Norway, NorwayElisa Baldrighi, University of Nevada, Reno, United States
Copyright © 2023 Schnier, Hasemann, Mokievsky, Martínez Arbizu and Soltwedel. This is an open-access article distributed under the terms of the Creative Commons Attribution License (CC BY). The use, distribution or reproduction in other forums is permitted, provided the original author(s) and the copyright owner(s) are credited and that the original publication in this journal is cited, in accordance with accepted academic practice. No use, distribution or reproduction is permitted which does not comply with these terms.
*Correspondence: Jannik Schnier, jannik.schnier@awi.de