From coastal geomorphometry to virtual environments
 Felix Gross1,2*†
  Lennart Petersen1,3
  Carolin Wallmeier1,2
  Rachel Barrett2†
  Tom Kwasnitschka4†
  Svenja Karstens1,2
- 1Kiel University, Center for Ocean and Society, Neufeldtstr., Kiel, Germany
- 2Kiel University, Marine Geophysics and Hydroacoustics, Institute of Geosciences, Olshausenstr., Kiel, Germany
- 3Kiel University, Department of Computer Science, Christian-Albrechts-Platz, Kiel, Germany
- 4GEOMAR Helmholtz Centre for Ocean Research Kiel, Wischhofstraße, Kiel, Germany
Communicating environmental change and mitigation scenarios to stakeholders and decision-makers can be challenging. Immersive environments offer an innovative approach for knowledge transfer, allowing science-based scenarios to be discussed interactively. The use of such environments is particularly helpful for the analysis of large, multi-component geospatial datasets, as commonly employed in the classification of ecosystems. Virtual environments can play an important role in conveying and discussing the findings gathered from these geomorphometric datasets. However, textured meshes and point clouds are not always well suited for direct import to a virtual reality or the creation of a truly immersive environment, and often result in geometrical artifacts, which can be misinterpreted during the import to a game engine. Such technical hurdles may lead to viewers rejecting the experience altogether, failing to achieve a higher educational purpose. In this study, we apply an asset-based approach to create an immersive virtual representation of a coastal environment. The focus hereby is on the coastal vegetation and changes in species distribution, which could potentially be triggered by the impact of climate change. We present an easy-to-use blueprint for the game engine EPIC Unreal Engine 5. In contrast to traditional virtual reality environments, which use static textured mesh data derived from photogrammetry, this asset-based approach enables the use of dynamic and physical properties (e.g. vegetation moving due to wind or waves), which makes the virtual environment more immersive. This will help to stimulate understanding and discussion amongst different stakeholders, and will also help to foster inclusion in earth- and environmental science education.
1 Introduction
Effective spatial management is key for sustainable development and conservation of resources, ecosystems at risk, and sensitive habitats. Miscommunication between academic researchers and decision makers, however, often prevents or delays implementation of knowledge-based solutions. Overcoming this hurdle requires new approaches for visualizing, communicating, and implementing management strategies. Virtual reality and virtual environments are already commonly used for evaluation and decision-making processes after disasters (Lu et al., 2020). It has been shown that the training effect in response scenarios was significantly increased by the use of virtual reality, and especially the use of head-mounted displays (Buttussi and Chittaro, 2018). The use of virtual environments in combination with virtual reality technology may be a key educational method within earth system sciences to bring remote- and cost-intensive-to-reach environments like geological outcrops into the classroom (Harknett et al., 2022). Nevertheless, while virtual field trips within virtual environments may improve the preparation for real-life experiences (Arrowsmith et al., 2005), they are not perceived as a replacement for real field trips (Spicer & Stratford, 2001; Bond and Cawood, 2021)
An immersive environment can be achieved by means of virtual (VR), augmented (AR) or mixed (XR) reality systems, and creates an accessible way to discuss and manipulate virtual scenario representations with experts and policy-makers, as well as with the general public. The basis for any virtual environment is the creation of immersive virtual worlds, which aim to be as close to the “real world” as possible. In this process, the terms “digital twin” and “metaverse” are often used in different communities, including design, engineering, natural- and computer sciences, but also in human and social sciences. While a “digital twin”, a term that is still in discussion and not always clearly defined (VanDerHorn and Mahadevan, 2021), aims to mirror an existing item or environment with all relevant physical properties and facets, the “metaverse” is a post-reality, multi-user environment, which merges physical reality with digital virtuality (Mystakidis, 2022), and does not necessarily mimic the “real world”. Studies on virtual environments and their uses also highlight the need for storytelling within these virtual instances; the best visualization is useless without a guiding line through the virtual environment.
Computer Game engines like EPIC Unreal Engine (UE) and Unity Technologies Unity are becoming an essential tool for building digital twins and virtual instances. Game engines, which provide graphical and physical properties to a user, enable even less experienced game designers and scientists to build their own games, models and virtual environments (Herwig and Paar, 2002; Calisi and Botta, 2022). As they are designed for cross-platform usage, the implementation of VR devices like head-mounted displays is guaranteed via built-in engine interfaces and is hence also applicable for less experienced users.
Most VR and XR visualizations in science communication are found outside geo- and environmental science, even though VR and XR have the power to overcome the abstract nature of issues like climate change or complex geological systems, and turn them into realistic, spatially explicit experiences (Sheppard, 2012; Swetnam and Korenko, 2019; Huang et al., 2021; Harknett et al., 2022). Vegetated coastal systems are multi-functional and provide various habitats, sequester carbon, dissipate wave energy, and buffer nutrients (e.g., Reddy and DeLaune, 2008; Karstens et al., 2015; Jurasinski et al., 2018; Heckwolf et al., 2021; Buczko et al., 2022). Climate change will impact vegetation patterns and species distribution in the dynamic coastal zone around the globe. While sea level rise might have the largest impact through influencing inundation and salinity regimes, drivers like temperature, rainfall, and the frequency of extreme events will also shape vegetation growth and distribution in coastal landscapes in the years to come (Osland et al., 2016). Communicating climate-induced environmental changes to stakeholders and decision makers can be challenging, and traditional materials such as graphs, maps or photos are often not sufficient to bridge the gap (Huang et al., 2021).
Widely used geomorphometric analysis and visualization techniques, such as photogrammetry and structure-from-motion approaches, typically aim to create performant 3D models and virtual environments of urban and industrial areas (Toschi et al., 2017; Huo et al., 2021) or exact representations of a spatially confined, complex geological scenes (e.g. Harknett et al., 2022). In contrast, open world environments, such as a coastal landscape, are often characterized by numerous individual plants and textures, which are challenging to image with point clouds or textured meshes (Torres-Sánchez et al., 2015). The coastal zone between land and sea is highly variable on both temporal and spatial scales, which presents challenges for its sustainable management (Holzhausen and Grecksch, 2021). The geosphere, hydrosphere and biosphere, which are the natural components of coastal regions shaped by both human and natural dynamics, are inherently interwoven with human–environment relations. Following Döring and Ratter (2021), we refer to this ribbon between land and sea as a coastscape.
In our view, virtual environments are a powerful – but as yet under-utilized – tool for the visualization of different coastscapes, and the changes, both natural and human-induced, they undergo. The aim of this study is to obtain an immersive virtual representation of a coastscape without having to manually build a geomorphologically realistic landscape. The input for this virtual environment can be any geomorphometric data that is based on ground-truthed, (semi-)classified and segmented digital elevation data. In this example, we consider coastal vegetation and changes in species distribution, and link field-generated data (UAS (Uncrewed Aerial System) surveys with RGB cameras and species mapping) with procedural modeling and virtual environment development using the software EPIC Unreal Engine 5. As the input can be any geomorphometric data of any scale, the presented workflow serves as a blueprint for the use of immersive virtual environments in geomorphological analysis and visualization.
1.1 Case study site
To test and implement a workflow for obtaining a virtual environment of a coastscape, we selected the case study site presented by Karstens et al. (2022). The study site, Stein beach, which is situated in northern Germany in the outer part of the Kiel Fjord (Baltic Sea), accommodates a diverse range of vegetation (Figure 1). The seaward wetland edge is largely dominated by common reed (Phragmites australis) with a few patches of salt marsh bulrushes (Bolboschoenus maritimus), followed by dune vegetation in the sandy areas (e.g. Ammophila arenaria, Ammophila x baltica, Leymus arenarius). The swash margin is dominated by annual vegetation such as Cakile maritima, Atriplex littoralis and Atriplex prostrata. Accommodation space is limited as the vegetated area at the study site is bordered by a dike in the hinterland and a marina to the east. As a result of the ongoing shore-parallel sediment transport, most of the bays between Kiel and Fehmarn island are currently being cut off by spit formation. Bottsand, which extends to the west and has been advancing since 1880 (Niedermeyer et al., 2011), is the youngest spit; however, regular dredging at the marina impacts natural sediment transport and coastal dynamics at the study site.
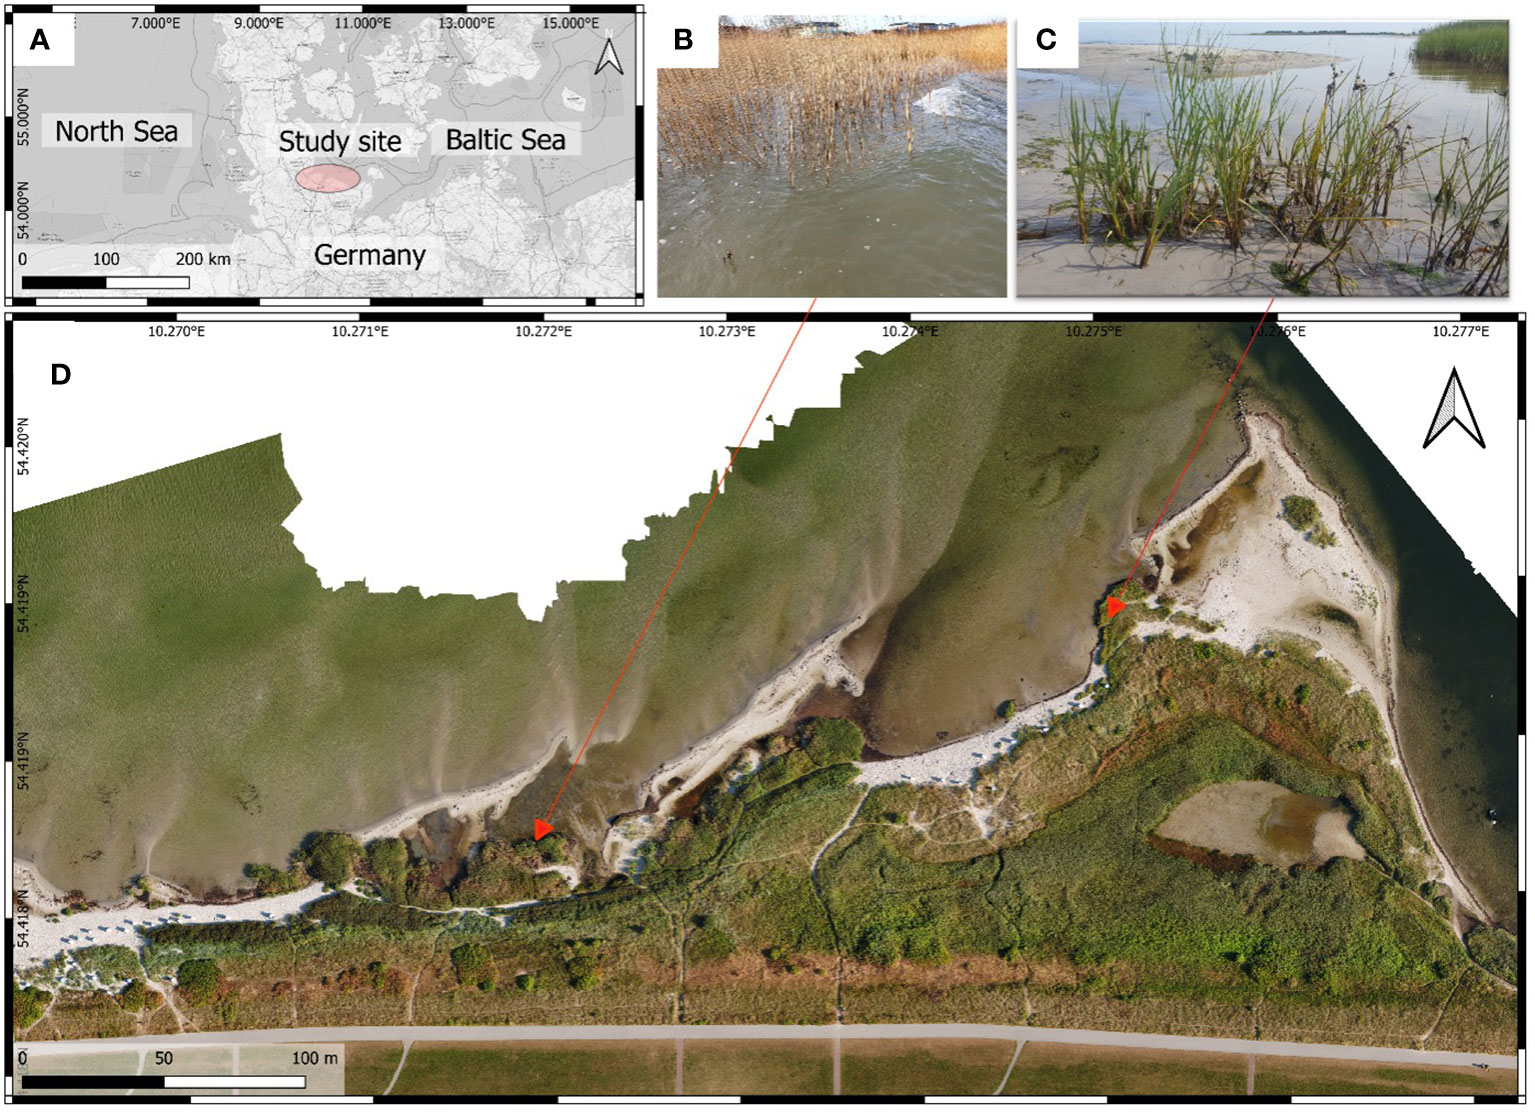
Figure 1 The case study site, Stein, is situated in northern Germany in the outer Kiel Fjord, Baltic Sea (A) Background map: Open Street Map). Coastal vegetation in the area is diverse, but the wetland edge is dominated by Phragmites australis (B) with a few patches of Bolboschoenus maritimus (C). Transitions from wet habitats to sandy habitats covered by dune vegetation occur over a few meters. Accommodation space is limited by a dike. The orthophoto was generated in August 2022 (D). The workflow presented in this study can be adopted to any other site, and Stein Beach was used as a case study site to setup and test the blueprint.
Transitions from wet habitats that are suitable for plants like Phragmites australis, Bolboschoenus maritimus or Schoenoplectus tabernaemontani to dry habitats with dune vegetation occur across small timescales, such that climate change impacts, e.g. sea level rise or increased wave action during winter (Ahola et al., 2021), will influence vegetation composition and pattern distribution. Bolboschoenus maritimus has a higher resistance to salinity than Phragmites australis, and thus might outcompete reed at the wetland edge in the near future. This would have a significant impact on the coastscape because Phragmites australis, which grows up to >2m in height, is much larger and impacts the visual perception (“shielding”) significantly more than Bolboschoenus maritimus. In this study, we created two virtual representations of the study area: (i) as it is today, with Phragmites australis as the dominant species; and (ii) with Bolboschoenus maritimus replacing Phragmites australis at the wetland edge as it might in higher salinity conditions in the future.
2 Materials and methods
2.1 Prerequisites for virtual environment creation
Our workflow can be easily adapted to suit any geomorphometric data input. Nevertheless, a digital elevation model (DEM), together with segmentation and classification maps for the different terrain types, is required for further processing in EPIC Unreal Engine 5. The images must be converted to the same resolution, cover the same area and be in PNG format. For the best visualization of geomorphology, the size in cm² that is covered by a pixel and the total height covered by the DEM should be known (Figure 2). Resolution of these images depends on flight height as well as the sensors used for the process, and can hence vary significantly from mm-scale to dm-scale. While airborne UAS can produce orthophotos in the mm- to cm-scale, the resolution of data from shipboard multibeam-echosounders may range from some to several tens of meters. The level of detail of the DEM, and the segmentation and classification maps defines the lateral appearance of the displayed landscape material and assets. To prevent visual steps related to pixel boundaries, we recommend the use of images with the highest possible resolution. The application of a Gaussian filter to interpolate pixel boundaries also helps to smooth lateral landscape limits. A Python-based tool that enables the modification of the DEM, segmentation and classification maps can be accessed from our GitHub repository (see “Data availability” chapter).
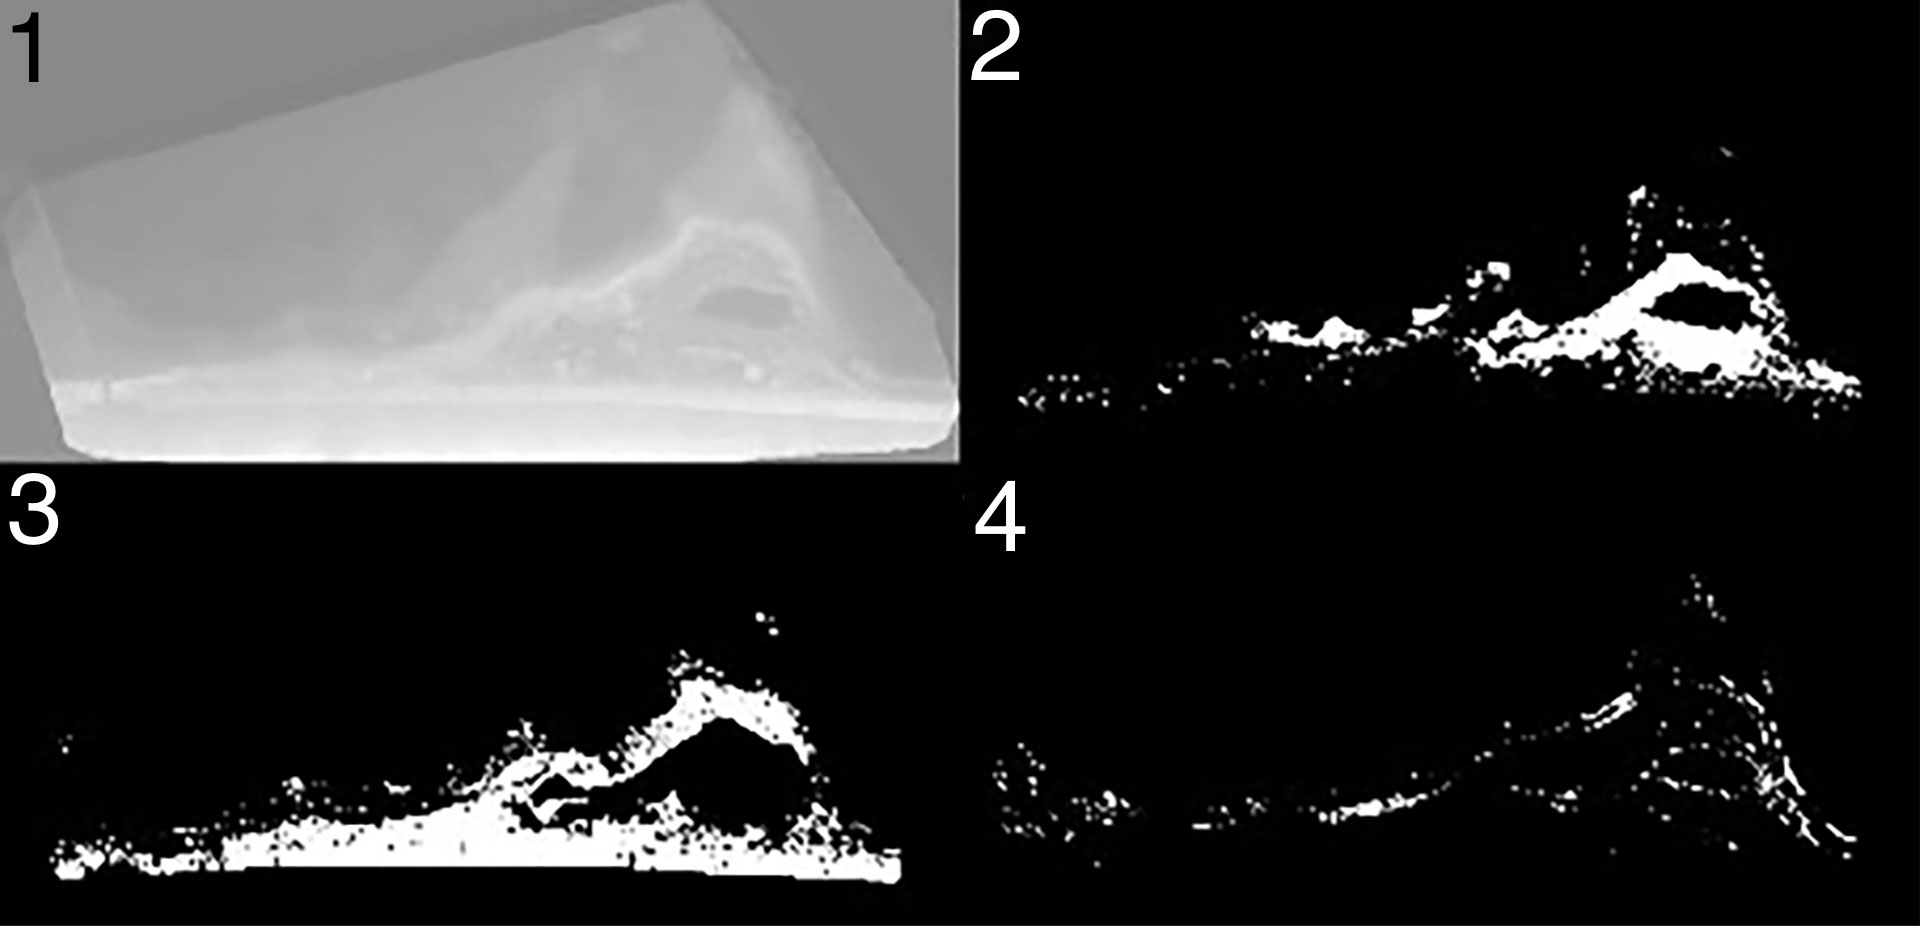
Figure 2 Example of a DEM height-map with a resolution of 2 cm (1) and segmentation maps that show areas of different classifications (2-4).
DEMs were generated for our study area during UAS surveys with a RGB camera in 2021/2022 (see Karstens et al., 2022). RGB imagery on the sub-decimeter scale was conducted with a DJI ZenmuseX5S RGB camera mounted on a DJI Inspire II UAS at a flight height of 70 m, resulting in a lateral resolution of 2 cm. Orthophotos and digital elevation models were generated based on structure-from-motion photogrammetry with the open-source software WebODM (Version 1.9.11, OpenDroneMap, 2022, see Mokrane et al., 2019; Vacca, 2020), that uses the structure-from-motion software library OpenSfM (OpenSfM, 2022) in combination with the Multi-View-Stereo (MVS, 2022) technique (Vacca, 2020). The geo-referenced point cloud data were used for the processing of DEMs with an inverse distance weighting interpolation method (Vacca, 2020; Karstens et al., 2022). Segmentation and classification maps were created from the orthophotos using the open-source Orfeo Toolbox (OTB Version 6.0, Grizonnet et al., 2017, see Karstens et al., 2022). The data were segmented with a spatial range of 50 and a radial range of 7, and supervised machine learning was carried out using a support vector machine (see Karstens et al., 2022). Classes for segmentation included, inter alia, “Phragmites australis”, “Other vegetation”, “Sand”, and “Water” (Figure 2).
2.2 An asset-based approach to create an immersive virtual environment: a Blueprint
In this section, we describe our developed workflow for obtaining asset-based virtual landscapes from airborne RGB imagery (Figure 3). For this study, we use Unreal Engine Blueprints (see “Data availability” chapter for the GitHub link). This workflow can easily be adapted to other sensor data, e.g. spaceborne and multispectral photography, or hydroacoustic remote sensing techniques, such as multi-beam echo-sounder (e.g. Backscatter) data. As mentioned above, the prerequisites are a DEM and segmentation/classification maps with the same lateral boundaries. The segmentation and classification maps can be derived from any geomorphometric parameter in the terrestrial and/or the marine realm. The acquired data need to be validated in the field to define the best fitting landscape materials and assets that should be used in the virtual instance of the scene. Within the blueprint, these landscape materials and assets can be replaced by any custom or purchased 3D model.
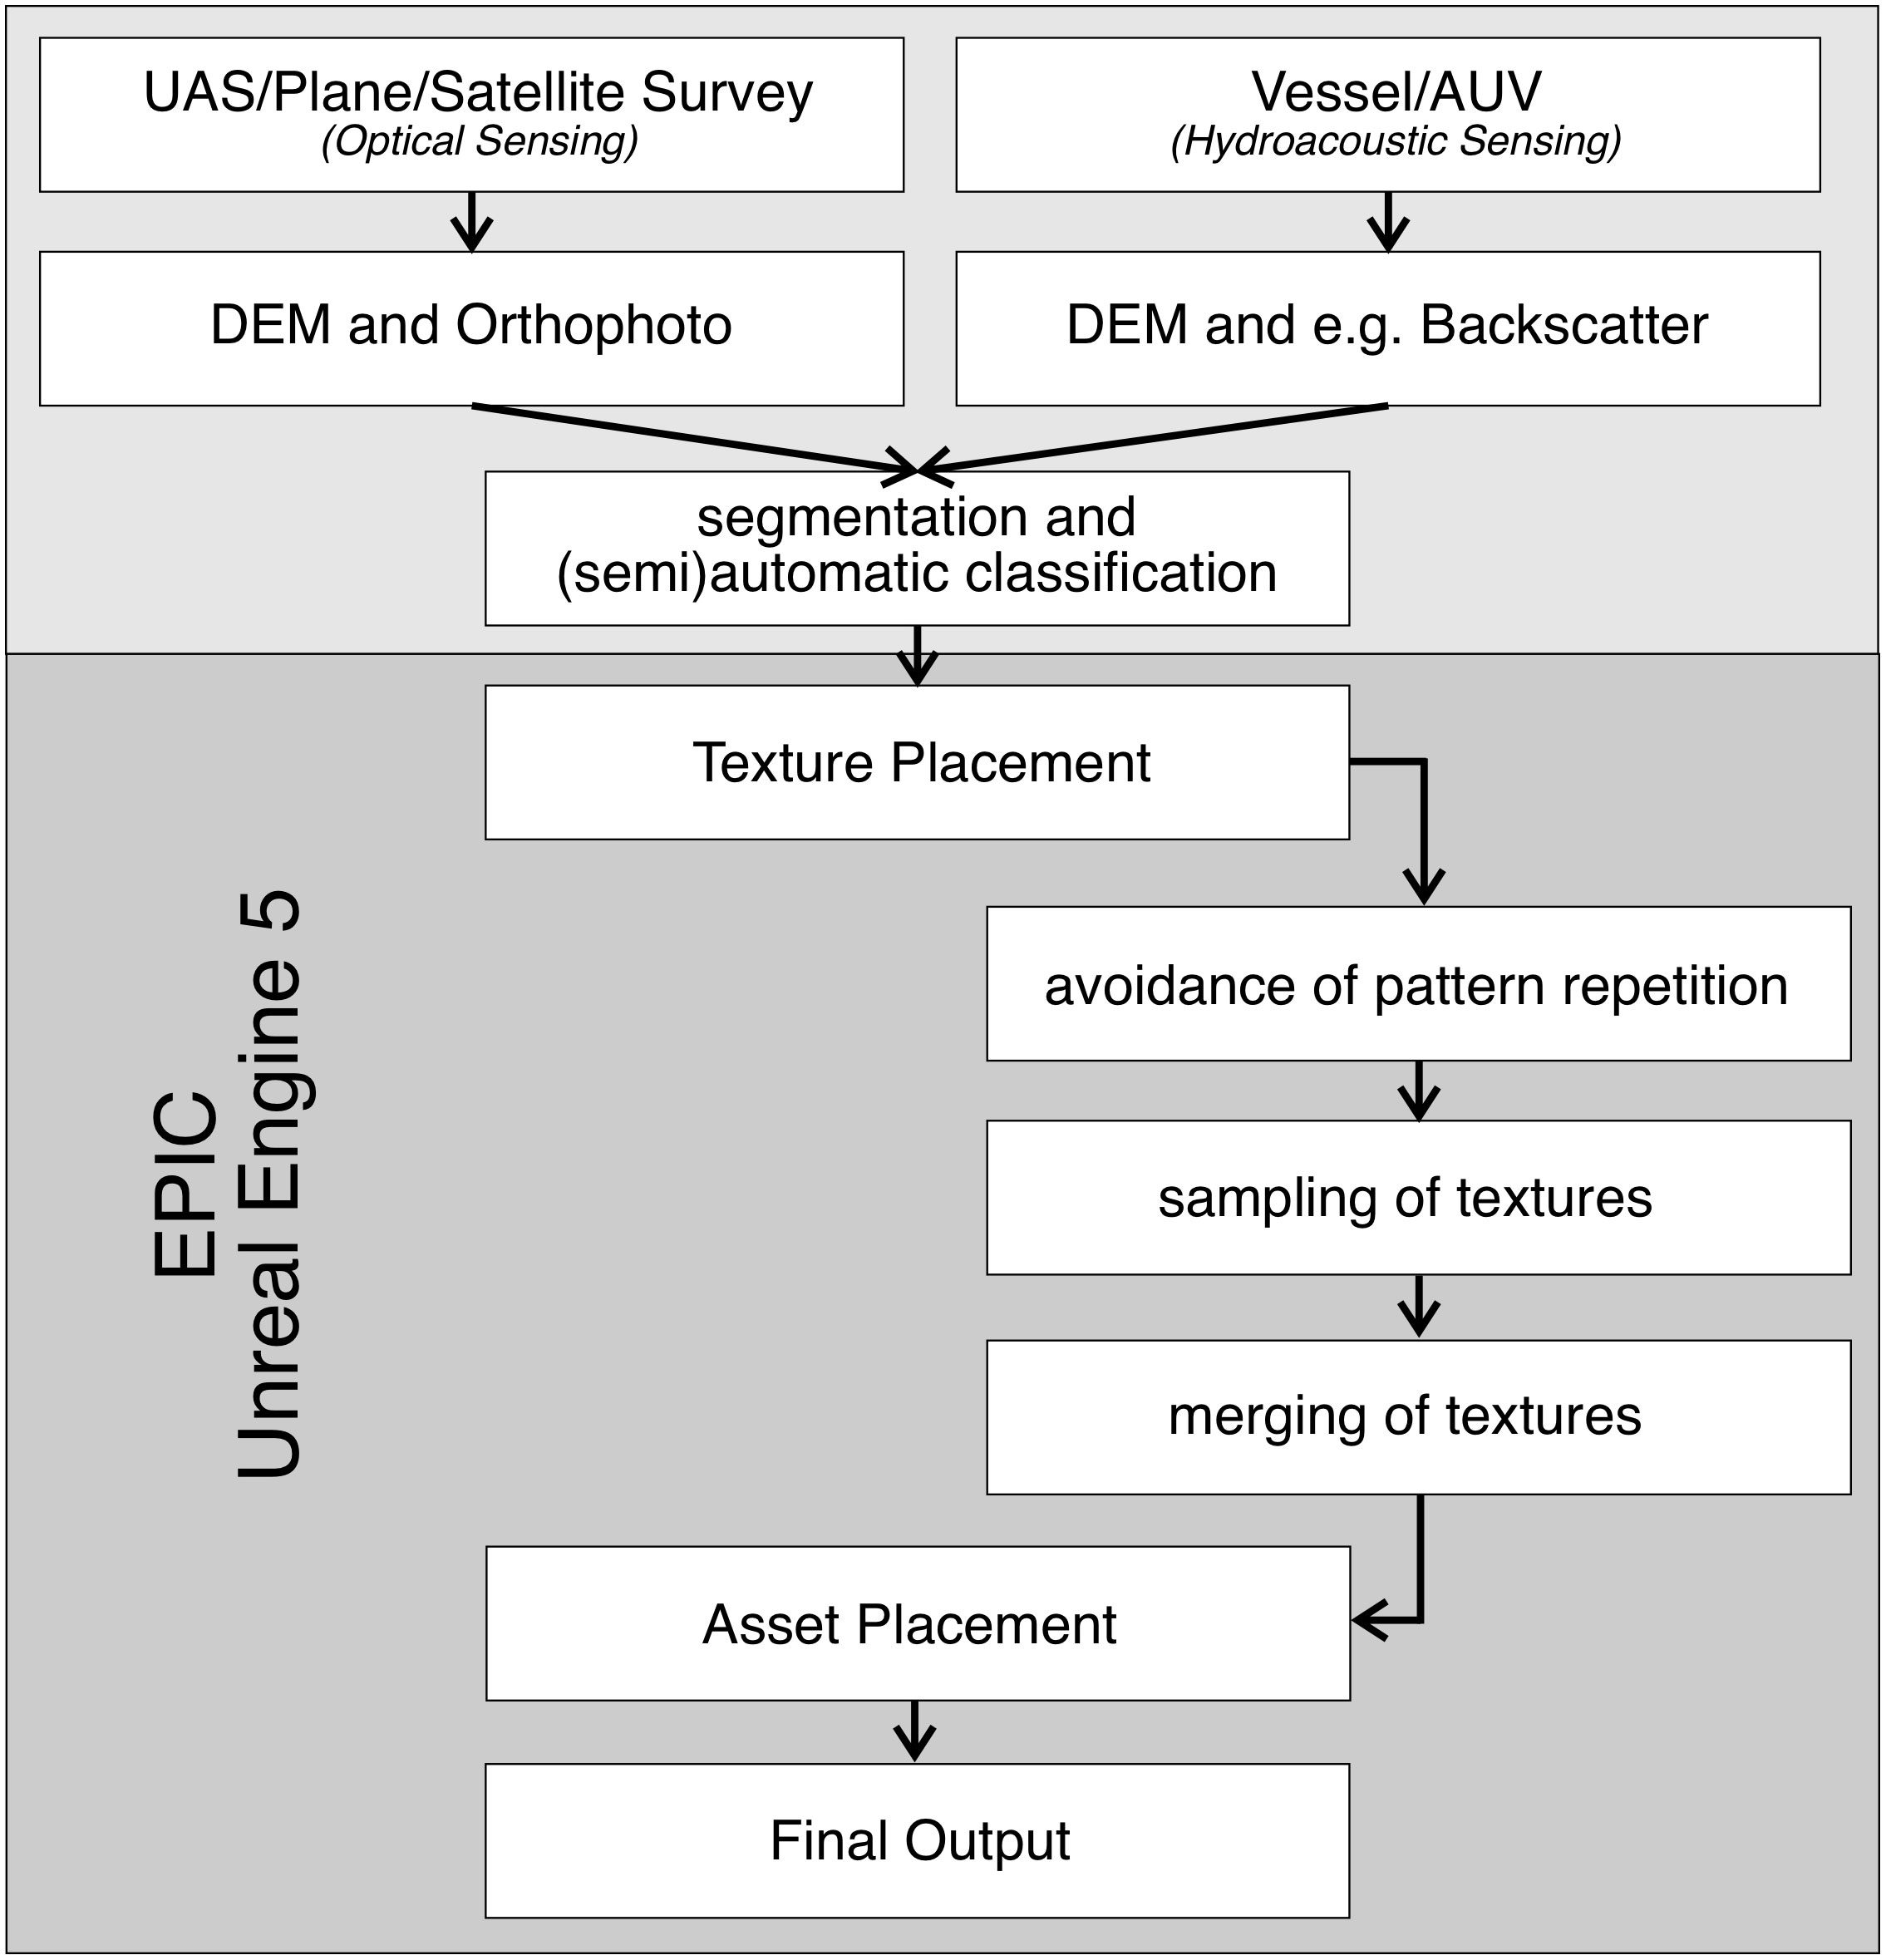
Figure 3 Workflow and pipeline to visualize optical- and acoustic remote sensing data in asset-based virtual environments. The input data consist of a DEM and classification/segmentation maps. Whether these data were generated by optical sensing or (hydro-)acoustic sensors is not important. The data pipeline starts with the final segmentation/classification product and transforms these data into virtual environments within the Game Engine EPIC Unreal Engine 5.
Game engines, such as EPIC Unreal Engine 5 (UE5), allow landscape materials to be generated and then draped on digital elevation models or any object within the game engine project. The setup of landscape material within the game engine (in our case UE5) is crucial for obtaining an asset-based virtual instance of original aerial imagery or any other geospatial dataset. The UE5 Blueprint presented in this study is built using a modular setup, so that customization is simple. The classification of the landscape materials is the basis for this workflow, and must be carried out before importing the DEM via the UE5 Landscape Editor.
2.2.1 Texture placement
In our blueprint, a landscape material is linked to each imported landscape (Figure 4), and different terrain types with different textures and colors can be defined within the landscape material. Our case study uses the free “giant Reed” asset from the Unreal Engine Marketplace, as well as the “Softstem Bulrush” and “Narram Grass” from Quixel. Additional textures are freely available via Quixel.
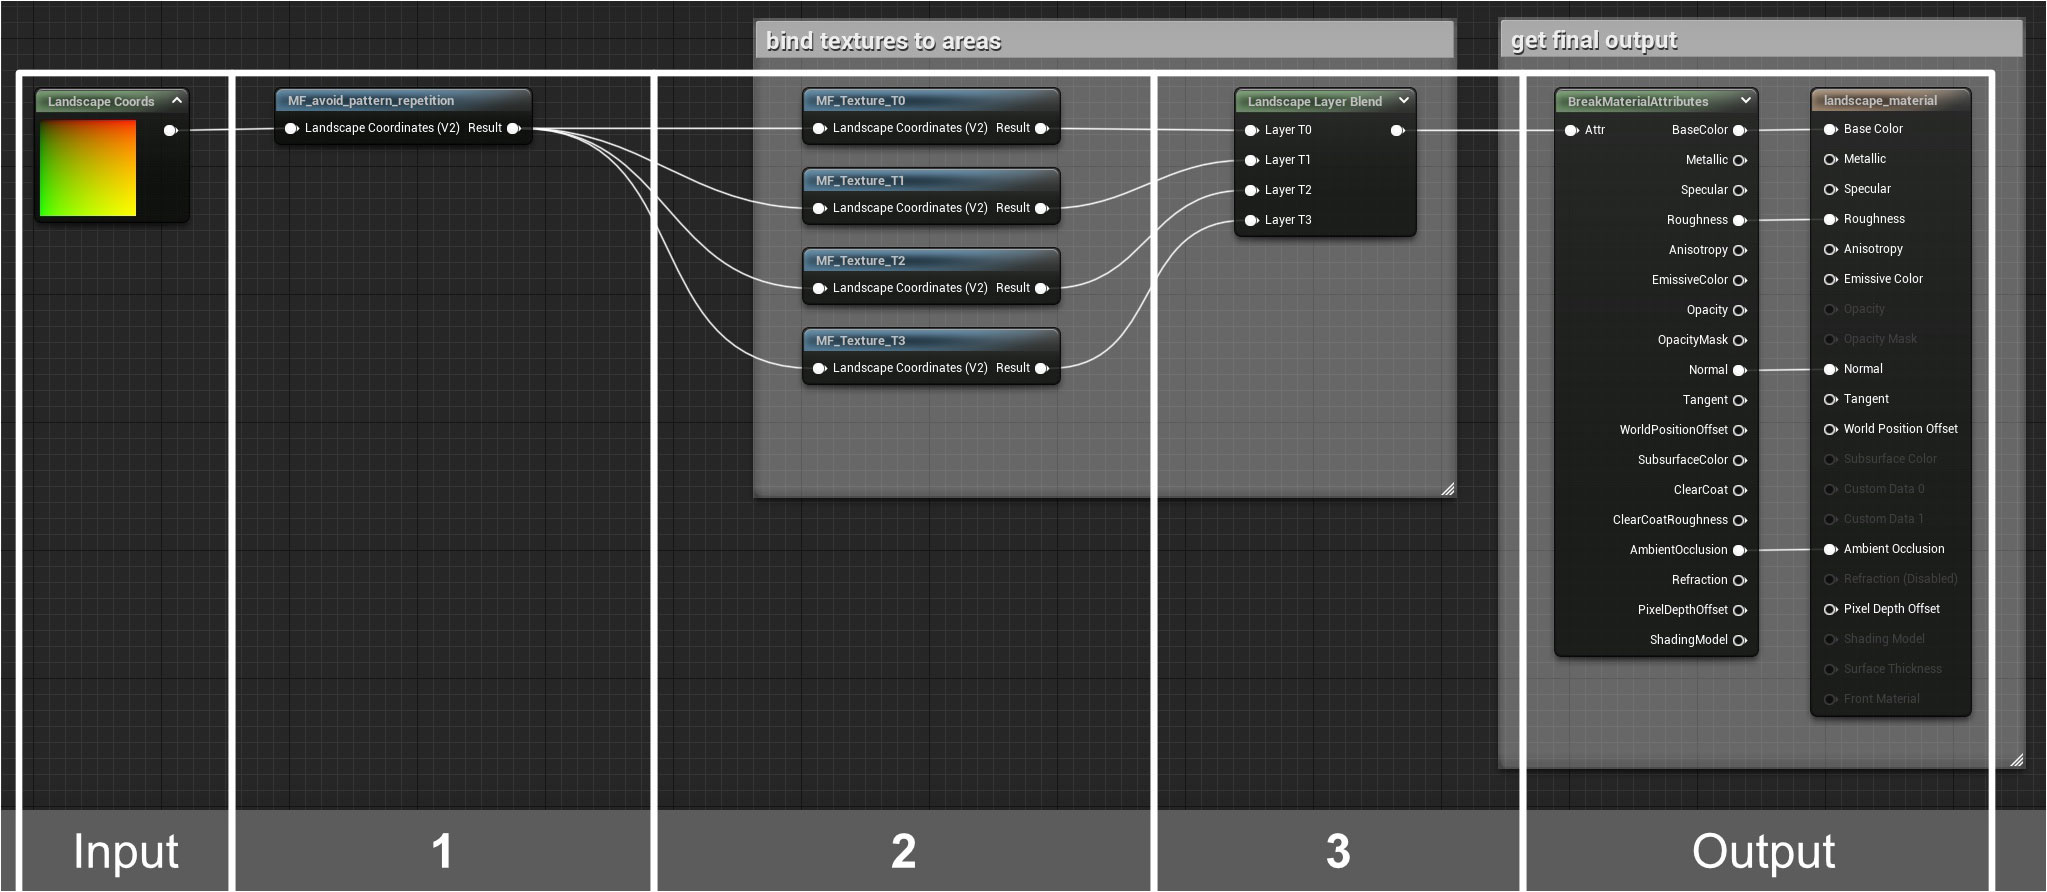
Figure 4 Example of a landscape material showing the input node (LandscapeCoords) and the output. The input involves four steps: (1) Avoid pattern repetition, (2) Texture sample, (3) Texture merging, and final output. The output includes automated asset placement. See the statement on Data Availability for a link to the entire Epic Unreal Engine 5 Blueprint.
Pattern repetition leads to tiling or a chess board-like appearance of the generated landscape, and should be avoided to enable a smooth display. As such, our blueprint implements a function in which these texture tiles are randomly cut, mixed and re-arranged to avoid pattern repetition. This constitutes the first step of our UE5 Blueprint (Figure 4). The function can easily be adjusted to suit the requirements of individual datasets (e.g. scale or number of materials). This function can also be replaced by any other function that enables the avoidance of pattern repetition.
An immersive virtual environment requires sophisticated textures that include, amongst others, colors, roughness, and lighting. Textures need to be explicitly mapped to individual, pre-segmented areas to enable them to be effectively visualized. This happens during steps 2 and 3 of our UE5 blueprint, where four material functions are mapped to the four pre-defined segments of our case-study. Implementing additional material functions in cases where there are more segments is straightforward. Material layer names (T0-T3) are user defined and are used in the following step to automate asset-placement. Where multiple textures can be mapped to the same segments, e.g. seasonal changes of vegetation within a model, multiple textures need to be implemented.
In the final step of the UE5 Blueprint, the previously mapped textures for different terrain types are combined in a single material, which is output to generate the virtual environment.
2.2.2 Asset placement
Individual 3D models of features within the environment (e.g. vegetation) are key to setting up an immersive virtual environment. In this study, we automate the placement of 3D feature models in the previously defined terrain types by enabling them to automatically spawn in pre-mapped areas defined by prior geomorphometric analysis.
In UE5, we map GrassType objects to landscape layers defined in the landscape material (Figure 5). Asset placement is realized by the extension of landscape material. The assets are thus restricted to the pre-defined areas. GrassType objects are used to define the spawn behavior of any assets within the game engine, and parameters such as density, rotation and size of the asset can be adjusted for each GrassType object. To enable realistic and plausible visualization, these parameters should be chosen carefully and be based on factors that can be groundtruthed or validated from the original data (e.g. canopy height of vegetation). In this step, it may be necessary to finetune the parameters.
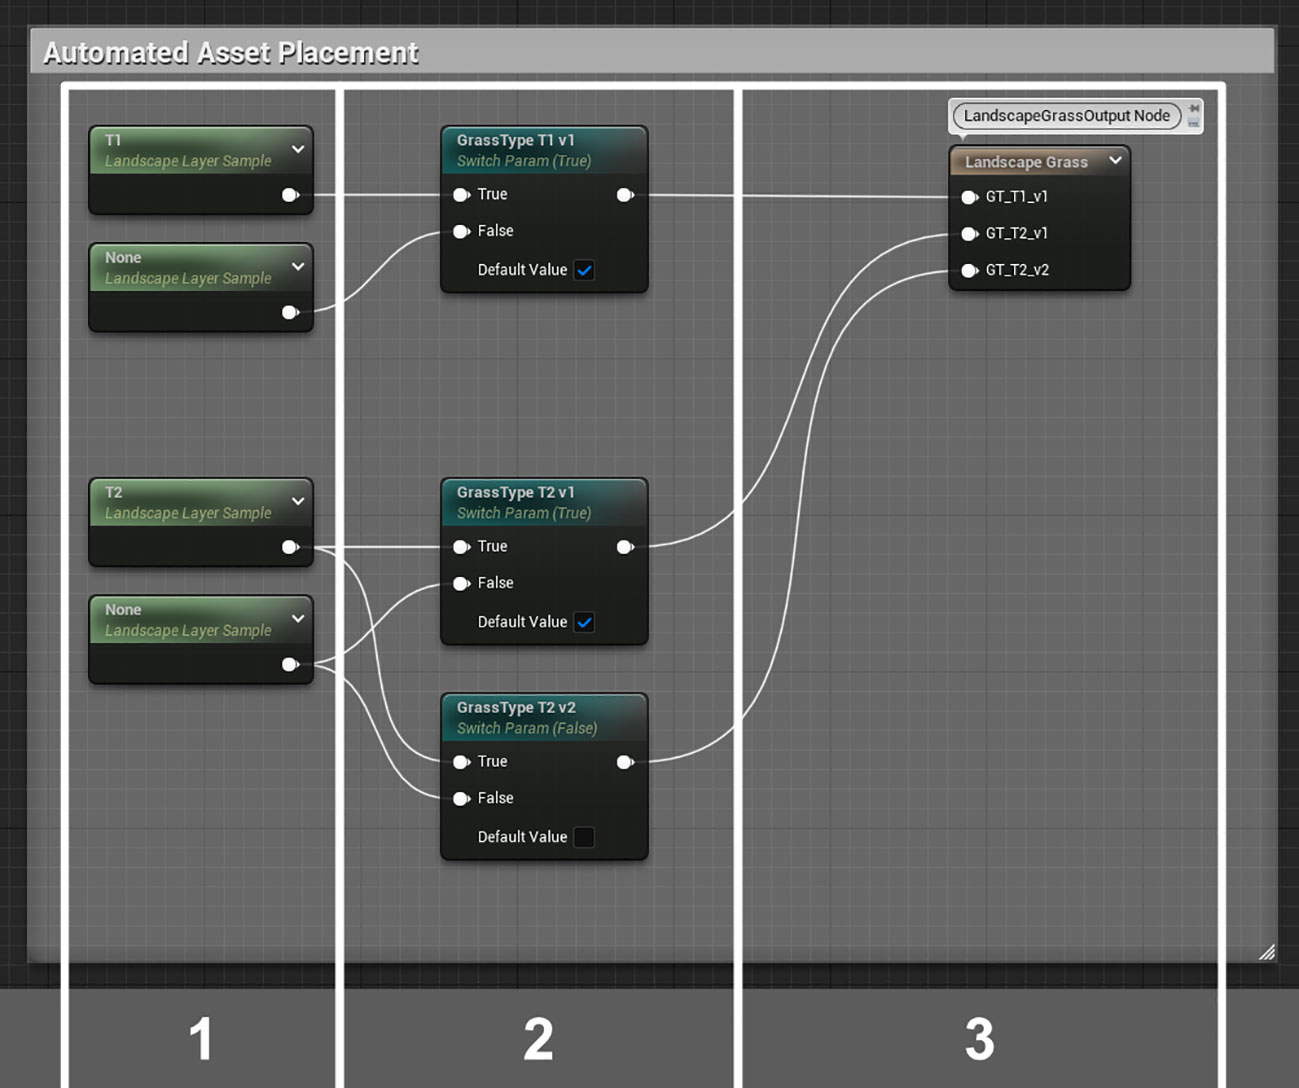
Figure 5 Automated asset placement extension for the UE5 landscape material blueprint (Figure 4). In steps 1-3, assets are mapped to areas in which they should spawn. The asset parameters are adjusted within the GrassType objects in UE5. GrassType objects are selected in step 3 of the extension of the blueprint. See the statement on Data Availability for a link to the entire Epic Unreal Engine 5 Blueprint.
In the first step of the automated asset placement, which is part of the UE5 landscape material blueprint (Figure 5), the landscape layers are selected by referencing the name given during texture placement. In some cases, it could be important to place different assets within the same landscape layer; such as when a specific plant type should be visualized in different phases of life or in different health conditions. Simultaneously displaying these different assets would not lead to a realistic visualization, and so the landscape material needs to be capable of spawning different assets for the same landscape layer. This is realized in step two of the extension of the UE5 blueprint (Figure 5) by defining parameters that can be accessed and adjusted within instances of the landscape material. This means that vegetation types or stages can be modified during model runtime. In step 3, each asset type (GrassType object) is selected and mapped to the corresponding landscape layer.
3 Results & discussion
3.1 The use of asset- and texture-based virtual environments derived from geomorphometric data
The developed workflow highlights the possibilities for improving the appearance and perception of virtual geomorphologic landscapes, and can be considered as a blueprint for the generation of an asset-based virtual environment. In Figure 6, a textured mesh is juxtaposed with the generated asset-based virtual environment. The major advantage of an asset-based virtual environment like this is that it provides a more “realistic” scenic view that is more easily recognized and perceived compared to the coastal landscape of the survey area. This will continue to hold true if the virtual environment is further developed to include additional scenarios (e.g. storm surges) or manipulations of the working area. The automatic spawning of vegetation is key to building this virtual instance, as precise imaging of vegetation is a challenge in both photogrammetry and structure-from-motion algorithms (Cunliffe et al., 2016).
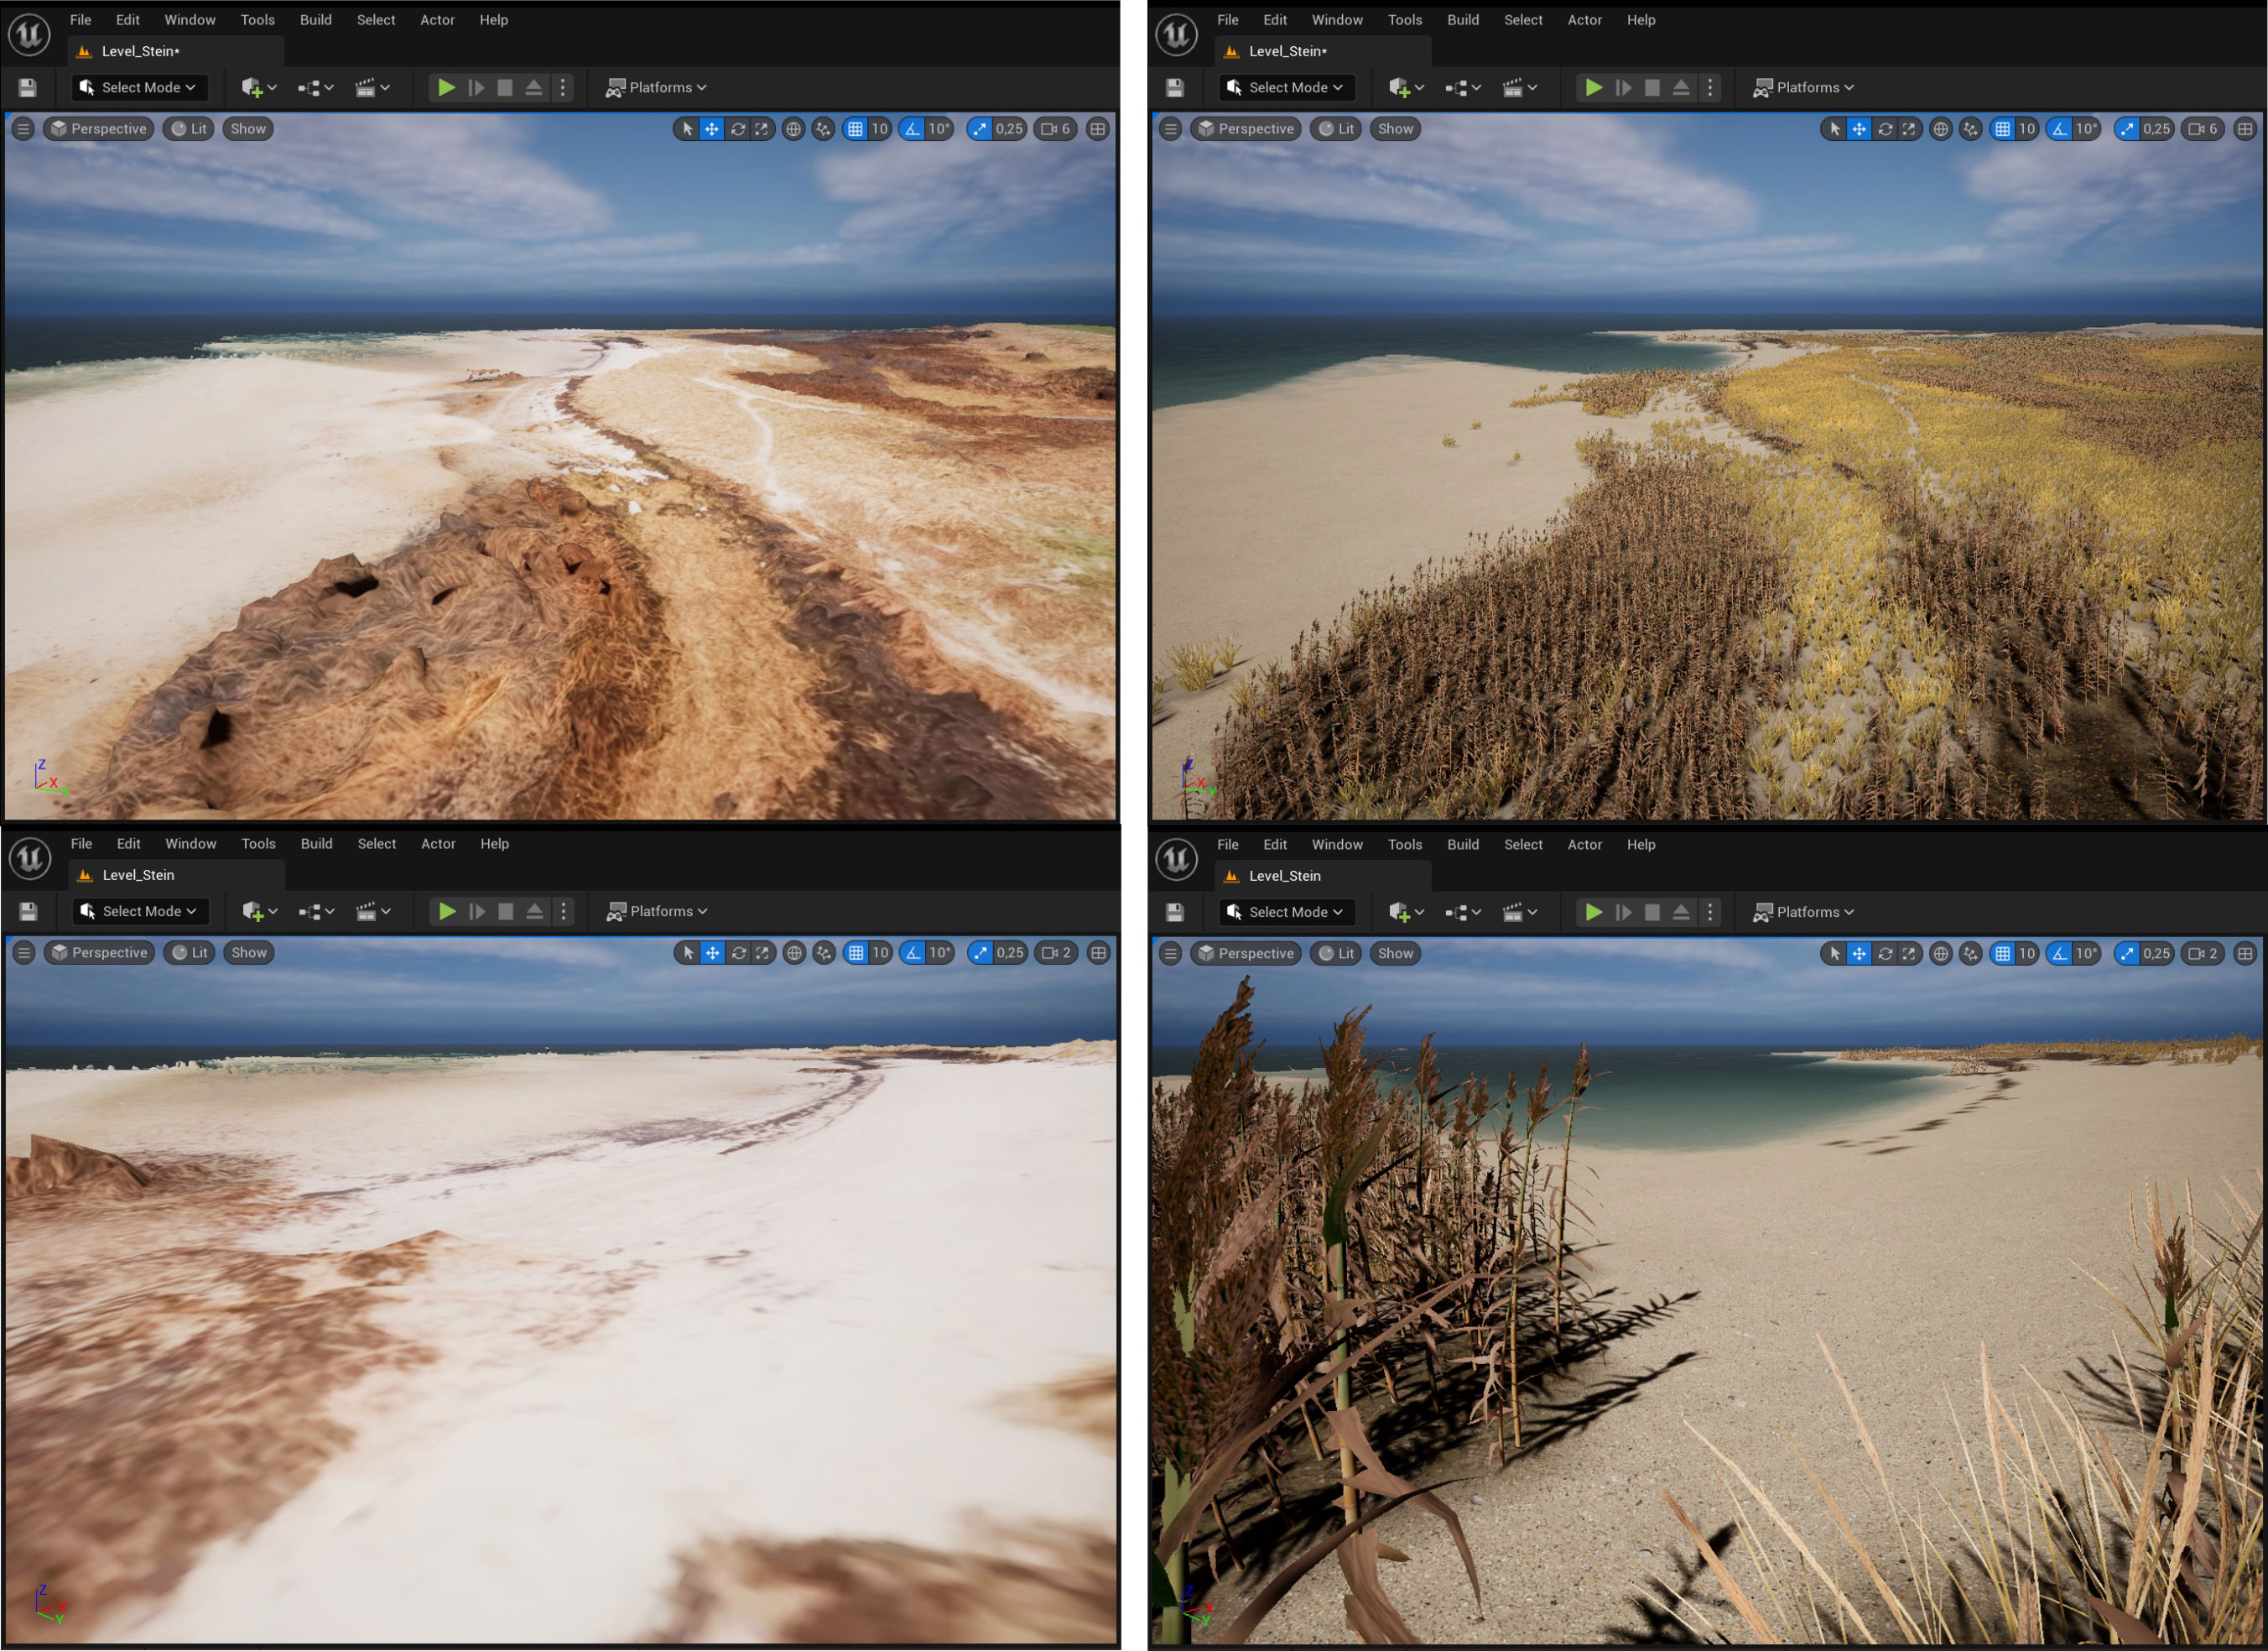
Figure 6 Virtual reality environment using textured mesh data derived from photogrammetry with WebODM (left panels) vs. An asset-based virtual reality environment using a digital elevation model in combination with segmentation and classification maps (right panels).
The level of detail in the virtual environment, which is based on digital elevation models and classification maps, can be increased by manually placing additional assets (e.g. habitat matching fauna, which is not derivable from terrestrial and/or marine remote sensing). Furthermore, meteorically-induced water level fluctuations, which are high and not infrequent along the Baltic coast, can easily be integrated into the scene by adding water surfaces where necessary. The virtual coastscape allows stakeholders to experience places along the coast that are rarely accessible for them (e.g. large reed stands, which are protected by law and too dense to walk through). Furthermore, (potential) environmental changes can be discovered individually, enabling a more focused debate about possible implications between experts and policy makers, as well as with the general public. Virtual environments thus have great potential to aid dialogue-driven research, such as in transdisciplinary approaches, and in the design and establishment of living-labs. At our case study site, changes in water level and salinity could lead to a switch from Phragmites australis dominated wetland edges to Bolboschoenus maritimus (Figure 7). The resulting decrease in vegetation height would shape the coastal visage and its perception by stakeholders. The view from land towards the sea would improve, but refuge and “hiding” options, which are used not only by fauna but also by beach visitors, would decrease. Several man-made footpaths are also present at the study site at Stein (Figure 1), and modifications to the virtual environment help to demonstrate how changes in these anthropogenic structures would impact the vegetation patterns.
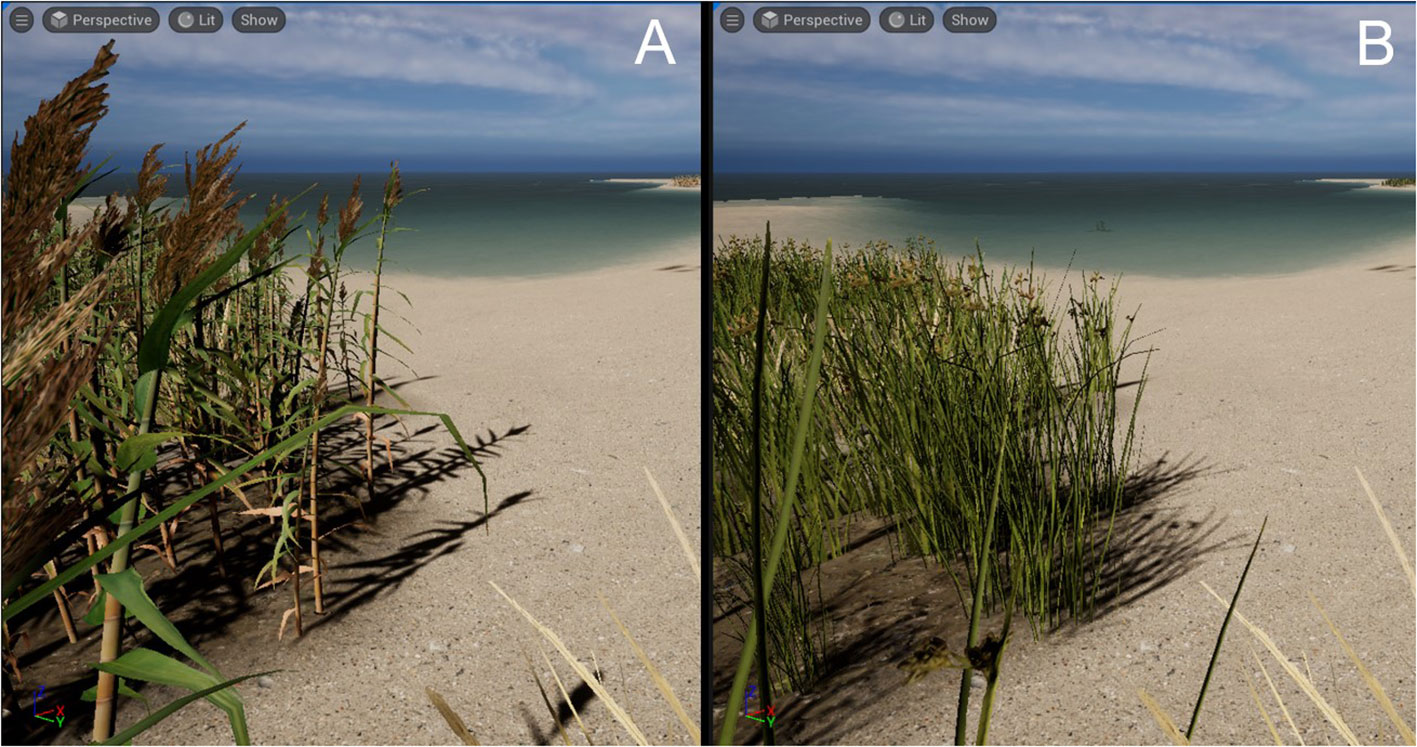
Figure 7 Visualization of the wetland edge dominated by (A) Phragmites australis, and (B) Bolboschoenus maritimus. Asset-based virtual environments enable visualization and communication of potential environmental changes, both for decision-makers and the general public.
3.2 The use of airborne RGB sensor data to obtain virtual coastscapes
Remote sensing results, such as photogrammetry data from UAS RGB camera surveys or LIDAR data, can be quickly translated into immersive experiences for a variety of landscapes (e.g. Reinoso-Gordo et al., 2020; Rienow et al., 2020; Huang et al., 2021). A virtual environment is thus a powerful tool for visualizing and discussing localized scenarios with different stakeholders, which is particularly important in the dynamic and ever-changing coastal zone. Our asset-based approach allows us to create immersive virtual environments that can easily be modified into different coastscapes. Asset choices are large and often available for free or at low cost (e.g. www.unrealengine.com/marketplace; https://quixel.com/megascans/); yet, whenever a particular asset cannot be externally sourced (e.g. rare plant species, or special textures of rock and sediments), the work flow to create it is more labor-intensive compared to automated photogrammetry, and requires 3D modeling and texturing skills.
UAS surveys with RGB cameras have become popular in the coastal zone, where sediment dynamics (e.g. Albuquerque et al., 2018; Jayson-Quashigah et al., 2019; Robin et al., 2020), dune monitoring (e.g. Scarelli et al., 2017; van Puijenbroek et al., 2017; Laporte-Fauret et al., 2020), and litter detection (e.g. Bao et al., 2018; Bak et al., 2019; Andriolo et al., 2022) have become major themes in recent years. Integrating such UAS datasets with an RGB sensor into our UE blueprint virtual environment would not only enable a better understanding of the environmental dynamics or pollution issues, but also their communication with a non-scientific audience. Scientific communication continues to evolve (Hurd, 2000), and immersive environments are becoming more important; not only in scientific, but also in educational domains (Rubio-Tamayo et al., 2017). The use of immersive virtual environments will help to foster inclusion in geoscience education, making study areas more accessible for students who may not be able to go there in person (Harknett et al., 2022).
Climate change will impact vegetation patterns and species distribution in coastal areas. Our workflow allows users to create a simple virtual representation of a coastscape, where changes in species composition (e.g. Phragmites australis vs Bolboschoenus maritimus) can be performed easily for chosen segments. UAS surveys with RGB cameras have previously been applied for mapping invasive species in vegetated coastal areas (e.g. Samiappan et al., 2017; Zhu et al., 2019; Marzialetti et al., 2021), as well as for monitoring the spatial and temporal variability of vegetation patterns (e.g. Tóth, 2018; Doughty et al., 2021). These datasets can easily be processed to fit our workflow and allow an immersive display of environmental challenges that affect humankind. At our study site, where increased salinity might lead to Bolboschoenus maritimus outcompeting Phragmites australis, the visual perception of the wetland edge would completely change. Tall-growing reed currently forms a visual shield, which would disappear should B. maritimus, which is smaller and less dense, dominate. In order to fully understand and discuss potential environmental changes and their implications, stakeholders need to be an integral part of the research process from the beginning. An asset-based approach, such as that presented in this study, allows researchers to co-create and co-design virtual reality environments together with stakeholders by replacing assets or choosing different asset designs.
Using original research data, such as DEMs and segmentation/classification maps, to generate asset-based virtual environments has several advantages as demonstrated by our case study. In particular, resolution may be much higher than from publicly available data, and segmentation and classification may be more detailed, as the processing of the input data and geomorphometric analysis is carried out by the same person. Nevertheless, the use of original datasets results in comparatively small virtual environments, whose spatial extents are limited to the original dataset and are not comparable to “open world” scenes, in which a user can navigate through large landscapes. Future work will involve blending these specific scenes with open world scenes.
3.3 The benefits and future uses of asset-based virtual environments in Land-To-Sea applications
The workflow and blueprint presented in this study enable the semi-automatic generation of data-based virtual representations of coastscapes. We see great advantages to this simplified yet more immersive representation, as users outside academia may be better approached by a scene populated with familiar objects rather than with textured meshes and point clouds. Even more critically, assets and asset-based vegetation can also respond to in-game physics, displaying wind motion or being manipulated by a character within the virtual environment (e.g. Imbert et al., 2013). We consider our approach to be a baseline for future development of virtual environments using user-collected datasets for transdisciplinary research and decision making, dissemination and outreach. We also see a great field of educational purposes, as on the one hand, the visualization of geomorphometric analyses can be brought into the classroom in the field of Eath sciences, and on the other hand disciplines like social- and human sciences can use such virtual environments to assess other dimension of the visualized scenarios. For this purpose, we implemented in the function of “sea-level rise” into the Stand-Alone versions.
Moreover, the methodological approach and blueprint presented here enables any geomorphometric data to be used as the input for a scene. The created virtual environment does not necessarily need to image a vegetated beach scene, but could be a deep-sea habitat, geomorphological structure, or any in situ derived land to sea (L2S) environment.
In the context of digital twins and a metaverse, we emphasize that our blueprint does not currently meet the standards of a digital twin, as the described workflow has limitations including grain size, sediment distribution, and the loss or over-printing of small-scale features during the segmentation and classification process of the original orthophotos. In addition, the physical properties essential to a digital twin (Qi et al., 2021) are not included at this point, and would need to be implemented in a secondary step. The employment of this blueprint in a metaverse nonetheless presents many advantages, as the virtual representation of the study area displays an appropriate scene for further implementation of long-onset scenarios, including sea-level rise, and short-onset extreme events, such as storms, flooding, and droughts. Moreover, we see great potential for the implementation of L2S scenes, where submarine habitats can be added to the virtual environment. This could act as a basis for a fully accessible virtual environment of a coastscape. To make the scene as accessible as possible, we developed two different instances of the scene: a stand-alone version for the use on a desktop PC and a virtual reality version ready to be used on HMD or dome theatres.
4 Conclusion
Immersive virtual environments may play an important role in the future of stakeholder and decision maker interactions, as well as in education. We present an easy-to-use workflow to semi-automatically generate immersive virtual instances from geomorphometric data such as classified terrain models. In contrast to simply importing a textured mesh or point cloud to a game engine like EPIC Unreal Engine 5, this method enables the designer to apply physics and, consequently, dynamic interaction with a virtual environment without the necessity of manually re-building a given scene or landscape. The visualization of vegetation through assets improves the immersive experience and the ability to manipulate virtual environments, which could prove useful especially in the context of a larger-scale metaverse. We see great potential for this method to be used within the geomorphometric community, in both the marine and the terrestrial realm, as well as in land to sea (L2S) studies that bridge these two domains.
Data availability statement
The datasets presented in this study can be found in online repositories. The names of the repository/repositories and accession number(s) can be found below: https://github.com/cabuff/VirtualEnvironments.git.
Author contributions
FG, LP, CW, RB, TK and SK contributed to conception and design of the study. LP, CW and FG performed the implementation in Unreal Engine 5. FG, SK, RB and TK drafted the manuscript which was then advanced by all authors. All authors contributed to the article and approved the submitted version.
Funding
This research is part of following project: Multi-dimensional Ocean Hazard Risk Assessment (FON-2020-04) – allocation of funds from the state of Schleswig-Holstein to ensure top-level interdisciplinary and transdisciplinary research in the marine sciences in Kiel. We acknowledge financial support by DFG within the funding programme Open Publikationstätigkeiten.
Acknowledgments
We would like to thank the Center for Ocean and Society, a Kiel Marine Science (KMS) platform that supports interdisciplinary research and involves societal actors in transdisciplinary projects, for hosting the virtual reality / media production lab “capture&build:facts&formats – cabu:ff”. We thank the Deutsche Allianz Meeresforschung (DAM) funded project “SpacePaTi” for the support on choosing the case study site Stein Beach and on-site evaluation. We also thank EPIC for providing a free usage of Unreal Engine 5, and Grizonnet et al., 2017 for making Orfeo Toolbox (OTB Version 6.0) an open source software.
Conflict of interest
The authors declare that the research was conducted in the absence of any commercial or financial relationships that could be construed as a potential conflict of interest.
Publisher’s note
All claims expressed in this article are solely those of the authors and do not necessarily represent those of their affiliated organizations, or those of the publisher, the editors and the reviewers. Any product that may be evaluated in this article, or claim that may be made by its manufacturer, is not guaranteed or endorsed by the publisher.
References
Ahola M., Bergström L., Blomqvist M. (2021). Climate Change in the Baltic Sea. 2021 Fact Sheet. Helsinki Commission – HELCOM 2021. Available at: https://helcom.fi/media/publications/Baltic-Sea-Climate-Change-Fact-Sheet-2021.pdf.
Albuquerque M. D. G., Leal Alves D. C., Espinoza J. M. D. A., Oliveira U. R., Simões R. S. (2018). Determining shoreline response to meteo-oceanographic events using remote sensing and unmanned aerial vehicle (UAV): case study in southern Brazil. J. Coast. Res. 85 (10085), 766–770. doi: 10.2112/SI85-154.1
Andriolo U., Garcia-Garin O., Vighi M., Borrell A., Gonçalves G. (2022). Beached and floating litter surveys by unmanned aerial vehicles: operational analogies and differences. Remote Sens. 14 (6), 1336. doi: 10.3390/rs14061336
Arrowsmith C., Counihan A., McGreevy D. (2005). Development of a multi-scaled virtual field trip for the teaching and learning of geospatial science. Int. J. Educ. Dev. using ICT 1 (3), 42–56. Available at: https://www.learntechlib.org/p/42374/
Bak S. H., Hwang D. H., Kim H. M., Yoon H. J. (2019). Detection and monitoring of beach litter using uav image and deep neural network. Int. Arch. Photogram. Remote Sens. Spatial Inf. Sci. XLII-3/W8, 55–58. doi: 10.5194/isprs-archives-XLII-3-W8-55-2019
Bao Z., Sha J., Li X., Hanchiso T., Shifaw E. (2018). Monitoring of beach litter by automatic interpretation of unmanned aerial vehicle images using the segmentation threshold method. Mar. pollut. Bull. 137, 388–398. doi: 10.1016/j.marpolbul.2018.08.009
Bond C. E., Cawood A. (2021). A role for virtual outcrop models in blended learning–improved 3D thinking and positive perceptions of learning. Geosci. Communication 4, 233–244. doi: 10.5194/gc-4-233-2021
Buczko U., Jurasinski G., Glatzel S., Karstens S. (2022). Blue carbon in coastal phragmites wetlands along the southern baltic sea. Estuaries Coasts. 1–9. doi: 10.1007/s12237-022-01085-7
Buttussi F., Chittaro L. (2018). Effects of different types of virtual reality display on presence and learning in a safety training scenario. IEEE Trans. Visualization Comput. Graphics 24 (2), 1063–1076. doi: 10.1109/TVCG.2017.2653117
Calisi D., Botta S. (2022). Virtual reality and captured reality for cultural landscape communication. Int. Arch. Photogram. Remote Sens. Spatial Inf. Sci. 46, 113–120. doi: 10.5194/isprs-archives-XLVI-2-W1-2022-113-2022
Cunliffe A. M., Brazier R. E., Anderson K. (2016). Ultra-fine grain landscape-scale quantification of dryland vegetation structure with drone-acquired structure-from-motion photogrammetry. Remote Sens. Environ. 183, 129–143. doi: 10.1016/j.rse.2016.05.019
Döring M., Ratter B. (2021). “I show you my coast…”—a relational study of coastscapes in the North Frisian Wadden Sea. Maritime Stud. 20 (3), 317–327. doi: 10.1007/s40152-021-00239-w
Doughty C. L., Ambrose R. F., Okin G. S., Cavanaugh K. C. (2021). Characterizing spatial variability in coastal wetland biomass across multiple scales using UAV and satellite imagery. Remote Sens. Ecol. Conserv. 7 (3), 411–429. doi: 10.1002/rse2.198
Grizonnet M., Michel J., Poughon V., Inglada J., Savinaud M., Cresson R. (2017). Orfeo ToolBox: open source processing of remote sensing images. Open Geospatial Data Softw. Standards 2 (1), 1–8. doi: 10.1186/s40965-017-0031-6
Harknett J., Whitworth M., Rust D., Krokos M., Kearl M., Tibaldi A., et al. (2022). The use of immersive virtual reality for teaching fieldwork skills in complex structural terrains. J. Struct. Geol. 163, 104681. doi: 10.1016/j.jsg.2022.104681
Heckwolf M. J., Peterson A., Jänes H., Horne P., Künne J., Liversage K., et al. (2021). From ecosystems to socio-economic benefits: a systematic review of coastal ecosystem services in the baltic sea. Sci. Total Environ. 755, 142565. doi: 10.1016/j.scitotenv.2020.142565
Herwig A., Paar P. (2002). Game engines: tools for landscape visualization and planning. Trends GIS virtualization Environ. Plann. design 161, 172.
Holzhausen J., Grecksch K. (2021). Historic narratives, myths and human behavior in times of climate change: A review from northern Europe's coastlands. Wiley Interdiscip. Reviews: Climate Change 12 (5), e723. doi: 10.1002/wcc.723
Huang J., Lucash M. S., Scheller R. M., Klippel A. (2021). Walking through the forests of the future: using data-driven virtual reality to visualize forests under climate change. Int. J. Geogr. Inf. Sci. 35 (6), 1155–1178. doi: 10.1080/13658816.2020.1830997
Huo Y., Yang A., Jia Q., Chen Y., He B., Li J. (2021). Efficient visualization of large-scale oblique photogrammetry models in unreal engine. ISPRS Int. J. Geo-Inf 10, 643. doi: 10.3390/ijgi10100643
Hurd J. M. (2000). The transformation of scientific communication: A model for 2020. J. Am. Soc. Inf. Sci. 51 (14), 1279–1283. doi: 10.1002/1097-4571(2000)9999:9999<::AID-ASI1044>3.0.CO;2-1
Imbert N., Vignat F., Kaewrat C., Boonbrahm P. (2013). Adding physical properties to 3D models in augmented reality for realistic interactions experiments. Proc. Comput. Sci. 25, 364–369. doi: 10.1016/j.procs.2013.11.044
Jayson-Quashigah P. N., Addo K. A., Amisigo B., Wiafe G. (2019). Assessment of short-term beach sediment change in the Volta Delta coast in Ghana using data from Unmanned Aerial Vehicles (Drone). Ocean Coast. Manage. 182, 104952. doi: 10.1016/j.ocecoaman.2019.104952
Jurasinski G., Janssen M., Voss M., Boettcher M. E., Brede M., Burchard H., et al. (2018). Understanding the Coastal ecocline: assessing sea–land interactions at non-tidal, low-lying coasts through interdisciplinary research. Front. Mar. Sci. 5, 342. doi: 10.3389/fmars.2018.00342
Karstens S., Buczko U., Glatzel S. (2015). Phosphorus storage and mobilization in coastal phragmites wetlands: influence of local-scale hydrodynamics. Estuarine Coast. Shelf Sci. 164, 124–133. doi: 10.1016/j.ecss.2015.07.014
Karstens S., Kiesel J., Petersen J., Etter K., Schneider von Deimling J., Michael H., et al. (2022). Human-induced hydrological connectivity: impacts of footpaths on beach wrack transport in a frequently visited Baltic Coastal Wetland. Front. Mar. Sci. 9. doi: 10.3389/fmars.2022.929274
Laporte-Fauret Q., Lubac B., Castelle B., Michalet R., Marieu V., Bombrun L., et al. (2020). Classification of atlantic coastal sand dune vegetation using in situ, UAV, and airborne hyperspectral data. Remote Sens. 12 (14), 2222. doi: 10.3390/rs12142222
Lu X., Yang Z., Xu Z., Xiong C. (2020). Scenario simulation of indoor post-earthquake fire rescue based on building information model and virtual reality. Adv. Eng. Softw. 143, 102792. doi: 10.1016/j.advengsoft.2020.102792
Marzialetti F., Frate L., De Simone W., Frattaroli A. R., Acosta A. T. R., Carranza M. L. (2021). Unmanned Aerial Vehicle (UAV)-based mapping of Acacia saligna invasion in the Mediterranean coast. Remote Sens. 13 (17), 3361. doi: 10.3390/rs13173361
Mokrane A., Choukchou-Braham A., Cherki B. (2019). “DEM generation based on UAV photogrammetry,” in 2019 International Conference on Advanced Electrical Engineering (ICAEE). 1–5 (Algiers, Algeria: IEEE). doi: 10.1109/ICAEE47123.2019.9014805
MVS (2022). Multi-View Environment. Available at: https://github.com/simonfuhrmann/mve.
Niedermeyer R. O., Lampe R., Janke W., Schwarzer K., Duphorn K., Kliewe H., et al. (2011). Die Deutsche Ostseeküste, ISBN: ISBN 978-3-443-15091-4. Schweizbart, 370.
OpenDroneMap (2022). Available at: https://github.com/OpenDroneMap/OpenDroneMap.
OpenSfM (2022). Open Structure From Motion – OpenSfM. Available at: https://github.com/mapillary/OpenSfM/.
Osland M. J., Enwright N. M., Day R. H., Gabler C. A., Stagg C. L., Grace J. B. (2016). Beyond just sea-level rise: Considering macroclimatic drivers within coastal wetland vulnerability assessments to climate change. Global Change Biol. 22 (1), 1–11. doi: 10.1111/gcb.13084
Qi Q., Tao F., Hu T., Anwer N., Liu A., Wei Y., et al. (2021). Enabling technologies and tools for digital twin. J. Manufact. Syst. 58, 3–21. doi: 10.1016/j.jmsy.2019.10.001
Reddy K. R., DeLaune R. D. (2008). Biogeochemistry of wetlands: science and applications (Boca Raton Fl: CRC Press).
Reinoso-Gordo J. F., Barsky D., Serrano-Ramos A., Solano-García J. A., León-Robles C. A., Luzón-González C., et al. (2020). Walking among mammoths. Remote sensing and virtual reality supporting the study and dissemination of Pleistocene archaeological sites: the case of Fuente Nueva 3 in Orce, Spain. Sustainability 12 (11), 4785. doi: 10.3390/su12114785
Rienow A., Lindner C., Dedring T., Hodam H., Ortwein A., Schultz J., et al. (2020). Augmented reality and virtual reality applications based on satellite-borne and ISS-borne remote sensing data for school lessons. PFG – Journal of Photogrammetry, Remote Sensing and Geoinformation Science 88, 187–198. doi: 10.1007/s41064-020-00113-0
Robin N., Levoy F., Anthony E. J., Monfort O. (2020). Sand spit dynamics in a large tidal-range environment: Insight from multiple LiDAR, UAV and hydrodynamic measurements on multiple spit hook development, breaching, reconstruction, and shoreline changes. Earth Surface Processes Landforms 45 (11), 2706–2726. doi: 10.1002/esp.4924
Rubio-Tamayo J. L., Gertrudix Barrio M., García García F. (2017). Immersive environments and virtual reality: Systematic review and advances in communication, interaction and simulation. Multimodal Technol. Interaction 1 (4), 21. doi: 10.3390/mti1040021
Samiappan S., Turnage G., Hathcock L., Casagrande L., Stinson P., Moorhead R. (2017). Using unmanned aerial vehicles for high-resolution remote sensing to map invasive Phragmites australis in coastal wetlands. Int. J. Remote Sens. 38 (8-10), 2199–2217. doi: 10.1080/01431161.2016.1239288
Scarelli F. M., Sistilli F., Fabbri S., Cantelli L., Barboza E. G., Gabbianelli G. (2017). Seasonal dune and beach monitoring using photogrammetry from UAV surveys to apply in the ICZM on the Ravenna coast (Emilia-Romagna, Italy). Remote Sens. Applications: Soc. Environ. 7, 27–39. doi: 10.1016/j.rsase.2017.06.003
Sheppard S. R. (2012). Visualizing climate change: a guide to visual communication of climate change and developing local solutions (Routledge London and New York: Routledge).
Spicer J. I., Stratford J. (2001). Student perceptions of a virtual field trip to replace a real field trip. J. Comput. Assisted Learn. 17 (4), 345–354. doi: 10.1046/j.0266-4909.2001.00191.x
Swetnam R. D., Korenko J. (2019). Can computer game landscapes target new audiences for landscape quality assessment? Appl. Geogr. 113, 102102. doi: 10.1016/j.apgeog.2019.102102
Torres-Sánchez J., López-Granados F., Pena J. M. (2015). An automatic object-based method for optimal thresholding in UAV images: Application for vegetation detection in herbaceous crops. Comput. Electron. Agric. 114, 43–52. doi: 10.1016/j.compag.2015.03.019
Toschi I., Ramos M. M., Nocerino E., Menna F., Remondino F., Moe K., et al. (2017). Oblique photogrammetry supporting 3D urban reconstruction of complex scenarios. ISPRS Int. Arch. Photogramm. Remote Sens. Spat. Inf. Sci. XLII-1/W1, 519–526. doi: 10.5194/isprs-archives-XLII-1-W1-519-2017
Tóth V. R. (2018). Monitoring spatial variability and temporal dynamics of Phragmites using unmanned aerial vehicles. Front. Plant Sci. 9, 728. doi: 10.3389/fpls.2018.00728
Vacca G. (2020). “WEB Open Drone Map (WebODM) a Software Open Source to Photogrammetry Process,” in Fig Working Week Smart surveyors for land and water management(Amsterdam). Available at: https://iris.unica.it/handle/11584/300743
VanDerHorn E., Mahadevan S. (2021). Digital Twin: Generalization, characterization and implementation. Decision Support Syst. 145, 113524. doi: 10.1016/j.dss.2021.113524
van Puijenbroek M. E., Nolet C., de Groot A. V., Suomalainen J. M., Riksen M. J., Berendse F., et al. (2017). Exploring the contributions of vegetation and dune size to early dune development using unmanned aerial vehicle (UAV) imaging. Biogeosciences 14 (23), 5533–5549. doi: 10.5194/bg-14-5533-2017
Keywords: virtual reality, unreal engine, digital terrain model, landscape materials, coastal geomorphometry, Land-to-Sea (L2S)
Citation: Gross F, Petersen L, Wallmeier C, Barrett R, Kwasnitschka T and Karstens S (2023) From coastal geomorphometry to virtual environments. Front. Mar. Sci. 10:1229489. doi: 10.3389/fmars.2023.1229489
Received: 26 May 2023; Accepted: 29 August 2023;
Published: 15 September 2023.
Edited by:
Vincent Lecours, Université du Québec à Chicoutimi, CanadaReviewed by:
Yanghui Tan, Tianjin University of Technology, ChinaLuis A. Conti, University of São Paulo, Brazil
Jiawei Huang, Environmental Systems Research Institute, United States
Copyright © 2023 Gross, Petersen, Wallmeier, Barrett, Kwasnitschka and Karstens. This is an open-access article distributed under the terms of the Creative Commons Attribution License (CC BY). The use, distribution or reproduction in other forums is permitted, provided the original author(s) and the copyright owner(s) are credited and that the original publication in this journal is cited, in accordance with accepted academic practice. No use, distribution or reproduction is permitted which does not comply with these terms.
*Correspondence: Felix Gross, felix.gross@ifg.uni-kiel.de
†ORCID: Felix Gross, orcid.org/0000-0002-0749-829X
Tom Kwasnitschka, orcid.org/0000-0003-1046-1604
Rachel Barrett, orcid.org/0000-0001-6463-4473