Erosion of carbonate-bearing sedimentary rocks may close the alkalinity budget of the Baltic Sea and support atmospheric CO2 uptake in coastal seas
 Klaus Wallmann1*
  Markus Diesing2
  Florian Scholz1
  Gregor Rehder3
  Andrew W. Dale1
  Michael Fuhr1 Erwin Suess1,4
- 1Marine Biogeochemistry, GEOMAR Helmholtz Centre for Ocean Research Kiel, Kiel, Germany
- 2Earth Surface and Seabed, Geological Survey of Norway, Trondheim, Norway
- 3Marine Chemistry, Leibniz Institute for Baltic Sea Research Warnemünde, Rostock, Germany
- 4College of Earth, Ocean, and Atmospheric Sciences, Oregon State University, Corvallis, OR, United States
High alkalinity values observed in coastal seas promote the uptake of CO2 from the atmosphere. However, the alkalinity budget of coastal areas and marginal seas is poorly understood, even though some of the recently observed alkalinity enhancement can be ascribed to riverine fluxes and anaerobic processes in shelf sediments. Here, we investigate the alkalinity budget of the Baltic Sea to identify previously unrecognized alkalinity sources. We quantify the generation of alkalinity and dissolved calcium (Ca) in this marginal sea applying simple mass balance calculations. Using this approach, we identify alkalinity and Ca sources of approximately 324 Gmol yr-1 and 122 Gmol yr-1, respectively, that cannot be ascribed to the riverine input. The magnitude of the Ca source suggests that a major fraction of the excess alkalinity (244 Gmol yr-1) is induced by the dissolution of calcium carbonate (CaCO3). A review of available field data shows that carbonate-bearing rocks at the coast and the seabed of the Baltic Sea are rapidly eroded and may provide sufficient CaCO3 to close the Ca budget. Hence, dissolution of eroded CaCO3 is the most likely source for the Ca enrichment observed in Baltic Sea water. This hypothesis is supported by mass accumulation rates of sediments derived from radioisotope data that are evaluated to derive a basin-wide rate of mud to muddy sand accumulation at the bottom of the Baltic Sea. The resulting value (139 Tg yr-1) exceeds current estimates of riverine particle fluxes into the Baltic Sea by more than one order of magnitude and confirms that rates of till erosion are sufficiently high to account for the Ca and most of the alkalinity excess in Baltic Sea water. Finally, we show that deliberate addition of CaCO3 to sediments deposited in the Baltic Sea could neutralize significant amounts of CO2 and help to achieve net-zero greenhouse gas emissions in the Baltic region.
Introduction
The global ocean takes up a significant fraction of anthropogenic CO2 emissions (IPCC, 2021). Coastal seas contribute to CO2 removal from the atmosphere by absorbing large amounts of CO2 (Tsunogai et al., 1999; Thomas et al., 2005; Chen et al., 2013). Prior to the onset of industrialization, CO2 was released from coastal seas (Bauer et al., 2013). However, the increase in atmospheric pCO2 and coastal eutrophication induced a reversal of this flux such that coastal seas are now a major sink for anthropogenic CO2 (Chen et al., 2013). The Baltic Sea shows a similar behavior. It released CO2 prior to the onset of eutrophication (Omstedt et al., 2009), mainly driven by the mineralization of terrigenous organic matter, and has apparently acted as a net sink for atmospheric CO2 over the last decades, even though the strong seasonal, interannual and spatial variability complicates the assessment of a basin-wide CO2 budget (Thomas et al., 2010; Schneider et al., 2014; Gustafsson et al., 2015). Eutrophication in the widely stratified marginal sea led to enhanced CO2 removal from the atmosphere and organic carbon deposition at the seabed while increasing atmospheric CO2 levels amplified the air-sea disequilibrium (Kulinski et al., 2022).
Total alkalinity (AT) of seawater provides buffering capacity and, therefore, supports CO2 uptake from the atmosphere (Zeebe and Wolf-Gladrow, 2001). Many marginal seas are enriched in AT with respect to normal seawater. The AT enrichment has been ascribed to riverine AT inputs and anaerobic degradation processes in shelf sediments that produce large amounts of AT (Thomas et al., 2009). An AT balance for the Baltic Sea, set up using the Baltic Sea Long-Term Large-Scale Eutrophication Model (BALTSEM), showed a mismatch between inflow and outflow and an AT excess that could not be assigned to riverine AT fluxes (Gustafsson et al., 2014; Gustafsson et al., 2019). This excess AT (380 Gmol yr-1) was partly attributed to pelagic and benthic redox processes generating internal AT sources (40 Gmol yr-1). However, a large unresolved AT source remained (340 Gmol yr-1) that could not be ascribed to any known process occurring in the Baltic Sea (Gustafsson et al., 2019, corrigendum). Moreover, AT in Baltic Sea water has increased over the last decades for reasons that are largely unknown (Schneider et al., 2015; Müller et al., 2016). Müller et al. (2016) further showed that the AT increase between 1995 and 2014 could compensate half of the expected pH change and almost all of the change in carbonate saturation which would be induced by the increase in atmospheric pCO2 over the same period. Unidentified sources of AT in the Baltic Sea and other coastal areas are major knowledge gaps in our understanding of the marine carbon cycle.
The poorly defined AT balance of coastal seas is also relevant with respect to carbon dioxide removal (CDR) approaches such as enhanced weathering that have been proposed to mitigate global climate change and achieve net-zero CO2 emissions (IPCC, 2018). In one of these techniques, olivine and other alkaline minerals are added to the coastal ocean and the shallow seabed where they dissolve and convert the greenhouse gas CO2 into climate-neutral AT (Hartmann et al., 2013; Feng et al., 2017; Montserrat et al., 2017; Fuhr et al., 2022). However, accounting of AT production induced by alkaline mineral addition is only possible when natural source and sink terms are fully constrained. Hence, a better understanding of AT dynamics is also required to validate future marine CDR approaches.
Here, we propose a new mechanism that can account for missing AT sources in the Baltic Sea. We hypothesize that the erosion of carbonate-bearing sedimentary rocks at the coast and the bottom of the Baltic Sea provides CaCO3 that is subsequently dissolved in surface sediments to deliver most of the unaccounted AT. CaCO3 dissolution is induced by corrosive bottom waters that are undersaturated with respect to aragonite and calcite in the deep basins of the Baltic Sea (Tyrrell et al., 2008) and by high rates of metabolic CO2 production in Baltic surface sediments (Nilsson et al., 2019) that lower the pH and promote CaCO3 dissolution close to the sediment-water interface. We also discuss how benthic CaCO3 dissolution can be amplified by deliberate CaCO3 addition and used as a new CDR approach.
In the following, we first set up AT and Ca mass balances for the Baltic Sea. Subsequently, we review the available literature to assess possible CaCO3 sources at the coast and at the seabed. Finally, we evaluate mass accumulation rates of muddy sediments across the Baltic Sea to validate our estimates on coastal and seabed erosion of CaCO3-bearing glacial till.
Alkalinity and Ca balance of the Baltic Sea
In this section, we assess water and salinity fluxes for the Baltic Sea. Subsequently, these fluxes are applied to estimate sources for dissolved AT and Ca in Baltic Sea water. Finally, we evaluate whether the derived Ca release can account for the previously observed unresolved AT excess.
Water and salinity budget
The hydrography of the Baltic Sea depends on the water exchange with the Skagerrak and Kattegat (Figure 1), which is restricted by narrows and sills, and on river runoff into the Baltic Sea. Inflow of saline waters, riverine water fluxes and the mean salinity of brackish Baltic Sea water all show strong decadal variability with a cycle length of about 25 – 30 years (Meier and Kauker, 2003a; Meier and Kauker, 2003b; Meier, 2007; Mohrholz, 2018). However, no long-term trends in these water flows and salinities have been observed over the last century (Meier and Kauker, 2003a; Mohrholz, 2018). In the following, we, hence, calculate steady state mass balances for the Baltic Sea using fluxes and salinities averaged over the last 100 years (Table 1). The Baltic Sea is defined as the entire Baltic Sea basin excluding the Kattegat and Skagerrak. The seaward boundary is located between the Kattegat and the Baltic Sea where water is exchanged across the shallow Danish straits and the Øresund (Figures 1, 2).
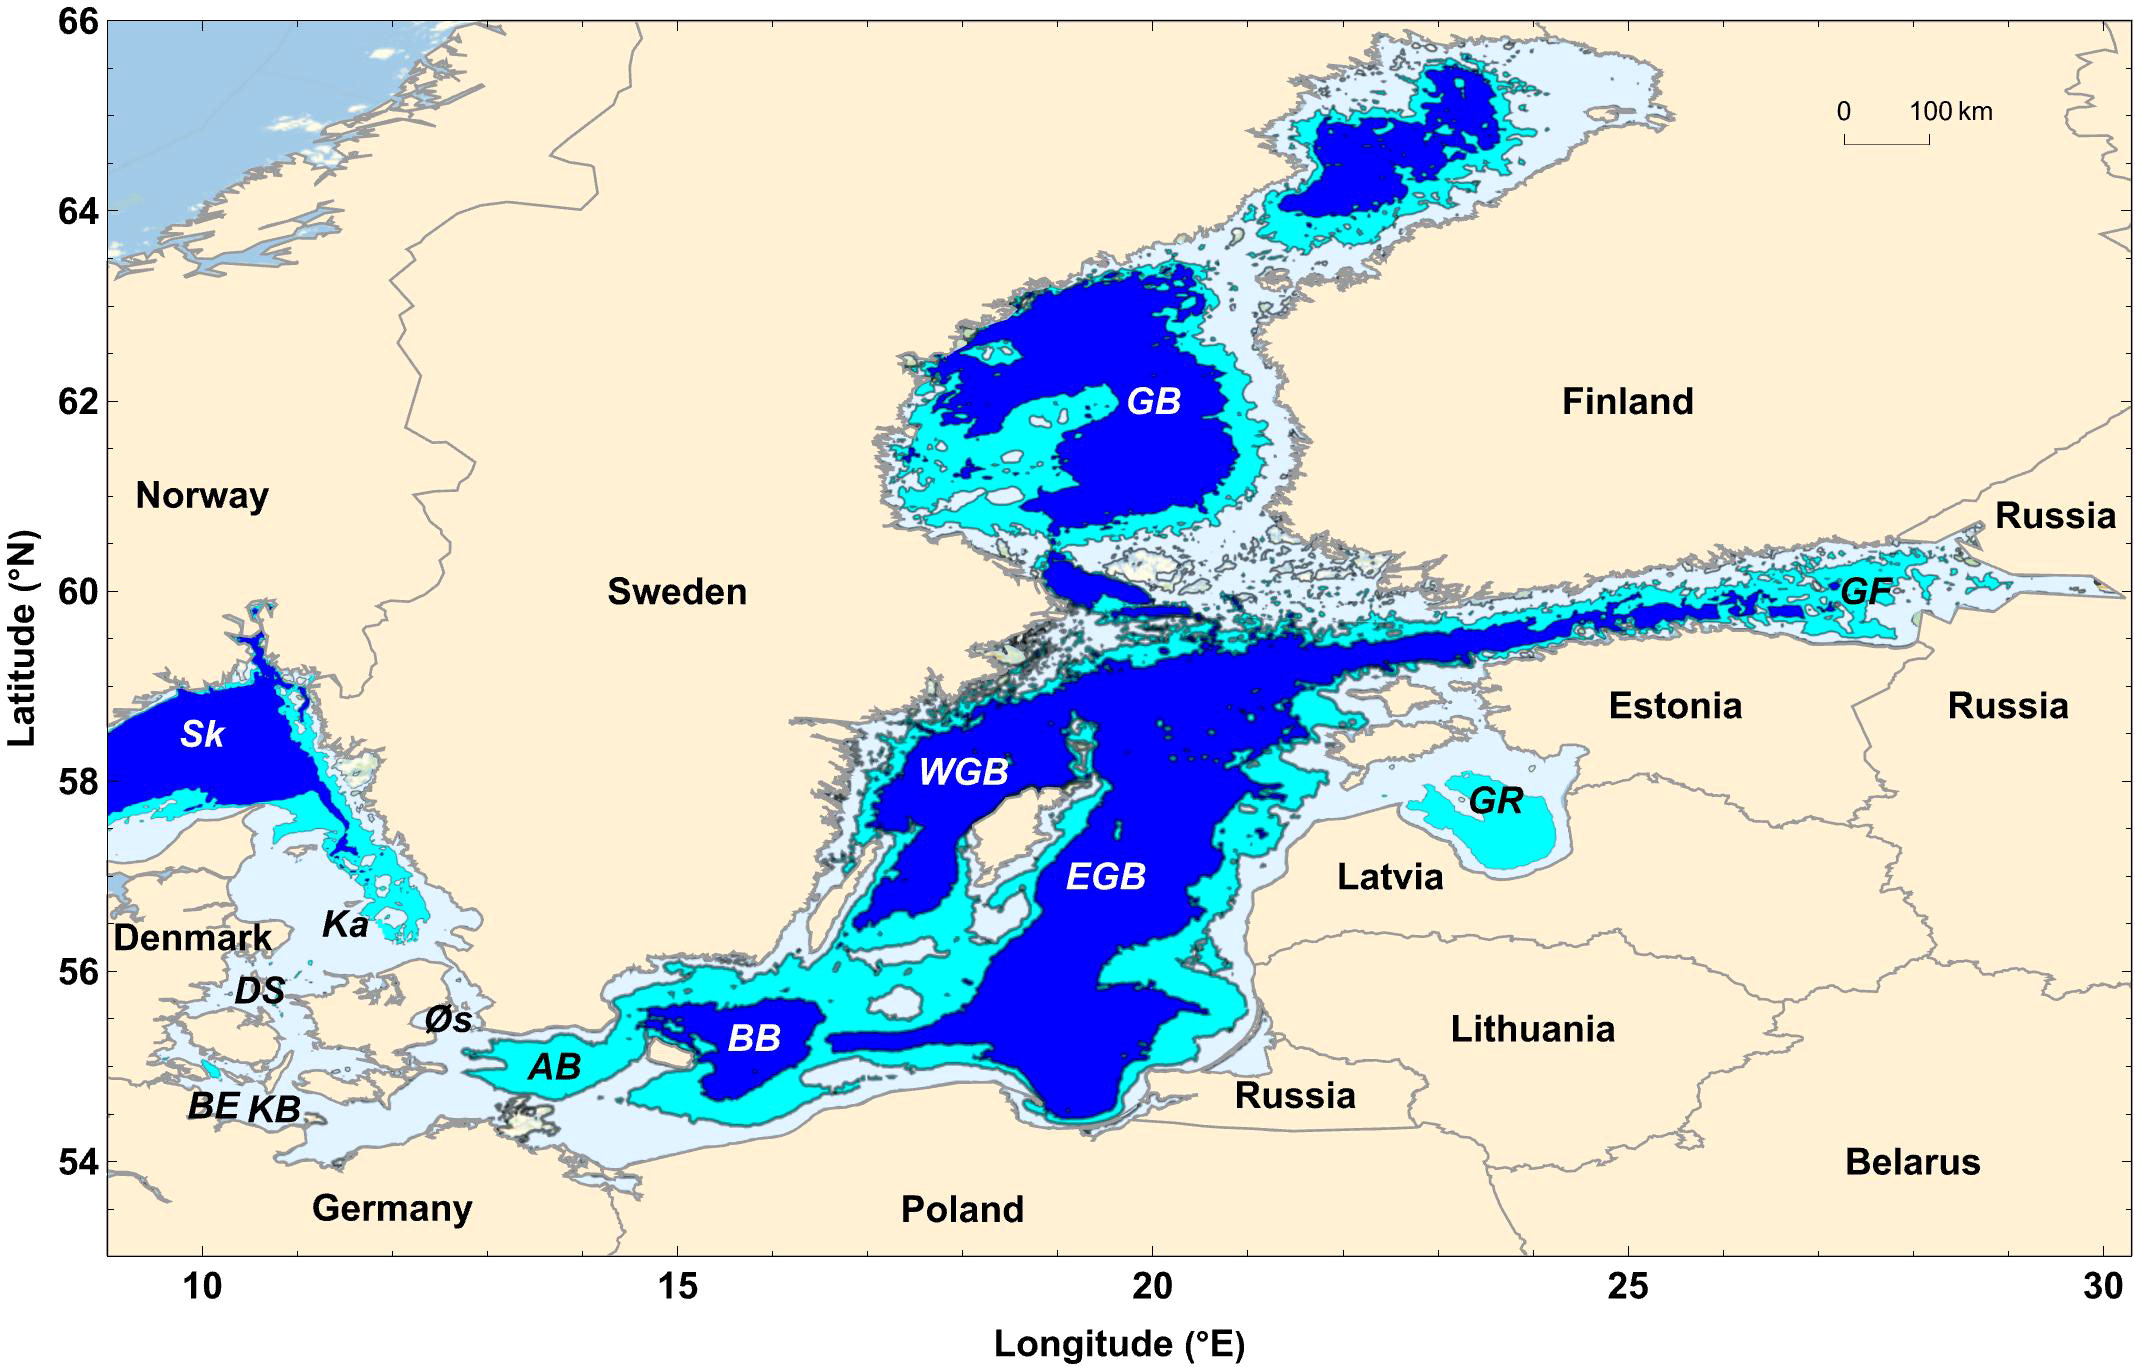
Figure 1 Map of the Baltic Sea and bordering countries. The map includes the Skagerrak (Sk), Kattegat (Ka), Danish straits (DS), Øresund (Øs), Kiel Bight (KB), Boknis Eck (BE), Arkona Basin (AB), Bornholm Basin (BB), Western Gotland Basin (WGB), Eastern Gotland Basin (EGB), Gulf of Riga (GR), Gulf of Finland (GF), and Gulf of Bothnia (GB). Colors indicate water depths (blue: > 65 m, cyan: 65 – 30 m, light blue: 0 – 30 m). The map was produced using Mathematica 13.
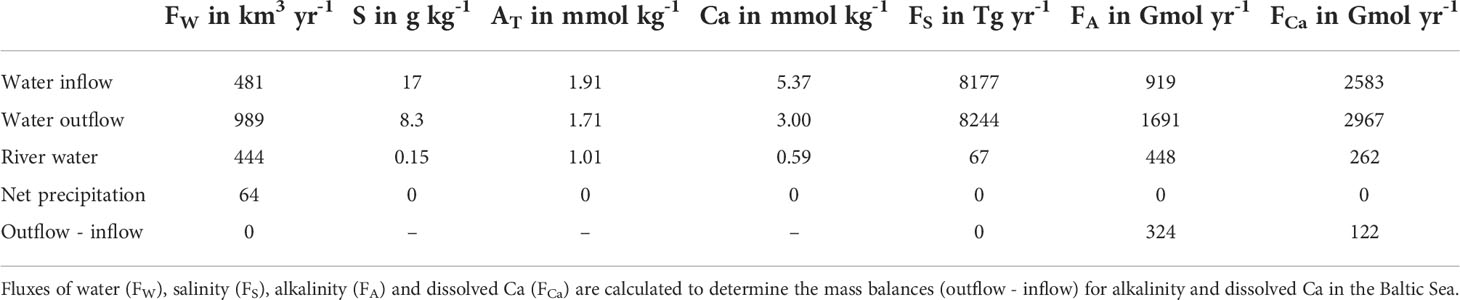
Table 1 Long-term mean budget of salinity, alkalinity and Ca in the Baltic Sea.
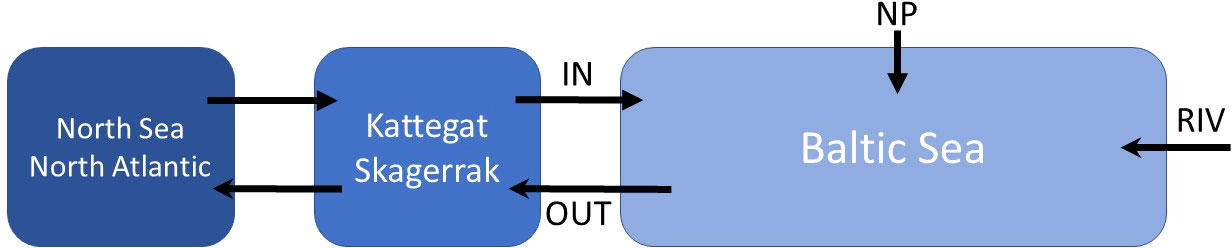
Figure 2 Fluxes considered in the water and dissolved species budgets of the Baltic Sea. IN: Fluxes from the Kattegat into the Baltic Sea across the Danish straits and the Øresund. OUT, Fluxes from the Baltic Sea to the Kattegat; NP, Net precipitation in the Baltic Sea; RIV, Riverine fluxes into the Baltic Sea.
In the long-term mean, saline water from the Kattegat enters the Baltic Sea (Figure 2) and low-saline water leaves the Baltic because of the freshwater surplus (Meier and Kauker, 2003a). Saltwater entering the Baltic Sea has a reduced salinity since saline North Sea water and brackish water masses leaving the Baltic Sea are mixed in the Skagerrak and Kattegat (Hordoir and Meier, 2010; Hordoir et al., 2013). The water flowing into the Baltic Sea from the Kattegat has a mean salinity of 17 (HELCOM, 1986) while the water flux has been estimated as 481 km3 yr-1 (HELCOM, 1986). The mean freshwater flux into the Baltic Sea averaged over the period 1902 – 1998 amounts to 508 km3 yr-1 where 444 km3 yr-1 are delivered by continental runoff (rivers) and 64 km3 yr-1 by net precipitation (precipitation - evaporation) across the Baltic Sea/atmosphere interface (Meier and Kauker, 2003a). Analysis of 78 rivers draining into the Baltic Sea shows that the mean salt content (total dissolved solids) of river water entering the Baltic is 0.15 g kg-1 as measured over the period 1996 – 2000 (Sun et al., 2017). The mean outflow of brackish water from the Baltic into the Kattegat corresponds to the sum of the water inflows ( , Table 1). The mean salinity of this outflowing water mass (Sout) is calculated applying a salinity balance where the salt outflow is equal to the sum of salt inflows ():
The calculated salinity of brackish surface water leaving the Baltic Sea falls into the range of surface water salinities (<6 - 14) measured in the Danish straits and the Øresund (Hordoir et al., 2013).
Alkalinity balance
AT in mean river water () entering the Baltic Sea is calculated as 1.01 mmol kg-1 applying bicarbonate concentrations and river water fluxes reported in Sun et al. (2017). AT of brackish outflow water () is derived from the linear relation between AT and S measured in the saline part of the central Baltic Sea (Gustafsson et al., 2014):
Water entering the Baltic Sea is assumed to be composed of seawater with a salinity of 35 (Ssw = 35) and brackish outflow waters (Sout = 8.3) that are mixed in the Skagerrak and Kattegat. The seawater fraction (fsw) of this two-component mixture is calculated as:
Seawater with Ssw = 35 entering the Skagerrak and Kattegat has an alkalinity of (Anderson and Dyrssen, 1981). AT of the inflowing water results as:
AT fluxes are calculated by multiplying AT concentrations and the corresponding water fluxes (Table 1). The AT source derived from the difference of AT outflow and inflow fluxes results as O−I−AT = 324 Gmol yr−1 (Table 1). This value is rather close to the AT excess derived from the BALTSEM model (380 Gmol yr-1, Gustafsson et al., 2019). This correspondence suggests that the simple geochemical mass balance approach applied above yields realistic estimates for the long-term mean of O-I-AT even though the real physical system simulated in BALTSEM is far more complex and dynamic than our simple modeling approach (Figure 2, Table 1).
Ca balance
In the following, the mass balance approach developed above is applied for Ca dissolved in Baltic Sea water. The dissolved Ca concentration in mean river water (Cariv) entering the Baltic Sea is calculated as 0.59 mmol kg-1 applying Ca concentrations and river water fluxes reported in Sun et al. (2017). Ca of brackish outflow water (Caout) is derived from the linear relation between Ca (in g kg-1) and chlorinity (Cl in g kg-1) reported for the saline part of the central Baltic (Kremling and Wilhelm, 1997):
where salinity and chlorinity (Cl in g kg-1) of Baltic Sea water are related as (Millero, 1978):
Applying Eq. (5) and (6) results in a Caout value of 3.0 mmol kg-1. Ca in seawater with S = 35 entering the Skagerrak and Kattegat is set to Casw= 10.28 mmol kg−1 (Chester, 2000). The Ca concentration in water flowing into the Baltic Sea from the Kattegat results as:
Ca fluxes are calculated by multiplying Ca concentrations and the corresponding water fluxes listed in Table 1. The Ca source derived from the difference of outflow and inflow fluxes results as O-I-Ca = 122 Gmol yr-1. Considering that two mol of AT are generated by the dissolution of one mol of CaCO3, O-I-Ca is sufficiently large to explain a major fraction of O-I-AT via carbonate dissolution (244 Gmol yr-1). The difference between O-I-AT (324 Gmol yr-1, Table 1) and AT attributed to CaCO3 dissolution (244 Gmol yr-1) might be largely explained by redox-related processes in the Baltic Sea (e.g. pyrite burial, nitrogen cycling) that may generate significant amounts of AT (Gustafsson et al., 2014; Gustafsson et al., 2019).
Uncertainties in flux estimates
In the calculations above, we assume for simplicity that the density of all considered water masses is equal to 1 g cm-3. Moreover, we assume that measured salinity values correspond to salt concentrations in g kg-1. Both assumptions are, strictly speaking, not correct (Millero and Kremling, 1976; Millero, 1978). However, the error introduced by these simplifications is probably negligible compared to the more relevant uncertainties discussed in the following paragraph.
In the mass balance calculations above, we apply a water flux of and a salinity of for the saline water masses entering the Baltic Sea (HELCOM, 1986). However, other estimates are available for these parameter values. Hence, the Arkona Basin can be used to assess the inflow of saltwater, since all saline water masses entering the Baltic Sea pass through this western-most Baltic basin (Figure 1). The mean inflow of saline deep water in the Arkona Basin amounts to 685 km3 yr-1 when averaged over the last century (Gustafsson, 2001). The mean salinity of this water mass is 14.3 and affected by mixing with salt-depleted water masses within the Baltic Sea (Gustafsson, 2001). The inflow into the basin has been estimated as only 598 km3 yr-1 with a mean salinity of 13.9 over the period 1979 – 1990 (Lehmann and Hinrichsen, 2002). The latter inflow and salinity estimates are somewhat lower than the long-term mean since the period 1979 – 1990 was marked by an unusually low inflow intensity (Lehmann and Hinrichsen, 2002). A much higher water influx from the North Sea (1359 km3 yr-1) has been estimated within the BALTEX program for the period 1979 – 2002 (Omstedt and Nohr, 2004). Unfortunately, the mean salinity of the inflowing water has not been determined in that program. The higher water flux estimated in BALTEX probably includes water fluxes that are not recorded in the Arkona Basin since the saltwater may be rapidly mixed with brackish surface water in the Skagerrak and Kattegat and transported back into the North Sea by outflowing water before it can enter the Baltic Sea.
In the following, we apply and (Gustafsson, 2001) and repeat our mass balance calculations (Eq. 1 - 7) to assess the magnitude of the AT and Ca imbalance (outflux - influx) for this alternative parameterization. The calculations yield O−I−AT = 323 Gmol yr−1 and O−I−Ca = 99 Gmol yr−1 . The AT estimate is very close to the value listed in Table 1 while the O-I-Ca value is significantly smaller than the previous estimate (122 Gmol yr-1, Table 1). Hence, the Ca mass balance is more affected by the uncertainty in the saline water influx than the AT balance which is probably related to the larger contrast in Ca concentrations between seawater and brackish Baltic Sea waters.
The main uncertainty in our flux estimates is related to temporal changes in AT and Ca concentrations detected over the last decades. AT in surface water of the central Baltic Sea increased by 100 µmol kg-1 over the period 1930 – 2010 (Schneider et al., 2015) and 70 µmol kg-1 over the period 1994 – 2014 (Müller et al., 2016). The data that were used to derive Eq. 2 and our estimate of 1.71 mmol kg-1 (Table 1) were measured during the BALTEX II phase in 2003 – 2012. To test how an AT change by 100 µmol kg−1 (0.1 mmol kg-1) may affect our balance calculations, AT in the water mass leaving the Baltic is decreased from (Table 1) to 1.61 mmol kg-1. Calculations with this updated value yields O-I-AT = 259 Gmol yr-1 which is still significant, but smaller than the standard value (324 Gmol yr-1, Table 1).
The Ca data that were used to derive Eq. 5 and our Caout estimate of 3.0 mmol kg-1 (Table 1) were measured in 1994 – 1995 (Kremling and Wilhelm, 1997). Ca measurements conducted in 1989 and salinity-Ca relationships reported for 1989 (Dyrssen, 1993) yield a Caout estimate of 3.1 mmol kg-1 while Ca concentrations measured over the period 1966 - 1970 (Kremling, 1969; Kremling, 1970; Kremling, 1972) and Ca-Cl relationships derived for this period (Anderson and Dyrssen, 1981) yield Caout= 2.9 mmol kg−1 . Ca concentrations measured in 1935 were apparently close to those measured over the period 1966 - 1970 (Gripenberg, 1937; Anderson and Dyrssen, 1981).
Taken at face value, these estimates would imply that Ca concentrations in the Baltic Sea peaked in 1989. Such a peak was, however, not observed in the AT data (Müller et al., 2016). One may speculate that the Ca peak was induced by acid rain precipitation accelerating CaCO3 dissolution in the Baltic Sea drainage area (Kremling and Wilhelm, 1997) that is not recorded in the AT data since AT may have been consumed by sulfuric acid addition. However, it is also possible that the different Caout estimates reflect the uncertainty in Ca data and observed Ca-salinity and Ca-Cl relationships. The error in O-I-Ca (122 Gmol yr-1) can be estimated as ± 70 Gmol yr-1 by applying Caout= 2.9 mmol kg−1 and 3.1 mmol kg-1 in our budget calculations. According to this approach, our O-I-Ca estimate is associated with a large error. Nevertheless, our budget calculations suggest that a significant fraction of the unaccounted AT source in the Baltic Sea can be attributed to CaCO3 dissolution.
Another uncertainty is related to the composition of mean river water entering the Baltic Sea and the riverine fluxes of AT and Ca that may have changed over the past decades. The samples used to derive the mean alkalinity and Ca concentrations in river water ( , Cariv= 0.59 mmol kg−1 , Table 1) were taken in 1996 – 2000 (Sun et al., 2017). Ca concentrations in river water entering the Baltic Sea were previously estimated by plotting Ca as a function of chlorinity (Cl) or salinity (S) and determining the concentration at the axis intercept (Cl = 0, S = 0) by linear regression (Gripenberg, 1937). For deep water sampled below the halocline in the Baltic Proper (BP) in 1935, this approach yielded a Ca concentration in fresh water of 0.56 mmol kg-1 (Gripenberg, 1937). Resampling of saline BP waters yielded intercept values of 0.62 mmol kg-1 in 1967, 0.54 mmol kg-1 in 1968, 0.57 mmol kg-1 in 1969, 0.50 mmol kg-1 in 1970, 0.98 mmol kg-1 in 1989 and 0.70 mmol kg-1 in 1994 - 1995 (Kremling, 1969; Kremling, 1970; Kremling, 1972; Dyrssen, 1993; Kremling and Wilhelm, 1997). The values recorded over the period 1935 – 1970 indicate a mean intercept value of 0.56 ± 0.04 mmol kg-1 which is close to the mean Ca concentration measured in modern river water (0.59 mmol kg-1, Sun et al., 2017). A peak value is reported for 1989 and a decline from this peak in 1994 – 1995 that is also reflected in a peak of the calculated Ca concentration in brackish seawater leaving the Baltic Sea (Caout). The Ca peak was attributed to an increase in carbonate weathering in the Baltic Sea catchment area induced by acid rain precipitation (Kremling and Wilhelm, 1997). It is, however, questionable whether these intercept values do indeed reflect the composition of river water since this simple two-endmember-approach neglects net precipitation of freshwater and Ca release from carbonate rocks eroded at the coast and the seabed. Moreover, time-series data on Ca concentrations in river waters entering the Baltic Sea indicate a stable Ca baseline over the past decades (Sun et al., 2017). It is, hence, more likely that the dynamic intercept values reflect other processes such as decadal variations in water fluxes (net precipitation, salt water inflow, run-off) and, potentially, changes in CaCO3 erosion/dissolution at the seabed.
Some of the dissolved Ca generation in the Baltic Sea might also be explained by processes other than carbonate dissolution that could e.g. be related to cation-exchange within varved clay formations deposited in the Baltic basins during late glacial freshwater phases (Suess, 1976). Porewater studies clearly show that dissolved Ca is released into the porewater of Baltic Sea sediments when brackish seawater penetrates into lacustrine clays deposited during these freshwater periods (Suess, 1976). Most of the exchange sites on the lacustrine clays are occupied by Ca2+ ions that are exchanged with Mg2+, K+ and Na+ when the modern brackish water diffuses into the lacustrine clays (Suess, 1976). The diffusive Ca flux from these lacustrine sediments induced by cation exchange can be calculated from porewater data reported in Suess (1976). Dissolved Ca concentrations in sediments deposited in the Bornholm Basin typically increase from about 6 mM (mM = mmol dm-3 = mol m-3) at the surface to about 14 mM at 5 m sediment depth which corresponds to a concentration gradient of 1.6 mol m-4. Applying a mean porosity of 80% and a molecular diffusion coefficient in sediments of 0.014 m2 yr-1 (Boudreau, 1997), the diffusive Ca flux into bottom waters results as 18 mmol m-2 yr-1. Integrated over the entire Baltic Sea floor (about 400 000 km2), this flux would yield a maximum Ca release of up to 7 Gmol yr-1 which may account for some of the calculated Ca imbalance (122 Gmol yr-1, Table 1). More recently, lacustrine clays were drilled during IODP Leg 347 (Andrén et al., 2015) at the Bornholm Basin and an estuary on the east coast of northern Sweden. Increasing Ca-gradients were observed (1.1 and 1.5 mol m-4, respectively), that may be attributed to cation exchange. Even though, it should be noted that the real flux is probably smaller than the maximum estimate of 7 Gmol yr-1 since these deposits are remnants that have been identified only over parts of the Baltic Sea floor. Hence, we will discuss in the following sections only whether the erosion and dissolution of carbonate-bearing rocks at the coast and seabed may account for the calculated O-I-Ca and O-I-AT values.
Carbonate sources
Coastal erosion
Carbonate-bearing rocks such as limestone and chalk as well as till are found along the coast of the Baltic Sea (Łabuz, 2015). Limestone and chalk occur mostly along the coast of Estonia, on a number of Danish and German islands (e.g. Sjælland, Rügen) and along parts of the Swedish coast (Gotland, Öland and Scania) even though most of the Swedish coast is composed of igneous rocks and sandstone (Łabuz, 2015). These carbonate rocks can form cliff coasts that are subject to erosion (Łabuz, 2015). The chalk cliff coast of Rügen, where cliff heights often exceed 100 m, retreats at an average rate of 0.29 – 0.41 m yr-1 (Wziatek et al., 2019). Chalk cliffs on the Estonian Osmussaar Island have a mean height of 5 m. They retreat at a mean rate of only 0.07 m yr-1 and produce 0.5 m3 of carbonate sediment per m of shoreline and per year (Orviku et al., 2013). Cliffs on the Estonian Pakri Peninsula, that are mostly composed of limestone and have a mean height of 25 m, retreat at a rate of 0.25 m yr-1 and produce carbonate debris at a rate of 6 m3 m-1 yr-1 (Orviku et al., 2013). The total length of the Baltic coast composed of limestone and chalk and the mean erosion rates of these pure carbonate rocks are presently unknown. Assuming a length of 100 km, a mean cliff height of 20 m, a retreat rate of 0.2 m yr-1, and a dry bulk density of 2 tons m-3, our best guess for the CaCO3 flux induce by erosion of chalk and limestone cliffs results as 0.8 Tg yr-1 (8 Gmol yr-1).
Till deposited from ice sheets is very common along the entire southern coast of the Baltic Sea extending from Germany to Latvia (Łabuz, 2015). The external Baltic Sea coastline of Germany, Poland, Lithuania and Latvia has a total length of about 2000 km (Figure 1). In this region, the coastline retreats by more than 1 m per year (Weisse et al., 2021). The erosive coast is characterized by a series of sandy barrier islands and dunes connected with till cliffs (Weisse et al., 2021). The till contains about 3 - 27 wt-% CaCO3 (Averes et al., 2021) with a mean CaCO3 content of about 17.5 wt-% in the southern Baltic Sea (Healy and Werner, 1987). Studies on coastal cliff erosion indicate that about 2 - 7 m3 of till are eroded along the German coast of the Baltic per meter cliff length per year (Schwarzer et al., 2003; Averes et al., 2021). The total length of cliffs bordering Germany is 276 km corresponding to 27% of the coastline (Łabuz, 2015).
Till cliffs cover 65 km or 13% of the Polish coast (Łabuz, 2015). Cliff erosion rates were measured on Wolin Island where cliffs are up to 93 m high (Kolander et al., 2013). The mean retreat rate averaged over a period of 30 years amounts to 0.14 m yr-1 in this area (Kolander et al., 2013). The corresponding volume flux of till can be estimated as 2 - 10 m3 m-1 yr-1 applying a cliff height of 15 - 71 m (Kolander et al., 2013). The volume fluxes are, hence, similar to those observed at the German coast.
Assuming that 20% of the 2000 km long erosive southern coastline of the Baltic Sea is composed of till (Averes et al., 2021) and that the till is eroded at an average rate of 5 m3 m-1 yr-1, the total till erosion rate can be estimated as 2 x 10⁶ m3 yr-1. Applying a till bulk density of 2 tons m-3 (Healy and Werner, 1987), the mass flux amounts to 4 Tg yr-1. The corresponding fine-grained lithic sediment flux is 2 Tg yr-1 for a mud (clay and silt) content of 50 wt-% (Healy and Werner, 1987). This flux is consistent with a recent study that estimated an annual flux of 1.5 – 3.6 Tg of fine-grained sediment produced by cliff erosion along the Danish, Swedish, German and Polish coasts of the Baltic Sea (Porz et al., 2021). The CaCO3 flux results as 0.7 Tg yr-1 for a mean CaCO3 content of 17.5 wt-% (Healy and Werner, 1987).
The dissolution of CaCO3 released by the erosion of carbonate-bearing rocks (0.8 Tg yr-1 derived from limestone and chalk, 0.7 Tg yr-1 from till) would induce a Ca release of 15 Gmol yr-1 and an AT production of 30 Gmol yr-1. These fluxes are significantly smaller than the O-I-Ca and O-I-AT values estimated above (Table 1).
It should, however, be noted that cliff erosion rates are difficult to assess and that rates depend critically on the time period considered and the method applied. For instance, a short term study (1.5 years) on moraine cliff erosion using terrestrial laser technology (Terefenko et al., 2019) yielded volume fluxes for German and Polish sites (12 – 45 m3 m-1 yr-1) that clearly exceed the mean value applied here (5 m3 m-1 yr-1). Moreover, the CaCO3 content of till may vary along the erosive coast of the Baltic Sea extending from German to Latvian coastal areas. Hence, till deposited in Finland has no significant CaCO3 content even though some of the Finnish bedrock formations (e. g. Muhos sedimentary rock) contain large amounts of carbonate (Lintinen, 1995). It is, hence, possible that the high CaCO3 content measured in German till samples (17.5 wt-%, Healy and Werner) is not representative for the entire erosive coast of the Baltic Sea. In any case, our review of cliff erosion rates implies that additional CaCO3 sources are required to explain the O-I-Ca and O-I-AT fluxes (Table 1).
Seabed erosion
Much of the shallow seafloor area of the Baltic Sea is dominated by erosion rather than sediment deposition. Net sedimentation occurs only on about one third of the Baltic seabed (Kaskela et al., 2012) mostly at greater water depths below the halocline (Almroth-Rosell et al., 2011). In the remaining area, sediments are transported (50% of the seabed) or eroded (17%, Kaskela et al., 2012). Most of the eroded and transported fine-grained sediments are ultimately delivered to the deep basins, which serve as depocenters for fine-grained material. The underlying bed rock that is exposed and possibly eroded in the erosive regions is composed of sedimentary rocks (Kaskela et al., 2012). Only in the northern parts of the Baltic, crystalline rocks are exposed at the seabed. In the remaining area, the exposed seabed is partly composed of till, i.e. the same material that forms large parts of the coastal cliffs (Schwarzer, 2010). In the southern Baltic Sea off the coast of Mecklenburg-Vorpommern (Germany), the erosive seafloor is covered by till up to water depths of 50 m (Gingele and Leipe, 1997). In the south-western Baltic Sea, the seafloor at 5 – 15 m water depth is covered by a thin layer of lag sediments that are formed by the erosion of the underlying till (Schwarzer, 2010). These lag sediments are composed of pebbles, cobbles and boulders while the fine sediment components (sand, silt, clay) of the till are transported away by bottom currents (Schrottke et al., 2006). Carbonate deposited in the till is physically eroded and ultimately dissolved at the seabed.
The erosion rate of till exposed at the bottom of Kiel Bight located in the south-western Baltic Sea (Figure 1) was determined as 2.1 – 2.4 cm yr-1 at 2 – 3 m water depths and 0.16 cm yr-1 at 10 m water depth (Wefer et al., 1976). Additional measurements conducted in front of three active cliffs provided till erosion rates of 0.7 – 3.6 cm yr-1 (Schwarzer et al., 2014). The erosive region covers 17% (Kaskela et al., 2012) of the total Baltic Sea floor area (about 400 000 km2) which corresponds to an erosive area of about 68 000 km2 (Almroth-Rosell et al., 2011). If 25% of this area would be covered by till and if till erosion would proceed at a rate of 0.1 – 1.0 cm yr-1, a total till volume of 17 x 106 m3 to 170 x 106 m3 would be eroded each year. Applying a till bulk density of 2 t m-3 (Healy and Werner, 1987), the mass fluxes provided by seabed erosion would result as 34 – 340 Tg yr-1. For a clay/silt content of 50 wt-% (Healy and Werner, 1987), the flux of fine sediment results in 17 - 170 Tg yr-1. Applying the full range of observed carbonate contents in till (3 - 27 wt-% CaCO3, Averes et al., 2021), results in possible CaCO3 fluxes of 1 - 92 Tg yr-1 for seabed erosion.
The total CaCO3 flux from coastal and seabed erosion would amount to 2 - 94 Tg yr-1 for till-CaCO3 contents of 3 - 27 wt-% CaCO3 (Averes et al., 2021). Dissolution of the eroded carbonate would yield Ca fluxes of 20 - 940 Gmol yr-1 that may be high enough to explain the O-I-Ca value derived above (122 Gmol yr-1, Table 1). It is, however, not possible to conclude at this stage that erosion of carbonate-bearing sedimentary rocks delivers sufficient CaCO3 to close the Ca budget of the Baltic Sea since, both, erosion rates and CaCO3-contents of eroded till are poorly constrained. In the following section, we, hence, set up a mass balance for fine-grained sediments in the Baltic Sea to better constrain the basin-wide erosion rate and estimate the mean CaCO3 content of the eroded material.
Fine-grained sediment balance of the Baltic Sea
Rivers transport fine-grained suspended solids to the Baltic Sea. The corresponding riverine particle flux into the Baltic Sea has been estimated as 4.5 Tg yr-1 (Lajczak and Jansson, 1993). Suspended particles are also exchanged between the Baltic Sea and the North Sea across the Danish straits. High kaolinite contents in muddy surface sediments deposited in the southern basins of the Baltic Sea may indicate that a fraction of this clay mineral is imported from the North Sea where kaolinite-rich deposits may be eroded and transported into the Baltic during saltwater inflow events (Gingele and Leipe, 1997; Gingele and Leipe, 2001; Porz et al., 2021). The mean annual influx of North Sea sediments caused by these events has been estimated as 0.1 Tg yr-1 (Porz et al., 2021). This flux is very small compared to the riverine particle input. Moreover, the particle export associated with the outflow of brackish water from the Baltic into the North Sea may exceed the particle import (Porz et al., 2021). Hence, the particle exchange with the North Sea can be neglected from a mass balance perspective.
The first comprehensive map of modern sedimentation rates (SR in cm yr-1) in the Baltic Sea was recently provided by Mitchell et al. (2021). The authors used a total of 430 stations from the Baltic Sea for which 137Cs-based SRs are reported and compiled in the EMODnet-Geology data base. The 137Cs enrichment used for the SR calculation is assumed to reflect the deposition of 137Cs emitted during the Chernobyl accident in April 1986. The reported values, hence, present SRs averaged over the time period from 1986 to the date of sampling. A machine-learing approach was applied (Random forest) to produce a SR map from these 137Cs-dated cores covering almost the entire Baltic Sea (Mitchell et al., 2021).
The following equation was applied to transform the reported SR values into mass accumulation rates (MAR in g cm-2 yr-1):
where dS is the average grain density and Pmean the mean porosity (as a unitless fraction) of sediments deposited above the Chernobyl peak. We applied dS = 2.5 g cm−3 which corresponds to the value previously employed for surface sediments deposited in the Baltic Sea (Ilus et al., 2001; Mattila et al., 2006).
A total of 963 porosity values measured by GEOMAR in muddy surface sediments from the Southern Baltic Sea (Kiel Bight) and the Gotland Basin were used to estimate the mean porosity of sediments deposited above the Chernobyl peak (see Supplement S1 for further details). This data base yields the following mean porosities ( ± 1 standard deviation): 0 – 5 cm: 0.920 ± 0.038, 0 – 10 cm: 0.905 ± 0.040, 0 – 15 cm: 0.899 ± 0.042, 0 – 20 cm: 0.894 ± 0.043. Since the Chernobyl peak typically occurs at 5 – 20 cm (Ilus et al., 2001; Kotilainen et al., 2021), we applied P = 0.90 for the MAR calculation. The corresponding dry bulk density (DBD = dS (1 - P)) amounts to 0.25 g cm-3. This DBD value is close to values previously reported for the Arkona Basin (Leipe et al., 2011). It should, however, be noted that much lower DBD values (DBD ≈ 0.05 g cm-3) were reported for extremely water- and POC-rich surface sediments deposited of the Eastern Gotland Basin at water depths larger than 200 m (Leipe et al., 2011, Supplement S1).
Eq. (8) is applied to convert the SR map provided by Mitchell et al. (2021) into a corresponding MAR map and to calculate area-integrated sediment accumulation rates (in Tg yr-1). Since we aim to derive a mud balance, we limit our analysis to those areas where fine-grained sediments dominate (see Supplement S2 for further details). We use the EMODnet-Geology seabed substrate map at a map scale of 1: 1,000,000 (Seabed substrate 1:1M, https://www.emodnet-geology.eu/map-viewer/?p=seabed_substrate). This map provides full coverage of the Baltic Sea at a thematic resolution of five substrate classes (mud to muddy sand, sand, coarse substrate, mixed sediment, and rock and boulders). The mud to muddy sand class is composed of six textural classes (Folk, 1954). However, full coverage of Baltic Sea seabed substrates is neither provided at this detailed thematic resolution nor an intermediate resolution, subdividing the mud to muddy sand class into three textural classes (Kaskela et al., 2019). Hence, our estimates of fine-grained sediment accumulation relate to the mud to muddy sand class without any further differentiation.
The area where mud to muddy sand accumulates (132 955 km2) accounts for about one third of the total seafloor area and corresponds to the region where sediment accumulation is the dominant process rather than sediment transport and erosion (Kaskela et al., 2012). Our analysis reveals a high accumulation rate of 139 Tg yr-1 over this area (Figure 3) that clearly exceeds the riverine particle input (4.5 Tg yr-1, Lajczak and Jansson, 1993) and the particle input from the North Sea. We, hence, conclude that most of the fine-grained particles deposited in the Baltic Sea are provided by coastal and seabed erosion. Mineralogical studies confirm that fine-grained sediments deposited in major basins of the southern Baltic Sea (Arkona and Bornholm basins) and at the southern coast are mostly derived from glaciogenic material (till) eroded at the coast and at the seabed while riverine signatures are only dominant in sediments deposited close to river mouths (Gingele and Leipe, 1997; Kairytė and Stevens, 2009).
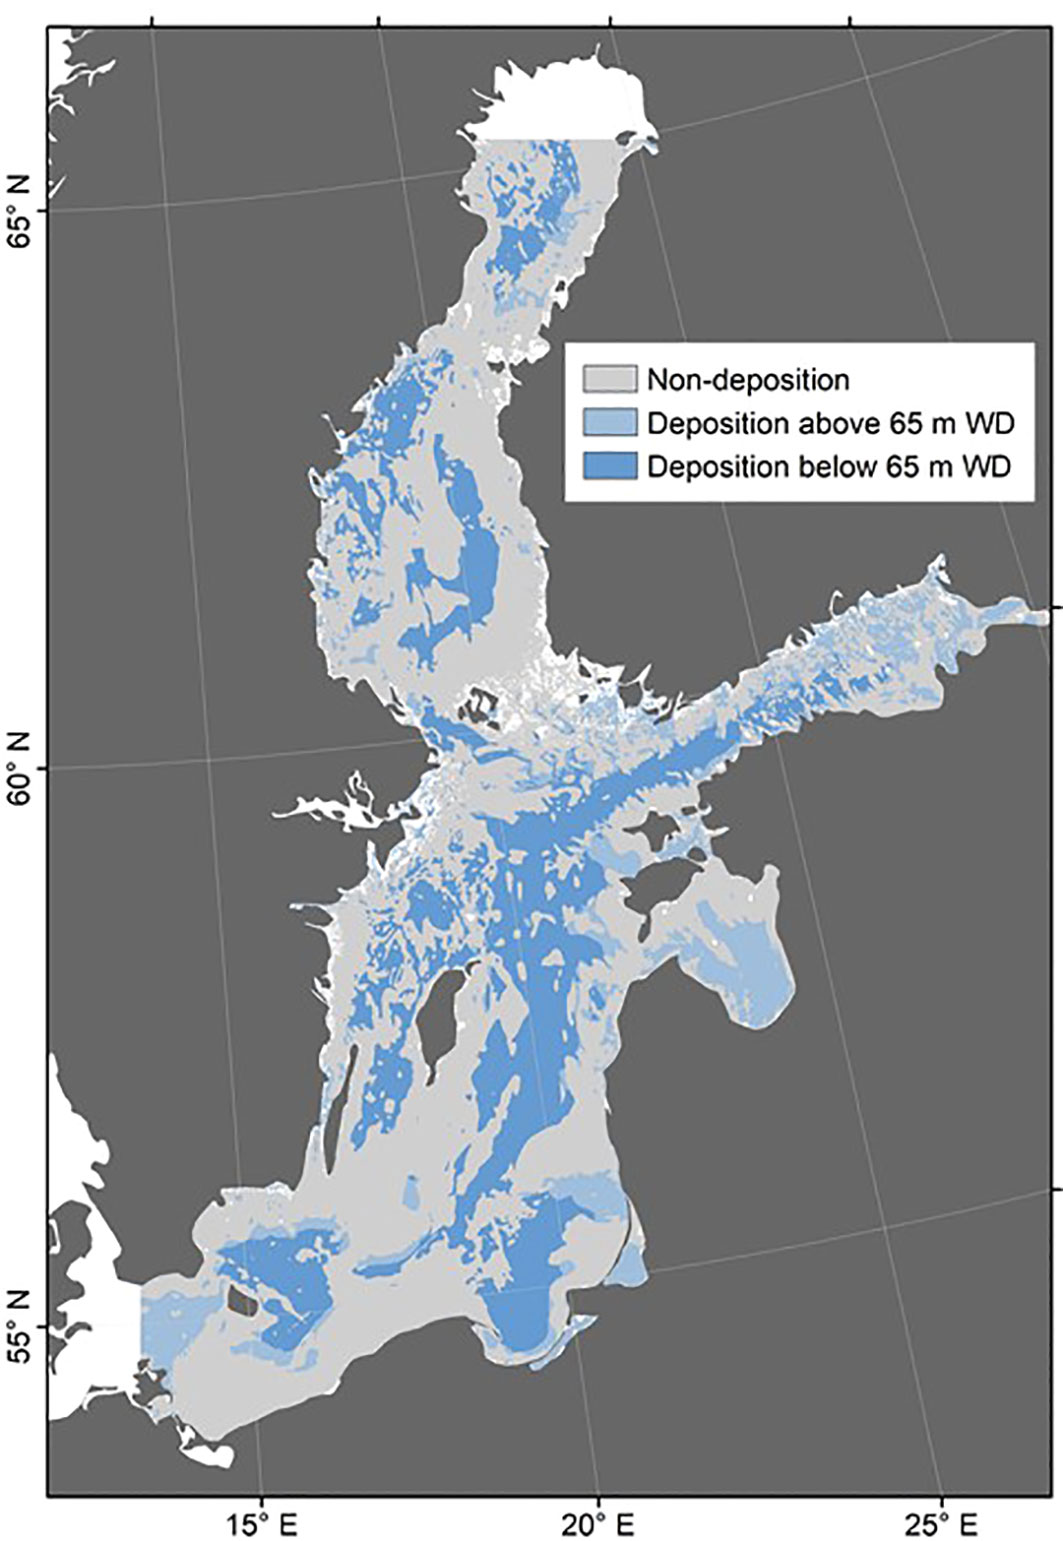
Figure 3 Overview of the studied area showing areas of assumed deposition (substrate class mud to muddy sand according to the EMODnet-Geology Seabed Substrate 1:1M map), split into areas shallower and deeper than 65 m water depth (WD) based on EMODnet Bathymetry Consortium (2020). Also shown are areas of assumed non-deposition (substrate classes sand, coarse substrate, mixed sediment, rock and boulders, and no data according to the EMODnet-Geology Seabed Substrate 1:1M map).
The basin-wide accumulation rate of fine-grained material derived above (139 Tg yr-1) can be used to constrain the erosion rate of fine-grained material along the coast and at the seabed. It should, however, be considered that the muddy sand included in our estimate of fine-grained sediment accumulation may contain sizable fractions of sand and that mud is not only composed of lithic components but contains biogenic material derived from plankton biomass and the adjacent land area. The mean concentration of particulate organic carbon in muddy Baltic Sea sediments can be estimated as 5 wt-% (Leipe et al., 2011). Considering the elemental composition of marine organic matter (Sarmiento and Gruber, 2006), this carbon content corresponds to an organic matter content of about 10 wt-%. The mean biogenic opal content amounts to about 5 wt-% (Leipe et al., 2011). Carbonate contents in muddy surface sediments deposited in the deep basins are usually <1 wt-% (Leipe et al., 2011) since CaCO3 delivered by erosion is rapidly dissolved in surface sediments by metabolic CO2 produced by the degradation of plankton biomass deposited at the seabed (Nilsson et al., 2019). Hence, the total content of biogenic matter amounts to about 15 wt-%. The accumulation rate of lithic fine-grained material amounts to 118 Tg yr-1, accordingly. Considering that 4.5 Tg yr-1 are provided by rivers, the erosion rate of fine-grained material results as 114 Tg yr-1. This value falls into the range of values derived from field observations (19 - 172 Tg yr-1) where most of the material seems to be provided by seabed erosion (17 - 170 Tg yr-1). The high accumulation rate of fine-grained material derived from 137Cs data, hence, supports the hypothesis that the Ca excess in Baltic Sea water may be largely provided by seabed and coastal erosion of CaCO3-bearing till.
The mean bulk CaCO3 content of eroded till (containing 50% coarse material) that is required to reach the Ca flux derived in Table 1 (122 Gmol yr-1) would amount to ca. 5%. This value falls into the lower range of carbonate contents observed in Baltic till (3 - 27 wt-% CaCO3, Averes et al., 2021). It is significantly lower than the mean CaCO3 content in till at the German coast (17.5%) which may suggest that till-CaCO3 contents decline in north-eastern direction along the coast as indicated by the low CaCO3 abundance in Finish till (Lintinen, 1995). It is, however, also possible that other fine-grained material accumulates at the seabed. Hence, erosion of salt marshes and lowlands composed of weathered till and other fine-grained and carbonate-depleted material occurs e.g. along parts of the Danish, Swedish and German coast (Łabuz, 2015). This largely CaCO3-free material may dilute the till-derived sediments and contribute to the low CaCO3 content calculated above.
Seafloor areas at shallow water depths above the permanent halocline located at about 65 m water depths are subject to frequent sediment erosion and re-deposition events (Almroth-Rosell et al., 2011). Moreover, Chernobyl 137Cs may be mixed down-core by intense bioturbation which would result in an overestimate of SD and MAR values. An ideal 137Cs depth profile in Baltic Sea sediments should feature a large and sharp 137Cs peak representing the Chernobyl accident in 1986 overlying a smaller and broader peak related to the 137Cs release during nuclear weapons testing that started in 1952 and reached a maximum in the early 1960s (IAEA, 1998). The latter peak is significantly reduced since more than two half-lives of 137Cs have now passed since radionuclides were released during testing. However, many 137Cs profiles measured in coastal sediments do not show these peaks but rather a mixed surface layer enriched in 137Cs (HELCOM, 2007). For these sites, the transition to the largely 137Cs-free sediments below is then assumed to represent either the year 1986 (Mattila et al., 2006) or the early 1950s (Winogradow and Pempkowiak, 2014), i.e. the period when large-scale atomic bomb tests started. 137Cs dating is, hence, ambiguous when surface sediments are mixed by erosion-redeposition cycles and bioturbation.
To address this issue, we also calculated sediment deposition in accumulation areas located at >65 m water depth (Figure 3) where physical and biological sediment reworking is assumed to proceed less frequently (Almroth-Rosell et al., 2011; Virtasalo et al., 2011). The EMODnet bathymetric map was used to define seafloors located at >65 m (EMODnet Bathymetry Consortium, 2020). The resulting accumulation rate of 85 Tg yr-1 over an area of 88 063 km2 still falls into the range of erosion values derived from field observations (19 - 172 Tg yr-1). For this estimate, a correspondingly higher till-CaCO3 content (ca. 8%) would be required to reach the excess Ca flux listed in Table 1. This value still falls into the lower range of carbonate contents observed in Baltic till (3 - 27 wt-% CaCO3, Averes et al., 2021). Hence, the available 137Cs data support our hypothesis that dissolution of CaCO3 provided by till erosion may account for the Ca excess in Baltic Sea water.
Sedimentary CaCO3 balance and dynamics of CaCO3 turnover at the seabed
CaCO3 contents in surface sediments retrieved from the Baltic Sea are reported in Leipe et al. (2011). The authors note that CaCO3 contents in the deep basins are generally low (<1 wt-%) even though the source material (till) contains significant amounts of CaCO3. Only surface sediments deposited in the Gotland Deep (1.1 wt-%), Mecklenburg Bay (1.7 wt-%) and the Gulf of Finland (5.8 wt-%) contain significant amounts of CaCO3 (Leipe et al., 2011). These data confirm that most of the till-CaCO3 is dissolved at the seabed.
However, carbonates are not only dissolved in surface sediments but may precipitate from oversaturated porewaters (Suess, 1979). These authigenic carbonates can be found down to several meters sediment depths (Lepland and Stevens, 1998). They are usually enriched in Mn and can contain significant amounts of Fe and Mg (Suess, 1979; Jakobsen and Postma, 1989). Mn-rich carbonates (Ca-bearing rhodochrosite) may form at high rates after deep basins are flooded with oxygen-bearing and salt-rich bottom waters during major inflow events (Huckriede and Meischner, 1996; Neumann et al., 1997). The highest contents of authigenic carbonates are, however, found in sediment layers that are enriched in organic carbon (Lepland and Stevens, 1998; Virtasalo et al., 2011). This observation can be explain by anoxic degradation processes that provide AT which is required for authigenic carbonate formation (Lepland and Stevens, 1998). The contribution of these authigenic carbonates to the AT and Ca balance of the Baltic Sea is largely unknown and neglected in current AT balances (Gustafsson et al., 2019). The benthic AT source term considered in these mass balances may be smaller than currently assumed since a significant fraction of the AT generated via e.g. pyrite and sulfur burial (44 Gmol yr-1 Gustafsson et al., 2019) may not be released into ambient bottom waters but bound in authigenic carbonates (Lepland and Stevens, 1998; Wallmann et al., 2008). More till-CaCO3 erosion and dissolution would be required to compensate for authigenic carbonate formation if the latter process fixes significant amounts of seawater AT and Ca.
Plankton productivity in the Baltic Sea is dominated by diatoms and dinoflagellates with occasional contributions by mixotrophic ciliates, diazotrophs and dictyochophyceae (Wasmund et al., 2017). The major pelagic CaCO3 producer Emiliania huxley occurs in the Skagerrak (Figure 1) where it can form extensive blooms (Van der Wal et al., 1995). In Kiel Bight (Figure 1), E. Huxley and other coccolithophores occur only sporadically and at low abundance (Wasmund et al., 2008). Coccolithophores and their coccoliths have not been detected in water column samples taken in the Baltic Proper, Gulf of Riga and Gulf of Bothnia (Tyrrell et al., 2008). Hence, deposition of planktonic carbonate material may not contribute significantly to the sedimentary CaCO3 budget. However, biomarker and DNA analysis indicate the presence of coccolith-producing species belonging to the order Isochrysidales throughout the Baltic Sea (Kaiser et al., 2019). If coccoliths would be buried at a significant rate, even more dissolution of till-CaCO3 would be required to compensate for burial of pelagic CaCO3.
Time-series data are available for Boknis Eck located in Kiel Bight (Figure 1) where surface sediments were taken over a period of one year (Feb. 2010 – Feb. 2011) at approximately monthly resolution (Dale et al., 2013). The data show an interesting seasonal pattern with high CaCO3 contents (4- 6 wt-%) during winter and early spring (Feb. – March) and low values during the rest of the year (around 2 wt-%, Figure 4). These CaCO3 concentrations are significantly lower than those in local till (17.5 wt-%, Healy and Werner) which again confirms that most of the eroded till-CaCO3 is dissolved at the seabed.
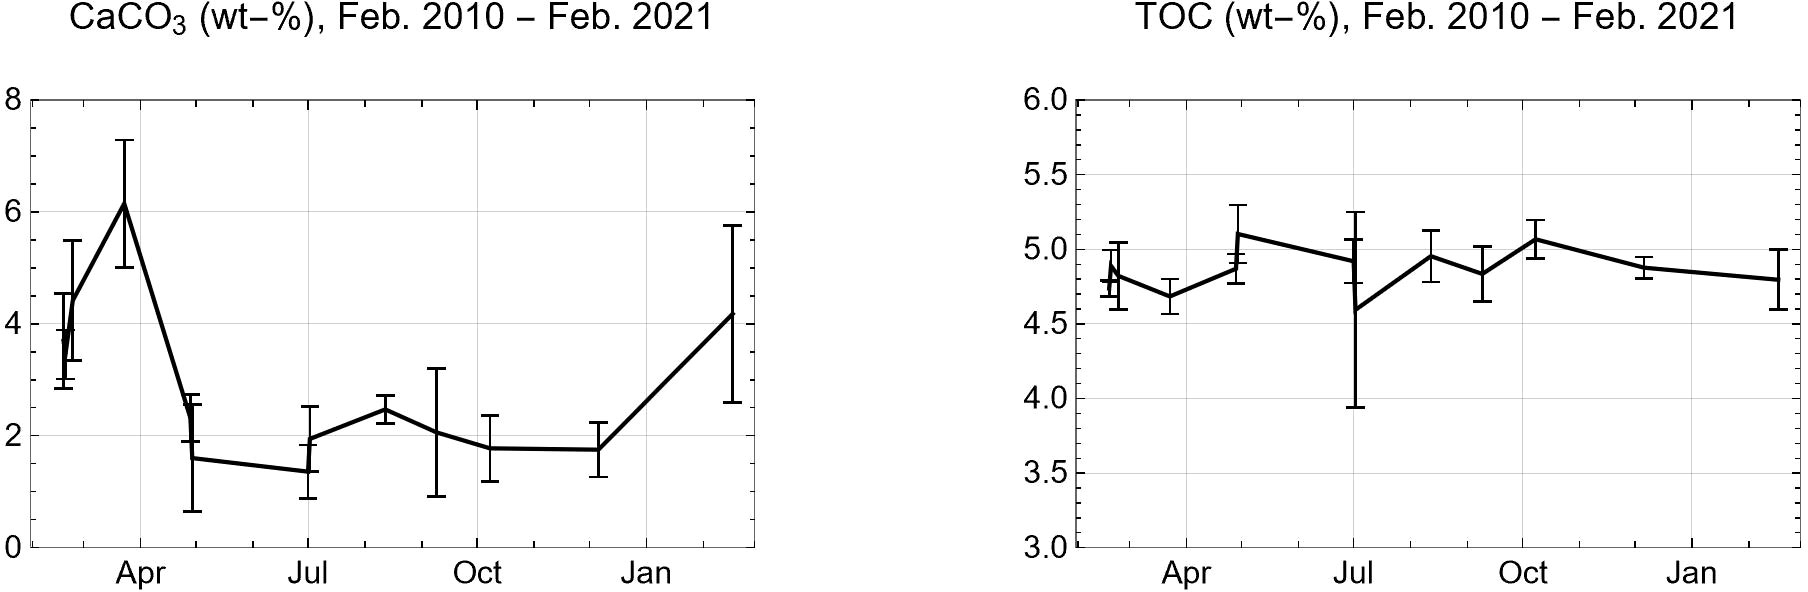
Figure 4 Mean concentrations of CaCO3 and total organic carbon (TOC) in surface sediments (0 – 5 cm sediment depth) taken in Boknis Eck from Feb. 2010 to Feb. 2011 (Dale et al., 2013). Error bars indicate one standard deviation from the mean.
The plankton bloom that typically occurs in Kiel Bight during the early spring season (Feb. - March) is clearly dominated by diatoms (Wasmund et al., 2017). Dinoflagellates are present in the bloom (Wasmund et al., 2017) while coccolithophores have not been observed during the spring bloom season (Wasmund et al., 2008). The CaCO3 peak at Feb- March is, thus, not caused by the deposition of planktonic CaCO3 but can be ascribed to the deposition of CaCO3-rich till that is eroded at the surrounding coast (Averes et al., 2021) and erosive seafloor (Wefer et al., 1976) during the stormy winter season. The marked CaCO3 decline from March to late April 2010 (Figure 4) may be induced by the spring bloom that delivers large amounts of biomass to the seabed (Wasmund et al., 2017). Fast aerobic degradation of this biomass induces high rates of benthic CO2 release during March-May (Dale et al., 2013) which probably leads to rapid dissolution of till-CaCO3 provided during the winter season. TOC shows, a much lower seasonality (Figure 4) since most of the TOC preserved in surface sediments is refractory and, hence, less reactive than till-CaCO3.
The annual mean rate of till-CaCO3 deposition at Boknis Eck can be estimated as 0.26 mmol cm-2 yr-1 applying the mean mass accumulation rate (0.15 g cm-2 yr-1) reported for this site (Dale et al., 2011) and a local till-CaCO3 content of 17.5 wt-% (Healy and Werner, 1987). The depth-integrated rate of benthic TOC degradation in surface sediments deposited in Boknis Eck has an annual mean value of about 0.5 mmol cm-2 yr-1 (Dale et al., 2013). Most of the TOC is degraded via aerobic respiration and dissimilatory sulfate reduction where sulfide is almost completely re-oxidized to sulfate in surface sediments (Dale et al., 2013). Since, both, aerobic respiration and sulfate reduction coupled to sulfide oxidation yield CO2 as major metabolic product, the data imply that sufficient CO2 is produced in surface sediments to dissolve most of the CaCO3 provided by till-erosion. CaCO3 dissolution at Boknis Eck is further aided by metabolic CO2 that accumulates in oxygen-depleted bottom waters during stagnant summer and autumn periods (Melzner et al., 2013; Lennartz et al., 2014). The example from Boknis Eck and the low CaCO3 contents found throughout the Baltic Sea (Leipe et al., 2011) clearly indicate that most of the CaCO3 delivered by till erosion is rapidly dissolved in surface sediments.
Carbon dioxide removal via deliberate CaCO3 addition
Our finding that CaCO3 provided by till erosion is rapidly dissolved at the seabed is also relevant for carbon dioxide removal (CDR) approaches that might be employed to mitigate global climate change and achieve net zero CO2 emissions over the coming decades (IPCC, 2018). One of these approaches proposes to use alkaline minerals that are dissolved in the ocean and at the seabed to create alkalinity and promote CO2 uptake from the atmosphere (Hartmann et al., 2013). Olivine is the alkaline mineral that has been most frequently proposed to be applied for this purpose. However, recent experimental studies showed that olivine may not be suitable since the generation of alkalinity during olivine dissolution is compromised by secondary mineral formation (Fuhr et al., 2022). Experiments that are currently conducted at GEOMAR within the framework of the RETAKE project (https://retake.cdrmare.de/en/) confirm that calcite added to muddy Baltic Sea sediments dissolves at the sediment surface and releases alkalinity in ambient bottom waters. Hence, CaCO3 may be a suitable alkaline mineral to remove CO2 from Baltic Sea water and the atmosphere.
CaCO3 addition may also have the beneficial side effect to reduce release of dissolved phosphate from sediments into ambient bottom waters because it may promote formation of authigenic carbonate fluorapatite and other Ca- and phosphate-bearing solids in surface sediments (Ruttenberg and Berner, 1993; Prüter et al., 2020). Since oxygen losses and nutrient accumulation in the Baltic Sea are amplified by benthic phosphate release (Conley et al., 2002), CaCO3 addition may not only mitigate acidification but also eutrophication and deoxygenation of this marginal sea.
The basin-wide rate of benthic DIC (dissolved inorganic carbon) release in the Baltic Sea has been estimated as 1 833 Gmol yr-1 (Nilsson et al., 2019). Benthic release induced by pyrite and sulfur burial has been estimated as 44 Gmol yr-1 (Gustafsson et al., 2019) while the ongoing dissolution of 122 Gmol of CaCO3 per year (Table 1) would induce a benthic flux of 244 Gmol yr-1. The remaining DIC flux is probably composed of CO2 produced during aerobic respiration and sulfate reduction coupled to sulfide oxidation (1 545 Gmol yr-1 = 68 million tons of CO2 per year). Neutralization of this large CO2 flux by CaCO3 addition could help to achieve net-zero CO2 emissions in countries along the Baltic coast. Our finding that CaCO3 erosion and dissolution is a natural process in the Baltic Sea may help during the approval process for CaCO3-based CDR measures within existing legal frameworks. However, a better quantification of natural AT sink and source terms and a full assessment of all side effects of CaCO3 addition are required before this promising CDR approach can be applied at large scale.
Conclusions
Our budget calculations and estimates of till erosion rates indicate that the dissolution of about 12 Tg CaCO3 yr−1 (Table 1) provided by seabed and coastal erosion can explain the dissolved Ca and most of the AT excess observed in Baltic Sea water. The apparent increase in AT and Ca concentrations over the past decades might, hence, be related to a corresponding increase in coastal and seabed erosion induced by e.g. climate change, dredging, and bottom trawling. Moreover, eutrophication, rising temperatures and the increase in CO2 accumulation in oxygen-depleted bottom waters (Kulinski et al., 2022) may have supported further CaCO3 dissolution. It should, however, be noted that more work on erosion rates and an improved reconstruction and understanding of temporal changes in the chemical composition of Baltic Sea water are required to consolidate these findings. A systematic survey of stable calcium isotopic compositions of different water masses in the Baltic Sea and possible Ca sources (till-CaCO3, riverine Ca, Ca dissolved in North Sea water) could be conducted to test our hypothesis that the Ca excess in Baltic Sea water is caused by till-CaCO3 dissolution.
Since our data suggest that CaCO3 provided by till erosion is rapidly dissolved at the seabed, we propose that deliberate addition of CaCO3 may be a suitable carbon dioxide removal approach for the Baltic Sea.
Our results may not only be relevant for the Baltic Sea but also for other coastal seas and shelf areas where internal generation of alkalinity may drive up to 60% of the CO2 uptake from the atmosphere (Thomas et al., 2009). So far, the AT generation has been ascribed to anaerobic degradation processes of organic matter in anoxic shelf sediments (Thomas et al., 2009). Our results imply that dissolution of eroded CaCO3 may strongly contribute to the AT generation in regions where sediments and rocks forming the coastline and the seabed contain significant amounts of carbonate. Better quantification and parameterization and, ultimately, inclusion of CaCO3 erosion and dissolution in basin-wide ecosystem models will thus be important for future studies of acidification and CO2 source/sink attribution in coastal seas.
Data availability statement
The original contributions presented in the study are included in the article/Supplementary Material. Further inquiries can be directed to the corresponding author.
Author contributions
KW initiated the paper by developing the hypothesis that carbonate erosion and dissolution may close the alkalinity budget at the Baltic Sea and contribute to CO2 uptake in coastal seas. MD provided data on sedimentation rates and calculated basin-wide mass accumulation rates of fine-grained sediments in the Baltic Sea. FS provided insights into coastal erosion of glacial till. GR supported the set-up of the alkalinity budget of the Baltic Sea. AD and MF provided carbonate data for Boknis Eck. ES contributed data and background on cation exchange and authigenic carbonate formation in Baltic Sea sediments. All authors contributed to the paper by drafting, reading, finalizing, and approving the text.
Funding
This work received funding by the German Federal Ministry of Education and Research, Grant No 03F0895, Project RETAKE, DAM Mission “Marine carbon sinks in decarbonization pathways” (CDRmare), and CARBOSTORE (Grant No 03F0875B). The work was further supported by the Emmy Noether Project ICONOX “Iron cycling in continental margin sediments and the nutrient and oxygen balance of the ocean”.
Acknowledgments
Data used in this publication were made available by the EMODnet Bathymetry (www.emodnet-bathymetry.eu) and Geology (www.emodnet-geology.eu) projects, funded by the European Commission Directorate General for Maritime Affairs and Fisheries. Discussions with participants of the RETAKE and CDRmare projects helped to develop the hypotheses presented in this paper. Moreover, we like to thank our two reviewers who provided very valuable comments that greatly helped to improve the manuscript and the editorial team for the very fast and efficient handling of our manuscript.
Conflict of interest
The authors declare that the research was conducted in the absence of any commercial or financial relationships that could be construed as a potential conflict of interest.
Publisher’s note
All claims expressed in this article are solely those of the authors and do not necessarily represent those of their affiliated organizations, or those of the publisher, the editors and the reviewers. Any product that may be evaluated in this article, or claim that may be made by its manufacturer, is not guaranteed or endorsed by the publisher.
Supplementary material
The Supplementary Material for this article can be found online at: https://www.frontiersin.org/articles/10.3389/fmars.2022.968069/full#supplementary-material
References
Almroth-Rosell E., Eilola K., Hordoir R., Meier H. E. M., Hall P. O. J. (2011). Transport of fresh and resuspended particulate organic material in the Baltic Sea - a model study. J. Mar. Syst. 87, 1–12. doi: 10.1016/j.jmarsys.2011.02.005
Anderson L., Dyrssen O. (1981). Excess calcium and alkalinity in the Baltic and southern kattegatt. Oceanol. Acta 4, 3–6.
Andrén T., Jørgensen B. B., Cotterill C., Green S., the IODP expedition 347 scientific party (2015). Science report IODP expedition 347: Baltic Sea basin paleoenvironment and biosphere. Sci. Dril. 20, 1–12.
Averes T., Hofstede J. L. A., Hinrichsen A., Reimers H. C., Winter C. (2021). Cliff retreat contribution to the littoral sediment budget along the Baltic Sea coastline of schleswig-Holstein, Germany. J. Mar. Sci. Eng. 9. doi: 10.3390/jmse9080870
Bauer J. E., Cai W. J., Raymond P. A., Bianchi T. S., Hopkinson C. S., Regnier P. A. G. (2013). The changing carbon cycle of the coastal ocean. Nature 504, 61–70. doi: 10.1038/nature12857
Chen C. T. A., Huang T. H., Chen Y. C., Bai Y., He X., Kang Y. (2013). Air-sea exchanges of CO2 in the world's coastal seas. Biogeosciences 10, 6509–6544. doi: 10.5194/bg-10-6509-2013
Conley D. L., Humborg C., Rahm L., Savchuk O. P., Wulff F. (2002). Hypoxia in the Baltic Sea and basin-scale changes in phosphorus biogeochemistry. Environ. Sci. Technol. 36, 5315–5320. doi: 10.1021/es025763w
Dale A. W., Bertics V. J., Treude T., Sommer S., Wallmann K. (2013). Modeling benthic-pelagic nutrient exchange processes and porewater distributions in a seasonally hypoxic sediment: evidence for massive phosphate release by beggiatoa? Biogeosciences 10, 629–651. doi: 10.5194/bg-10-629-2013
Dale A. W., Sommer S., Bohlen L., Treude T., Bertics V. J., Bange H. W., et al. (2011). Rates and regulation of nitrogen cycling in seasonally hypoxic sediments during winter (Boknis eck, SW Baltic sea): sensitivity to environmental variables. Estuarine Coast. Shelf Sci. 95, 12–28. doi: 10.1016/j.ecss.2011.05.016
Dyrssen D. (1993). The Baltic-Kattegat-Skagerrak estuarine system. Estuaries 16, 446–452. doi: 10.2307/1352592
EMODnet Bathymetry Consortium (2020) EMODnet digital bathymetry (DTM). (Accessed 07/12/2021). doi: 10.12770/bb6a87dd-e579-4036-abe1-e649cea9881a
Feng E. Y., Koeve W., Keller D. P., Oschlies A. (2017). Model-based assessment of the CO2 sequestration potential of coastal ocean alkalinization. Earths Future 5, 1252–1266. doi: 10.1002/2017EF000659
Folk R. L. (1954). The distinction between grain size and mineral composition in sedimentary rock nomenclature. J. Geol. 62, 344–359. doi: 10.1086/626171
Fuhr K., Geilert S., Schmidt M., Liebetrau V., Vogt C., Ledwig B., et al. (2022). Kinetics of olivine weathering in seawater: An experimental study. Front. Clim. 4. doi: 10.3389/fclim.2022.831587
Gingele F. X., Leipe T. (1997). Clay mineral assemblages in the western Baltic Sea: recent distribution and relation to sedimentary units. Mar. Geol. 140, 97–115. doi: 10.1016/S0025-3227(97)00023-6
Gingele F. X., Leipe T. (2001). Southwestern Baltic Sea - a sink for suspended matter from the North Sea? Geology 29, 215–218. doi: 10.1130/0091-7613(2001)029<0215:SBSASF>2.0.CO;2
Gripenberg S. (1937). The calcium content of Baltic water. J. Du Conseil 12, 293–304. doi: 10.1093/icesjms/12.3.293
Gustafsson B. G. (2001). Quantification of water, salt, oxygen and nutrient exchange of the Baltic Sea from observations in the Arkona Basin. Continental Shelf Res. 21, 1485–1500. doi: 10.1016/S0278-4343(01)00014-0
Gustafsson E., Hagens M., Sun X. L., Reed D. C., Humborg C., Slomp C. P., et al. (2019). Sedimentary alkalinity generation and long-term alkalinity development in the Baltic Sea. Biogeosciences 16, 437–456. doi: 10.5194/bg-16-437-2019
Gustafsson E., Omstedt A., Gustafsson B. G. (2015). The air-water CO2 exchange of a coastal sea-a sensitivity study on factors that influence the absorption and outgassing of CO2 in the Baltic Sea. J. Geophysical Res-Oceans 120, 5342–5357. doi: 10.1002/2015JC010832
Gustafsson E., Wallstedt T., Humborg C., Morth C. M., Gustafsson B. G. (2014). External total alkalinity loads versus internal generation: The influence of nonriverine alkalinity sources in the Baltic Sea. Global Biogeochem. Cycles 28, 1358–1370. doi: 10.1002/2014GB004888
Hartmann J., West A. J., Renforth P., Köhler P., de la Rocha C. L., Wolf-Gladrow D. A., et al. (2013). Enhanced chemical weathering as a geoengineering strategy to reduce atmospheric carbon dioxide, supply nutrients, and mitigate ocean acidification. Rev. Geophys. 51, 113–149. doi: 10.1002/rog.20004
Healy T., Werner F. (1987). Sediment budget for a semi-enclosed Sea in a near homogeneous lithology; example of Kieler Bucht, Western Baltic. Senckenbergiana Marit. 19, 195–222.
HELCOM (1986). “Water balance of the Baltic Sea,” in Baltic Sea Environment proceedings 16, 174. Helsinki, Finland
HELCOM (2007). “Long-lived radionuclides in the seabed of the Baltic Sea,” in Report of the sediment baseline study of HELCOM MORS-PRO in 2000–2005, balt. Sea environ. proc (Finland: HELCOM), 41.
Hordoir R., Dieterich C., Basu C., Dietze H., Meier H. E. M (2013). Freshwater outflow of the Baltic Sea and transport in the Norwegian current: A statistical correlation analysis based on a numerical experiment. Continental Shelf Res. 64, 1–9. doi: 10.1016/j.csr.2013.05.006
Hordoir R., Meier H. E. M. (2010). Freshwater fluxes in the Baltic Sea: A model study. J. Geophysical Res-Oceans, 115:115. doi: 10.1029/2009JC005604
Huckriede H., Meischner D. (1996). Origin and environment of manganese-rich sediments within black-shale basins. Geochim. Et. Cosmochim. Acta 60, 1399–1413. doi: 10.1016/0016-7037(96)00008-7
IAEA (1998). “Use of 137Cs in the study of soil erosion and sedimentation,” in IAEA-TECDOC-1028 (Vienna: IAEA).
Ilus E., Mattila J., Klemola S., Ikäheimonen T. K., Niemistö L. (2001). “Sedimentation rate in the Baltic Sea,” in Marine radioecology, final reports from subprojects within the Nordic nuclear safety research project EKO-1. Ed. Palsson S. E. (Risø: Nordic Nuclear Safety Research (NKS), 38–60.
IPCC (2021). Climate change 2021: The physical science basis (Geneva, Switzerland:Contribution of Working Group I to the Sixth Assessment Report of the Intergovernmental Panel on Climate Change).
Jakobsen R., Postma D. (1989). Formation and solid-solution behavior of Ca-rhodochrosites in marine muds of the Baltic deeps. Geochim. Et. Cosmochim. Acta 53, 2639–2648. doi: 10.1016/0016-7037(89)90135-X
Kairytė M., Stevens R. L. (2009). Quantitative provenance of silt and clay within sandy deposits of the Lithuanian coastal zone (Baltic Sea). Mar. Geol. 257, 87–93. doi: 10.1016/j.margeo.2008.11.001
Kaiser J., Wang K. J., Rott D., Li G., Zheng Y., Amaral-Zettler L., et al. (2019). Changes in long chain alkenone distributions and isochrysidales groups along the Baltic Sea salinity gradient. Org. Geochem. 127, 92–103. doi: 10.1016/j.orggeochem.2018.11.012
Kaskela A. M., Kotilainen A. T., Alanen U., Cooper R., Green S., Guinan J., et al. (2019). Picking up the pieces: Harmonising and collating seabed substrate data for European maritime areas. Geosciences 9, 84. doi: 10.3390/geosciences9020084
Kaskela A. M., Kotilainen A. T., Al-Hamdani Z., Leth J. O., Reker J. (2012). Seabed geomorphic features in a glaciated shelf of the Baltic Sea. Estuar. Coast. Shelf Sci. 100, 150–161. doi: 10.1016/j.ecss.2012.01.008
Kolander R., Morche D., Bimbose M. (2013). Quantification of moraine cliff coast erosion on Wolin Island (Baltic Sea, northwest Poland). Baltica 26, 37–44. doi: 10.5200/baltica.2013.26.04
Kotilainen A. T., Kotilainen M. M., Vartti V. P., Hutri K. L., Virtasalo J. J. (2021). Chernobyl Still with us: 137Caesium activity contents in seabed sediments from the Gulf of Bothnia, northern Baltic Sea. Mar. Pollut. Bull. 172. doi: 10.1016/j.marpolbul.2021.112924
Kremling K. (1969). Untersuchungen über die chemische Zusammensetzung des Meerwassers aus der Ostsee vom Frühjahr 1966. Kieler Meeresforschungen 25, 81–104.
Kremling K. (1970). Untersuchungen über die chemische Zusammensetzung des Meerwassers aus der Ostsee. Kieler Meeresforschungen 26, 1–20.
Kremling K. (1972). Untersuchungen über die chemische Zusammensetzung des Meerwassers aus der Ostsee: Frühjahr 1969 - herbst 1970. Kieler Meeresforschungen 28, 99–118.
Kremling K., Wilhelm G. (1997). Recent increase of the calcium concentrations in Baltic Sea waters. Mar. Pollut. Bull. 34, 763–767. doi: 10.1016/S0025-326X(97)00048-9
Kulinski K., Rehder G., Asmala E., Bartosova A., Carstensen J., Gustafsson B., et al. (2022). Biogeochemical functioning of the Baltic Sea. Earth Syst. Dynam. 16, 633–685. doi: 10.5194/esd-13-633-2022
Łabuz T. A. (2015). “Environmental impacts–coastal erosion and coastline changes,” in Second assessment of climate change for the Baltic Sea basin (Heidelberg, Germany: Springer International Publishing), 381–396.
Lajczak A., Jansson M. B. (1993). Suspended sediment yield in the Baltic drainage-basin. Nord. Hydrol. 24, 31–52. doi: 10.2166/nh.1993.0003
Lehmann A., Hinrichsen H. H. (2002). Water, heat and salt exchange between the deep basins of the Baltic Sea. Boreal Environ. Res. 7, 405–415. doi: 10.5194/esd-2021-15
Leipe T., Tauber F., Vallius H., Virtasalo J., Uscinowicz S., Kowalski N., et al. (2011). Particulate organic carbon (POC) in surface sediments of the Baltic Sea. Geo-Mar. Lett. 31, 175–188. doi: 10.1007/s00367-010-0223-x
Lennartz S. T., Lehmann A., Herrford J., Malien F., Hansen H. P., Biester H., et al. (2014). Long-term trends at the Boknis Eck time series station (Baltic Sea), 1957-2013: does climate change counteract the decline in eutrophication? Biogeosciences 11, 6323–6339. doi: 10.5194/bg-11-6323-2014
Lepland A., Stevens R. L. (1998). Manganese authigenesis in the Landsort Deep, Baltic Sea. Mar. Geol. 151, 1–25. doi: 10.1016/S0025-3227(98)00046-2
Lintinen P. (1995). Origin and physical characteristics of till fines in Finland. Geol. Survey Finland Bull. 379, 1–83.
Mattila J., Kankaanpaa H., Ilus E. (2006). Estimation of recent sediment accumulation rates in the Baltic Sea using artificial radionuclides Cs-137 and Pu-239,Pu-240 as time markers. Boreal Environ. Res. 11, 95–107.
Meier H. E. M. (2007). Modeling the pathways and ages of inflowing salt- and freshwater in the Baltic Sea. Estuar. Coast. Shelf Sci. 74, 610–627. doi: 10.1016/j.ecss.2007.05.019
Meier H. E. M., Kauker F. (2003a). Modeling decadal variability of the Baltic Sea: 2. role of freshwater inflow and large-scale atmospheric circulation for salinity. J. Geophysical Res-Oceans 108. doi: 10.1029/2003JC001799
Meier H. E. M., Kauker F. (2003b). Sensitivity of the Baltic Sea salinity to the freshwater supply. Climate Res. 24, 231–242. doi: 10.3354/cr024231
Melzner F., Thomsen J., Koeve W., Oschlies A., Gutowska M. A., Bange H. W., et al. (2013). Future ocean acidification will be amplified by hypoxia in coastal habitats. Mar. Biol. 160, 1875–1888. doi: 10.1007/s00227-012-1954-1
Millero F. J., Kremling K. (1976). Densities of Baltic Sea waters. Deep-Sea Res. 23, 1129–1138. doi: 10.1016/0011-7471(76)90889-5
Mitchell P. J., Spence M. A., Aldridge J., Kotilainen A. T., Diesing M. (2021). Sedimentation rates in the Baltic Sea: A machine learning approach. Continental Shelf Res. 214. doi: 10.1016/j.csr.2020.104325
Mohrholz V. (2018). Major Baltic inflow statistics - revised. Front. Mar. Sci. 5. doi: 10.3389/fmars.2018.00384
Montserrat F., Renforth P., Hartmann J., Leermakers M., Knops P., Meysman F. J. R. (2017). Olivine dissolution in seawater: Implications for CO2 sequestration through enhanced weathering in coastal environments. Environ. Sci. Technol. 51, 3960–3972. doi: 10.1021/acs.est.6b05942
Müller J. D., Schneider B., Rehder G. (2016). Long-term alkalinity trends in the Baltic Sea and their implications for CO2-induced acidification. Limnol. Oceanography 61, 1984–2002. doi: 10.1002/lno.10349
Neumann T., Christiansen C., Clasen S., Emeis K. C., Kunzendorf H. (1997). Geochemical records of salt-water inflows into the deep basins of the Baltic Sea. Continental Shelf Res. 17, 95–115. doi: 10.1016/0278-4343(96)00023-4
Nilsson M. M., Kononets M., Ekeroth N., Viktorsson L., Hylen A., Sommer S., et al. (2019). Organic carbon recycling in Baltic Sea sediments - an integrated estimate on the system scale based on in situ measurements. Mar. Chem. 209, 81–93. doi: 10.1016/j.marchem.2018.11.004
Omstedt A., Gustafsson E., Wesslander K. (2009). Modelling the uptake and release of carbon dioxide in the Baltic Sea surface water. Continental Shelf Res. 29, 870–885. doi: 10.1016/j.csr.2009.01.006
Omstedt A., Nohr C. (2004). Calculating the water and heat balances of the Baltic Sea using ocean modelling and available meteorological, hydrological and ocean data. Tellus Ser. A-Dynamic Meteorol. Oceanography 56, 400–414. doi: 10.3402/tellusa.v56i4.14428
Orviku K., Tonisson H., Kont A., Suuroja S., Anderson A. (2013). Retreat rate of cliffs and scarps with different geological properties in various locations along the Estonian coast. J. Coast. Res., 54, 552–557. doi: 10.2112/SI65-094.1
Porz L., Zhang W. Y., Schrum C. (2021). Density-driven bottom currents control development of muddy basins in the southwestern Baltic Sea. Mar. Geol., 438:438. doi: 10.1016/j.margeo.2021.106523
Prüter J., Leipe T., Michalik D., Klysubun W., Leinweber P. (2020). Phosphorus speciation in sediments from the Baltic Sea, evaluated by a multi-method approach. J. Soils Sediments 20, 1676–1691. doi: 10.1007/s11368-019-02518-w
Ruttenberg K. C., Berner R. A. (1993). Authigenic apatite formation and burial in sediments from non-upwelling, continental margin environments. Geochim. Cosmochim. Acta 57, 991–1007. doi: 10.1016/0016-7037(93)90035-U
Sarmiento J. L., Gruber N. (2006). Ocean biogeochemical cycles (Princeton: Princeton University Press).
Schneider B., Eilola K., Ukkari K., Müller-Karulis B., Neumann T. (2015). “Environmental impacts–marine biogeochemistry,” in Second assessment of climate change for the Baltic Sea basin, (Heidelberg, Germany:Springer international publishing), 337–361.
Schneider B., Gülzow W., Sadkowiak B., Rehder G. (2014). Detecting sinks and sources of CO2 and CH4 by ferrybox-based measurements in the Baltic Sea: Three case studies. J. Mar. Syst. 140, 13–25. doi: 10.1016/j.jmarsys.2014.03.014
Schrottke K., Schwarzer K., Frohle P. (2006). Mobility and transport directions of residual sediments on abrasion platforms in front of active cliffs (Southwestern Baltic Sea). J. Coast. Res., 39, 459–464.
Schwarzer K. (2010). Aggregate resources and extraction in the Baltic Sea: an introduction. J. Coast. Res., 51, 165–172. doi: 10.2112/si51-015.1
Schwarzer K., Bohling B., Heinrich C. (2014). Submarine hard-bottom substrates in the western Baltic Sea - human impact versus natural development. J. Coast. Res., 70, 145–150. doi: 10.2112/SI70-025.1
Schwarzer K., Diesing M., Larson M., Niedermeyer R. O., Schumacher W., Furmanczyk K. (2003). Coastline evolution at different time scales - examples from the Pomeranian Bight, southern Baltic Sea. Mar. Geol. 194, 79–101. doi: 10.1016/S0025-3227(02)00700-4
Suess E. (1976). Porenlösungen mariner Sedimente: Ihre chemische Zusammensetzung als Ausdruck frühdiagenetischer Vorgänge, Fachbereich Mathematik-Naturwissenschaften (Kiel, Germany: CAU Kiel), 179.
Suess E. (1979). Mineral phases formed in anoxic sediments by microbial decomposition of organic matter. Geochim. Cosmochim. Acta 43, 339–352. doi: 10.1016/0016-7037(79)90199-6
Sun X., Morth C. M., Humborg C., Gustafsson B. (2017). Temporal and spatial variations of rock weathering and CO2 consumption in the Baltic Sea catchment. Chem. Geol. 466, 57–69. doi: 10.1016/j.chemgeo.2017.04.028
Terefenko P., Paprotny D., Giza A., Morales-Napoles O., Kubicki A., Walczakiewicz S. (2019). Monitoring cliff erosion with LiDAR surveys and Bayesian network-based data analysis. Remote Sens. 11. doi: 10.3390/rs11070843
Thomas H., Bozec Y., de Baar H., Elkalay K., Frankignoulle F., Schiettecatte L.-S., et al. (2005). The carbon budget of the North Sea. Biogeosciences 2, 87–96. doi: 10.5194/bg-2-87-2005
Thomas H., Pempkowiak J., Wulff F., Nagel K. (2010). “The Baltic Sea,” in Carbon and nutrient fluxes in continental margins. Ed. Liu. K.-K., et al. (Berlin: Springer), 334–346.
Thomas H., Schiettecatte L. S., Suykens K., Kone Y. J. M., Shadwick E. H., Prowe F., et al. (2009). Enhanced ocean carbon storage from anaerobic alkalinity generation in coastal sediments. Biogeosciences 6, 267–274. doi: 10.5194/bg-6-267-2009
Tsunogai S., Watanabe S., Sato T. (1999). Is there a "continental shelf pump" for the absorption of atmospheric CO2? Tellus B. 51, 701–712.
Tyrrell T., Schneider B., Charalampopoulou A., Riebesell U. (2008). Coccolithophores and calcite saturation state in the Baltic and Black seas. Biogeosciences 5, 485–494. doi: 10.5194/bg-5-485-2008
Van der Wal P., Kempers R. S., Veldhuis M. J. W. (1995). Production and downward flux of organic-matter and calcite in a North-Sea bloom of the coccolithophore Emiliania-huxleyi. Mar. Ecol. Prog. Ser. 126, 247–265. doi: 10.3354/meps126247
Virtasalo J. J., Leipe T., Moros M., Kotilainen A. T. (2011). Physicochemical and biological influences on sedimentary-fabric formation in a salinity and oxygen-restricted semi-enclosed sea: Gotland deep, Baltic Sea. Sedimentology 58, 352–375. doi: 10.1111/j.1365-3091.2010.01166.x
Wallmann K., Aloisi G., Haeckel M., Tishchenko P., Pavlova G., Greinert J., et al. (2008). Silicate weathering in anoxic marine sediments. Geochim. Cosmochim. Acta 72, 2895–2918. doi: 10.1016/j.gca.2008.03.026
Wasmund N., Gobel J., Von Bodungen B. (2008). 100-years-changes in the phytoplankton community of Kiel Bight (Baltic Sea). J. Mar. Syst. 73, 300–322. doi: 10.1016/j.jmarsys.2006.09.009
Wasmund N., Kownacka J., Gobel J., Jaanus A., Johansen M., Jurgensone I., et al. (2017). The Diatom/Dinoflagellate index as an indicator of ecosystem changes in the Baltic Sea 1. principle and handling instruction. Front. Mar. Sci. 4. doi: 10.3389/fmars.2017.00022
Wefer G., Flemming B., Tauchgruppe Kiel (1976). Submarine Abrasion des Geschiebemergels vor Boknis Eck (West. Ostsee). Meyniana 28, 87–94.
Weisse R., Dailidien I., Hunicke B., Kahma K., Madsen K., Omstedt A., et al. (2021). Sea Level dynamics and coastal erosion in the Baltic Sea region. Earth System Dynamics 12, 871–898. doi: 10.5194/esd-12-871-2021
Winogradow A., Pempkowiak J. (2014). Organic carbon burial rates in the Baltic Sea sediments. Estuar. Coast. Shelf Sci. 138, 27–36. doi: 10.1016/j.ecss.2013.12.001
Wziatek D. Z., Terefenko P., Kurylczyk A. (2019). Multi-temporal cliff erosion analysis using airborne laser scanning surveys. Remote Sens. 11. doi: 10.3390/rs11222666
Keywords: alkalinity, calcium, Baltic Sea, carbonate rocks, erosion, carbonate dissolution, CO2 uptake
Citation: Wallmann K, Diesing M, Scholz F, Rehder G, Dale AW, Fuhr M and Suess E (2022) Erosion of carbonate-bearing sedimentary rocks may close the alkalinity budget of the Baltic Sea and support atmospheric CO2 uptake in coastal seas. Front. Mar. Sci. 9:968069. doi: 10.3389/fmars.2022.968069
Received: 13 June 2022; Accepted: 04 August 2022;
Published: 08 September 2022.
Edited by:
Elinor Andrén, Södertörn University, SwedenReviewed by:
Joonas Johannes Virtasalo, Geological Survey of Finland, FinlandXiaole Sun, Institute of Oceanology, (CAS), China
Copyright © 2022 Wallmann, Diesing, Scholz, Rehder, Dale, Fuhr and Suess. This is an open-access article distributed under the terms of the Creative Commons Attribution License (CC BY). The use, distribution or reproduction in other forums is permitted, provided the original author(s) and the copyright owner(s) are credited and that the original publication in this journal is cited, in accordance with accepted academic practice. No use, distribution or reproduction is permitted which does not comply with these terms.
*Correspondence: Klaus Wallmann, kwallmann@geomar.de