Dynamics and enzymatic degradation of exopolymer particles under increasing concentrations of silver ions and nanoparticles during a marine mesocosm experiment
 Lindsay Scheidemann1
  Benjamin Pontiller1*
  Vincenzo Manna2
  Carolina Cisternas-Novoa1,3
  Mauro Celussi2
  Anastasia Tsiola4
  Paraskevi Pitta4
  Iordanis Magiopoulos4
  Anja Engel1
- 1GEOMAR Helmholtz Centre for Ocean Research Kiel, Kiel, Germany
- 2Oceanography Division, National Institute of Oceanography and Applied Geophysics (OGS), Trieste, Italy
- 3Ocean Sciences Centre, Memorial University of Newfoundland, NL, Canada
- 4Institute of Oceanography, Hellenic Centre for Marine Research, Crete, Greece
Pollution of the marine environment is an emerging threat. Nowadays, engineered nanoparticles (<100 nm) such as zinc, copper and silver are widely used as antimicrobial agents, therefore often present in daily-life products. Consequently, the demand and production of nanoparticles are expected to increase. Here, we specifically focus on silver nanoparticles (AgNP). Once released into the environment, AgNPs pose an obvious ecotoxicological risk, potentially affecting ecosystem structure and functioning. For instance, phytoplankton-derived exudates, rich in acidic polysaccharides and amino acids, can abiotically aggregate into microgels such as transparent exopolymer particles (TEP) and Coomassie stainable particles (CSP). Hence, microgels can bridge dissolved and particulate size fractions and facilitate aggregate formation with organic and mineral particles. Both physical and chemical properties make TEP and CSP attractive nutrient hotspots for heterotrophic bacterioplankton. Bacteria, in turn, utilize extracellular enzymes to access these carbon and nitrogen pools. However, knowledge about the mechanisms by which AgNPs might interact with and affect the biogeochemical cycling of TEP and CSP is still insufficient. Therefore, we conducted a mesocosm experiment in the Eastern Mediterranean Sea and investigated the effects of environmentally relevant concentrations of silver ions (Ag+) and AgNP on the properties of TEP and CSP (i.e., area and abundance) along with enzymatic activity measurements. Our results showed that cyanobacteria were likely the primary source of CSP in the ultra-oligotrophic Mediterranean Sea. Also, CSP contributed more to the microgel pool than TEP, as indicated by a strong relationship between CSP and heterotrophic microbial dynamics. While silver (i.e., Ag+ or AgNP) had overall only marginal effects, both species affected the relationships between cell-specific LAPase activity and CSP and cell-specific APase activity and phosphate levels. Thus, Ag+ and AgNP have the potential to regulate microgel dynamics. However, future studies are needed to derive a robust understanding of the effects of silver pollution on the coupling of microgel formation and degradation and the follow-on effect on biogeochemical cycles.
Introduction
Anthropogenic pollution of the marine environment with contaminants such as, e.g., toxins, organic waste, and plastic are increasing in magnitude and extent (Martin et al., 2021). Similarly, the use of non-metallic particles, metals, and metal alloys (e.g., TiO2, ZnO, Ag, CNT, and Fullerenes) has progressively grown and is expected to significantly increase in the next decade (Pulit-Prociak and Banach, 2016; Giese et al., 2018). Even though there is a long-standing history of silver (Ag) pollution, today, a large proportion of pollutants consist of engineered nanomaterials (Ratte, 1999; Gottschalk et al., 2009). A striking feature of these nanoparticles, including mineral silver nanoparticles ≤100 nm (AgNP), is their biocidal functionality and ability to physically interact with microbial cell surfaces (Lemire et al., 2013). Therefore, silver nanoparticles are often used as additives and coatings in antimicrobial textiles and medical equipment (Lansdown, 2006; Nowack and Bucheli, 2007). However, these nanoparticles are increasingly disseminated through wastewater effluent into the environment because of mounting industrial production and application in consumer products (Benn and Westerhoff, 2008). While concentration measurements of AgNP in the environment are rather sparse, an annual global production ranging between 135-420 t silver has been estimated (Pulit-Prociak and Banach, 2016). In the EU, Sun and colleagues reported an annual production of AgNP in the order of ~30 t yr-1, and concentrations in sewage treatment effluent and surface waters of 16 and 0.9 ng L-1, respectively (Sun et al., 2014). Although these concentrations may seem low, Ag concentrations can increase substantially (up to 300 µg L-1) in coastal regions that are disproportionately affected by sewage and wastewater effluent (Giese et al., 2018; Yonathan et al., 2022).
While silver ion (Ag+) is one of the most toxic forms of non-essential metals, already at exceptionally low concentrations, the apparent toxicity is primarily determined by the chemistry of the individual silver species (Ratte, 1999; Lemire et al., 2013). For instance, experimental evidence suggests that AgNPs are less toxic than Ag+ (Kalantzi et al., 2019). The mechanisms by which metals such as silver inhibit cell growth and poison microbial cells are rather complex and often a combination of different mechanisms result in e.g., impaired membrane function and electron transport chain, interference with enzymes, and DNA damage (Lemire et al., 2013). However, natural bacterial communities are taxonomically and metabolically exceptionally diverse (Hug et al., 2016), while some microorganisms evolved physiological adaptations and resistance mechanisms (e.g., reduced uptake, efflux, sequestration, repair, and chemical modification) to withstand silver toxicity, others are more susceptible (Lemire et al., 2013). Thus, it is unsurprising that the sheer complexity of natural bacterial communities and the plethora of resistance mechanisms determining the degree of susceptibility, along with the influence of variations in experimental designs, influence the apparent toxicity of Ag+ and AgNP on the studied organisms. This inherent complexity is often reflected in inconsistent experimental results (Kalantzi et al., 2019). For instance, multiple studies reported a decrease of phytoplankton growth rates (Bielmyer-Fraser et al., 2014; Das et al., 2014; Baptista et al., 2015) and photosynthesis (Baptista et al., 2015) as a consequence of high AgNP concentrations (µg L-1 – mg L-1). Addition of AgNPs also reduced the growth of diatom and Synechococcus isolates (Burchardt et al., 2012). Interestingly, organic matter concentrations and the availability of inorganic nutrients (e.g., phosphate) seem to strongly influence the observed toxicity (Kalantzi et al., 2019). Furthermore, it has been shown that AgNPs can decrease cell viability of bacteria by inhibition of bacterial production and growth resulting in changes of bacterial community composition already at fairly low Ag concentrations (Das et al., 2012a; Das et al., 2012b; Tsiola et al., 2018). Nevertheless, exposure to environmentally relevant silver concentrations (ng L-1 range) often led to indiscernible results (Baptista et al., 2015).
Given the key role of phytoplankton (i.e., including cyanobacteria) and bacterioplankton (bacteria and archaea) in nutrient cycling, research is needed to better understand the potential ecotoxicological effects of Ag+ and AgNP under realistic and ecosystem-relevant conditions. Phytoplankton play a vital role in the global carbon cycle by transforming, via photosynthesis, inorganic carbon into organic matter. During this process, a small amount of carbon escapes rapid remineralization in the upper ocean and is stored in the deep ocean (biological pump) (Falkowski et al., 1998). However, under nutrient scarcity, phytoplankton tend to increase the exudation of exopolymers, including surface active carbohydrates and protein (Engel et al., 2002; Thornton and Chen, 2017). More recently, other stressors, such as viral infections have been shown to increase aggregate formation through enhanced release of exopolymer substances in coccolithophores (Nissimov et al., 2018) and diatoms (Yamada et al., 2018). These dissolved precursors (e.g., acidic polysaccharides or amino acids with aliphatic and aromatic side chains) can abiotically aggregate into larger gels (microgels) such as transparent exopolymer particles (TEP) and Coomassie stainable particles (CSP), respectively (Verdugo et al., 2004). These gels can reach sizes of hundreds of micrometers up to centimeter-scale owing to stable calcium ion bridges, thereby linking the dissolved and particulate organic matter phase in the marine water column (Engel, 2002; Verdugo et al., 2004). Moreover, gel-like particles such as TEP and CSP are veritable nutrient hotspots, heavily colonized by bacteria (Mari and Kiørboe, 1996; Busch et al., 2017).
Bacterioplankton, in turn, play a central role in the microbial loop, breaking down phytoplankton-derived particulate organic matter (POM) and dissolved organic matter (DOM) into smaller bioavailable molecules by utilizing hydrolytic extracellular enzymes (Azam and Malfatti, 2007). These hydrolytic enzymes include, for instance, carbohydrate-active enzymes (e.g., Beta-galactosidases) that hydrolyze glycosidic bonds found in polysaccharides, proteolytic enzymes that hydrolyze peptide bonds (e.g., Leucine-aminopeptidases), or phosphatases that cleave ester bonds between phosphate groups and organic residues of organic phosphates. Depending on the bacterial foraging strategy, particle-attached bacteria release their enzymes into the environment, whereas free-living bacteria often keep enzymes attached to their cell wall (Traving et al., 2015; Baltar, 2017). Regardless of the bacterial lifestyle strategy, this ecosystem relevant function is often considered the rate-limiting step in the marine carbon cycle (Arnosti, 2011) and an important variable in modulating POM-DOM (including TEP and CSP) fluxes (Cho and Azam, 1988; Smith et al., 1995; Nagata, 2008).
Since AgNPs can have adverse effects on all forms of life, including microorganisms, right at the base of food webs, silver pollution might alter the structure and functioning of the microbial loop and thus planetary biogeochemical cycles to an unknown extent. Therefore, we studied the effects of two different silver species, silver ions (Ag+) and silver nanoparticles (AgNP), over a range of ecologically relevant concentrations, on the dynamics of autotrophic and heterotrophic microorganisms along with TEP and CSP concentrations in the ultra-oligotrophic coastal waters off Crete (Greece) in a large-scale mesocosm experiment. During the experiment, we specifically addressed the following objectives i) Examine the effects of Ag on TEP and CSP concentrations (area and abundance) and ii) study whether silver alters the extracellular enzymatic activities of Beta-glucosidase (BGase) and Leucine-aminopeptidase (LAPase), assuming that very low silver concentrations (ng L-1) might affect hydrolysis rates and, in turn, TEP and CSP dynamics, respectively.
Materials and methods
Study site and mesocosm setup
Water for the mesocosm experiment was retrieved from the Bay of Gournes, Cretan Sea, located ~5 nautical miles north of Heraklion port. Seawater from ~2 m depth was pumped into 1000 L acid-washed (10% HCl) high-density polypropylene (HDP) containers using a submersible centrifugal pump and transported within ~1h to the CRETACOSMOS facility (http://cretacosmos.eu/) of the Hellenic Centre for Marine Research (HCMR; Heraklion, Greece). Upon arrival at the facility, the seawater was equally distributed (in 20-sec intervals) into 9 food-grade polyethylene mesocosm bags with a final volume of 3000 L each, using gravity siphoning with plastic tubes (acid-washed and rinsed with deionized water prior). Mesocosm bags were closed with plexiglass lids to avoid contamination. The bags were incubated in a 350 m3 large concrete basin throughout the duration of the experiment (9th to 24th May 2019) under in situ water temperature (20.8 ± 0.4°C) using a continuous water flow system and regularly moved up and down with an airlift system to avoid stratification.
Initial abiotic and biotic conditions were measured at D0 (11th May at 08:00), 12 h after the mesocosm bags were filled. Thereafter, triplicate mesocosms received a solution of silver ions (TraceCERT 10.000 mg L-1 Ag in nitric acid, 91543, Sigma Aldrich) here referred to as “Ag+”, whereas another three mesocosms were spiked with silver nanoparticles (BioPure Silver Nanospheres, 1 mg mL-1 in water, BPEI capped, nominal diameter 60 ± 5 nm, AGBB60-1M, nanoComposix, USA) here denoted as “AgNP”. The remaining three unamended bags served as controls “C”. Ag+ and AgNP were added at a concentration of 50 ng Ag L-1 mesocosm-1 day-1 for the first ten days of the experiment (final concentration 500 ng Ag L-1) using a solution containing 150 μg Ag L-1 in the form of Ag+ or AgNPs prepared in 1L ultrapure Milli-Q water (18.2 MΩ, Millipore) by accounting for the volume reduction of the mesocosms through daily sampling. The concentration range of silver (50-500 Ag ng L-1) is low as opposed to the µg to mg Ag L-1 range often used to study silver toxicity (Kalantzi et al., 2019 and references therein). However, this concentration was chosen based on a previous first-of-its-kind mesocosm experiment conducted in the same area and during the same season, being the minimum concentration toxic to Synechococcus cells (Tsiola et al., 2018). Seawater inside the mesocosm bags was gently mixed after spiking with a bag-specific paddle. The next time points D1 (12th May, 08:00) until D11 (22nd May, 08:00) were always sampled shortly prior to spiking.
Subsamples for abiotic and biotic measurements were collected using 10 or 20-L low-density polyethylene (LDPE) bottles. These included the concentrations of chlorophyll a (Chl a), dissolved inorganic nutrients (phosphate, nitrate, nitrite, ammonium, silicate), particulate organic carbon (POC), nitrogen (PON) (daily), the abundances of prokaryotic cells and autotrophic picoeukaryotes (daily), exopolymer particle concentration (TEP and CSP) (daily), LAPase, BGase, and alkaline phosphatase (APase) activity daily for the bulk community and every other day for the dissolved phase.
Quantification and analyses of transparent exopolymer particles and Coomassie stainable particles
Filtration and analyses of TEP and CSP were performed according to (Engel, 2009). In brief, subsamples for TEP and CSP were filtered onto 0.4 µm pore size polycarbonate filters (Nucleopore track-etched, 25 mm, Whatman, GE Healthcare Life Sciences, UK), and subsequently stained either with Alcian Blue Working Solution (0.02% final concentration, Alcian Blue 8GX, pH 2.5, Sigma Aldrich, Germany) for 5 s or with Coomassie Brilliant Blue (0.04% final concentration, Coomassie Brilliant Blue G-250, SERVA Electrophoresis, Germany) for 30 s to stain TEP or CSP particles, respectively. Before use, both dyes were pre-filtered through 0.2 µm syringe filters (Acrodisk, Sigma Aldrich) and stored at +7°C. Sample volumes ranged between 30 and 100 mL depending on particle type and experimental day. In addition, sequential filtrations for TEP and CSP blanks on 0.4 and 0.2 µm pore size polycarbonate filters (Nucleopore track-etched, 25 mm, Whatman, GE Healthcare Life Sciences, UK) were performed for small aliquots of 15-20 mL on D0, D6, and D11. Filters were air-dried, mounted on glass slides (Menzel Gläser, Thermo Scientific, Germany) using two drops (~10 µL each) of immersion oil (Standard series A, nD 1.5840 ± 0.0002, Cargille, USA), covered with coverslips (Menzel Gläser, Thermo Scientific, Germany) and stored at -20°C.
Filters were analyzed with an Axioscope A.1 (Zeiss, Germany) microscope and an EC Plan NEOFLUAR 20x/0,5 Ph2 air objective (Zeiss, Germany) at GEOMAR. The microscope was equipped with an Axio-Cam MRC (Zeiss) camera. Per filter, 36 images were taken with a resolution of 3.2 pixel µm-1 and images semi-automatically analyzed using the open-source Software ImageJ (Schneider et al., 2012) as described in (Engel, 2009). The concentrations of TEP and CSP were reported in two different ways: i) as the area covered by exopolymer particles per volume (mm2 L-1) and, ii) as the number of particles per volume (particles L-1).
Extracellular enzymatic activity
LAPase, BGase, and APase activities were measured in the bulk seawater (total LAPase, BGase and APase) and in the < 0.2 μm fraction (dissolved or cell-free LAPase, BGase and APase). Total BGase, LAPase, and APase hydrolysis rates were measured on every sampling day, whereas the activity of dissolved exoenzymes was assayed on D0, D1 and then on every other day. The enzymatic activities were measured using the fluorogenic substrate analogue method according to (Hoppe, 1993). Briefly, triplicate 2 mL subsamples were amended with 800 μM 4-methyl-umbelliferone (MUF)-β-D-glucoside and 800 μM leucine-7-amino-methyl-coumarin (AMC) to assay BGase and LAPase activities, respectively, and 25 μM 4-methyl-umbelliferyl phosphate to measure APase activity. Saturation concentrations were evaluated for each of the substrates in samples collected in the Bay of Gournes (same sampling station as used for filling the mesocosms) one and two days before the beginning of the experiment. Enzyme activities were derived from the increase in fluorescence due to the cleavage of the substrate analogues, measured with a RF1501 spectrofluorometer (Shimadzu Europe, Germany) at 365 nm excitation and 455 nm emission for BGase and APase, and at 380 nm excitation and 440 nm emission for LAPase. Triplicate calibration curves were performed on each sampling day using 0.2 μm-filtered seawater from the mesocosms and 5 μM MUF and AMC standard solutions.
Determination of microbial cell abundances (prokaryotes and micro-plankton)
The abundance of heterotrophic bacteria was determined using flow cytometry according to (Mari and Kiørboe, 1996). In brief, subsamples were fixed with glutaraldehyde (0.5% final concentration) and incubated at 4°C for ~45 min, flash-frozen in liquid nitrogen and stored at -80°C until analysis. Frozen samples were thawed at room temperature and heterotrophic bacteria were diluted in Tris-EDTA buffer solution (pH=8, Sigma-Aldrich) to adjust a particle detection rate of <1000 events sec-1, stained with SYBR Green I (Molecular Probes, 4×10⁻⁴ final dilution of the stock solution) and then incubated for 30 min in the dark. Autotrophic bacteria were distinguished based on their auto-fluorescence signal from non-fixed samples without staining. Before counting, samples were spiked with an internal standard consisting of yellow-green latex beads of 1 µm nominal size (Polysciences) and counted on a FACSCalibur flow cytometer (Becton Dickinson) equipped with an air-cooled laser at 488 nm and standard filter setup. The flow rate of the instrument was checked daily for abundance conversion by running a trial TRIS-EDTA buffer solution for 5 min before and after counting at various flow rates. The count data were processed with the Cell Quest Pro software (Becton Dickinson).
The abundance of heterotrophic bacteria attached to CSP particles was determined in samples taken on D0, D5, and D7 through a double staining approach. In brief, aliquots of 1.5 mL were fixed with 25% Glutaraldehyde solution (0.5% final concentration), kept at +4°C for 15 min and stored at -20°C until analysis. After thawing at room temperature, samples were filtered onto 0.2 µm polycarbonate filters and stained for 30s with a prefiltered (0.2 µm) Coomassie Brilliant Blue solution (0.04% final concentration, Sigma Aldrich) following the protocol described in (Long and Azam, 1996). Subsequently, samples were stained with 4,6-diamidino-2-phenylindole (DAPI, Sigma Aldrich) following the staining protocol of (Porter and Feig, 1980) with slight modifications, as reported in (Manna et al., 2020). Briefly, filters were placed on a drop (50 µL) of DAPI (30 µg mL-1 in an autoclaved 3.7% NaCl solution) for 15 min in the dark. The back of the filters was gently dried with a kimwipe tissue and mounted between layers of immersion oil (Type A, Cargille, USA). Prepared filters were stored at -20°C until CSP-associated bacteria were counted with a BX60FS epifluorescence microscope (Olympus) using 1000 magnification and UV filter set (BP 330-385 nm, BA 420 nm) in 20 randomly selected fields.
Chlorophyll a and nutrient measurements
Chlorophyll a (Chl a) concentrations were determined according to (Arar and Collins, 1997) and (Yentsch and Menzel, 1963). In brief, 1 L seawater was filtered through 47 mm GF/F filters under low vacuum pressure and filters were stored at -20°C. Concentrations were determined after overnight extraction using 90% acetone using a TD-700 fluorometer (Turner Designs, Inc., USA). Inorganic nutrient concentrations were measured according to the protocols of (Ivančič and Deggobis, 1984) and (Strickland and Parsons, 1972) using a visible (VIS) and ultra-violet (UV) spectrophotometer. The detection limit of the instrument for ammonium, nitrate, nitrite and silicate was 0.019, 0.017, 0.010 and 0.025 μM, respectively. Phosphate concentrations were determined based on (Strickland and Parsons, 1972).
POC and PON concentrations were determined according to (Hedges and Stern, 1984), In brief, 1 L sample water was filtered through pre-combusted (500°C for 4h) particle retention GF/F filters (25 mm, 0.7 µm pore-size, Whatman), filters were dried in an oven for 1h. Thereafter, 200 μL of 25% HCl were applied on the filter and incubated for 10 min in the hood and dried at 60°C overnight and analyzed using a CHNS organic elemental analyzer (PE 2400 Series II, Perkin Elmer).
Statistical analysis and visualization
Data analyses and visualizations were conducted in R (v.4.1.0) (R Core Team, 2021) using RStudio (v2022.02.0) (RStudio Team, 2022). Principal components analysis (PCA) was performed on scaled biological and chemical variables using the function prcomp from the stats (v4.1.0) (R Core Team, 2021) R package. Two-way repeated measures analysis of variance (RM ANOVA) was applied to test for differences in a given variable between controls and the different silver treatments (C, Ag+, and AgNP). One-way ANOVA was used to test for differences of each variable between treatments at each time point (D0-D11) using the “holm” correcting for multiple testing. All ANOVA tests were performed on rank-transformed raw values as suggested by (Zimmerman and Zumbo, 1993) to mitigate the influence of distribution biases using the functions anova_test and get_anova_table from the rstatix (v0.7.0) R package. Moreover, the assumption of sphericity was tested using the Mauchly’s test. In the case this assumption was violated, the Greenhouse-Geisser (GG) correction was applied to all within-subject factors using the anova_test function with the “auto” argument. To further explore differences between treatments and time points that differed from each other, we applied pairwise Wilcoxon Rank Sum Tests using the function pairwise_wilcox_test with “holm” correction from the rstatix (v0.7.0) R package. Linear regressions were performed with the function lm from the stats (v4.1.0) package in addition to functions in the packages modelr (v0.1.8), stargazer (v5.2.3), and broom (v0.7.11). Pairwise Spearman correlations between biological and chemical variables were performed using the functions cor.mtest and cor_pmat using the packages ggcorrplot (v0.1.3) and rstatix (v0.7.0), respectively. Subsequently correlation matrices were visualized using the function ggcorrplot.
Results and discussion
Biological and chemical drivers of temporal variability
To determine the variability of environmental conditions and possible effects of increasing concentrations of silver ions (Ag+) and silver nanoparticles (AgNP) over time, we conducted a principal component analysis (PCA) on biological and chemical variables (Figure 1). The PCA analysis showed pronounced differences among samples over time. The first two components described ~47% of the total variance, with PC1 accounting for 29%. The variables Chl a, total APase activity, abundance of heterotrophic bacteria, total LAPase activity, abundance of autotrophic picoeukaryotes, and particulate organic carbon (POC) concentration contributed 9.7%, 8.9%, 7.5%, 7.3%, 7.1%, and 6.5%, respectively, to the total variance (Table S1). Both biological and chemical conditions changed profoundly over time, visible in the separation of samples along the PC1 and PC2 axes. Notably, the silver concentration (Ag) contributed marginal (3.8%) to the overall variance (Figure 1). However, the grouping of unamended controls, Ag+, and AgNP samples differed, particularly on D1 and D3. While the variables mentioned above contributed to the separation on D1 (along PC1), additionally silicate concentration, total BGase activity, and TEP concentration (area mm2 L-1) influenced the clustering. On D3, however, the separation of samples (along PC2) was primarily determined by changes in the CSP concentration (covered area, mm2 L-1 and abundance, number of particles L-1) together with total LAPase activity. Collectively, these results suggest different mechanisms by which Ag+ and AgNP affect TEP and CSP concentration in the studied system and highlight the dynamic coupling of microgel production and degradation processes.
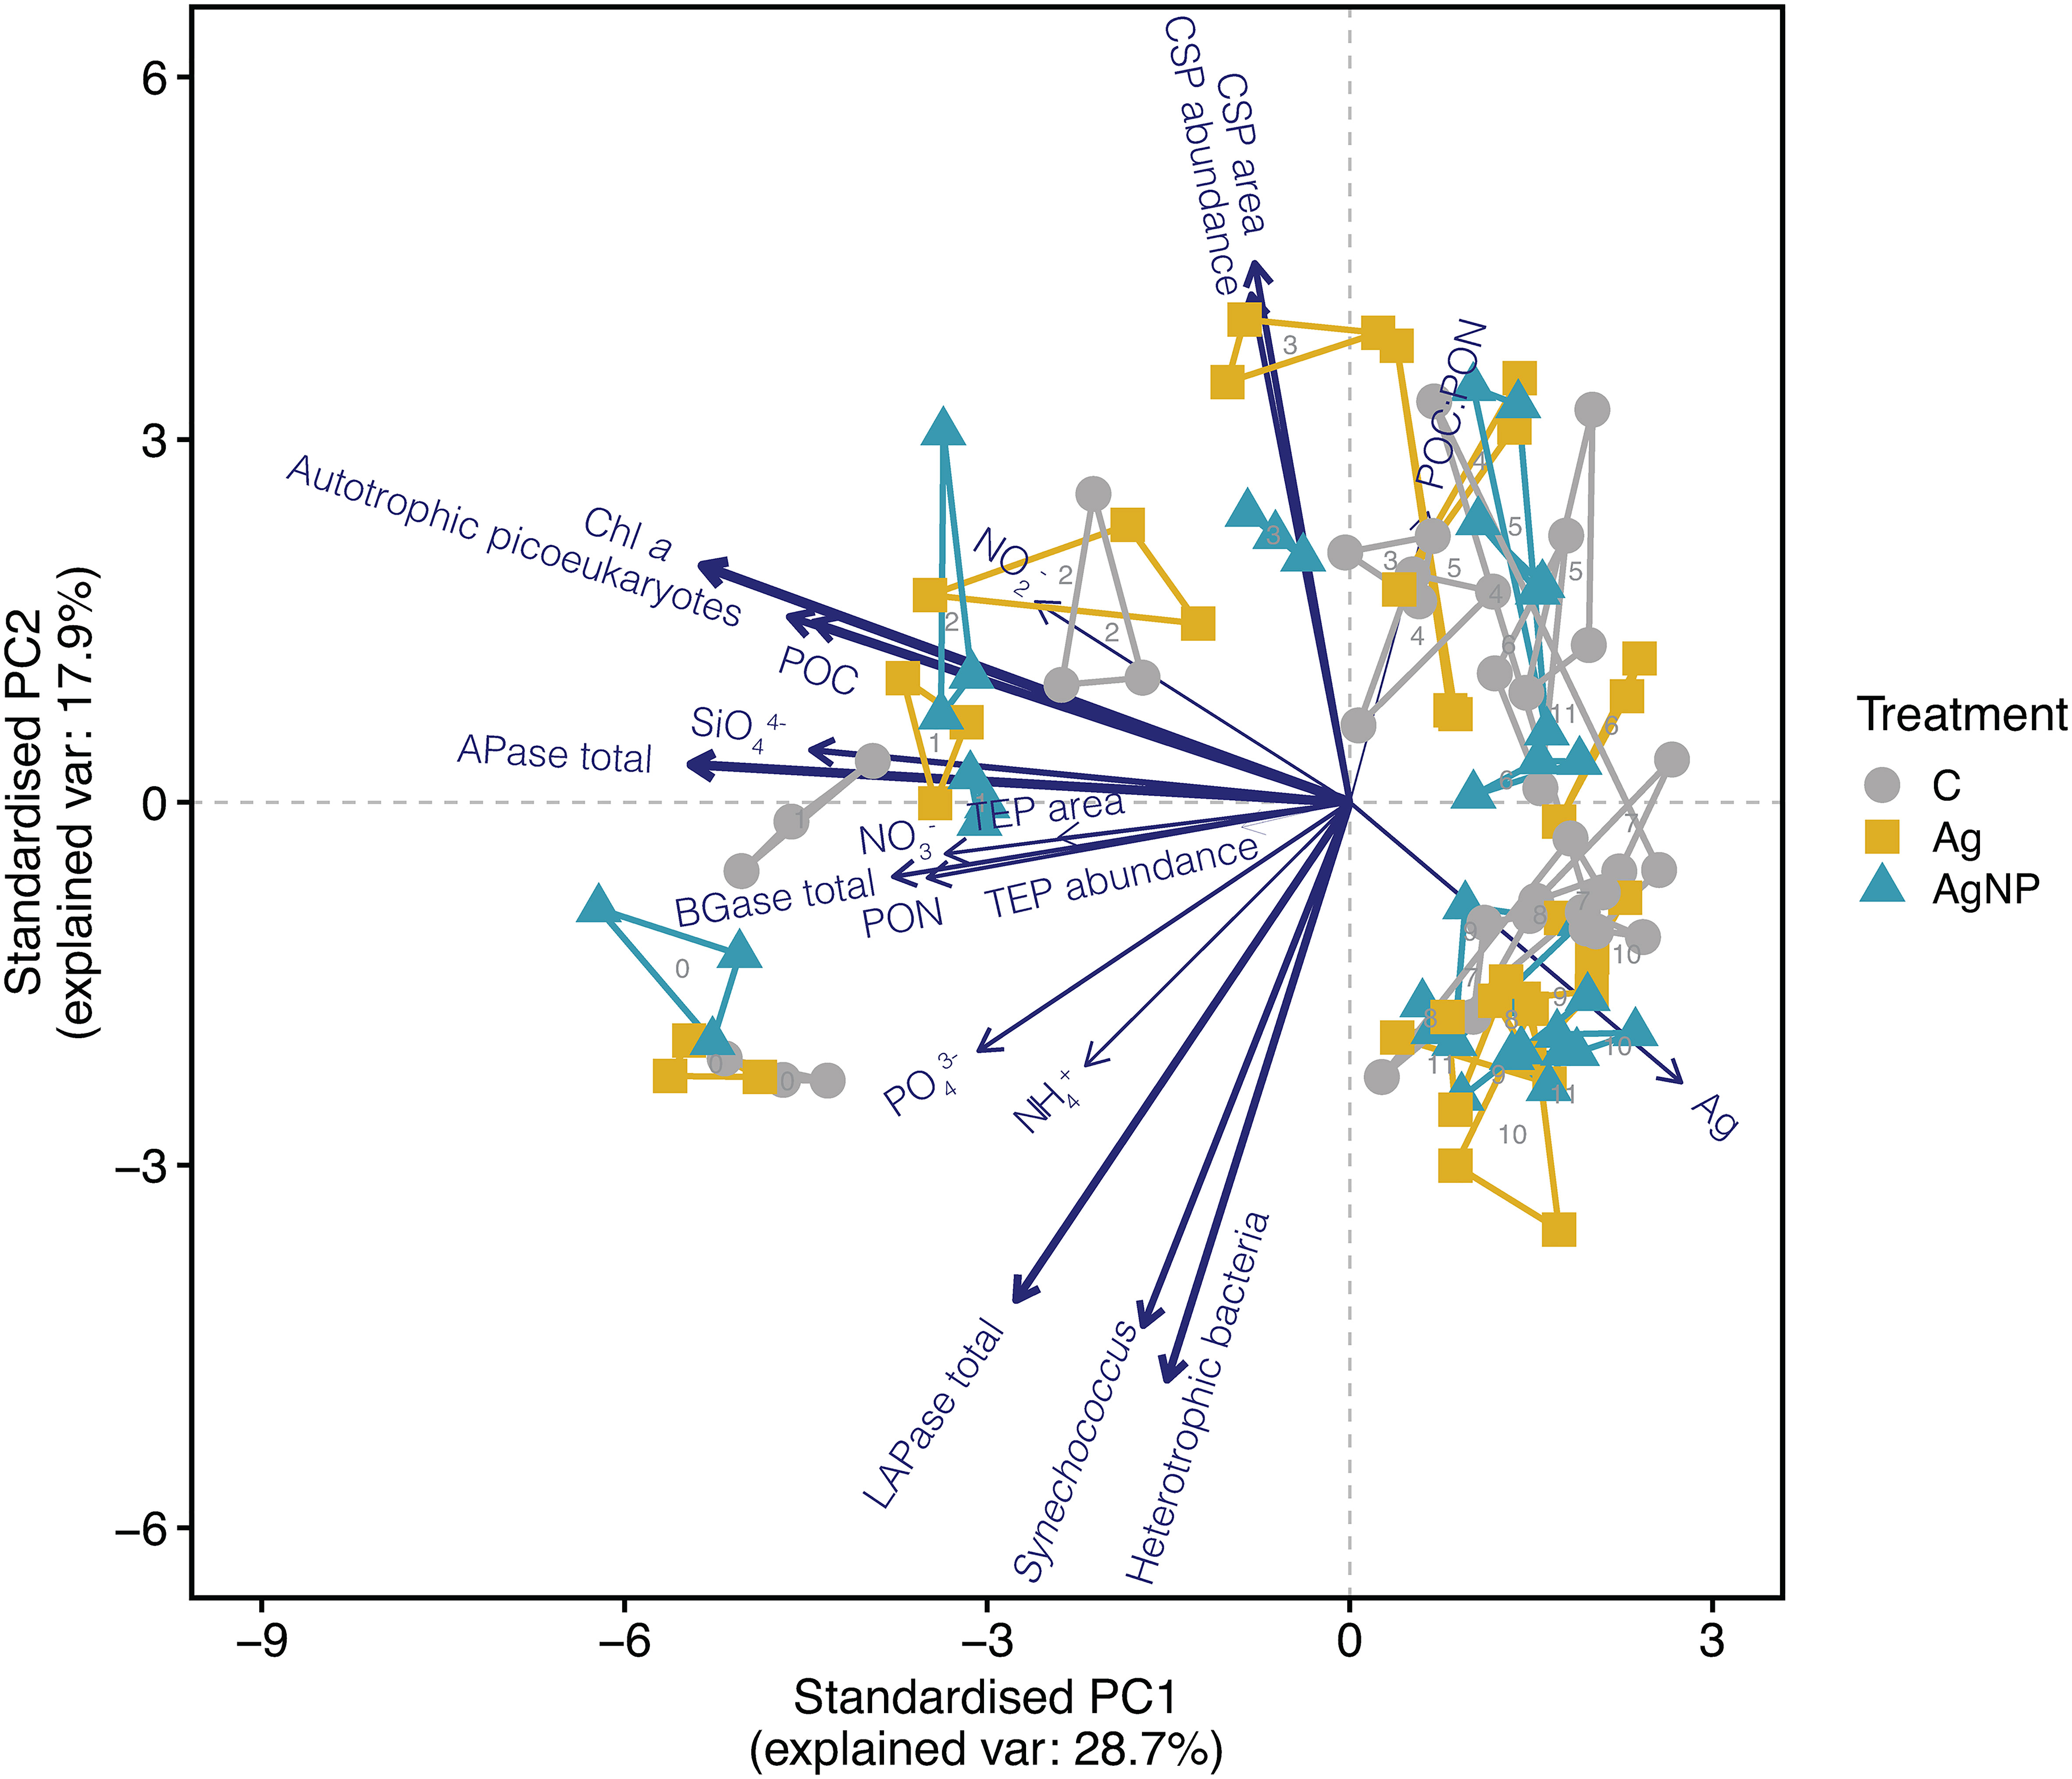
Figure 1 Principal component analysis (PCA) shows the distribution of samples based on biological and chemical variables. The line length and thickness of arrows show the strength of correlation and contribution of variables in driving sample distribution, respectively. The numbers display the day of sampling. Convex hulls group biological triplicates. Abbreviation of treatments: C, unamended controls; Ag, silver ions; and AgNP, silver nanoparticles. Abbreviation of variables: Chl a, chlorophyll a; TEP, transparent exopolymer particles; CSP, coomassie stainable particles; BGase, beta-glucosidase; LAPase, leucine-aminopeptidase; APase, alkaline phosphatase; POC, particulate organic carbon; PON, particulate organic nitrogen; POC : PON, POC to PON ratio; NH4+, ammonium, NO2-, nitrite; NO3-, nitrate; PO43-, phosphate; SiO44-, silicate; Ag, silver concentration added.
Dynamics of biotic and abiotic seawater parameters
Chl a, a proxy for phytoplankton biomass, was generally low (<0.3 µg L-1); concentrations decreased from 0.29 ± 0.01 µg L-1 (mean ± SD, n = 9) on D0 to 0.08 ± 0.01 µg L-1 on D8, and thereafter increased slightly to 0.12 ± 0.01 µg L-1 on D11 (Figure 2A). While the addition of silver overall did not significantly affect Chl a dynamics (Table S2), concentrations differed notably between Ag+ and AgNP on D1. In comparison, other experimental studies from the same region reported an initial increase in phytoplankton biomass, peaking two to three days later (Tsiola et al., 2018; Galgani et al., 2019). In our study, the relatively short bloom period and immediate decline of Chl a suggest that we captured a phytoplankton community during the late development/senescence phase in the field. Although the here reported Chl a concentrations may appear low compared to meso- and eutrophic areas, they are among the highest values reported in the Cretan Sea (Ignatiades, 1998; Allen et al., 2003; Petihakis et al., 2018).
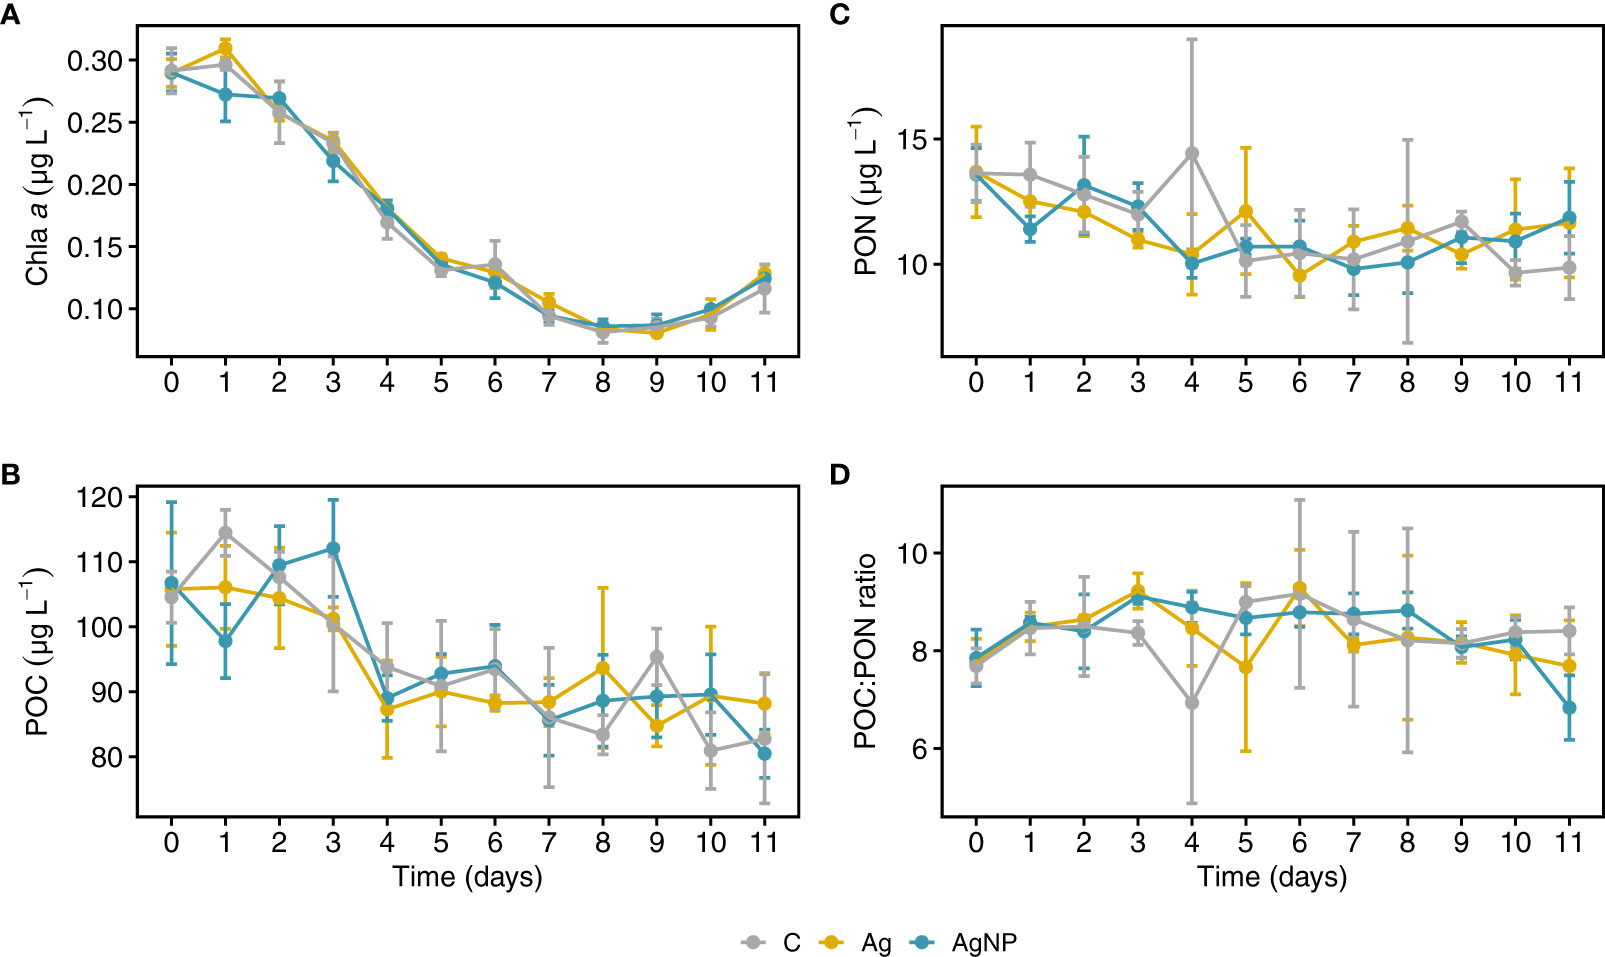
Figure 2 Temporal dynamics of chlorophyll a, particulate organic carbon and nitrogen concentrations in mesocosms. Chl a, chlorophyll a (A) POC, particulate organic carbon (B) PON, particulate organic nitrogen (C) and POC to PON ratios (D) over the time course of the mesocosm experiment. Error bars denote standard deviations of the mean (n = 3). Abbreviation of treatments: C, unamended controls; Ag, silver ions; and AgNP, silver nanoparticles.
The concentrations of chemical variables in enclosures amended with silver were not significantly different from controls, and the treatment effect was relatively small compared to the pronounced changes over time (Table S2). Particulate organic carbon (POC) concentrations were highest during the first three days of the experiment ranging between 100 ± 8.6 and 107 ± 5.7 µg L-1 (mean ± SD, n = 9); thereafter POC levels were consistently lower ranging between 91.9 ± 5.2 to 83.8 ± 6.7 µg L-1 (Figure 2B). Particulate organic nitrogen (PON) concentrations showed a similar trend throughout the experiment and were undiscernible between controls and treatments (range between 10.2 ± 1.2 and 11.6 ± 3.2 µg L-1; mean ± SD, n = 9) (Figure 2C). The molar POC to PON ratios in the mesocosms ranged between 7.6 ± 0.9 and 9.0 ± 1.1 (mean ± SD, n = 9) (Figure 2D). These ratios were consistently higher than Redfield (C:N = 6.6) and in the expected range typically found in the North Eastern Mediterranean (C:N ~10) (Ediger et al., 2005). The observed changes in POC/PON ratios were mainly explained by PON concentration since even small variations in PON translate into pronounced changes in POC/PON ratios. Thus, the high variability in POC/PON during the middle of the experiments can be explained by low PON concentrations.
During the experiment, dissolved inorganic nitrogen concentrations (ammonium and nitrate) were low and generally unaffected by the addition of silver (Table S2). Ammonium and nitrate concentrations ranged between 0.23 ± 0.13 to 0.08 ± 0.01 µmol L-1 and 0.23 ± 0.1 to 0.03 ± 0.03 µmol L-1 (mean ± SD, n = 9), respectively. Although, nitrite concentrations were consistently <0.015 µmol L-1 (Figure 3A-C), values differed significantly between treatments (RM ANOVA, F(2.4) = 7.34, p = 0.046, η2G = 0.16), especially between AgNP and C (Wilcoxon, W = 377, padj = 0.009). As anticipated for the Eastern Mediterranean Sea, phosphate levels were exceptionally low, ranging from 0.7 ± 1.0 to 3.6 ± 0.6 nmol L-1). Phosphate concentrations differed significantly between treatments (RM ANOVA, F(2.4) = 11.36, p = 0.022, η2G = 0.34), differences were most pronounced between AgNP and C (Wilcoxon, W = 539.5, padj = 0.0001) but also notable between Ag+ and C (W = 475.0, padj = 0.001), and between the two silver species (W = 172.5, padj = 0.02). From D5 onward, phosphate concentrations were higher in AgNP (2.2 ± 1.0 nmol L-1, n = 15) and Ag+ (1.5 ± 1.0 nmol L-1) treatments compared to C (0.5 ± 0.7 nmol L-1) (Figure 3D). This tendency was interesting given that phosphate has the potential to act as an Ag+ binding ligand, potentially reducing its toxicity (McTeer et al., 2014). Dissolved silicate concentrations differed between treatments (RM ANOVA, F(2.4) = 13.66, p = 0.016, η2G = 0.31) and were significantly higher in AgNP (Wilcoxon, W = 536.5, padj = 0.0001) and Ag+ (W = 525.0, padj = 0.0002) compared to C. Concentrations slightly decreased over time and were <0.8 µmol L-1 with a tendency of higher SiO44- values in Ag+ (0.68 ± 0.1 µmol L-1, n = 9) and AgNP (0.66 ± 0.05 µmol L-1) compared to C (0.54 ± 0.03 µmol L-1) from D2 to D4 (Figure 3E). Collectively, the reported low nutrient and Chl a concentrations underlined the ultra-oligotrophic status of the study system but are a characteristic feature of the Eastern Mediterranean Sea (Krom et al., 1991; Siokou-Frangou et al., 2010).
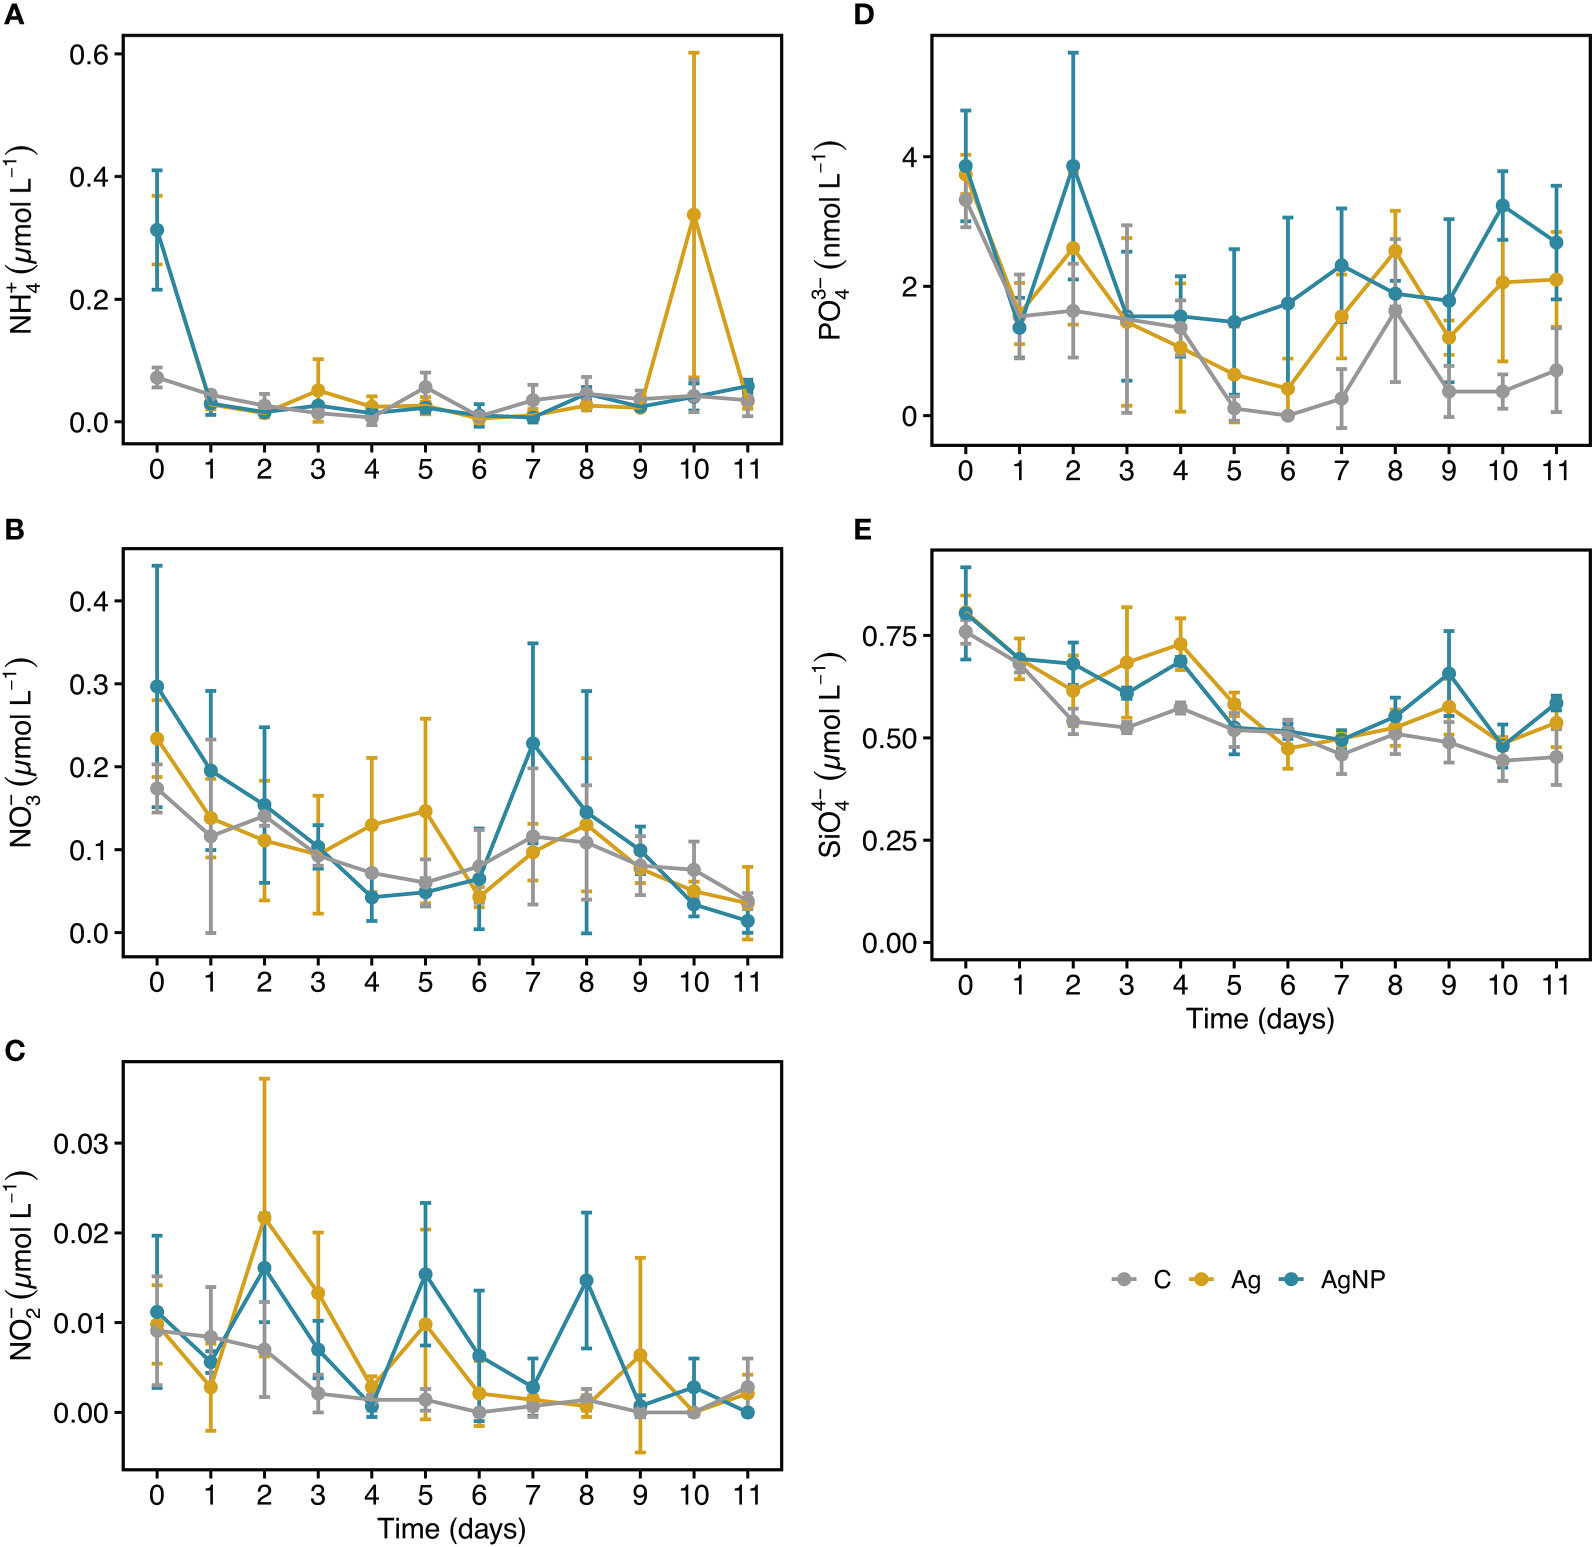
Figure 3 Temporal dynamics of inorganic nutrients in mesocosms. NH4+, ammonium (A) NO3-, nitrate (B) NO2-, nitrite (C) PO43-, phosphate (D) SiO44-, silicate (E). Error bars denote standard deviations of the mean (n = 3). Abbreviation of treatments: C, unamended controls; Ag, silver ions; and AgNP, silver nanoparticles.
Bacterioplankton and autotrophic picoeukaryote dynamics
The abundance of heterotrophic prokaryotes (HB) differed between treatments (RM ANOVA, F(2.4) = 10.86, p = 0.024, η2G = 0.05) with a higher abundance in AgNP amended enclosures compared to C (Wilcoxon, W = 468, p < 0.03). While the HB abundance initially decreased sharply from 5.5 ± 0.2 × 10⁵ cells mL-1 on D0 to 2.1 ± 0.3 × 10⁵ cells mL-1 on D4, recovering thereafter, the variability in cell counts increased between treatments and controls (Figure 4A). The addition of silver did not result in significant abundance differences of cyanobacteria and autotrophic picoeukaryotes (Table S2). Cyanobacteria dominated the phytoplankton community; Synechococcus abundance peaked at 3.7 ± 0.2 × 10⁵ cells mL-1 (mean ± SD, n = 9) on D1, decreased to 1.7 ± 0.3 × 10⁵ cells mL-1 on D4, and continuously increased until D9 reaching 3.4 ± 0.3 × 10⁵ cells mL-1 with a tendency of slightly higher abundances in AgNP and Ag+ compared to controls (Figure 4B). Autotrophic picoeukaryotes, in turn, peaked at 0.48 ± 0.03 × 10⁵ cells mL-1 on D2, reaching the lowest cell counts (0.09 ± 0.04 × 10⁵ cells mL-1) on D7 (Figure 4C). Initially, the abundances of Synechococcus and autotrophic picoeukaryotes were marginally affected by silver. Later on, however, Synechococcus coped with silver, especially AgNP, seemingly better than autotrophic picoeukaryotes. A study by Tsiola and colleagues (2018) showed that Synechococcus is susceptible to the exposure of silver nanoparticles (AgNP) already at very low concentrations (100-1000 ng L-1) (Tsiola et al., 2018). In another study, exposure to high concentrations of silver (≥ 500 µg L-1) resulted in a substantial reduction of phytoplankton and bacterioplankton growth rates, along with a reduced photosynthetic efficiency in phytoplankton but environmentally relevant concentrations of silver did not show these effects (Baptista et al., 2015), suggesting that additional mechanisms such as the silver species or nutrient status may be involved in the degree of silver toxicity (Ratte, 1999; Lemire et al., 2013; Kalantzi et al., 2019). Ongoing research efforts using bacterial community composition and transcriptome analyses will help uncover the molecular mechanisms which enable Synechococcus to cope with silver toxicity.
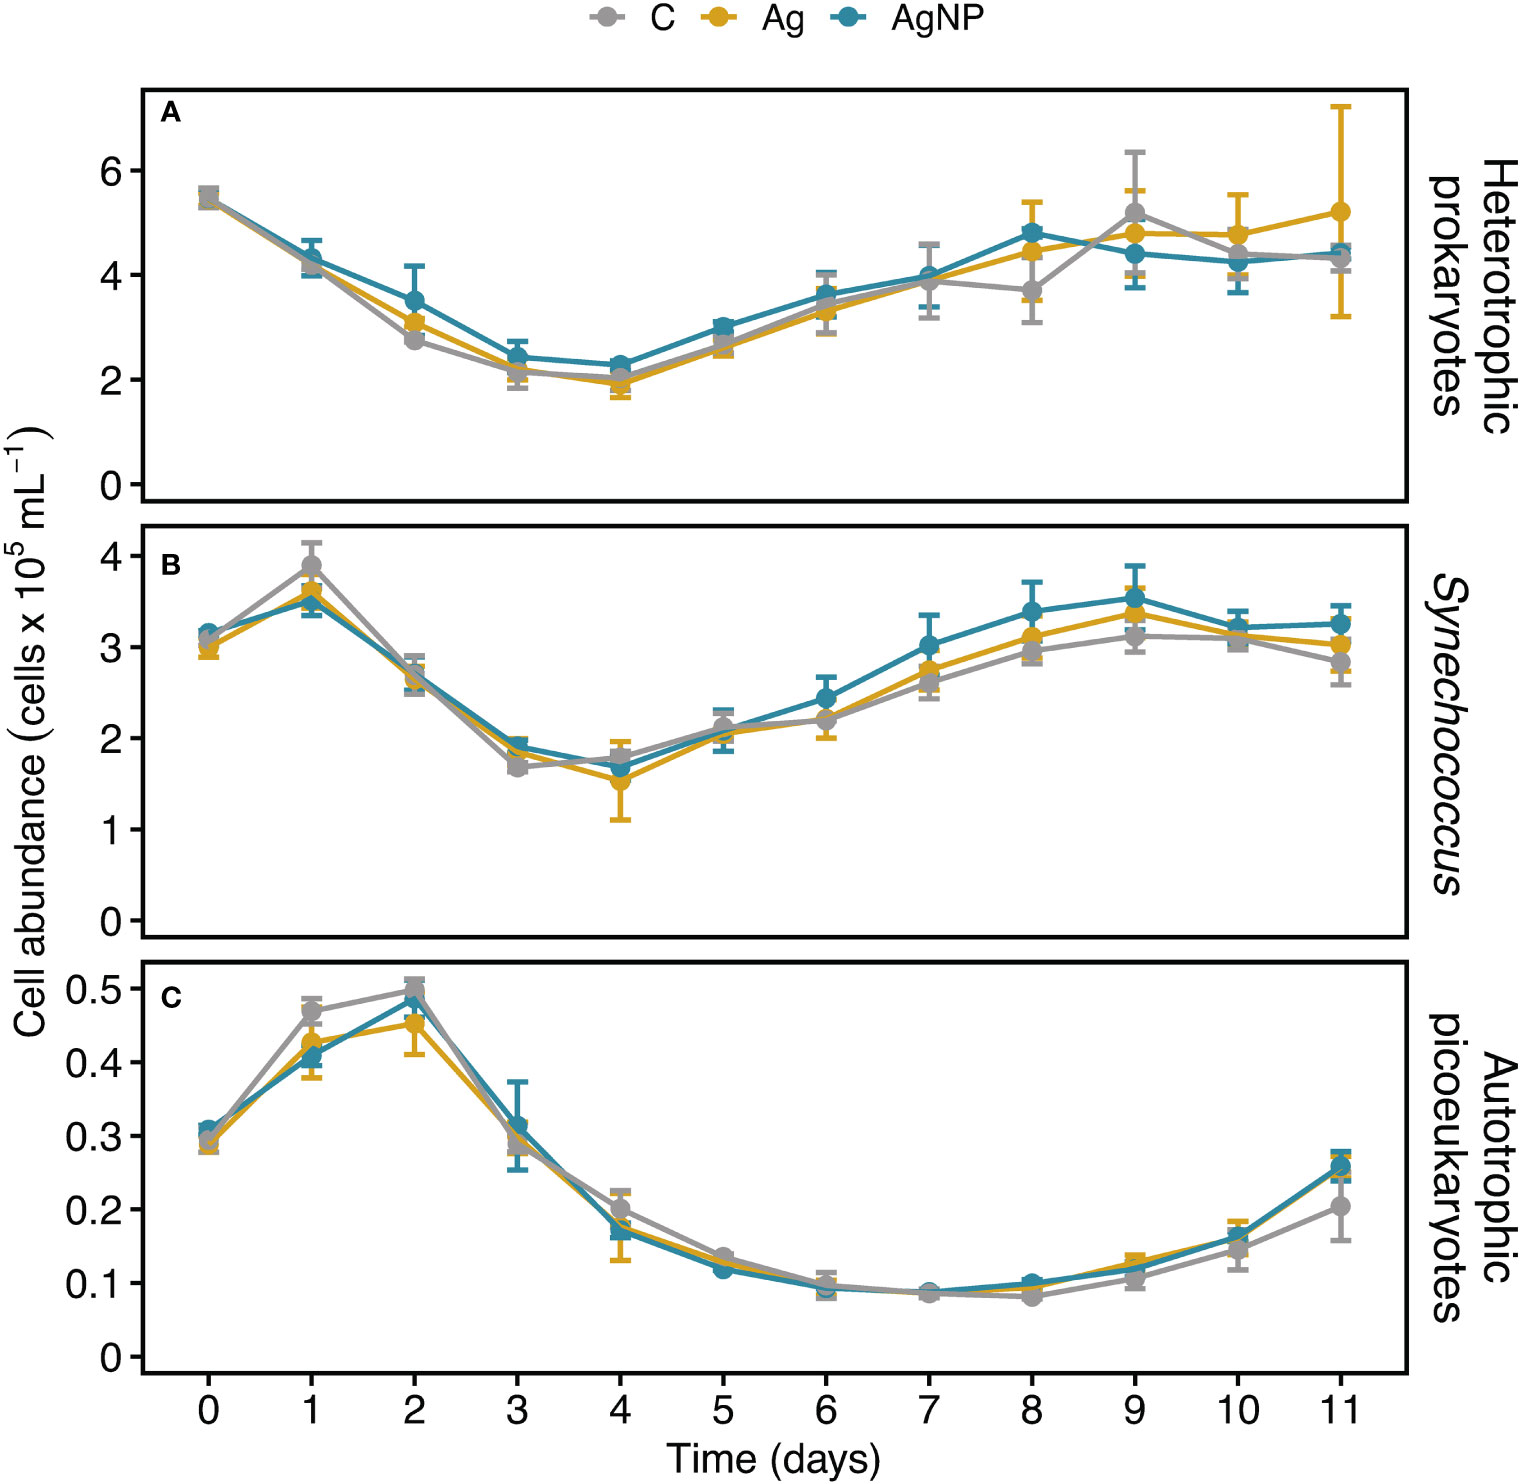
Figure 4 Temporal dynamics of heterotrophic bacterioplankton and autotrophic picoeukaryote cell abundances in experimental mesocosms. Cell counts of heterotrophic bacterioplankton (A), Synechococcus (B), and autotrophic picoeukaryotes (C). Error bars denote standard deviations of the mean (n = 3). Abbreviation of treatments as described in Figure 1.
Dynamics of transparent exopolymer particles and Coomassie stainable particles
Phytoplankton are the primary source of exopolymers such as polysaccharides and proteins, which are released upon exposure to stress, for instance nutrient limitation (Engel et al., 2002; Thornton and Chen, 2017). Assuming that silver toxicity enhances the release of exopolymers and the fact that exopolymers abiotically aggregate into gel-like particles (microgels), forming TEP and CSP (Verdugo et al., 2004), one could assume that TEP and CSP production increases upon exposure to silver. Alternatively, TEP and CSP concentrations might decrease upon exposure to silver due to toxic effects and associated cell loss. However, the addition of silver in the form of Ag+ and AgNP did not consistently influence TEP dynamics (Table S2). In control mesocosms (C), the TEP area continuously decreased from 2.4 ± 1.3 mm2 L-1 (mean ± SD, n = 3) on D0 to 0.6 ± 0.4 mm2 L-1 on D7. While the TEP area (mm2 L-1) in both silver treatments undulated around levels measured in controls, on D1 a drastic decrease in Ag+ (-1.3 ± 0.3 mm2 L-1) and AgNP (-1.2 ± 0.3 mm2 L-1) treatments relative to controls (2.0 ± 0.4 mm2 L-1) was noticeable (Figures 5A, B). Similarly, the TEP abundance (particles L-1) ranged between 0.4 ± 0.2 and 0.5 ± 0.3 × 10⁶ particles L-1 until D3, and thereafter decreased to values <0.4 × 10⁶ particles L-1. TEP abundance in both treatments was lower than in controls until D2, but comparable to controls over the remaining time points (Figures 5C, D). In general, TEP abundance in oligotrophic parts of the ocean is low (Engel et al., 2020). Values observed during this study are comparable to earlier findings for the ultra-oligotrophic parts of the Mediterranean Sea (Zäncker et al., 2021). Overall, TEP concentration measured as covered area per liter and number of particles per liter showed a positive correlation (rs(108) =0.66, p <0.01). No significant correlation between TEP and Chl a was found (Figure S1). It has been shown that TEP concentration correlates with stress indicators and cell death in the diatom Thalassiosira weisfloggi and cyanobacterium Synechococcus elongatus in the North-Eastern Aegean Sea (Thornton and Chen, 2017), and a negative correlation between TEP and Chl a concentration was observed for the Levantine Basin (Bar-Zeev et al., 2011). However, weak correlations between TEP and Chl a suggest a tight coupling of photosynthetic uptake and biomass production (Parinos et al., 2017), which is in agreement with our results. In addition, experimental evidence suggests higher TEP concentrations in diatom-dominated enclosures, whereas a dominance of cyanobacteria resulted in higher CSP concentrations (Cisternas-Novoa et al., 2015; Thornton and Chen, 2017). Thus, the dominance of cyanobacteria in our enclosures, which are likely CSP-rich, might partly explain the decoupling of Chl a and TEP dynamics.
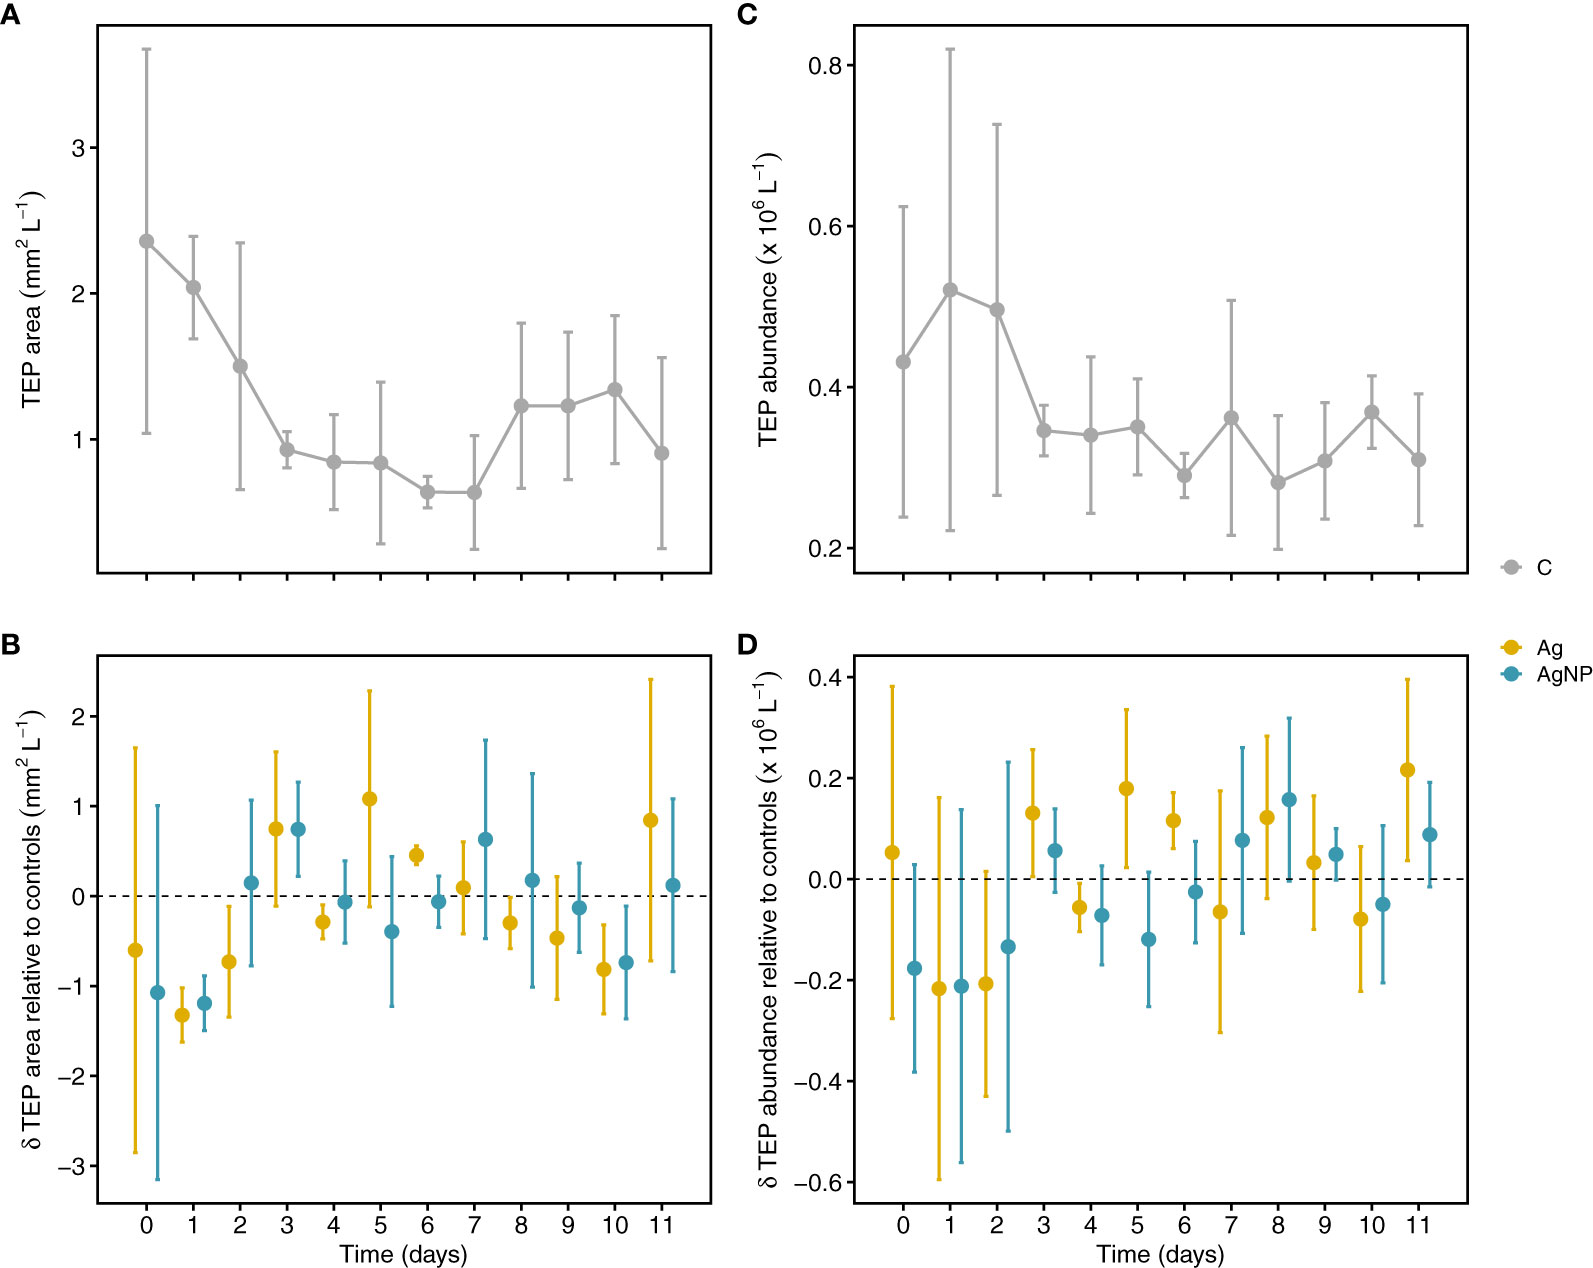
Figure 5 Temporal variation of transparent exopolymer particle (TEP) concentration. Depicted are TEP areas in controls (A) and treatments relative to controls (B). TEP particle abundance (particles L-1) in controls and treatments relative to controls (C, D). Error bars denote standard deviations of the mean (n = 3). Abbreviation of treatments as described in Figure 1.
Overall, there were no significant effects of Ag+ and AgNP on CSP concentration measured as covered area per liter and number of particles per liter; however, there were changes in CSP dynamics over time (Table S2). For instance, in control mesocosms, CSP area increased during the first five days of the experiment reaching ~6-fold higher values on D5 (peaking at 2.7 ± 3.4 mm2 L-1) compared to D0. Thereafter, CSP area decreased until D8 (0.3 ± 0.1 mm2 L-1) (Figure 6A). The addition of Ag+ and AgNP resulted in slightly larger CSP areas from D0 to D5 (1.3 ± 1.3 and 1.0 ± 0.6 mm2 L-1, n = 6, respectively) compared to D6 to D11 (-0.43 ± 0.8 and -0.47 ± 0.8 mm2 L-1, n = 6, respectively) when the opposite was observed (Figure 6B). A similar relationship was noticeable for CSP abundance in controls and Ag treatments (Figures 6C, D). This was also visible in the strong positive correlation between CSP area and abundance (rs(108) = 0.95, p < .01). Notably, the largest differences in CSP area and abundance between the two Ag treatments occurred on D3. A strong relationship between CSP and Chl a concentration (Cisternas-Novoa et al., 2015) suggests CSP formation by intact cells. In our experiment, CSP increased during the first days of incubations concomitantly with a decrease in Chl a, Synechococcus abundance, and particulate organic carbon (POC), suggesting a release of protein-rich compounds from the cytoplasm through viral lysis or grazing rather than an active release by intact cells. The addition of Ag+, however, might have contributed to an increase in CSP formation by increasing cellular stress. This is in agreement with a previous mesocosm experiment showing that amendments of AgNPs act as a stressor on the plankton community and specifically on photosynthesis-related processes (Tsiola et al., 2018). Given that there was no significant correlation between CSP and TEP (area and abundance), it is likely that these are indeed different particles in terms of chemical composition, origin, and degradation processes (Cisternas-Novoa et al., 2015; Thornton and Chen, 2017). Therefore, it is likely that both particle types may fulfill different biogeochemical roles in marine systems.
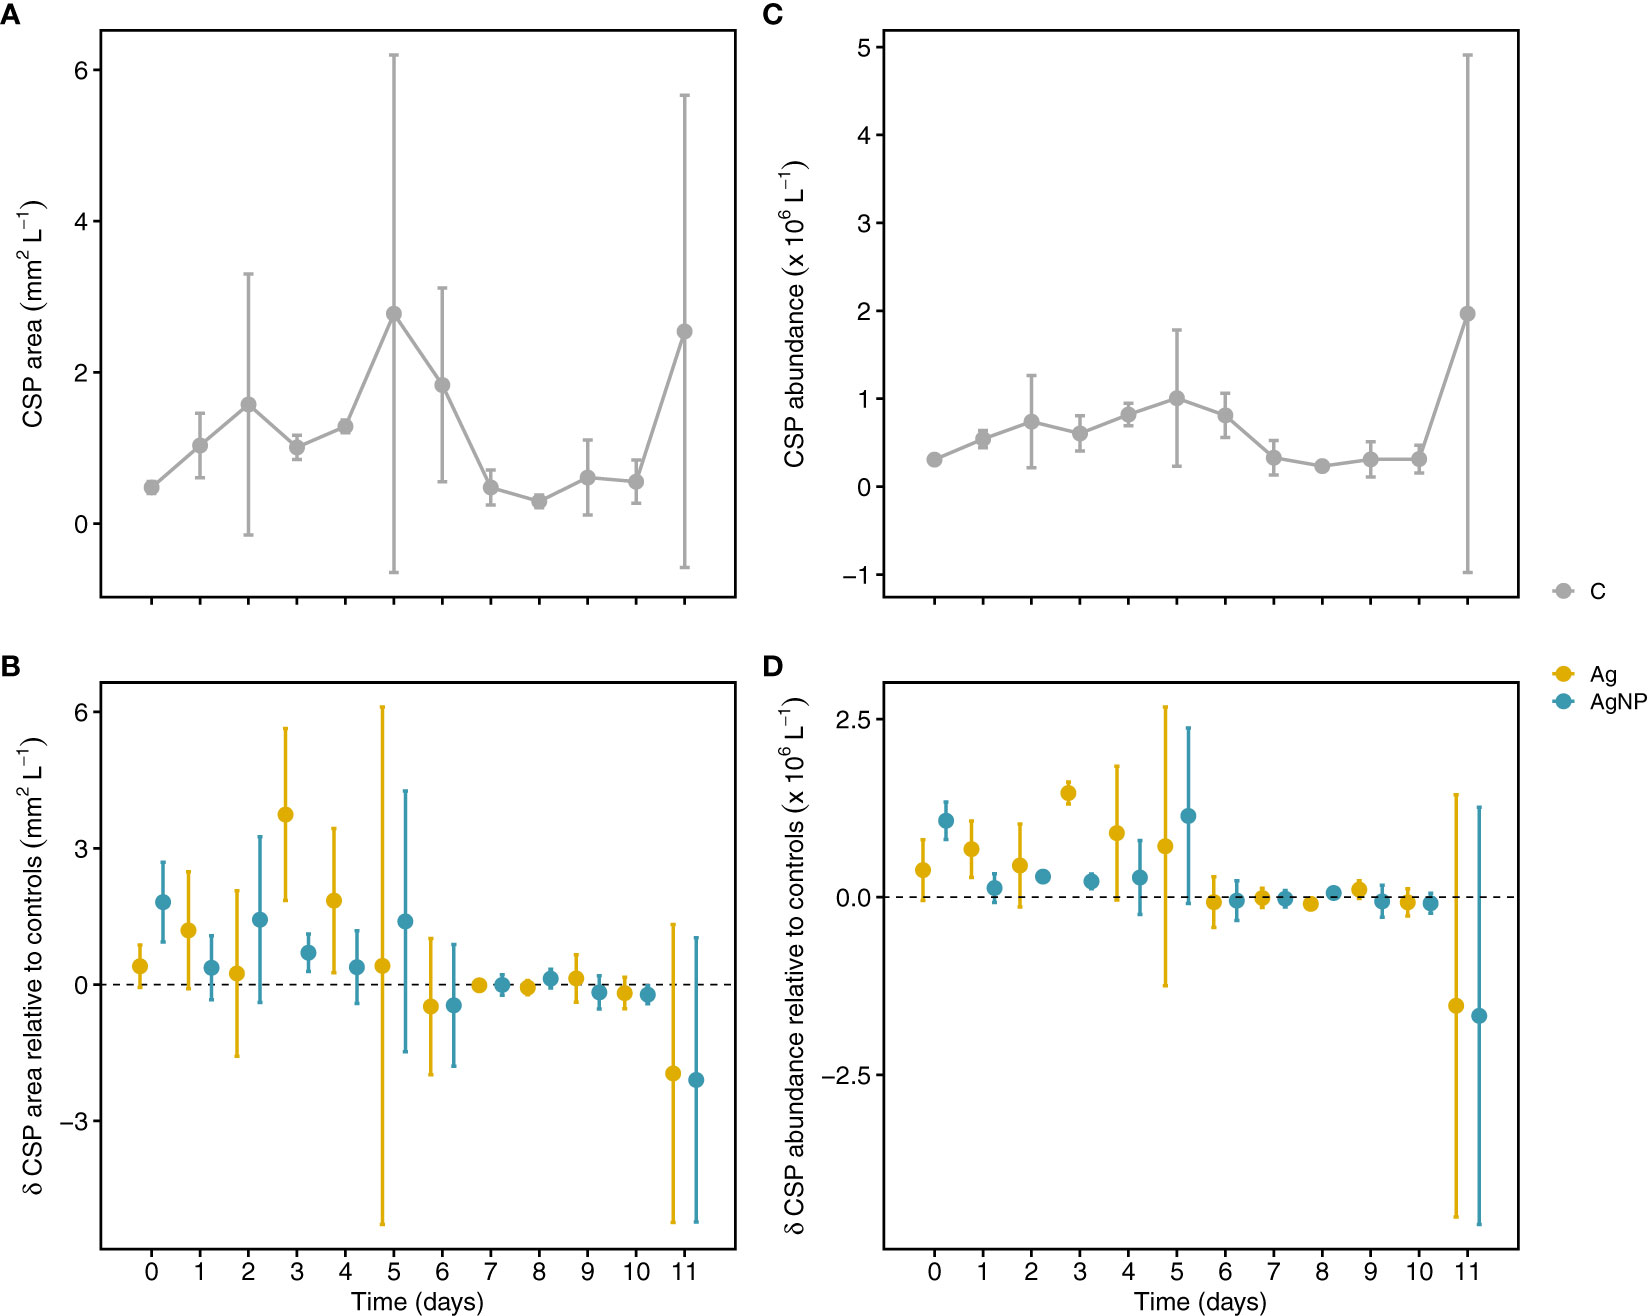
Figure 6 Temporal variation of Coomassie stainable particle (CSP) concentration. Depicted are CSP areas in controls (A) and treatments relative to controls (B). CSP particle abundance (particles L-1) in unamended mesocosms and treatments relative to controls (C, D). Error bars denote standard deviations of the mean (n = 3). Abbreviation of treatments as described in Figure 1.
Abundance of CSP-attached bacteria
Owing to the high content of amino acids and protein, CSP are veritable hotspots for bacterioplankton colonization (Mari and Kiørboe, 1996; Busch et al., 2017). The abundance of heterotrophic bacteria (HB) associated with CSP showed similar patterns in controls and Ag-amended enclosures, with slightly higher values in the Ag+ treatment (Figure S2). Abundance increased ~4.5 and ~3-fold from D0 to D5, respectively, and decreased thereafter to roughly initial values. In enclosures amended with AgNP, in turn, CSP-attached HB abundance increased over time, from 0.58 ± 0.25 × 10⁶ cells L-1 to 2.7 ± 0.6 × 10⁶ cells L-1 on D0 and D7, respectively (Figure S2). However, no significant difference in CSP-attached bacteria was found among experimental conditions.
Total and dissolved extracellular enzymatic activity
Since TEP primarily consists of polysaccharides and CSP is composed of proteins, we were interested in examining i) the dynamics of these microgels and the role of BGase and LAPase activities, respectively, and ii) how the addition of environmentally relevant concentrations of silver in the form of silver ions (Ag+) and silver nanoparticles (AgNP) influence these dynamics. Our results on the trends of total extracellular enzymatic activity (EEA) over time showed no significant differences among treatments and weak treatment effects compared to changes over time (Figures 7A, B, Figure S3A, and Table S2). Total APase activity rapidly decreased from ~100 nM h-1 on D0 to ~49 nM h-1 on D3, reaching lowest values in AgNP on D11 (Figure S3A). In contrast, total BGase hydrolysis rates rapidly increased from D0 on and peaked in all experimental conditions on D1 (Figure 7A; 38.7 ± 1.9 nM h-1, 34.7 ± 4.9 nM h-1 and 39.7 ± 0.8 nM h-1 in C, Ag+ and AgNP, respectively). Thereafter, a sharp decrease was evident until D3, when minimal rates of carbohydrate degradation were measured. The increase in total BGase rates until D6 was followed by an oscillating trend, overall decreasing until the end of the experiment on D11 (Figure 7A). The dissolved BGase activity slightly decreased between D0 and D1 in all experimental conditions (Figure 7C). A sharp increase was evident on D3, although with lower values in AgNP treatments compared to C and Ag+ treatments. The contribution of the dissolved BGase and LAPase activity declined until D7, more sharply in C compared to AgNP and Ag+-amended enclosures (Figure 7C). A slight increase was observed until the end of the experiment, with a higher proportion of cell-free BGase and LAPase activity in AgNP-amended mesocosms (Figures 7C, D). Cell-specific BGase hydrolysis rates were overall in good agreement with the temporal patterns measured for total BGase activities (rs(108) = .79, p < .01) (Figure 7E and Figure S1A).
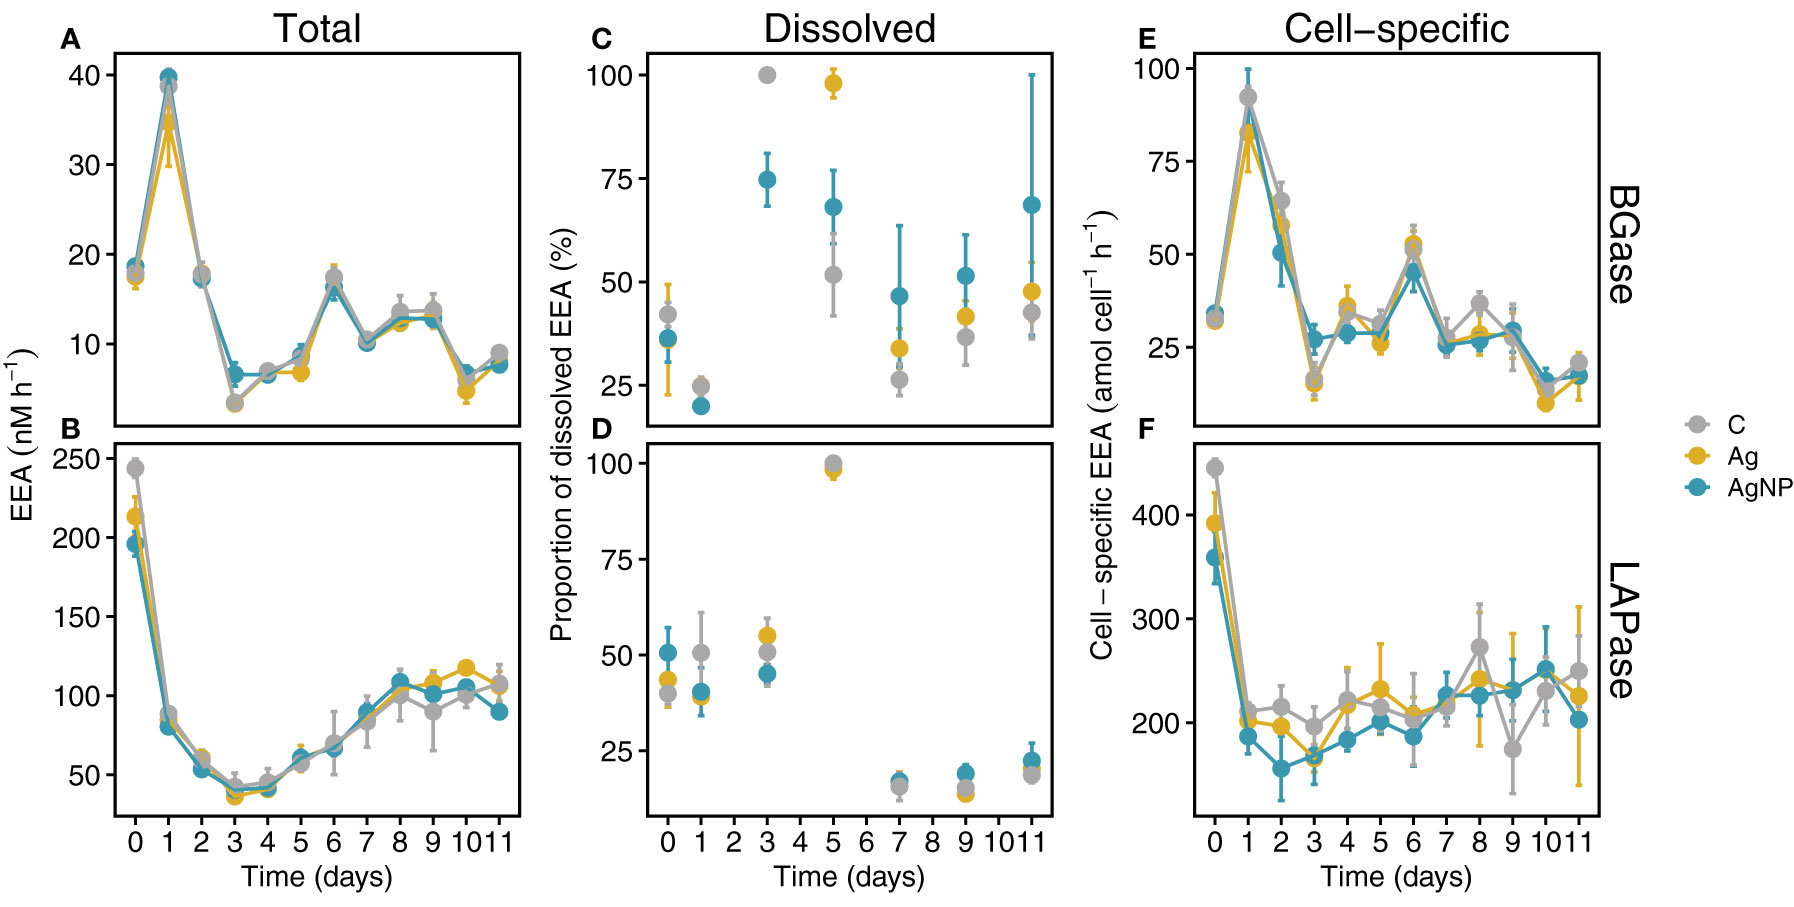
Figure 7 Temporal trends of extracellular enzymatic activities (EEA). Total BGase (A) and LAPase (B) activities. Proportions of dissolved BGase and LAPase hydrolysis during the mesocosm experiment (C, D). Temporal trends of cell-specific BGase and LAPase activities (E, F). Abbreviations: BGase, beta-glucosidases; LAPase, leucine-aminopeptidases. Error bars denote standard deviations of the mean (n = 3).
Total LAPase activity, in turn, sharply decreased between D0 and D1, reaching lowest rates on D3 (Figure 7B; 42.3 ± 8.7, 36.3 ± 0.4 and 40.5 ± 1.4 nM h-1 in C, Ag+ and AgNP, respectively). Subsequently, total LAPase activity increased steadily until D8 and remained stable between D9 and D11 (Figure 7B). Dissolved LAPase activity showed a large variability over time (Figure 7D; 15.3 ± 3.3% - up to 100%, 17.0 ± 2.6% - 98.5 ± 2.6%, 17.0 ± 1.1 - up to 100% in controls, Ag+ and AgNP, respectively) but similar trends in all treatments. The dissolved proportion of total LAPase hydrolysis was steady between D0 and D3, peaking on D5. Thereafter, dissolved LAPase proportions sharply decreased until D7 and remained low until D11 Figure 7D. Cell-specific LAPase hydrolysis rates showed similar trends as total LAPase (rs(108) = 0.67, p <0.01); however, the addition of silver, especially AgNP, resulted in slightly lower rates compared to controls during the first six days (Figure 7F; Figure S1A, and Table S2). It has been shown that high doses of silver (µg L-1 to mg L-1) can decrease the activity of (extracellular) enzymes in bacterioplankton (Lemire et al., 2013; Yonathan et al., 2022). Interestingly, high concentrations (i.e., mg L-1) of AgNP even seem to reduce the substrate affinities of extracellular enzymes in a concentration-dependent manner (Das et al., 2012b). Therefore, we expected that AgNP and especially Ag+ might inhibit EEA (e.g., BGase and LAPase). However, our results indicate that environmentally-relevant concentrations (i.e., ng L-1 range) of Ag+ and AgNP, as tested in this study, in conjunction with nutrient limitation only marginally affected bacterioplankton BGase and LAPase activities (Table S2). Possibly, the gradual increase in Ag concentration over ten days might have allowed the bacterioplankton community to cope with the possible toxic attributes of silver (Lemire et al., 2013). Noteworthy, the pronounced opposing trends of BGase and LAPase from D0 to D1 suggest different mechanisms and/or dynamics of TEP and CSP. Interestingly, while the addition of Ag+ and AgNP did not significantly inhibit total APase activity, AgNP significantly lowered the cell-specific APase activity (W = 141, padj = 0.004; Table S2).
Influence of silver on the relationship between microgel particles and enzyme activities
We used linear regression analysis to examine the relationship between cell-specific BGase activity and the TEP area (Figure 8A and Table S3). Linear regression and pairwise correlation analyses showed no significant relationship between cell-specific BGase activity and TEP area in the control mesocosm and the two silver treatments (Figures S1A-D). Previous studies, however, reported significant correlations of TEP abundance with glycolytic enzymatic activities (Lemarchand et al., 2006) and APase activities (Bar-Zeev et al., 2011) associated with phosphorus stress. In our experiment, neither was TEP abundance significantly related to BGase or APase activities, nor had the addition of silver significantly influenced these correlations (Figures S1A-D).
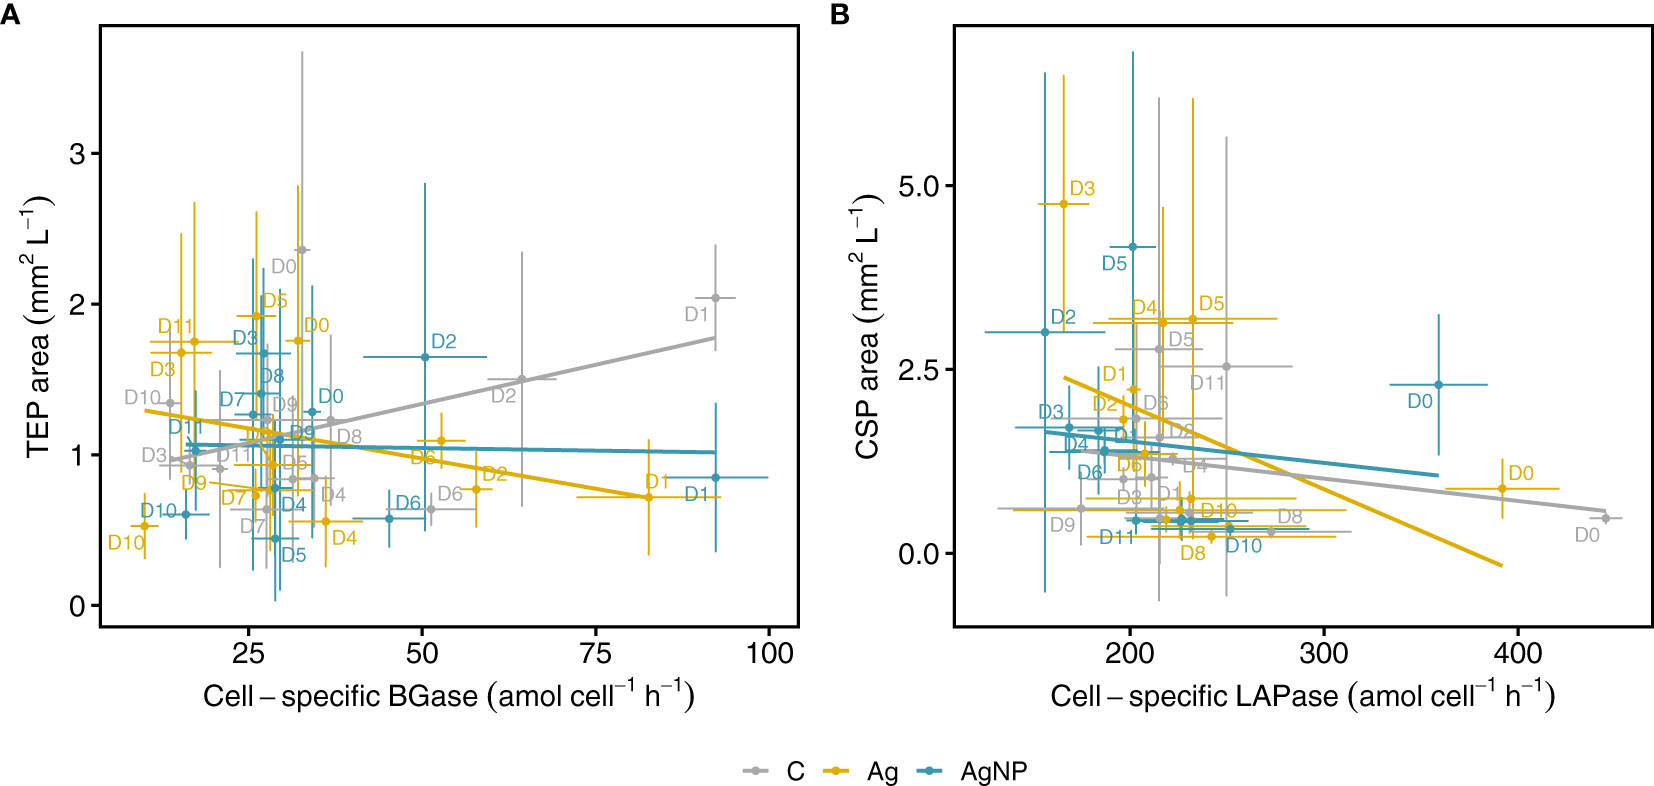
Figure 8 Relationships between microgel particles and extracellular enzymatic activities. Cell-specific BGase activity versus TEP area (A) and cell-specific LAPase activity against CSP area during the mesocosm experiment (B). Lines show linear regression fits over all time points for controls and treatments separately. Vertical and horizontal error bars denote standard deviations of the mean of EEA and microgels (each n = 3). C, unamended controls; Ag, silver ions; and AgNP, silver nanoparticles; BGase, beta-glucosidases; LAPase, leucine-aminopeptidases.
Similarly, we examined the relationship between cell-specific LAPase activity and the CSP area (Figure 8B). While these relationships were not significant between the two variables in control mesocosms (R2adj = 0.004, F(1, 34) = 1.131, p = 0.295) and the AgNP treatment (R2adj = -0.018, F(1, 34) = 0.377, p = 0.543), there was a weak relationship between the cell-specific LAPase activity and CSP area in the Ag+ treatment (R2adj = 0.127, F(1, 34) = 6.078, p = 0.019), indicating that Ag+ seemed to affect CSP area by reducing the cell-specific LAPase activity (Figure S1C and Table S3). While there was no consistent pattern regarding the applied Ag concentration, the effect of Ag+ on the LAPase : CSP relationship was largest on D3 (Figure 8B). This observation points towards a higher toxic potential of Ag+ as compared to AgNPs (Figures S1C, D). Indeed, it has been shown that Ag+ is more toxic than AgNP when tested on natural bacterial communities and isolates such as Escherichia coli and Pseudomonas putida (Choi et al., 2008; Colman et al., 2012; Matzke et al., 2014). In addition, our results indicate that even low Ag+ and AgNP concentrations differentially affect certain classes of extracellular enzymes. This has also been shown in a study by Colman et al. (2013), reporting that AgNP reduced leucine-aminopeptidase activity of soil microorganisms by 52%, whereas phosphatase activity was inhibited by only 27% (Colman et al., 2013).
In our study, total APase activity positively correlated with CSP area and abundance (Figure S1). Interestingly, the strength of these correlations increased substantially for cell-specific APase activity. This observation, together with the significantly higher phosphate concentrations in Ag+ and AgNP compared to controls (Figure 3D and Table S2), inspired further analysis of the associations between cell-specific APase activity and phosphate concentrations in relation to Ag+ and AgNP exposure (Figure S3B). Our results showed a strong influence of Ag+ (R2adj = -0.026, F(1, 34) = 0.12, p = 0.73) and AgNP (R2adj = -0.022, F(1, 34) = 0.62, p = 0.62) on the relationship between cell-specific APase activity and phosphate concentrations compared to controls (R2adj = 0.15, F(1, 34) = 6.90, p = 0.013; Table S3). According to the literature, APase hydrolysis rates typically decrease with increasing phosphate concentrations (Chrost and Overbeck, 1987; Ammerman and Azam, 1991; Zaccone et al., 2003), whereas in meso- and bathypelagic waters, bacterial phosphatases do not seem to be regulated by phosphate concentrations (Hoppe and Ullrich, 1999; Baltar et al., 2009). It has been proposed by these authors that in mesopelagic waters and under carbon limitation, bacterial phosphatases might facilitate the uptake of organic carbon compounds after the removal of phosphate groups. Although we cannot fully determine the role of nutrient limitation on the relationship between cell-specific APase activity and phosphate concentrations, the pronounced differences in the relationships between controls and the two Ag treatments suggest that bacterial phosphatases are indeed sensitive to ng L-1 concentrations of Ag+ and AgNPs (Table S3). Thus, our results demonstrate that silver pollution (Ag+ and AgNP) has the potential to alter microbial extracellular activities and, in turn, microgel concentration. Therefore, silver pollution can have far-reaching consequences for marine systems since microgels such as TEP and CSP play a central role in biogeochemical cycles and nutrient export.
Conclusion
This study revealed the complex relationship between chemical and biological parameters, which can, directly and indirectly, determine the degree of silver toxicity in marine ecosystems. Our results highlight the importance of cyanobacteria as the primary producers of CSP in the ultra-oligotrophic Mediterranean Sea. These protein-rich particles seemed to be a vital nitrogen source, given the link between CSP and bacterioplankton-mediated degradation through LAPases. Although the effects of silver on the studied processes were minor, we uncovered how silver toxicity might shape microgel dynamics in oligotrophic marine areas. Our results suggested that Ag+ and AgNP amendments, already at low concentrations (<100 ng L-1), can reduce cell-specific bacterioplankton LAPase and APase activity and, in turn, increase CSP concentration (area mm2 L-1). We believe that these relationships would become more robust under increasing Ag+ concentrations (exceeding 500 ng L-1) and inorganic nutrient loading. In addition, we hypothesize that a similar relationship between TEP and BGase might exist in ocean regions with higher primary production and different phytoplankton community composition (e.g., diatom dominance). The functioning of the microbial loop and its resilience against anthropogenic pollution is of great concern for future development and policymakers to manage the potential threats associated with increasing silver pollution. Therefore, we believe that multidisciplinary research efforts examining a broad range of silver concentrations and silver species across ecologically relevant productivity gradients are indispensable to deriving a mechanistic understanding of how increasing silver pollution will affect the structure and functioning of marine ecosystems.
Data availability statement
The original contributions presented in the study are included in the article/Supplementary Material. Further inquiries can be directed to the corresponding author.
Author contributions
AT and PP provided the original idea and contributed together with AE, LS, and CC-N to the study design of the mesocosm experiment and supervised it. LS, VM, MC, AT, PP, and IM conducted both field work and mesocosm experiments. LS, CC-N, and BP performed data analysis. LS and BP wrote the manuscript with contributions from all authors. All authors contributed to the article and approved the submitted version.
Funding
LS was supported by the Helmholtz Association and EU 2020 Horizon Research and Innovation Programme (No. 731065 – AQUACOSM).
Acknowledgments
Special thanks to the CRETACOSMOS mesocosm facility and the SiNaME team for providing environmental and logistic support, organization, and sampling efforts, and especially Eleni Dafnomilli and Snezana Zivanovic for nutrient analyses.
Conflict of interest
The authors declare that the research was conducted in the absence of any commercial or financial relationships that could be construed as a potential conflict of interest.
Publisher’s note
All claims expressed in this article are solely those of the authors and do not necessarily represent those of their affiliated organizations, or those of the publisher, the editors and the reviewers. Any product that may be evaluated in this article, or claim that may be made by its manufacturer, is not guaranteed or endorsed by the publisher.
Supplementary material
The Supplementary Material for this article can be found online at: https://www.frontiersin.org/articles/10.3389/fmars.2022.955488/full#supplementary-material
Supplementary Figure 1 | Pairwise Spearman correlation coefficients of biological and chemical variables, considering all samples (A) C, unamended controls, (B) Ag, silver ions additions (C) and AgNP, silver nanoparticles (D). Correlation coefficients of non-significant correlations (p > 0.01) are crossed out.
Supplementary Figure 2 | Abundance of CSP-particle-attached heterotrophic bacterioplankton. CSP, Coomassie stainable particles; C, unamended controls; Ag, silver ions; and AgNP, silver nanoparticles.
Supplementary Figure 3 | Temporal dynamics of alkaline phosphatases (A) and the relationships between cell-specific APase activity and phosphate concentrations (B). Abbreviations: APase, alkaline phosphatase; C, unamended controls; Ag, silver ions; and AgNP, silver nanoparticles.
Supplementary Table 1 | Overview of chemical and biological variables, their eigenvalues for the first two principal component axes, and the combined contribution considering PC1 and PC2.
Supplementary Table 2 | Summary of statistical tests to examine potential differences of chemical and biological variables between treatments and of treatments within different time points. Abbreviations: RM ANOVA, Repeated Measures Analysis of Variance, sheet 1; Pairwise Wilcoxon Rank Sum Test, sheet 2; ONE-WAY ANOVA, One-way analysis of variance, sheet 3; C, unamended controls; Ag, silver ions; AgNP, silver nanoparticles. Abbreviation of measurement variables as described in.
Supplementary Table 3 | Summary of linear regressions between cell-specific extracellular enzyme activities and microgel concentrations and phosphate concentrations. Coefficients of the lm model output are depicted in sheet 1, and the lm model performance results are depicted in sheet 2.
References
Allen J. I., Eknes M., Evensen G. (2003). An ensemble kalman filter with a complex marine ecosystem model: hindcasting phytoplankton in the Cretan Sea. Ann. Geophys 21 (1), 399–411. doi: 10.5194/angeo-21-399-2003
Ammerman J. W., Azam F. (1991). Bacterial 5'-nucleotidase activity in estuarine and coastal marine waters: Characterization of enzyme activity. Limnol Oceanogr 36 (7), 1427–1436. doi: 10.4319/lo.1991.36.7.1427
Arar E. J., Collins G. B. (1997). Method 445.0: In vitro determination of chlorophyll a and pheophytin a in marine and freshwater algae by fluorescence (Cincinnati: United States Environmental Protection Agency, Office of Research and Development, National Exposure Research Laboratory).
Arnosti C. (2011). Microbial extracellular enzymes and the marine carbon cycle. Ann. Rev. Mar. Sci. 3, 401–425. doi: 10.1146/annurev-marine-120709-142731
Azam F., Malfatti F. (2007). Microbial structuring of marine ecosystems. Nat. Rev. Microbiol. 5 (10), 782–791. doi: 10.1038/nrmicro1747
Baltar F. (2017). Watch out for the "Living dead": Cell-free enzymes and their fate. Front. Microbiol. 8 (2438). doi: 10.3389/fmicb.2017.02438
Baltar F., Arístegui J., Sintes E., van Aken H. M., Gasol J. M., Herndl G. J. (2009). Prokaryotic extracellular enzymatic activity in relation to biomass production and respiration in the meso- and bathypelagic waters of the (sub)tropical Atlantic. Environ. Microbiol. 11 (8), 1998–2014. doi: 10.1111/j.1462-2920.2009.01922.x
Baptista M. S., Miller R. J., Halewood E. R., Hanna S. K., Almeida C. M., Vasconcelos V. M., et al. (2015). Impacts of silver nanoparticles on a natural estuarine plankton community. Environ. Sci. Technol. 49 (21), 12968–12974. doi: 10.1021/acs.est.5b03285
Bar-Zeev E., Berman T., Rahav E., Dishon G., Herut B., Berman-Frank I. (2011). Transparent exopolymer particle (TEP) dynamics in the eastern Mediterranean Sea. Mar. Ecol. Prog. Ser. 431, 107–118. doi: 10.3354/meps09110
Benn T. M., Westerhoff P. (2008). Nanoparticle silver released into water from commercially available sock fabrics. Environ. Sci. Technol. 42 (11), 4133–4139. doi: 10.1021/es7032718
Bielmyer-Fraser G. K., Jarvis T. A., Lenihan H. S., Miller R. J. (2014). Cellular partitioning of nanoparticulate versus dissolved metals in marine phytoplankton. Environ. Sci. Technol. 48 (22), 13443–13450. doi: 10.1021/es501187g
Burchardt A. D., Carvalho R. N., Valente A., Nativo P., Gilliland D., Garcia C. P., et al. (2012). Effects of silver nanoparticles in diatom thalassiosira pseudonana and cyanobacterium synechococcus sp. Environ. Sci. Technol. 46 (20), 11336–11344. doi: 10.1021/es300989e
Busch K., Endres S., Iversen M. H., Michels J., Nöthig E.-M., Engel A. (2017). Bacterial colonization and vertical distribution of marine gel particles (TEP and CSP) in the Arctic fram strait. Front. Mar. Sci. 4. doi: 10.3389/fmars.2017.00166
Cho B. C., Azam F. (1988). Major role of bacteria in biogeochemical fluxes in the ocean's interior. Nature 332 (6163), 441–443. doi: 10.1038/332441a0
Choi O., Deng K. K., Kim N. J., Ross L. Jr., Surampalli R. Y., Hu Z. (2008). The inhibitory effects of silver nanoparticles, silver ions, and silver chloride colloids on microbial growth. Water Res. 42 (12), 3066–3074. doi: 10.1016/j.watres.2008.02.021
Chrost R. J., Overbeck J. (1987). Kinetics of alkaline phosphatase activity and phosphorus availability for phytoplankton and bacterioplankton in lake plu\see (North German eutrophic lake). Microb. Ecol. 13 (3), 229–248. doi: 10.1007/BF02025000
Cisternas-Novoa C., Lee C., Engel A. (2015). Transparent exopolymer particles (TEP) and coomassie stainable particles (CSP): Differences between their origin and vertical distributions in the ocean. Mar. Chem. 175, 56–71. doi: 10.1016/j.marchem.2015.03.009
Colman B. P., Arnaout C. L., Anciaux S., Gunsch C. K., Hochella M. F. Jr., Kim B., et al. (2013). Low concentrations of silver nanoparticles in biosolids cause adverse ecosystem responses under realistic field scenario. PloS One 8 (2), e57189. doi: 10.1371/journal.pone.0057189
Colman B. P., Wang S. Y., Auffan M., Wiesner M. R., Bernhardt E. S. (2012). Antimicrobial effects of commercial silver nanoparticles are attenuated in natural streamwater and sediment. Ecotoxicology 21 (7), 1867–1877. doi: 10.1007/s10646-012-0920-5
Das P., Metcalfe C. D., Xenopoulos M. A. (2014). Interactive effects of silver nanoparticles and phosphorus on phytoplankton growth in natural waters. Environ. Sci. Technol. 48 (8), 4573–4580. doi: 10.1021/es405039w
Das P., Williams C. J., Fulthorpe R. R., Hoque M. E., Metcalfe C. D., Xenopoulos M. A. (2012a). Changes in bacterial community structure after exposure to silver nanoparticles in natural waters. Environ. Sci. Technol. 46 (16), 9120–9128. doi: 10.1021/es3019918
Das P., Xenopoulos M. A., Williams C. J., Hoque M. E., Metcalfe C. D. (2012b). Effects of silver nanoparticles on bacterial activity in natural waters. Environ. Toxicol. Chem. 31 (1), 122–130. doi: 10.1002/etc.716
Ediger D., Tuğrul S., Yılmaz A. (2005). Vertical profiles of particulate organic matter and its relationship with chlorophyll-a in the upper layer of the NE Mediterranean Sea. J. Mar. Syst. 55 (3-4), 311–326. doi: 10.1016/j.jmarsys.2004.09.003
Engel A. (2002). Direct relationship between CO2 uptake and transparent exopolymer particles production in natural phytoplankton. J. Plankton Res. 24 (1), 49–53.
Engel A. (2009). “Determination of marine gel particles,” in Practical guidelines for the analysis of seawater, ed, vol. 408 . Ed. Wurl O. (CRC Press: Taylor & Francis Group, Boca Raton).
Engel A., Endres S., Galgani L., Schartau M. (2020). Marvelous marine microgels: On the distribution and impact of gel-like particles in the oceanic water-column. Front. Mar. Sci. 7. doi: 10.3389/fmars.2020.00405
Engel A., Goldthwait S., Passow U., Alldredge A. (2002). Temporal decoupling of carbon and nitrogen dynamics in a mesocosm diatom bloom. Limnology Oceanography 47 (3), 753–761. doi: 10.4319/lo.2002.47.3.0753
Falkowski P. G., Barber R. T., Smetacek V. V. (1998). Biogeochemical controls and feedbacks on ocean primary production. Science 281 (5374), 200–207.
Galgani L., Tsapakis M., Pitta P., Tsiola A., Tzempelikou E., Kalantzi I., et al. (2019). Microplastics increase the marine production of particulate forms of organic matter. Environ. Res. Lett. 14 (12), 124085. doi: 10.1088/1748-9326/ab59ca
Giese B., Klaessig F., Park B., Kaegi R., Steinfeldt M., Wigger H., et al. (2018). Risks, release and concentrations of engineered nanomaterial in the environment. Sci. Rep. 8 (1), 1565. doi: 10.1038/s41598-018-19275-4
Gottschalk F., Sonderer T., Scholz R. W., Nowack B. (2009). Modeled environmental concentrations of engineered nanomaterials (TiO2, ZnO, Ag, CNT, fullerenes) for different regions. Environ. Sci. Technol. 43 (24), 9216–9222. doi: 10.1021/es9015553
Hedges J. I., Stern J. H. (1984). Carbon and nitrogen determinations of carbonate-containing solids1. Limnol Oceanogr 29 (3), 657–663. doi: 10.4319/lo.1984.29.3.0657
Hoppe H. G. (1993). “Use of fluorogenic model substrates for extracellular enzyme activity (EEA) measurement of bacteria,” in Current methods in aquatic microbial ecology. Eds. Kemp P., Sherr B., Sherr E., Cole J. (Boca Raton: CRC Press), 423–431.
Hoppe H. G., Ullrich S. (1999). Profiles of ectoenzymes in the Indian ocean: Phenomena of phosphatase activity in the mesopelagic zone. Aquat Microb. Ecol. 19 (2), 139–148. doi: 10.3354/ame019139
Hug L. A., Baker B. J., Anantharaman K., Brown C. T., Probst A. J., Castelle C. J., et al. (2016). A new view of the tree of life. Nat. Microbiol. 1 (5), 16048. doi: 10.1038/nmicrobiol.2016.48
Ignatiades L. (1998). The productive and optical status of the oligotrophic waters of the southern Aegean Sea (Cretan Sea), Eastern Mediterranean. J. Plankton Res. 20 (5), 985–995. doi: 10.1093/plankt/20.5.985
Ivančič I., Deggobis D. (1984). An optimal manual procedure for ammonia analysis in natural waters by the indophenol blue method. Water Res. 18 (9), 1143–1147. doi: 10.1016/0043-1354(84)90230-6
Kalantzi I., Mylona K., Toncelli C., Bucheli T. D., Knauer K., Pergantis S. A., et al. (2019). Ecotoxicity of silver nanoparticles on plankton organisms: a review. J. Nanoparticle Res. 21 (3) 1–26. doi: 10.1007/s11051-019-4504-7
Krom M. D., Kress N., Brenner S., Gordon L. I. (1991). Phosphorus limitation of primary productivity in the eastern Mediterranean Sea. Limnol Oceanogr 36 (3), 424–432. doi: 10.4319/lo.1991.36.3.0424
Lansdown A. B. (2006). Silver in health care: antimicrobial effects and safety in use. Curr. Probl Dermatol. 33, 17–34. doi: 10.1159/000093928
Lemarchand C., Jardillier L., Carrias J. F., Richardot M., Debroas D., Sime-Ngando T., et al. (2006). Community composition and activity of prokaryotes associated to detrital particles in two contrasting lake ecosystems. FEMS Microbiol. Ecol. 57 (3), 442–451. doi: 10.1111/j.1574-6941.2006.00131.x
Lemire J. A., Harrison J. J., Turner R. J. (2013). Antimicrobial activity of metals: mechanisms, molecular targets and applications. Nat. Rev. Microbiol. 11 (6), 371–384. doi: 10.1038/nrmicro3028
Long R. A., Azam F. (1996). Abundant protein-containing particles in the sea. Aquat Microb. Ecol. 10 (3), 213–221. doi: 10.3354/ame010213
Manna V., Malfatti F., Banchi E., Cerino F., De Pascale F., Franzo A., et al. (20201242). Prokaryotic response to phytodetritus-derived organic material in epi- and mesopelagic Antarctic waters. Front. Microbiol. 11. doi: 10.3389/fmicb.2020.01242
Mari X., Kiørboe T. (1996). Abundance, size distribution and bacterial colonization of transparent exopolymeric particles (TEP) during spring in the kattegat. J. Plankton Res. 18 (6), 969–986. doi: 10.1093/plankt/18.6.969
Martin M. A., Sendra O. A., Bastos A., Bauer N., Bertram C., Blenckner T., et al. (2021). Ten new insights in climate science 2021 – a horizon scan. Glob Sustain, (4) 1–39. doi: 10.1017/sus.2021.25
Matzke M., Jurkschat K., Backhaus T. (2014). Toxicity of differently sized and coated silver nanoparticles to the bacterium Pseudomonas putida: risks for the aquatic environment? Ecotoxicology 23 (5), 818–829. doi: 10.1007/s10646-014-1222-x
McTeer J., Dean A. P., White K. N., Pittman J. K. (2014). Bioaccumulation of silver nanoparticles into daphnia magna from a freshwater algal diet and the impact of phosphate availability. Nanotoxicology 8 (3), 305–316. doi: 10.3109/17435390.2013.778346
Nagata T. (2008). “Organic matter–bacteria interactions in seawater,” in Microbial ecology of the oceans (New York, NY, USA: John Wiley & Sons, Inc), 207–241.
Nissimov J. I., Vandzura R., Johns C. T., Natale F., Haramaty L., Bidle K. D. (2018). Dynamics of transparent exopolymer particle production and aggregation during viral infection of the coccolithophore, emiliania huxleyi. Environ. Microbiol. 20 (8), 2880–2897. doi: 10.1111/1462-2920.14261
Nowack B., Bucheli T. D. (2007). Occurrence, behavior and effects of nanoparticles in the environment. Environ. pollut. 150 (1), 5–22. doi: 10.1016/j.envpol.2007.06.006
Parinos C., Gogou A., Krasakopoulou E., Lagaria A., Giannakourou A., Karageorgis A. P., et al. (2017). Transparent exopolymer particles (TEP) in the NE Aegean Sea frontal area: Seasonal dynamics under the influence of black Sea water. Cont Shelf Res. 149, 112–123. doi: 10.1016/j.csr.2017.03.012
Petihakis G., Perivoliotis L., Korres G., Ballas D., Frangoulis C., Pagonis P., et al. (2018). An integrated open-coastal biogeochemistry, ecosystem and biodiversity observatory of the eastern Mediterranean – the Cretan Sea component of the POSEIDON system. Ocean Sci. 14 (5), 1223–1245. doi: 10.5194/os-14-1223-2018
Porter K. G., Feig Y. S. (1980). The use of DAPI for identifying and counting aquatic microflora1. Limnol Oceanogr 25 (5), 943–948. doi: 10.4319/lo.1980.25.5.0943
Pulit-Prociak J., Banach M. (2016). Silver nanoparticles – a material of the future…? Open Chem. 14 (1), 76–91. doi: 10.1515/chem-2016-0005
Ratte H. T. (1999). Bioaccumulation and toxicity of silver compounds: A review. Environ. Toxicol. Chem. 18 (1), 89–108. doi: 10.1002/etc.5620180112
R Core Team (2021). "R: A language and environment for statistical computing". 4.1.0 ed (Vienna, Austria: R Foundation for Statistical Computing).
RStudio Team (2022). "RStudio: Integrated development for r". 2022.2.0.443 (Boston, MA: RStudio, Inc).
Schneider C. A., Rasband W. S., Eliceiri K. W. (2012). NIH Image to ImageJ: 25 years of image analysis. Nat. Methods 9 (7), 671–675. doi: 10.1038/nmeth.2089
Siokou-Frangou I., Christaki U., Mazzocchi M. G., Montresor M., Ribera d'Alcalá M., Vaqué D., et al. (2010). Plankton in the open Mediterranean Sea: a review. Biogeosciences 7 (5), 1543–1586. doi: 10.5194/bg-7-1543-2010
Smith D. C., Steward G. F., Long R. A., Azam F. (1995). Bacterial mediation of carbon fluxes during a diatom bloom in a mesocosm. Deep-Sea Res. Pt II 42 (1), 75–97. doi: 10.1016/0967-0645(95)00005-B
Strickland J. D. H., Parsons T. R. (1972). A practical handbook of seawater analysis. Bulletin 167, 2nd ed. Fisheries Research Board of Canada, Ottawa, Canada.
Sun T. Y., Gottschalk F., Hungerbuhler K., Nowack B. (2014). Comprehensive probabilistic modelling of environmental emissions of engineered nanomaterials. Environ. pollut. 185, 69–76. doi: 10.1016/j.envpol.2013.10.004
Thornton D. C. O., Chen J. (2017). Exopolymer production as a function of cell permeability and death in a diatom (Thalassiosira weissflogii) and a cyanobacterium (Synechococcus elongatus). J. Phycol 53 (2), 245–260. doi: 10.1111/jpy.12470
Traving S. J., Thygesen U. H., Riemann L., Stedmon C. A. (2015). A model of extracellular enzymes in free-living microbes: which strategy pays off? Appl. Environ. Microbiol. 81 (21), 7385–7393. doi: 10.1128/AEM.02070-15
Tsiola A., Toncelli C., Fodelianakis S., Michoud G., Bucheli T. D., Gavriilidou A., et al. (2018). Low-dose addition of silver nanoparticles stresses marine plankton communities. Environ. Sci. Nano 5 (8), 1965–1980. doi: 10.1039/c8en00195b
Verdugo P., Alldredge A. L., Azam F., Kirchman D. L., Passow U., Santschi P. H. (2004). The oceanic gel phase: a bridge in the DOM-POM continuum. Mar. Chem. 92 (1-4), 67–85. doi: 10.1016/j.marchem.2004.06.017
Yamada Y., Tomaru Y., Fukuda H., Nagata T. (2018). Aggregate formation during the viral lysis of a marine diatom. Front. Mar. Sci. 5. doi: 10.3389/fmars.2018.00167
Yentsch C. S., Menzel D. W. (1963). A method for the determination of phytoplankton chlorophyll and phaeophytin by fluorescence. Deep-Sea Res. Oceanogr Abstr 10 (3), 221–231. doi: 10.1016/0011-7471(63)90358-9
Yonathan K., Mann R., Mahbub K. R., Gunawan C. (2022). The impact of silver nanoparticles on microbial communities and antibiotic resistance determinants in the environment. Environ. pollut. 293, 118506. doi: 10.1016/j.envpol.2021.118506
Zaccone R., Monticelli L. S., Seritti A., Santinelli C., Azzaro M., Boldrin A., et al. (2003). Bacterial processes in the intermediate and deep layers of the Ionian Sea in winter 1999: Vertical profiles and their relationship to the different water masses. J. Geophys Res. 108 (C9), 8117. doi: 10.1029/2002jc001625
Zäncker B., Cunliffe M., Engel A. (2021). Eukaryotic community composition in the sea surface microlayer across an east–west transect in the Mediterranean Sea. Biogeosciences 18 (6), 2107–2118. doi: 10.5194/bg-18-2107-2021
Keywords: transparent exopolymer particles (TEP), coomassie stainable particles (CSP), extracellular enzymatic activity (EEA), silver nanoparticles (AgNPs), mesocosm experiment, eastern mediterranean sea, pollution
Citation: Scheidemann L, Pontiller B, Manna V, Cisternas-Novoa C, Celussi M, Tsiola A, Pitta P, Magiopoulos I and Engel A (2022) Dynamics and enzymatic degradation of exopolymer particles under increasing concentrations of silver ions and nanoparticles during a marine mesocosm experiment. Front. Mar. Sci. 9:955488. doi: 10.3389/fmars.2022.955488
Received: 28 May 2022; Accepted: 23 August 2022;
Published: 14 September 2022.
Edited by:
Jinping Cheng, Hong Kong University of Science and Technology, ChinaReviewed by:
Neng Yan, China University of Geosciences Wuhan, ChinaGuicheng Zhang, Tianjin University of Science and Technology, China
Copyright © 2022 Scheidemann, Pontiller, Manna, Cisternas-Novoa, Celussi, Tsiola, Pitta, Magiopoulos and Engel. This is an open-access article distributed under the terms of the Creative Commons Attribution License (CC BY). The use, distribution or reproduction in other forums is permitted, provided the original author(s) and the copyright owner(s) are credited and that the original publication in this journal is cited, in accordance with accepted academic practice. No use, distribution or reproduction is permitted which does not comply with these terms.
*Correspondence: Benjamin Pontiller, bpontiller@geomar.de