Nitrogen cycling in sediments on the NW African margin inferred from N and O isotopes in benthic chambers
 Andrew W. Dale1*
  David Clemens1
  Kirstin Dähnke2
  Frederike Korth1†
  Scott D. Wankel3
  Ulrike Schroller-Lomnitz1
  Klaus Wallmann1
  Stefan Sommer1
- 1GEOMAR Helmholtz Centre for Ocean Research Kiel, Kiel, Germany
- 2Institute of Carbon Cycles, Helmholtz Centre Hereon, Geesthacht, Germany
- 3Department of Marine Chemistry and Geochemistry, Woods Hole Oceanographic Institution, Woods Hole, MA, United States
Benthic nitrogen cycling in the Mauritanian upwelling region (NW Africa) was studied in June 2014 from the shelf to the upper slope where minimum bottom water O2 concentrations of 25 µM were recorded. Benthic incubation chambers were deployed at 9 stations to measure fluxes of O2, dissolved inorganic carbon (DIC) and nutrients (NO3-, NO2-, NH4+, PO43-, H4SiO4) along with the N and O isotopic composition of nitrate (δ15N-NO3- and δ18O-NO3-) and ammonium (δ15N-NH4+). O2 and DIC fluxes were similar to those measured during a previous campaign in 2011 whereas NH4+ and PO43- fluxes on the shelf were 2 – 3 times higher and possibly linked to a long-term decline in bottom water O2 concentrations. The mean isotopic fractionation of NO3- uptake on the margin, inferred from the loss of NO3- inside the chambers, was 1.5 ± 0.4 ‰ for 15/14N (15ϵapp) and 2.0 ± 0.5 ‰ for 18/16O (18ϵapp). The mean 18ϵapp:15ϵapp ratio on the shelf (< 100 m) was 2.1 ± 0.3, and higher than the value of 1 expected for microbial NO3-reduction. The 15ϵapp are similar to previously reported isotope effects for NO3- respiration in marine sediments but lower than determined in 2011 at a same site on the shelf. The sediments were also a source of 15N-enriched NH4+ (9.0 ± 0.7 ‰). A numerical model tuned to the benthic flux data and that specifically accounts for the efflux of 15N-enriched NH4+ from the seafloor, predicted a net benthic isotope effect of N loss (15ϵsed) of 3.6 ‰; far above the more widely considered value of ~0‰. This result is further evidence that the assumption of a universally low or negligible benthic N isotope effect is not applicable to oxygen-deficient settings. The model further suggests that 18ϵapp:15ϵapp trajectories > 1 in the benthic chambers are most likely due to aerobic ammonium oxidation and nitrite oxidation in surface sediments rather than anammox, in agreement with published observations in the water column of oxygen deficient regions.
1. Introduction
The Canary upwelling region along the north-western African coast is an important eastern boundary current system with regard to primary production (0.33 Gtons C yr−1), second in magnitude only to the Benguela upwelling (Carr, 2001). Off Mauritania, high primary production is driven by upwelling of nutrient-rich South Atlantic Central Water (SACW) and huge dust inputs from the adjacent Sahara-Sahel region (Fischer et al., 2010). Subsurface waters off Mauritania are better ventilated than the Benguela system and the other large upwelling systems in the Eastern Tropical Pacific, with minimum bottom water dissolved O2 levels on the margin of several tens of micromoles per liter (Hartmann et al., 1976; Dale et al., 2014; Thomsen et al., 2019). However, the SACW in the Eastern Tropical North Atlantic (ETNA) appears to be undergoing significant deoxygenation of ca. 0.5 µmol kg–1 yr–1 (Stramma et al., 2008), possibly due to a warming-induced decrease in solubility and biological O2 consumption (Schmidtko et al., 2017). At this rate, subsurface waters on the Mauritanian margin are heading towards anoxia by the end of the 21st century.
In the Eastern Tropical Pacific and South Atlantic upwelling systems, the anoxic water column is a hotspot of microbially-mediated N loss, either by denitrification (nitrate reduction to N2) and/or anammox (anaerobic oxidation of ammonium by nitrite to N2) (Devol et al., 2006; Lam and Kuypers, 2011). Along with the Arabian Sea and Bay of Bengal, most fixed N loss in ocean waters occurs in these ‘oxygen minimum zones (OMZ)’ (Gruber, 2008). In sediments, by contrast, and with the possible exception of the oligotrophic deep-sea and euxinic basins, microbial transformation of fixed N to N2 by microorganisms occurs almost everywhere (Middelburg et al., 1996). In the Mauritanian OMZ, where pelagic O2 concentrations are consistently above the inhibition threshold for denitrification (ca. 5 μM), benthic denitrification/anammox is the only significant N loss pathway. Benthic denitrification rates measured using 15N-labelling techniques range from around 4 mmol N m-2 d-1 on the shelf to 1 mmol N m-2 d-1 on the upper slope (Sokoll et al., 2016), and are toward the higher end for open-ocean continental margins. Anammox was found to be of minor importance (Sokoll et al., 2016).
Current understanding of the fixed N balance in the ocean is dependent on knowledge of the rates of N transformation pathways, both in the water column and in the sediment. To a large extent, this is achieved by balancing the marine inventory of stable N isotopes (14N and 15N) under steady state conditions (Brandes and Devol, 2002). This approach is possible because most microbial N transformation processes impart unique degrees of isotopic discrimination, or fractionation, of one isotope over another, expressed as a kinetic isotope effect (KIE), or ϵ (unit: ‰). (In this paper, ϵ = (α – 1)·1000, where α is the fractionation factor defined as Lk/Hk, and where k denotes the reaction rate constant of the heavy (H) and light (L) isotopologues). Studies in the water column and in the laboratory have revealed a wealth of information concerning N and O effects of microbial N cycling (e.g. Sigman et al., 2006; Casciotti and McIlvin, 2007; Granger et al., 2008; Buchwald and Casciotti, 2013; Gaye et al., 2013; Bourbonnais et al., 2015 and many others). For instance, the N and O isotope effects during the dissimilatory reduction of nitrate (NO3-) to nitrite (NO2-) are similar at ca. 15 – 30 ‰ in favor of the lighter isotopes (Voss et al., 2001; Kritee et al., 2012; Bourbonnais et al., 2015). Oxidation of NO2- to NO3-, in contrast, has an inverse isotope effect due to fractionation at the enzymatic level during N–O bond formation by nitrite oxidoreductase (Casciotti, 2009). NO2- oxidation leads to enrichment of 14N and 16O in the residual NO2- and an enrichment of 15N and 18O in the NO3- product (Casciotti, 2009). This divergence has led numerous investigators to conclude that a significant fraction of NO2- produced by reduction of NO3- in oxygen deficient waters is reoxidized to NO3- (Casciotti and McIlvin, 2007; Buchwald and Casciotti, 2013; Casciotti et al., 2013; Gaye et al., 2013; Bourbonnais et al., 2015; Casciotti, 2016; Granger and Wankel, 2016). Fewer studies have been carried out in sediments, although so far it appears that the microbial isotope effects observed in the water column are largely transferrable to the benthic environment (Lehmann et al., 2004; Lehmann et al., 2007; Alkhatib et al., 2012; Dale et al., 2014; Dale et al., 2019). The major difference between the water column and sediment rests with the much lower isotopic fractionation of NO3- uptake by sediments (hereafter benthic fractionation), arising from transport limitation of NO3- diffusion within the sediment (< 3 ‰; Brandes and Devol, 1997; Lehmann et al., 2004). Based on this assumption, it is understood that around two-thirds of the global oceanic fixed N loss takes place in the sediment and one-third in OMZ waters (Brandes and Devol, 2002; Somes et al., 2013). However, more recent studies suggest that the benthic N isotope effect may be higher, especially in sediments underlying oxygen-deficient bottom waters (Lehmann et al., 2007; Alkhatib et al., 2012; Dähnke and Thamdrup, 2013; Dale et al., 2014; Dale et al., 2019). Furthermore, it can be enhanced by the efflux of 15N-enriched NH4+ from the sediment (Lehmann et al., 2007; Granger et al., 2011; Alkhatib et al., 2012). Accurate estimates of the total benthic N isotope effect that also includes NH4+ and other N species, and thus more relevant for the global N budget, require a deeper understanding of the rate of benthic N loss and associated N isotope transformations.
In this study, we deployed in situ benthic incubation chambers on the Mauritanian margin in 2014 during the transition from the strong to weak upwelling season (Thomsen et al., 2019). Fieldwork was conducted along a transect from the shallow shelf to the upper slope at 18 °N. Our objective was to determine the recycling rates and exchange fluxes of dissolved inorganic nitrogen (DIN: NO3-, NO2-, NH4+) between the sediment and water column and compare them to results from an earlier campaign in 2011. We also measured the N and O isotopic composition of NO3- (δ15N-NO3- and δ18O-NO3-) and NH4+ (δ15N-NH4+) inside the chambers. With this information, and with the help of a numerical model, we were able to calculate the total the benthic N isotope effect along with further information on benthic N turnover rates, sources and transformations.
2. Oceanographic setting
The study area lies within the Mauritanian upwelling region in the ETNA. The prominent water mass that upwells onto the margin at 18 °N is poleward-flowing and nutrient-rich SACW. Upwelling is strongest between January and April when the Intertropical Convergence Zone (ITCZ) migrates southwards (Mittelstaedt, 1983). It weakens when the ITZC moves northwards, leading to a decline in primary production on the shelf. Primary production nonetheless remains relatively high year-round at 80 – 200 mmol m–2 d–1 of C (Huntsman and Barber, 1977). Oceanographic data indicate that upwelling was active during the fieldwork (Thomsen et al., 2019). Dissolved O2 levels below the surface mixed layer are dictated by SACW ventilation, vertical mixing, and respiration rates of organic carbon in the water column (Mittelstaedt, 1983; Schafstall et al., 2010; Thomsen et al., 2019). They present a deep minimum of 40 – 50 µM at 400 – 500 m water depth and a shallow minimum of 30 – 50 µM on the shelf at 50 - 100 m (Karstensen et al., 2008; Schroller-Lomnitz et al., 2019; Thomsen et al., 2019). The lowest O2 levels on the shelf are usually encountered during upwelling relaxation in July and August due to combined effects of stratification and benthic respiration (Klenz et al., 2018). A detailed oceanographic overview of the study area during the fieldwork is described by Thomsen et al. (2019) and water column O2 measurements at the sampling stations are presented by Schroller-Lomnitz et al. (2019).
The sediments on the margin at 18°N are classified as slightly sandy mud or muddy sand (Dale et al., 2014). They comprise 10 - 20% carbonates with organic C increasing from ~1% on the shelf to 3% at 1000 m water depth (Hartmann et al., 1976; Gier et al., 2017). Sediment reworking by turbulent mixing exports fine-grained particles down the slope (Fütterer, 1983; Schafstall et al., 2010). Consequently, sedimentation rates on the shelf determined by 210Pb accumulation are low, and increase to 350 cm kyr-1 below the shelf break (Dale et al., 2014). Porewaters in the upper 20 cm are mostly ferruginous, becoming sulfidic on the shallow shelf (Dale et al., 2014; Gier et al., 2017; Schroller-Lomnitz et al., 2019). Benthic respiration rates on the shelf range from approximately 10 to 20 mmol m-2 d-1 of C (Dale et al., 2014; Schroller-Lomnitz et al., 2019). These values are typical for the average margin, but far smaller than those in the carbon-rich shelf sediments in the Peruvian and Benguelan upwelling systems (Brüchert et al., 2003; Dale et al., 2015).
3. Material and methods
Data presented here were mostly measured within the framework of the project “Climate – Biogeochemistry Interactions in the Tropical Ocean” (www.sfb754.de) on research campaign M107 (RV Meteor) from 30 May to 3 July 2014. A complete overview of sediment operations can be found in the cruise report (Sommer et al., 2015). Digital links to the data and a general overview of the project are provided by Krahmann et al. (2021).
3.1. Benthic flux measurements
In situ fluxes of O2, dissolved inorganic carbon (DIC), NO3–, NO2–, NH4+, silicic acid (H4SiO4) and N/O isotopes of N species were measured in benthic chambers along an E-W transect at 18.1°N using autonomous Biogeochemical Observatories (BIGO; Sommer et al., 2008). A total of nine BIGO deployments were made at nine stations along a latitudinal transect across the shelf/slope covering a horizontal distance of 50 km from ~50 to ~1110 m water depth (Figure 1). Seven of the stations were revisited from an earlier cruise during March/April 2011, which coincided with the transition between the strong upwelling and weak upwelling seasons (Dale et al., 2014). Geographical coordinates for each station are listed in Schroller-Lomnitz et al. (2019). These workers reported mean PO43- and DIC fluxes at each site for the same lander deployments.
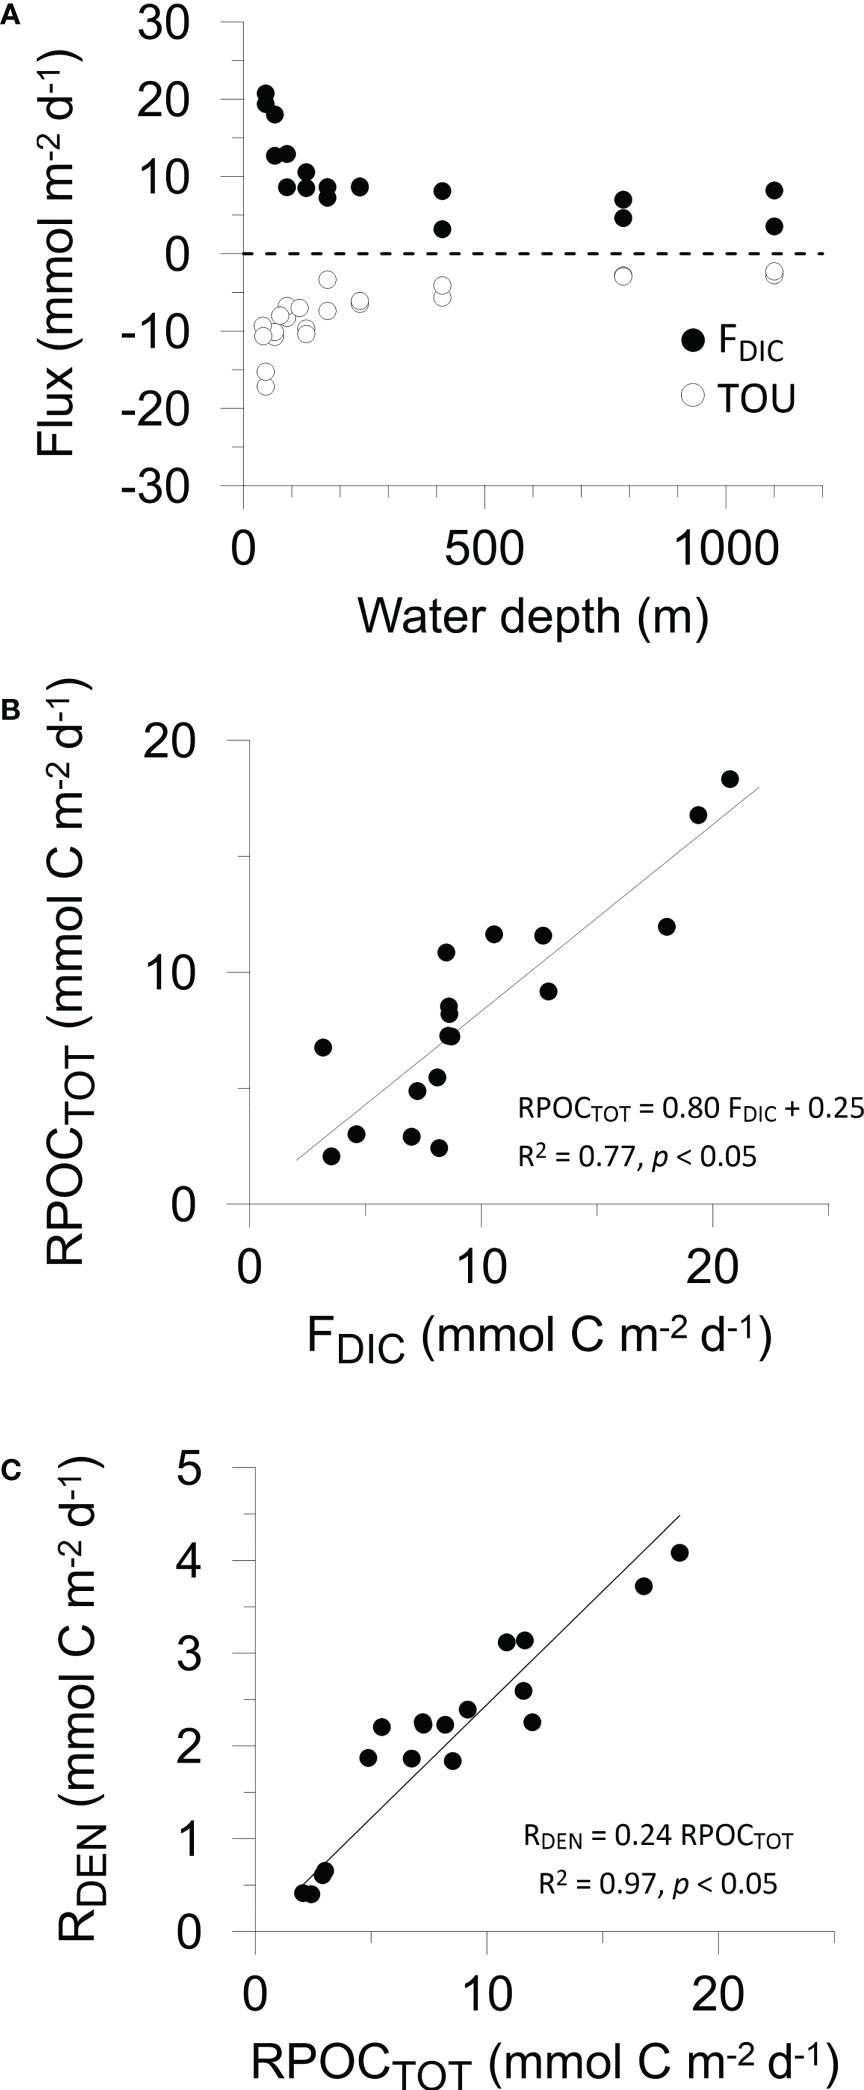
Figure 1 (A) Benthic fluxes of DIC (black symbols) and TOU (open symbols) versus water depth. Two data points per water depth correspond to the two benthic chambers in each BIGO lander. Cross plots of (B) organic carbon degradation versus measured DIC flux, and (C) denitrification versus organic carbon degradation, as determined by the mass balance. Denitrification rates (Table 2) have been converted to mmol C m-2 d-1 by dividing by rNO3. The trendline in (C) has been forced through the origin so that RDEN = 0 if RPOCTOT = 0. For (B, C), Pearson correlation coefficients and p values are given.
The design and implementation of the BIGO landers has been discussed in detail previously (Krahmann et al., 2021). Each BIGO (I and II) contained two circular flux chambers (C1 and C2) with an internal diameter of 28.8 cm where the sediment was incubated for ~30 h. Discrete samples were taken using glass syringes (eight per chamber) at pre-programmed time intervals for chemical analysis. After BIGO recovery, the syringes were immediately transferred to the onboard cool room (4°C) for filtering (0.2 µm) and sub-sampling. Another six water samples were taken from inside each benthic chamber into quartz tubes for analysis of DIC.
Solute fluxes were calculated from the slope of the linear regression of the concentration data versus sampling time and the height of the water inside each chamber. Fluxes represent the net flux by diffusion/advection in addition to solute pumping by animals (bioirrigation). A total of 29 nutrient data points from the whole data set (n = 720) set were visually assigned as outliers and omitted from the calculations. Twelve DIC data were removed from 90 data points, mainly corresponding to the last syringe samples taken from the chambers on the shelf. For the calculation of the O2 flux, equal to total oxygen uptake (TOU), the linear initial part of the O2 time series recorded by optodes (see below) was used. Negative fluxes denote net uptake by the sediment and positive fluxes net release.
3.2. Sediment sampling
Sediment cores at each station were retrieved using a multiple-corer (MUC). Porewaters and particulates were extracted from the sediment as described by Schroller-Lomnitz et al. (2019) and Gier et al. (2017). Further details are provided in those publications.
3.3. Analytical methods
Nutrients in the benthic landers were analyzed on board with a Quaatro Autoanalyzer (Seal Analytic) using standard photometric approaches. Porewaters were analyzed for ferrous iron (Fe2+), NO3-, NO2-, NH4+, PO43-, H4SiO4, total alkalinity (TA) and hydrogen sulfide (H2S). Analytical details can be found in Gier et al. (2017); Schroller-Lomnitz et al. (2019) and Sommer et al. (2015). Sediment samples were also stored refrigerated for analysis of solid phase constituents and physical properties at the home laboratory.
The O2 concentration and temperature inside each chamber were measured using optodes. Bottom water O2 values were taken from additional optodes mounted externally on the landers. DIC measurements were performed using a quadrupole membrane inlet mass spectrometer (MIMS, GAM200, In Process Instruments) following Sommer et al. (2015). The instrument was equipped with inline sample acidification to convert DIC to dissolved CO2 gas for measurement at a mass-to-charge ratio of 44.
The particulate organic carbon (POC) content of freeze-dried and milled sediment samples was determined by flash combustion in a Carlo Erba Elemental Analyzer (NA 1500) with an analytical precision and detection limit of 0.04% (dry weight percent) and 0.05%, respectively. POC contents have been published previously (Schroller-Lomnitz et al., 2019). Samples were decarbonated with 0.25 N HCl prior to analysis. Carbonate (assumed to be CaCO3) was determined by weight difference. The precision and detection limit of the carbonate analysis was 2% and 0.1%, respectively. Total particulate nitrogen was determined on the elemental analyzer with the same precision and detection limit as carbonate. We assumed that this is equal to particulate organic N (PON). Porosity was determined from the weight difference of the wet and freeze–dried sediment, assuming a sediment density of 2.5 g cm-3 and a seawater density of 1.023 g cm-3.
During a separate field campaign in July 2019 (M156, Sommer et al., 2020), surface sediment close to St. 5 (182 m depth) was analyzed for δ15N and δ13C using a high sensitivity elemental analyzer (HSEA) connected to an isotope ratio mass spectrometer (DeltaPlus Advantage, Thermo Fisher Scientific) as described by Hansen and Sommer (2007). δ15N and δ13C values of the bulk particulate material (after removing carbonates) were calculated as:
where δHX denotes the isotopic composition (‰) of X (C or N) and H and L are the heavy and light isotopologue of C (13) or N (15). The reference standards were V-PDB for C and N2 in air for N. System calibration was implemented by the combustion of International Atomic Energy Agency (IAEA-N-1, IAEA-N-2, IAEA-NO-3) and National Institute of Standards and Technology (NBS-22 and NBS-600) compounds. Acetanilide was used as an internal standard after every sixth sample within each sample run. The overall standard deviation (SD) for the low measurement range 2.5 - 8 µg N and 5.0 - 80 µg C was ± 0.25 ‰ and ± 0.2 ‰, respectively. The overall SD for the higher measurement range 3 - 15 µg N and 10 - 140 µg C was ± 0.2 ‰ and ± 0.15‰, respectively.
Benthic lander samples were analyzed for the isotopic composition of nitrate (δ15N-NO3- and δ18O-NO3-) and ammonium (δ15N-NH4+). Most of the samples were analyzed for δ15N-NO3- and δ18O-NO3- at GEOMAR (Kiel, Germany). At three stations (St. 1, 2 and 4), δ15N-NO3- and δ18O-NO3- were measured at the Helmholtz Center Hereon (Geesthacht, Germany). In both labs, nitrate dual isotopes were analyzed using the denitrifier method (Sigman et al., 2001; Casciotti et al., 2002). All samples for δ15N-NH4+ were analyzed at GEOMAR using the hypobromite/azide-method (Mcilvin and Altabet, 2005; Zhang et al., 2007). δ15N-NH4+ was only measured in benthic lander samples on the shelf where NH4+ concentrations were above the detection limit for a reliable isotope analysis (1 µM). Due to limited sample availability and low NO2-concentrations, δ15N-NO2- could not be measured.
The denitrifier method and the hypobromite/azide-method are based on the isotopic analysis of nitrous oxide (N2O). In the denitrifier method, NO3- and NO2- are quantitatively converted to N2O by Pseudomonas aureofaciens (ATTC 13985). The hypobromite/azide-method is based on the chemical conversion of NH4+ to N2O by a subsequent addition of a hypobromite and azide solution. For both methods, the sample volume was adjusted to a sample size of 10 nmol of N2O. N2O was extracted from the sample vials by purging with helium and measured with a GasBench II, coupled to an isotope ratio mass spectrometer (Delta Plus, Thermo Fisher Scientific, Germany). Each batch of samples using the denitrifier method included two international standards (USGS34: δ15N = -1.8‰ vs N2, δ18O = -27.9‰ vs. VSMOW; IAEA-NO-3: δ15N = 4.7‰ vs N2, δ18O = +25.6‰ vs. VSMOW) (Böhlke et al., 2003) and an internal standard. A bracketing correction (Sigman et al., 2009) was applied to the nitrate isotope data to correct for exchange with water. To calibrate δ15N-NH4+ measurements, three international standards (IAEA-N-1: δ15N = 0.4‰, USGS25: δ15N = -30.4‰, USGS26: δ15N = 53.7‰) were used with each sample run. All measurements were replicated, with a typical reproducibility for δ15N-NO3-, δ18O-NO3- and δ15N-NH4+ better than 0.2‰, 0.6‰ and 0.9‰, respectively. Since NO2- comprised on average 2% of the combined NO2- + NO3- pool, the contribution of NO2- interference to the reported δ15N and δ18O nitrate values was considered negligible.
N and O isotope ratios are reported in per mil (‰), relative to the analytical standards (N2 in air for δ15N, and Vienna Standard Mean Ocean Water (VSMOW) for O) using Eq. (1).
3.4. C and N recycling rates
Depth-integrated rates (total rate per unit area) of POC oxidation to DIC (RPOCTOT, mmol C m-2 d-1), ammonification of particulate organic N (RAMF, mmol N m-2 d-1), nitrification of NH4+ to NO3- (RNIT, mmol N m-2 d-1) and denitrification of NO3- to N2 (RDEN, mmol N m-2 d-1) were calculated using a mass balance of the fluxes (F) of O2, NO3- and NH4+ measured in the benthic chambers (Dale et al., 2014):
where rCN is the atomic C:N ratio in organic matter undergoing degradation, and rO2 and rNO3 are the molar ratios of O2:POC and NO3-:POC, respectively, during aerobic respiration and denitrification of organic carbon. rO2 and rNO3 were previously defined as 118/106 and 94.4/106 (respectively) for organic matter with an oxidation state of -0.45 (Dale et al., 2014). These equations are only approximations because they ignore NO2- fluxes, yet which are equivalent to only a few percent of NO3– fluxes.
3.5. Isotope calculations
The loss of NO3- inside the chambers due to benthic respiration takes place within a closed system where there is no exchange of NO3- with the surrounding waters. Under these conditions, the apparent benthic fractionation of N (15ϵapp) or O (18ϵapp) was calculated using a closed system Rayleigh model (Marioitti et al., 1981; Prokopenko et al., 2013):
where δHX and δHX0 denote the isotopic composition (‰) of X (N or O) during the incubation and at the start of the incubation, respectively, and f is the remaining fraction of NO3– in the chamber. Hϵapp is equal to the slope of the linear regression of a plot of δHX versus ln(f). Values of ϵapp at each station were determined by pooling the data from both BIGO chambers. Only slopes that were significant (p value< 0.05) are reported, which eliminates the 15ϵapp and 18ϵapp data from the two deepest stations and also 18ϵapp from St. 3 and 7. At these sites, the change in δHX is too small or scattered to calculate reliable ϵapp.
Hϵapp is related to the δHX of the NO3- flux relative to the δHX of bottom water NO3-, δHXNO3BW (Alkhatib et al., 2012):
Where
and FHNO3 and FLNO3 are the benthic fluxes of the heavy and light isotopologues at the sediment surface, respectively (see Supplement).
4. Results
4.1. Particulate geochemistry across the margin
Mean POC content in the sediment cores retrieved by the MUC increased from < 1% on the shelf (< 200 m) to 2.9% at the deepest station (Table 1). CaCO3 showed maximum values at St. 4 (37%) and decreased offshore. POC content was significantly and positively correlated with the particulate mud fraction (MF, %) reported by Dale et al. (2014), where POC = 28.1 MF – 13.3 (p< 0.05, data not shown) whereas CaCO3 was not. The mean δ13C and δ15N of the particulate material close to St. 5 was -20.8 ± 0.2 ‰ and 3.7 ± 0.4 ‰, respectively (see Supplement). These δ13CPOC fall within the range of -16 to -22 ‰ characteristic of marine organic matter (Meyers, 1994). The mean atomic ratio of POC to PON (rCN, mol C (mol N)-1) in each sediment core was mainly constant over the transect (~9 – 10), with a lower ratio at St. 4 of 7.6. These values are typical for marine algae (Burdige, 2006).
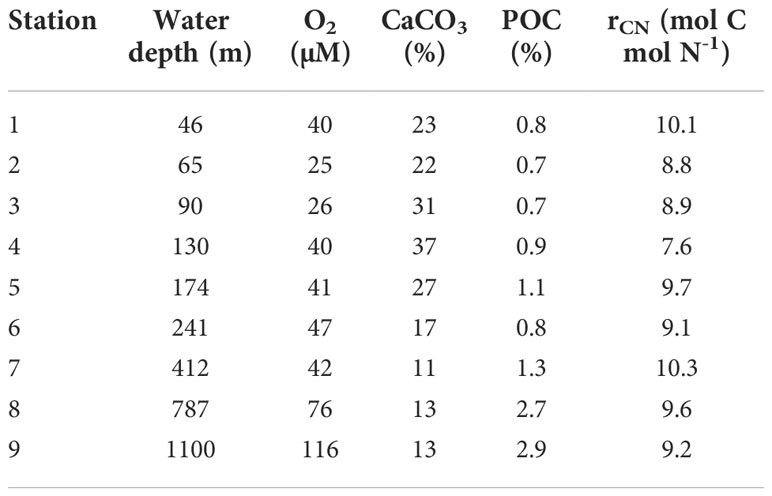
Table 1 Mean contents of POC, CaCO3 and the C:N ratio in the sediment cores recovered from each station along with mean bottom water O2 concentrations recorded on the BIGO landers.
4.2. Seafloor recycling of biogenic matter
NO3- fluxes were directed into the sediment with highest values on the shelf (-2.9 mmol m-2 d-1) (Table 2). NO2- effluxes were highest on the shelf (0.13 mmol m-2 d-1) and at least a factor of 20 lower than the NO3- flux. NH4+ and H4SiO4 fluxes were also highest on the shelf and directed from the sediment to the bottom water (Figure S1). The ratio of Si fluxes relative to DIC was 0.5 ± 0.2 and higher than the diatomic Si:C ratio of 0.13 (Brzezinski, 1985), indicating preferential dissolution of opal compared to POC.
In situ fluxes of O2, DIC and nutrients were highest on the shelf and lowest offshore (Table 2 and Figure 1A). DIC fluxes (FDIC) decreased from 20.7 mmol m-2 d-1 at St. 1 to 3.5 mmol m-2 d-1 at St. 9. O2 fluxes (= TOU) were on average 25% lower than FDIC. The offshore decrease in FDIC and TOU are consistent with a decrease in remineralization of labile organic matter with increasing water depth. RPOCTOT decreased from 18.2 mmol m-2 d-1 on the shelf to ~2 mmol m-2 d-1 at St. 9. RPOCTOT was equal to 82% of FDIC for the margin as a whole (Figure 1B). The excess DIC flux over TOU is likely to be driven by carbonate dissolution induced by metabolically-produced CO2 in surface sediment (Jahnke and Jahnke, 2004). This is further indicated by the respiratory quotient (RQ), determined as the ratio between DIC outflux and O2 influx across the sediment surface. RQ was 1.5 ± 0.6 across the margin (Table 2). Whilst similar to other estimates using benthic chambers (Jørgensen et al., 2022), it is much higher than the expected value of 0.7 based on complete aerobic mineralization of organic matter with an average phytoplankton composition (Anderson, 1995).
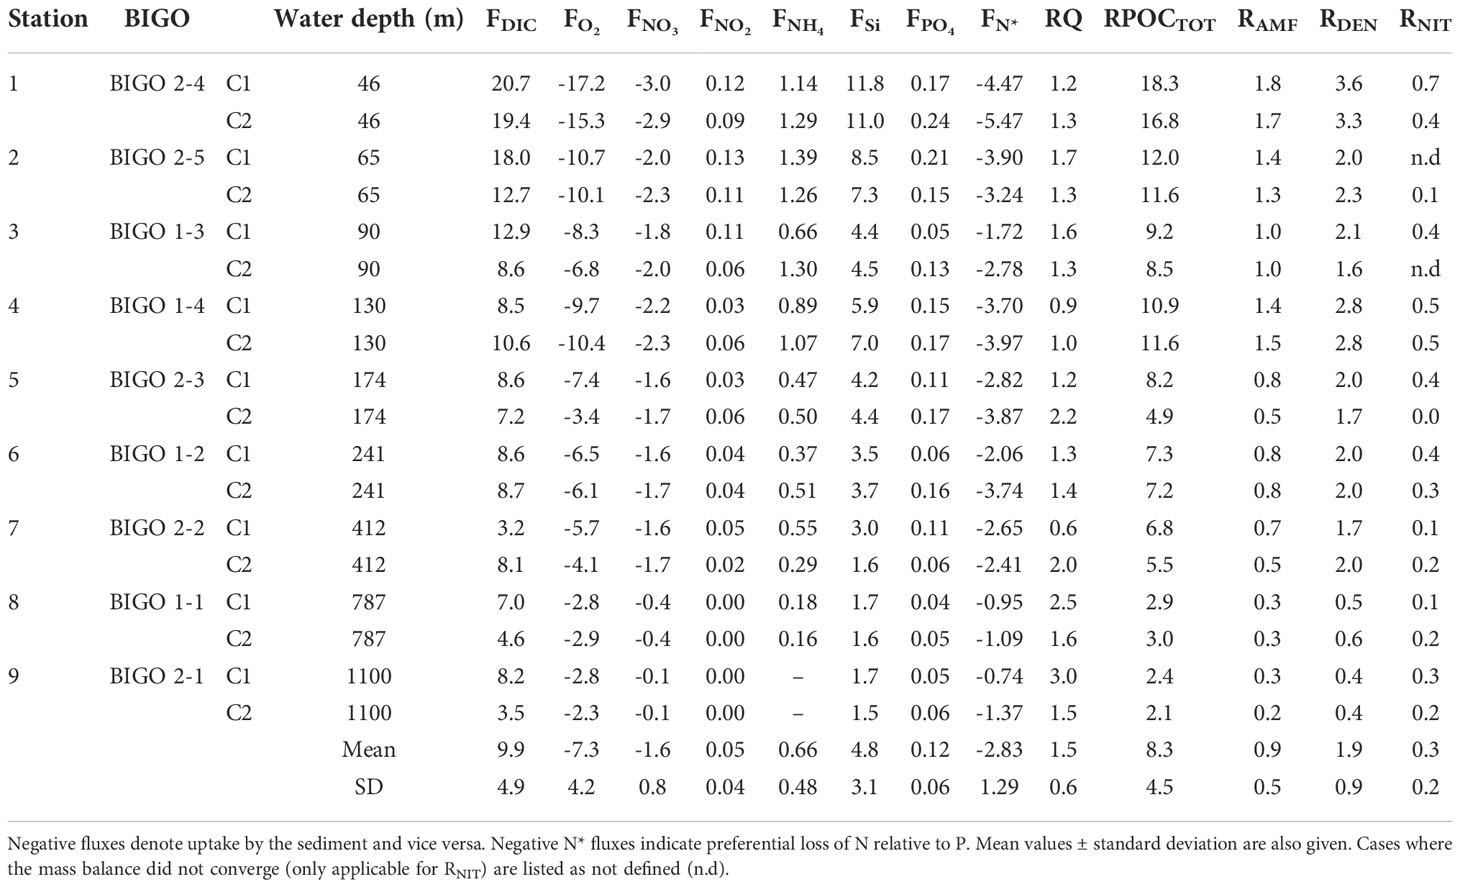
Table 2 Benthic fluxes (F) measured in the individual benthic chambers (mmol m–2 d–1) across the transect, the respiratory quotient (RQ, see text) and depth-integrated reaction rates, R [Eq. (2)-(5)].
The sediments acted as a net sink for DIN [NO3-+NO2-+NH4+)]. Denitrification rates (RDEN) decreased from 3.6 mmol N m-2 d-1 on the shelf where RPOCTOT was highest, to < 1 mmol N m-2 d-1 at the deepest stations. These are consistent with those determined from 15N labelling experiments (Sokoll et al., 2016). RDEN accounted for 24% of RPOCTOT (Figure 1C). Nitrification (RNIT) was apparently active at every station with rates that were 17% of RDEN on average.
The loss of fixed N was further evident in the flux of the tracer N* (FN*) (Gruber and Sarmiento, 1997; Lehmann et al., 2004):
where FPO4 is the PO43- flux (Table 2) and the factor 16 stems from the Redfield composition of organic matter (N:P = 16:1). If organic N and P are completely remineralized, FN* = 0. FN* was negative at all sites because the sediments acted as a source of PO43- and a sink of DIN, illustrating preferential loss of DIN relative to PO43-. The most negative N* flux of -5.5 mmol m-2 d-1 was determined at St. 1 where RDEN was highest. The highest FN* of -1 mmol m-2 d-1 was calculated for St. 9. Across the transect, the mean FN* was -2.8 ± 1.3 mmol m-2 d-1.
4.3. N isotopes in benthic chambers
δ15N-NO3 and δ18O-NO3 inside the benthic chambers are illustrated in Figure 2. Bottom water δ15N-NO3, taken as the first time point immediately after the chambers were closed, was approximately 5.0 ± 0.5 ‰. Enrichments in 15N over time were generally observed in all chambers on the shelf and upper slope. δ15N-NO3 increased by roughly 1 ‰ on the shelf and by <1 ‰ on the upper slope over the course of the incubations. At the two deepest sites, variations in δ15N-NO3 and δ18O-NO3 were within analytical precision. Bottom water δ18O-NO3 was more variable than δ15N-NO3. Enrichments in 18O were stronger on the shelf compared to the slope.
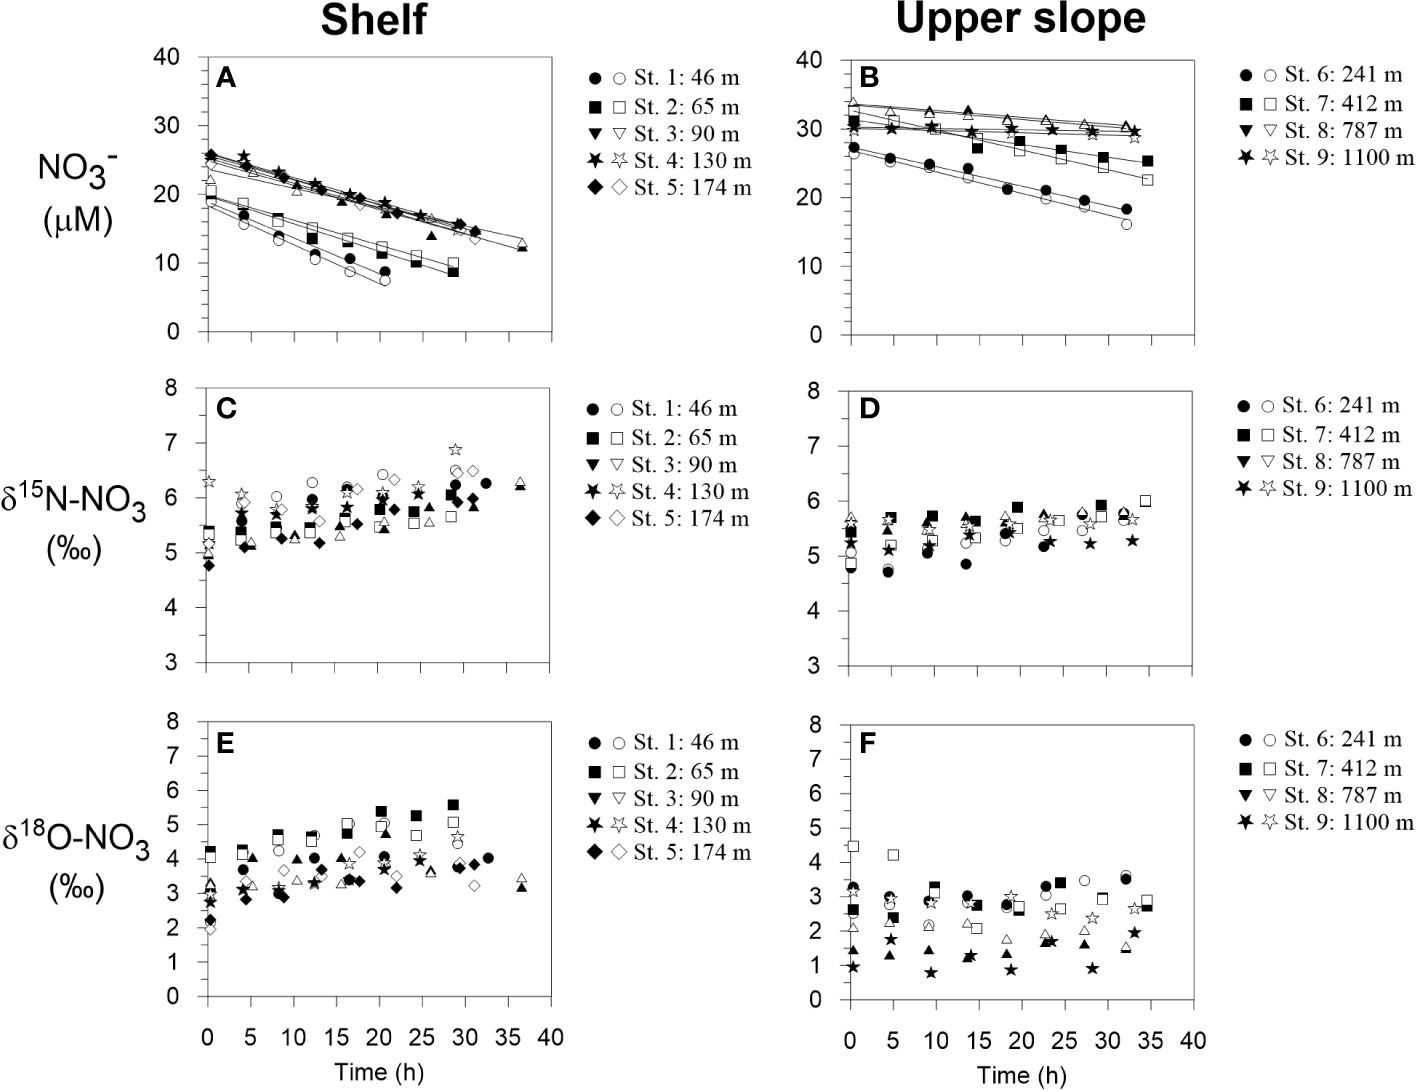
Figure 2 Benthic chamber incubation results for NO3- on the shelf and upper slope. (A, B) NO3- concentrations with linear regression curves from which the fluxes are calculated, (C, D) δ15N-NO3 and (E, F) δ18O-NO3. Filled and open symbols correspond to chamber 1 and 2 during each BIGO lander deployment, respectively.
The apparent fractionation of N (15ϵapp) and O (18ϵapp) accompanying NO3- loss inside the benthic chambers varied between 0.7 and 2.0 ‰ for 15ϵapp and between 1.7 and 2.9 ‰ for 18ϵapp with no clear trends across the transect (Figure 3A and Table S4). The average 15ϵapp and 18ϵapp were 1.5 ± 0.4 ‰ and 2.0 ± 0.5 ‰, respectively. For the shelf (< 100 m), 18ϵapp was twice as high as 15ϵapp (1.8 versus 0.9 ‰). The ratio of these numbers, 18ϵapp:15ϵapp, varied from 2.0 to 2.3 at stations 1, 2 and 4. 18ϵapp:15ϵapp was 0.9 at St. 5 and 6 (Figure 3B). The mean 18ϵapp:15ϵapp ratio of the shelf stations was 2.1 ± 0.3.
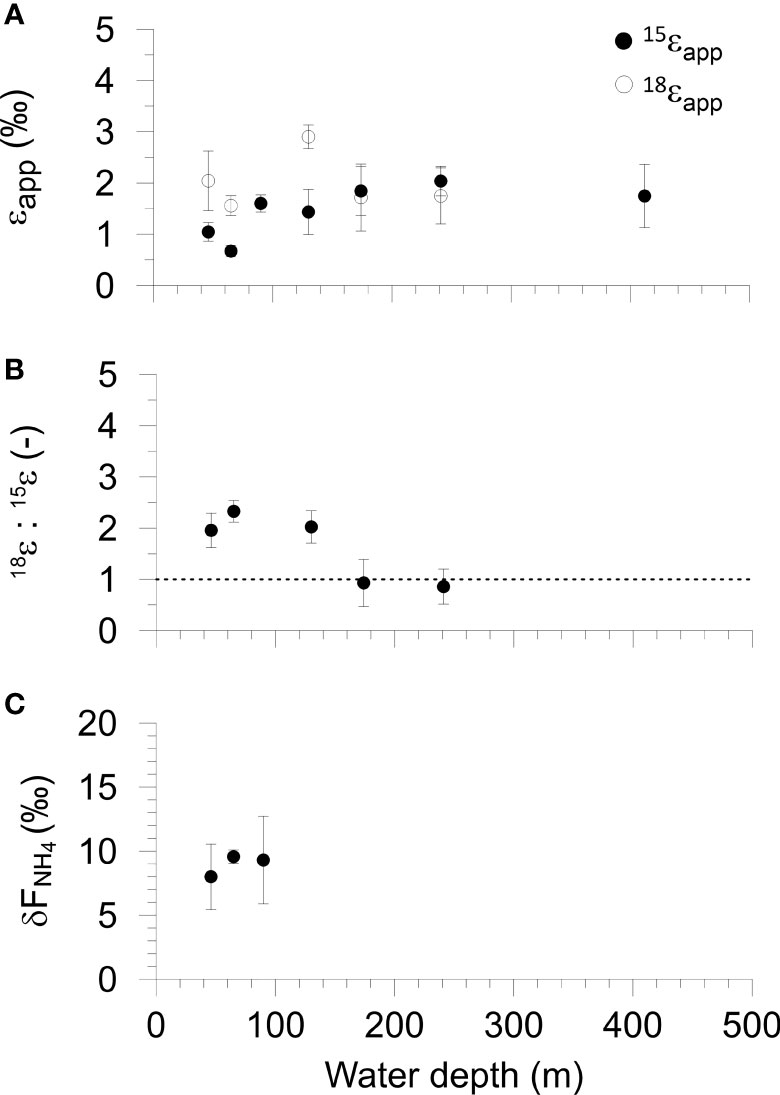
Figure 3 Benthic chamber isotope results versus water depth on the Mauritanian margin. (A) Fractionations of N-NO3- (15ϵapp) and O-NO3- (18ϵapp). (B) The ratio 18ϵapp: 15ϵapp, where the dashed line shows unity. (C) The δ15N of the NH4+ flux from the sediment. Error bars represent the standard error of the regression slopes (see Methods). Data are tabulated in Table S1 in the Supplement.
δ15N-NH4 inside the benthic chambers at St. 1 and 2 was between 9 and 10 ‰ whereas the values at St. 3 were more scattered (Figure S2). The δ15N of the NH4+ flux out of the sediment to the bottom water (δFNH4) for the shelf stations was calculated as the intercept of a linear regression of δ15N-NH4 versus the inverse NH4+ concentration (Mortazavi and Chanton, 2004; Dale et al., 2019). Values of δFNH4 were similar and varied from 8 ± 1.8 ‰ at St. 1 to 9.6 ± 1.2 ‰ at St. 2 (Figure 3C and Table S4). The average δFNH4 of the three shelf sites was 9.0 ± 0.7 ‰.
5. Discussion
5.1. N cycling inferred from benthic chamber isotopes
The increase in δ15N-NO3 and δ18O-NO3 in the benthic incubation chambers, along with a decrease in NO3- concentrations, is attributed to dissimilatory reduction of NO3- to NO2- (Lehmann et al., 2004; Dale et al., 2014; Dale et al., 2019). Isotope effects for nitrate reduction estimated from δ15N-NO3 distributions in the water column are ca. 15 – 30 ‰ (Voss et al., 2001; Kritee et al., 2012; Bourbonnais et al., 2015) for both 15N and 18O (Marioitti et al., 1981; Voss et al., 2001; Casciotti et al., 2002; Granger et al., 2008; Kritee et al., 2012). Thus, our data would appear to present two conflicts with the known isotopic fingerprint of dissimilatory NO3- reduction: (i) the apparent benthic fractionation factors, 15ϵapp and 18ϵapp, are much lower than observed in the water column at all sites, and (ii) the ratio 18ϵapp:15ϵapp is higher than unity at St. 1, 2 and 4, but closer to unity at St. 5 and 6 (Figure 3).
On continental margins, including Mauritania, NO3- is typically exhausted within a few centimeters below the sediment surface due to high rates of respiration by microorganisms (Dale et al., 2014). The strong drawdown of NO3- leads to diffusive transport limitation of NO3- to the subsurface denitrifying layer, leading to complete consumption of NO3- that diffuses into the sediment (Brandes and Devol, 1997). This results in an under-expression of the isotope effect in the benthic NO3- flux and explains why larger isotope effects are observed in the water column (Brandes and Devol, 1997; Brandes and Devol, 2002; Lehmann et al., 2007; Alkhatib et al., 2012; Dale et al., 2019). The range of 15ϵapp determined in this study is similar to that reported for other coastal sediments under oxygenated waters (Brandes and Devol, 2002; Lehmann et al., 2007; Alkhatib et al., 2012). ϵapp may be larger in oxygen-deficient regions because the distance for molecules to diffuse between the seawater NO3- reservoir and the denitrification layer is smaller (Brandes and Devol, 1997; Lehmann et al., 2007). For instance, 15ϵapp of 6 ± 2 ‰ were observed in sediments under hypoxic bottom waters in the Bering Sea (Lehmann et al., 2007). Sediments underlying anoxic waters in the Peruvian OMZ displayed even higher 15ϵapp of 7.4 ± 0.7 ‰, decreasing to 2.5 ± 0.9 ‰ under oxygenated waters below the OMZ, with similar trends in 18ϵapp (Dale et al., 2019). Dähnke and Thamdrup (2013) measured 15ϵapp and 18ϵapp of 18.9 ‰ and 15.8 ‰, respectively, in anoxic ex-situ incubations of organic-rich sediment. These results confirm observations and model predictions that nitrate isotope effects inferred from benthic flux data are under-expressed under oxic waters (Brandes and Devol, 1997; Lehmann et al., 2004; Lehmann et al., 2007). However, the assumption of a universally low or negligible benthic N isotope effect, as originally predicated in earlier studies, is not fully applicable to oxygen-deficient settings (Brandes and Devol, 1997; Lehmann et al., 2004).
15ϵapp and 18ϵapp were substantially lower than the values of 8 and 14 ‰, respectively, determined in a single chamber at St. 1 in 2011 (Dale et al., 2014). While some temporal variability is to be expected, the difference between 2011 and 2014 is as much striking as it is puzzling, because the redox conditions and fluxes were not radically different. Lower O2 levels in 2011 are unlikely to be the cause (see Section 5.3). δ15N-NO3 and δ18O-NO3 were measured in 2011 using the Cd-reduction/azide method with addition of NaCl (Ryabenko et al., 2009) and verified against the same international standards USGS34 and IAEA-NO-3. In 2011, the BIGO samples for isotope analysis were taken in quartz tubes whereas in 2014 the syringe samples were used (see Methods). The quartz tube samples were first analyzed on board for dissolved gases by passing the sample (without air contact) through the membrane inlet of a mass spectrometer prior to filtering and freezing. It is currently unclear whether this procedure significantly altered the isotopic composition of NO3-. Unfortunately, additional samples from the syringes were not analyzed during the 2011 campaign for comparison, and we are presently unable to resolve the inter-annual differences in 15ϵapp and 18ϵapp.
A more realistic estimate of the total benthic N isotope effect on the oceanic N reservoir can be made from the flux of all fixed N species across the sediment-water interface, termed ϵsed by Lehmann et al. (2007). 15ϵsed can be higher than 15ϵapp in continental margins if the sediment acts as a source of 15N-enriched NH4+ to the water column, which in our setting has a δ15N of ~9.0 ‰ (Figure 3C). Vertical mixing and oxidation of 15N-enriched NH4+ higher up in the water column will then increase the δ15N of the ocean NO3- reservoir. Mathematically, 15ϵsed can be calculated as:
where δJNreac is the δ15N of the net flux of reactive N species (NO3-, NO2-, NH4+, PON) and δJN2 is the δ15N of all fixed N lost to N2 (δJN2 ). This expression ignores dissolved organic nitrogen, which may be important in some settings (Alkhatib et al., 2012). Alkhatib et al. (2012) used a similar approach to determine 15ϵapp based on NO3- fluxes (Eq. 7). Accurate estimations of 15ϵsed are hampered by the fact that δJNreac requires accurate isotope values for the fixed N fluxes including PON remineralization (Dale et al., 2019). Similarly, precise analytical determination of δJN2 is difficult due to the large background reservoir of N2 in seawater (Brandes and Devol, 1997). In the following section, 15ϵsed is estimated using a numerical model of the benthic chamber incubation.
Deviations of 18ϵapp:15ϵapp above 1 are generally interpreted as the superimposition of the kinetic isotope effects of nitrification of NH4+ and denitrification (e.g. Lehmann et al., 2004; Dale et al., 2014). NH4+ is initially released to the porewater by the ammonification of PON with a small KIE of 1 – 2 ‰ (Möbius, 2013). The δ15N of PON in the upper 30 cm of sediment on the margin is ~ 5 ‰ (Table S1). Hence, the δ15N of NH4+ from ammonification should be close to this value. By contrast, nitrification of NH4+ to NO2- is associated with a large kinetic N isotope effect of 14 – 38 ‰ (Marioitti et al., 1981; Casciotti et al., 2003). The mass balance (RNIT/RAMF< 1) and the 15N-enriched NH4+ effluxes indicate that NH4+ is only partially nitrified. If newly nitrified and 15N-depleted NO2- is quantitatively oxidized to NO3-, the 15N-depleted NO3- will dilute the ambient porewater NO3- pool with 14NO3- and counteract the loss of 14NO3- incurred through dissimilatory reduction (Lehmann et al., 2004; Lehmann et al., 2007). Nitrification does not lead to a similar behavior of 18ϵapp because the δ18O of newly nitrified NO3- is largely set by the δ18O of seawater and is equal to ca. 0 ‰ (Buchwald and Casciotti, 2010; Casciotti et al., 2010; Buchwald et al., 2012). In other words, the δ15N of NO3- in porewater subject to denitrification and partial nitrification will increase less quickly than its δ18O signature, as long as the isotope effects for N and O by nitrate reduction are equivalent, leading to 18ϵapp:15ϵapp.
The isotopic fingerprints of partial nitrification must be communicated back to the overlying chamber water in order to bring about a change in observed 18ϵapp:15ϵapp. This could take place directly by the injection of NO3- from the porewater into the chamber through flushing of animal burrows (Lehmann et al., 2004; Dale et al., 2014; Rooze and Meile, 2016), or indirectly by the alteration of the concentration gradients of NO3- isotopes at the sediment-water interface and subsequent changes in diffusive fluxes of individual isotopes (Bender, 1990; Brandes and Devol, 1997). All other things being equal, the combined effects of denitrification and partial nitrification ought to lead to 18ϵapp:15ϵapp values above 1 (Lehmann et al., 2004; Dale et al., 2014).
The turnover of NO2- adds an additional dimension to the N cycle that has received far more attention in the water column compared to sediments (Casciotti and McIlvin, 2007; Casciotti et al., 2013; Granger and Wankel, 2016). Reduction of NO2- occurs with a normal KIE (Casciotti et al., 2002), whereas NO2- oxidation occurs with an inverse KIE in both N and O, leaving residual NO2- depleted in 15N and 18O (Casciotti, 2009; Buchwald and Casciotti, 2010). Concurrent nitrate reduction and nitrite oxidation can lead to an enrichment of 15N in the ambient NO3- pool and an enrichment of 14N in NO2-. Several lines of evidence based on NO2- isotopes suggest that a significant fraction of NO2- produced by nitrate-reducing bacteria in oxygen deficient waters is reoxidized to NO3-, resulting in the δ15N of NO2- being up to 60 ‰ lower than coexisting NO3- (Casciotti and McIlvin, 2007; Casciotti et al., 2013). A comprehensive box model of N and O isotope dynamics in the water column has since shown that the extent to which NO3- is produced relative to the fraction that is reduced plays a central role in determining the trajectories of δ15N-NO3- and δ18O-NO3- and hence 18ϵapp:15ϵapp (Granger and Wankel, 2016). The relevance of NO2- for benthic N fractionation and 18ϵapp:15ϵapp trajectories has been largely unexplored in benthic N isotope studies. In the following, we examine NO2- cycling in sediments more closely using a numerical model.
5.2. Insights from model simulations of a benthic chamber incubation experiment
5.2.1. Model set-up and calibration
In this section, we set up a multi-process numerical model of dual N and O isotope dynamics. The model consists of a 1-D, vertically-resolved, reaction-transport model of the surface sediment (upper 12 cm) coupled to a single box representative of a virtual benthic chamber, similar to the one described by Dale et al. (2019) for the Peruvian shelf. In this first step, the model is parameterized using data from St. 2 to constrain key model parameters and fractionations of the benthic N cycle for the Mauritanian shelf. In the second step, we apply the model more generally to explore the sensitivities of 18ϵapp:15ϵapp ratios toward different pathways of N turnover. We also interrogate the impact of the 15N-enriched NH4+ efflux on the benthic N isotope effect on water column NO3-. Since most of the model structure and reaction network have been described elsewhere, we relegate the bulk of the corresponding model details to the Supplement, and here we only discuss the relevant aspects for this study (Bohlen et al., 2011; Dale et al., 2019).
The degradation of POC in the sediment drives the benthic N cycle, which in turn impacts the concentrations of N species and their isotopes in the benthic chamber. No N cycling is assumed to take place in the benthic chamber water, such that the measured chamber data act as passive tracers for the processes taking place in the sediment. The model includes most of the processes in the water column box model of Granger and Wankel (2016), including aerobic NH4+ oxidation (AMO), NO3- reduction (NAR), aerobic NO2- oxidation (NXR), and NO2- reduction to N2 (NIR). In our model, NAR and NIR are coupled to the degradation of POC. Other electron acceptors for POC remineralization include O2 and sulfate (SO42-). The transition from one metabolic pathway to another during POC respiration depends on the relative concentrations of the terminal electron acceptors (TEA) and user-defined TEA threshold concentrations akin to half-saturation constants (Jourabchi et al., 2005). The TEAs are consumed in the order O2: NO2-: NO3-: SO42-, such that a high concentration of a TEA will inhibit less-favorable metabolic pathways. We also include ammonification of PON (AMF) that is linked to POC degradation through the atomic C:N ratio of organic matter. NH4+ and NO2- oxidation during AMO and NXR are defined as second-order reactions with rate constants kAMO and kNXR, respectively. At this stage, we do not consider anammox as it is a minor N loss pathway on the margin (Sokoll et al., 2016). We later relax this assumption for the sensitivity analysis. Solutes are able to diffuse through the porewater and across the sediment-water interface into and out of the benthic chamber depending on the reactions taking place in the sediment. Solute transport is also affected by bioirrigation, expressed mathematically as a simple non-local mixing function, and by bioturbation, expressed as a diffusion-like process.
The rate of organic matter degradation typically decreases with depth in the sediment as it becomes more recalcitrant over time (Middelburg, 1989). This can be constrained by the corresponding increase in NH4+ and total alkalinity concentrations (e.g. Berner, 1980). However, these analytes are of limited use to determine POC degradation on the Mauritanian shelf because porewaters are intensively irrigated with seawater by tube-dwelling animals (Gier et al., 2017). Therefore, following Stolpovsky et al. (2015), we used an empirical power law function to parameterize POC mineralization as function of sediment depth, x, termed RPOC(x):
where RRPOC is the rain rate of POC to the seafloor (in mmol m-2 d-1). Comparisons can be drawn between Eq. (11) and the power model proposed by Middelburg (1989) where the rate constant for POC remineralization depends on the age of POC being degraded. If RRPOC provides an upper limit of the total amount of POC available for degradation, B1 can be defined as:
The value of B2 was determined empirically by simulating a global dataset of benthic O2 and NO3- fluxes (Stolpovsky et al., 2015):
We assigned a value of 16.7 mmol m-2 d-1 to RRPOC, based partly on the measured TOU and partly on achieving a good fit to the benthic chamber NH4+ and NO3- fluxes. This gives B1 and B2 values of 0.76 cm and -2.3 (dimensionless), respectively.
The KIEs associated with nitrogen cycling (ϵAMO, ϵNAR, ϵNIR, ϵNXR), the TEA threshold NO3- and NO2- concentrations during NAR and NIR (KNAR, KNIR) and the rate constants kAMO and kNXR were mainly constrained by fitting the model to the benthic chamber data and, to a lesser extent, to the porewater data (see Supplement Figure S3). All other model parameters were fixed at reasonable values for fine grained shelf sediments, or values derived from field observations. Following Granger and Wankel (2016), we assumed that 15ϵNAR = 18ϵNAR, 15ϵNIR = 18ϵNIR, and 15ϵNXR ≠ 18ϵNXR. The δ15N of NH4+ produced from PON was assigned a value of 5 ‰, which is close to the mean δ15N of oceanic NO3- (Brandes and Devol, 2002). The δ18O of the NO2- produced by AMO was fixed (-2.3 ‰, see Supplement) and calculated as a function of the δ18O of ambient H2O and O2, and the fractionation factors associated with their incorporation into NO2- (Casciotti et al., 2010). Similarly, the δ18O of the NO3- produced by NXR was set by the inverse O isotope effect of NO2- oxidation (18ϵNXR) and the isotope effect of O incorporation into NO2- from water (Buchwald and Casciotti, 2010). In addition to NXR and NIR, the δ18O of the NO2- pool is affected by the branching isotope effect of O atom extraction during NAR (18ϵNARBR), which was assigned a value of 25 ‰ (Granger and Wankel, 2016). In contrast to observations in the water column, we assumed that the O atoms in NO2- are not equilibrated with water (Buchwald and Casciotti, 2013). This is because the abiotic equilibration time is days to weeks (Buchwald and Casciotti, 2013), whereas the residence time of NO2- in shelf porewaters in our simulations is typically on the order of minutes. In deep-sea sediments, where NO2- turnover rates are far lower, abiotic equilibration must be considered (Buchwald et al., 2018).
As with most ecological models, ours is underdetermined with respect to the number of field observations available to constrain the unknown parameter values. The lack of δ15N and δ18O data for NO2- from the benthic chambers unfortunately compromises the accuracy of the model simulations. To reduce the margin of error, we ran the model using a Monte Carlo procedure to find the optimum fit to the chamber data by tuning the nine unknown parameters to the benthic chamber data. The model was run over an ensemble of 20 k iterations, in each case with a random set of parameter values chosen from typical ranges reported in the literature (Dale et al., 2014). The parameter values from simulations meeting a least squares criterion for the fit between the model and the benthic chamber data were then averaged. These are listed in Table 3 along with other model outputs of interest including ratios of depth-integrated rates and benthic isotope effects.
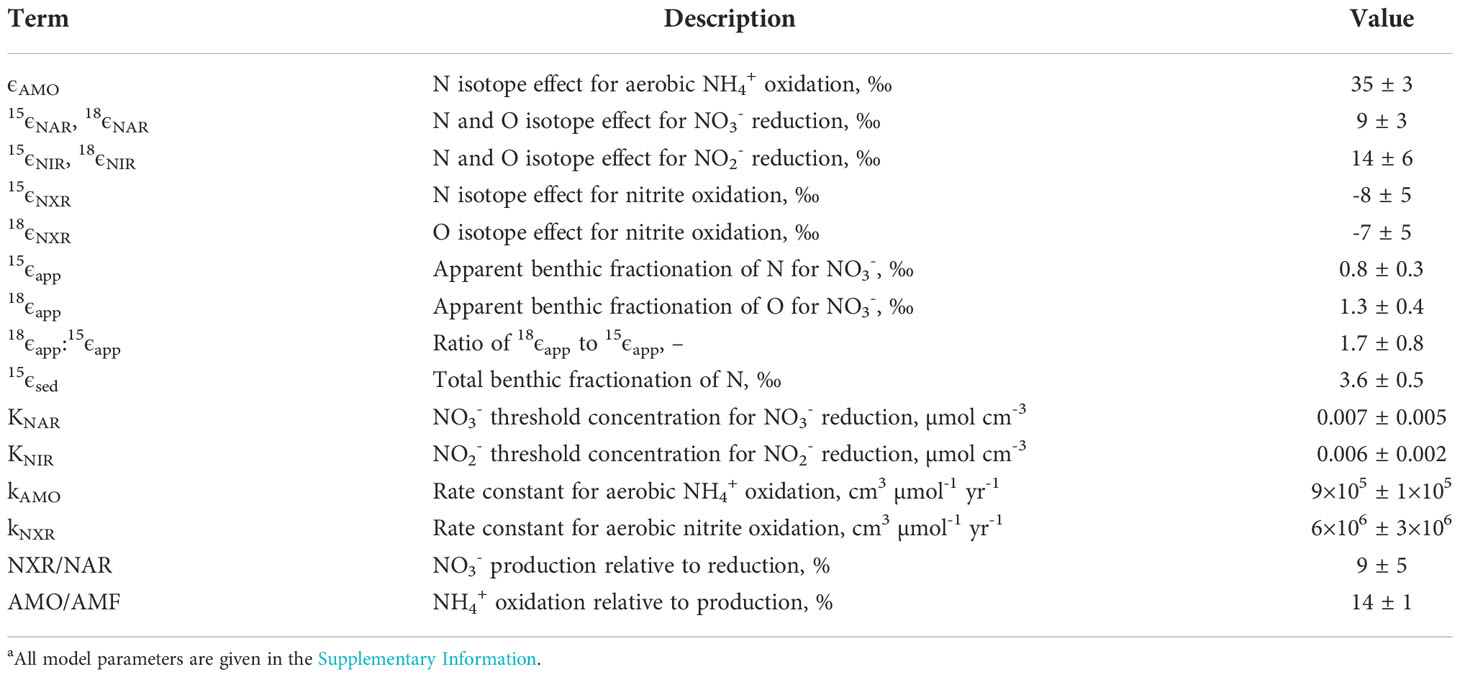
Table 3 Key model results for the Mauritanian shelf a.
The optimized isotope effects for ϵAMO (35 ± 3 ‰), ϵNAR (9 ± 3 ‰), ϵNIR (14 ± 6 ‰), 15ϵNXR (-8 ± 5 ‰) and 18ϵNXR (-7 ± 5 ‰) are well-within ranges of previously-determined isotope effects in the water column (reviewed by Granger and Wankel, 2016) and sediments (Lehmann et al., 2007; Alkhatib et al., 2012; Dale et al., 2014; Dale et al., 2019). The best-fit model solutions (n = 54) of the chamber data agree well with the measured data (Figure 4). Modeled δ15N-NO2- and δ18O-NO2- are clearly sensitive to the set of best-fit parameters. This suggests that NO2- isotope data would help to narrow the parameter uncertainty in Table 3. It is interesting that the δ18O-NO2- flux is always positive (mean = 27 ± 6 ‰). This is explained by (i) the δ18O of newly nitrified NO2- is set by the δ18O of seawater, (ii) 18ϵNIR > 18ϵNXR, which enriches porewater NO2- in 18O, and (iii) only a small fraction of NO2- is reoxidized to NO3- (NXR/NAR = 9%). In contrast, the δ15N of newly nitrified NO2- (mean = -3 ± 5 ‰) can be positive or negative because it depends on ϵAMO and the fraction of NH4+ that is oxidized. The δ15N of the NO2- flux is more sensitive to ϵAMO than any other model parameter (not shown), with higher ϵAMO leading to more 15N-depleted NO2- fluxes.
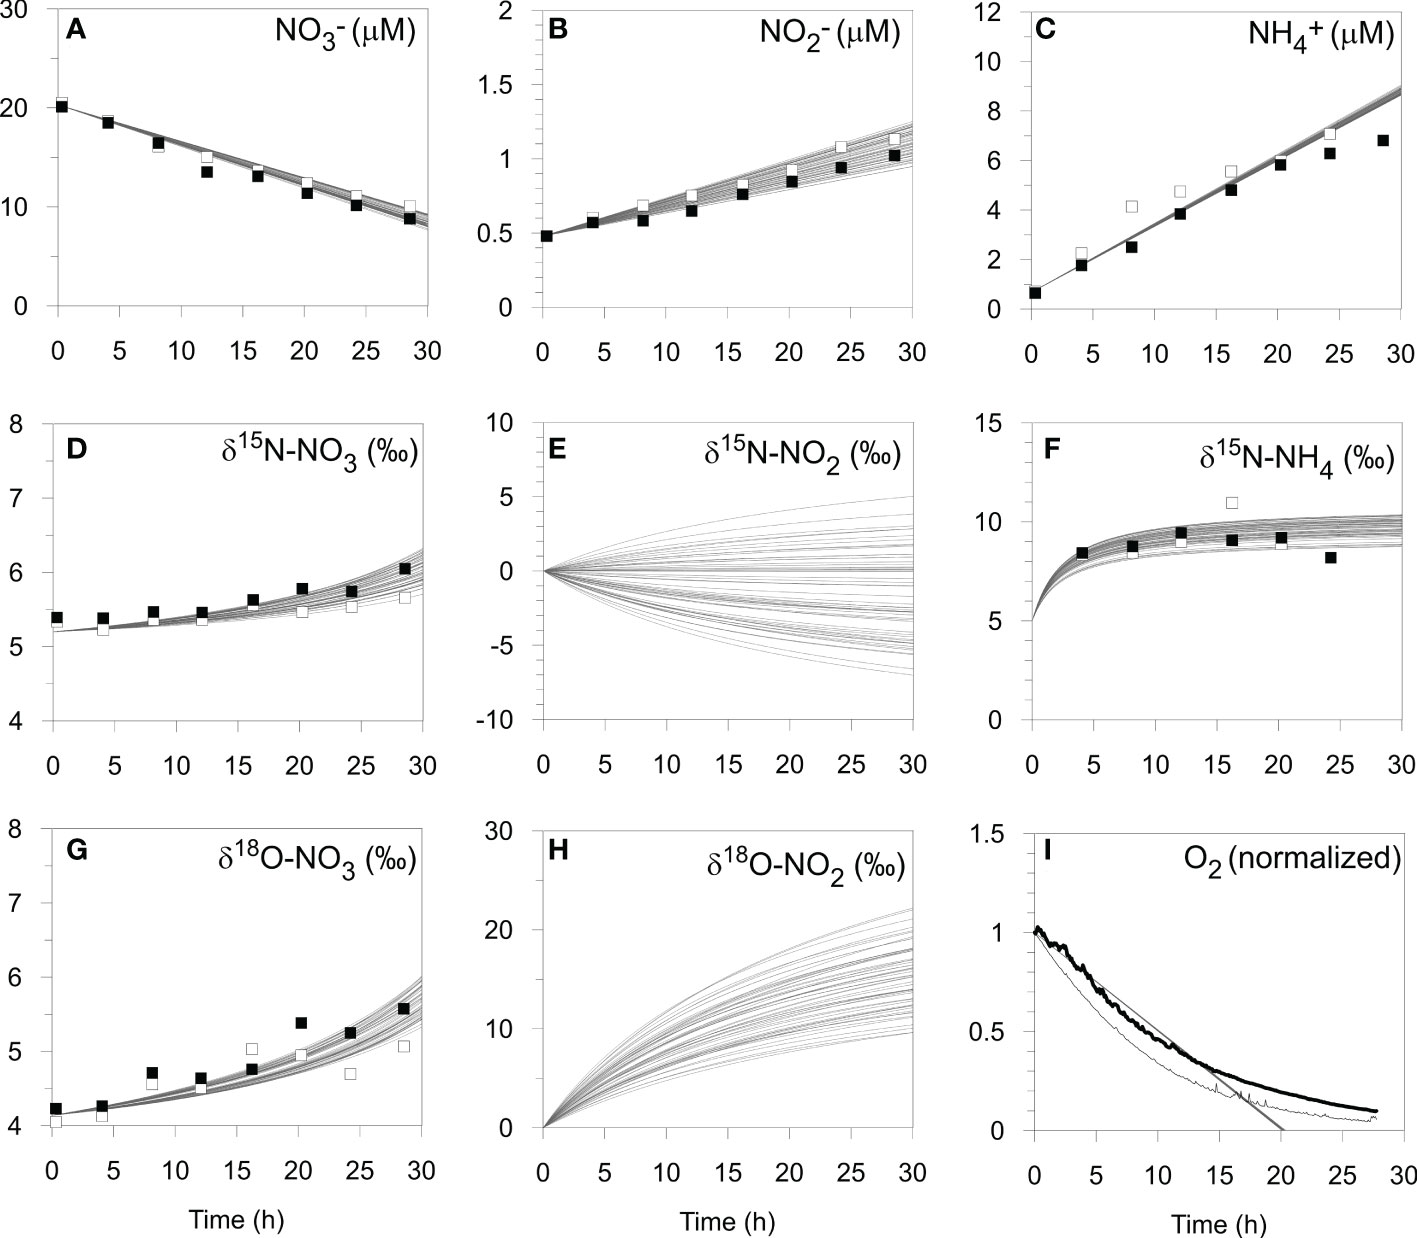
Figure 4 Model simulation results (curves, n = 54) of the benthic chamber incubation experiment at St. 2 on the shelf (BIGO 2-5) including (A–C) N concentrations, (D–H) N and O isotopes, and (I) O2 concentrations (see text). Open and filled symbols correspond to chamber 1 and 2, respectively. For the O2 optode data, chamber 1 and 2 are denoted by the thin and thick black lines, respectively, and have been normalized to the initial values.
The model predicts that 14% of NH4+ produced from PON is oxidized to NO2- (AMO/AMF). This is higher than predicted by the mass balance (RNIT/RAMF ~7%, Table 2), yet necessary in order to reproduce the efflux of 15N-enriched NH4+. The disagreement with the model and mass balance may be rooted in the fact that the latter does not explicitly consider NO2-. A better agreement between the model and the mass balance was found for denitrification, with the model predicting a fixed N loss of 2.0 ± 0.1 mmol m-2 d-1.
The N and O isotope effects for NO3- reduction (15ϵapp = 0.8 ± 0.3 ‰, 18ϵapp = 1.2 ± 0.4 ‰) and the ratio 18ϵapp:15ϵapp (1.8 ± 0.8 ‰) are within the uncertainty of the observed values (Figure 3). In sediments, high 18ϵapp:15ϵapp are thus possible at low NXR/NAR, whereas in the water column elevated 18ϵapp:15ϵapp are associated with NXR/NAR of >50% (Casciotti et al., 2013; Granger and Wankel, 2016). This discrepancy probably arises from the abundance of NH4+ in porewaters produced by anaerobic remineralization pathways, mainly sulfate reduction, such that only a small amount of NH4+ oxidation with a high ϵAMO is needed to produce large 18ϵapp:15ϵapp trajectories. In the water column, NH4+ production is stoichiometrically constrained by organic matter remineralization using O2, NO2- and NO3-, and elevated 18ϵapp:15ϵapp are only feasible with tightly coupled NO2- oxidation and NO3- reduction.
It is noteworthy that ϵNAR is much higher than 15ϵapp, confirming that the intrinsic cellular fractionation of NO3- reduction is not fully expressed in the benthic NO3- flux (Lehmann et al., 2007). ϵNAR is similar to 10 - 15 ‰ determined in pure cultures of denitrifying bacteria under typical marine conditions (Kritee et al., 2012) and to estimates from our previous box model of shelf sediments (~13 ‰, Dale et al., 2014). It also fits well with modelled data from the North Atlantic and Eastern Tropical North Pacific water column (14 ± 2 ‰, Granger and Wankel, 2016). Others have reported comparable values using model approaches that account for both closed and open system effects of NO3- reduction on ϵNAR (Deutsch et al., 2004; Altabet, 2007).
The total benthic N isotope effect, 15ϵsed, calculated using Eq. (10), equals 3.6 ± 0.5 ‰. As expected, it is higher than 15ϵapp because of the efflux of 15N-enriched NH4+. The NO2- flux, although acting to decrease 15εsed, hardly affects 15ϵsed in this setting since the flux is relatively small (Table 2). The modelled 15ϵsed is consistent with values of 2 – 6 ‰ determined from porewater gradients in the upper St. Lawrence Estuary where O2 levels are below 100 µM (Alkhatib et al., 2012). It is also close to estimates of 4 – 7 ‰ reported by Lehmann et al. (2007) for the upper continental margin and with results from a global N isotope model (2 – 4 ‰; Somes et al., 2013).
The environmental controls on 15ϵsed are not well understood presently, and correlations between 15ϵsed and organic matter quality and bottom water O2 levels have been discussed (Lehmann et al., 2007; Alkhatib et al., 2012; Dale et al., 2019). However, changes in organic matter quality and bottom water redox conditions are often intertwined (Cowie et al., 2014), and their individual contribution to 15ϵsed has not yet been investigated under laboratory conditions. Furthermore, the relationship between 15ϵsed and bioirrigation is highly non-linear and far more intricated than the simple mathematical expression of bioirrigation used in our model (Rooze and Meile, 2016). The contribution of dissolved organic N fluxes to 15ϵsed also deserves to be explored in future studies due to its significance in other organic-rich environments (Alkhatib et al., 2012). Despite these caveats, our results provide supporting evidence that benthic N fractionation on the continental margin exceeds previously assumed values of 0 – 2 ‰ for marine sediments (Brandes and Devol, 2002; Altabet, 2007).
5.2.2. Sensitivity of 15ϵapp, 18ϵapp:15ϵapp and ϵsed to N cycling pathways
We now apply the model to explore the sensitivity of ϵapp, 18ϵapp:15ϵapp and 15ϵSed to a broader range of N turnover rates, using the best-fit ϵ values in Table 3. To keep the procedure manageable, parameters associated with the physical environment (e.g. compaction, bioirrigation, boundary conditions) and RPOC(x) were left unchanged. Our primary interest here is on the internal interplay of the N cycle pathways in a continental shelf setting like the Mauritanian margin. Anammox (AMX) is now included to make the model more generic and to test the impact of AMX/AMF on the benthic isotope effect (see Supplement). Fractionations of 24 ‰ (15ϵAMXNH4) and 16 ‰ (15ϵAMXNO2) were assigned to NH4+ oxidation and NO2- reduction, respectively (Brunner et al., 2013). The 18O isotope for NO2- reduction (18ϵAMXNO2) was set equal to 18ϵNIR (Granger and Wankel, 2016). During AMX, an additional 0.3 moles of NO2- are oxidized to NO3- per mole of NO2- reduced, which accounts for the reduction of inorganic carbon during production of biomass (Strous et al., 1999). NO2- oxidation by AMX has an inverse N isotope effect (15ϵAMXNO2ox) of around -30 ‰ and produces 15N-enriched NO3- (Brunner et al., 2013). The δ18O of the NO3- was defined analogously as described above for NXR, assuming that the O isotope effect of NO2- oxidation by AMX (18ϵAMXNO2ox) is equal to 18ϵNXR (Granger and Wankel, 2016).
Model results show linear and non-linear dependencies of ϵapp, 15ϵSed and 18ϵapp:15ϵapp on NXR, AMO and AMX (Figure 5). Over the ranges tested, 15ϵapp is most sensitive to the proportion of NH4+ oxidized by AMO and AMX (Figure 5A). 15ϵapp increases steadily with AMX (grey curve), which is due to the production of 15N-enriched NO3- by the negative N isotope effect of NO2- oxidation. On the contrary, 15ϵapp barely changes when NO2- oxidation by AMX is turned off (green curve). The production of 15N-enriched NO3- by AMX enhances 15ϵapp in the following way. Addition of 15NO3- to the porewater slightly weakens the 15NO3- concentration gradient at the sediment surface relative to 14NO3-, leading to an increase in porewater δ15N-NO3- (Figure 6A). The flux of 15NO3- into the sediment is reduced (relative to 14NO3-) and brings about a lowering of the δ15N of the NO3- flux into the sediment (Figure 6B). As a consequence, 15ϵapp increases (Eq. (7)). When NO2- oxidation by AMX is turned off, the substrates for AMX (NH4+ and NO2-) are permanently lost as N2 with no effect on NO3-, which curtails any impact on 15ϵapp. A similar effect of AMX is observed for 18ϵapp due to the negative O isotope effect of NO2- oxidation (grey curve, Figure 5B), which together with 15ϵapp produces very little change in 18ϵapp:15ϵapp over the ranges of AMX tested (grey curve, Figure 5C). This finding is tentative, but agrees with studies in the water column where AMX fails to explain 18ϵapp:15ϵapp trajectories >1 (Granger and Wankel, 2016). Overall, the model suggests that observed 18ϵapp:15ϵapp trajectories > 1 on the Mauritanian shelf are not easily explainable by anammox alone.
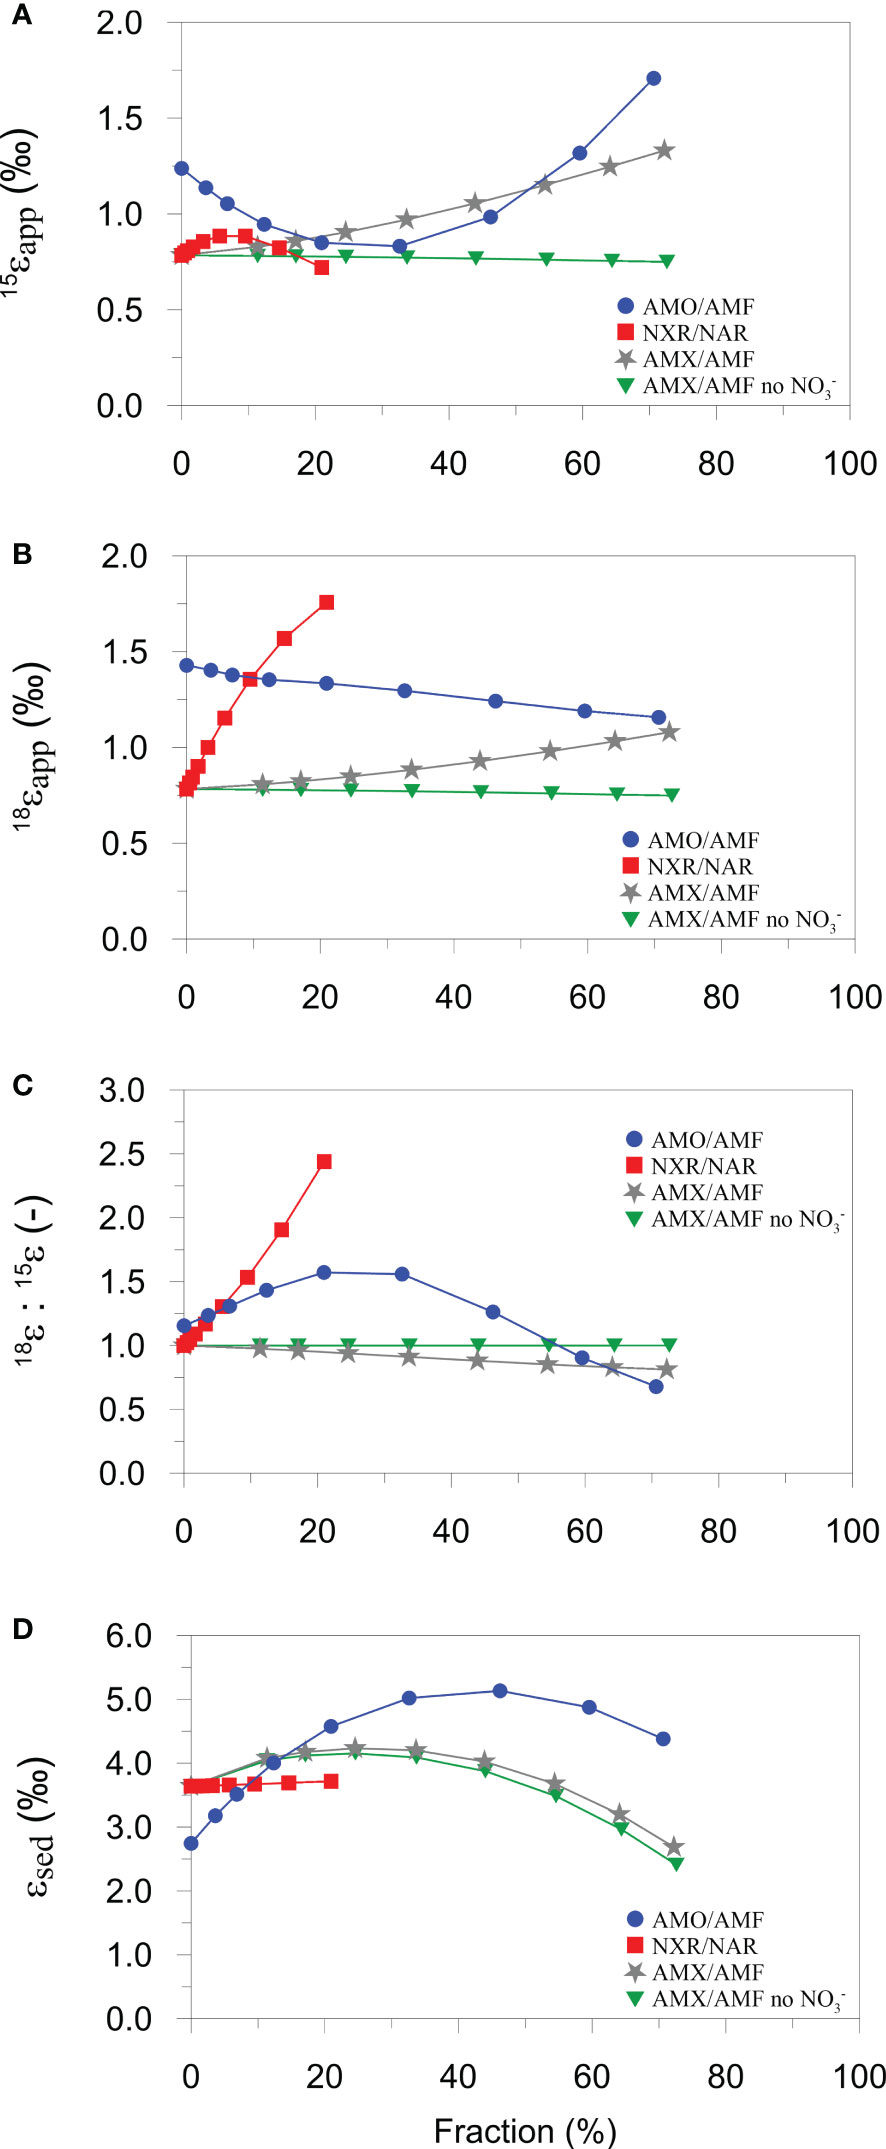
Figure 5 Model sensitivity analysis of (A) 15ϵapp, (B) 18ϵapp, (C) 18ϵapp:15ϵapp, and (D) 15ϵsed towards AMO, AMX and NXR, given as percentage contributions to AMF or NAR. Blue, red and grey curves were generated by varying the rate constant for AMO (kAMO), NXR (kNXR), and AMX (kAMX) stepwise between 0 and 2.6 × 107 cm3 µmol-1 yr-1. The green curves are the results for AMX/AMF without oxidation of NO2- to NO3-. All other parameter values in Table 3 and Table S2 are held constant.
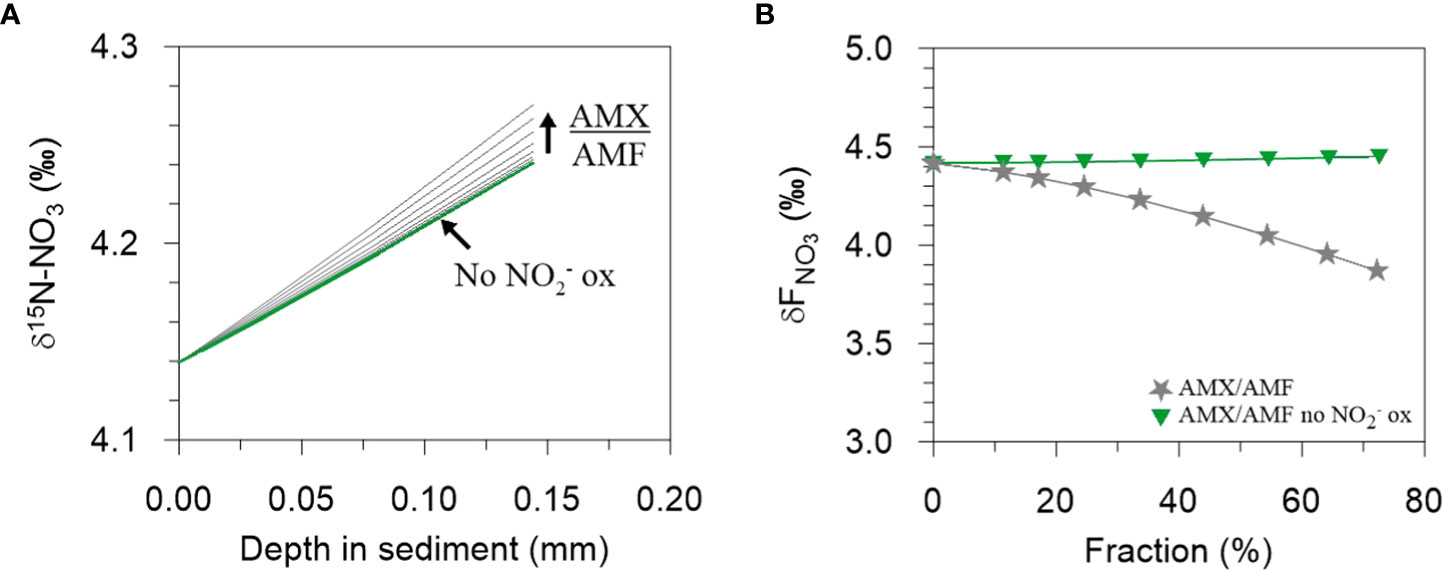
Figure 6 The effect on increasing AMX/AMF on (A) the δ15N-NO3 of porewater NO3- at the sediment surface and on (B) the δ15N of the NO3- flux into the sediment. In (A), an increase in AMX/AMF leads to a steepening of the δ15N-NO3 gradient and consequently, in (B), to a decrease in δFNO3. Each curve in (A) has a corresponding symbol in (B). The green lines in (A) are almost superimposed, reflecting a negligible change in δ15N-NO3 when NO2- oxidation by AMX is turned off. See Figure 5 for more details.
AMO has a different impact on 15ϵapp since NH4+ is recycled to NO2-, part of which can be oxidized to NO3-. At low AMO rates, nitrified NO2- is strongly depleted in 15N due to the large N isotope effect, ϵAMO. The portion of this newly nitrified 14NO2- that is oxidized to 14NO3- causes a weakening of the 14NO3- concentration gradient and a decrease in 15ϵapp (blue curve, Figure 5A). As NH4+ becomes more quantitatively consumed (AMO/AMF > ~30%), newly nitrified NO2- and NO3- are increasingly 15N-enriched, reversing the impact on the NO3- concentration gradients and producing an increase in 15ϵapp. By contrast, 18ϵapp decreases by less than 0.5 ‰ for the full range of AMO/AMF because the δ18O of newly nitrified NO2- is fixed (-2.3 ‰). The N and O effects of AMO combine to give a trajectory in 18ϵapp:15ϵapp that is highest at intermediate values of AMO/AMF (blue curve, Figure 5C). If AMO/AMF exceeds ~60%, 18ϵapp:15ϵapp even falls below 1. Thus, for the present model configuration, AMO can explain a wide range of 18ϵapp:15ϵapp ratios observed in the field.
In contrast to AMO/AMF, the fraction of NO2- that is oxidized relative to NO3- reduction (NXR/NAR) is important for 18ϵapp but not for 15ϵapp (red curves, Figures 5A, B). Following the reasoning based on diffusive gradients, the increase in 18ϵapp with NXR can be explained by preferential production of N18O3- in the oxidized surface layers. This is conceivable because the δ18O of newly nitrified NO3- is determined by the δ18O of O2 and H2O and the inverse O isotope effect of NXR (ϵNXR = -7 ‰). Since newly produced NO2- has a δ18O of -2.3 ‰ and is oxidized with an inverse isotope effect, the δ18O of newly nitrified NO3- will always be higher than the δ18O of NO3- reduced (ϵNAR = 9 ‰). 18ϵapp rises sharply to 1.8 ‰ for NXR/NAR = 20%. (Higher ratios could not be simulated in the model due to diffusive constraints on the O2 flux). This trend is carried through to the 18ϵapp:15ϵapp trajectory that also shows a steep increase (red curve, Figure 5C). NXR, therefore, is also a viable candidate for producing 18ϵapp:15ϵapp > 1 in benthic chambers, as proposed for the water column (Granger and Wankel, 2016).
The model results show that 15ϵSed is more sensitive to AMO and AMX compared to NXR, largely due to escape of residual 15NH4+ from the sediment (Lehmann et al., 2007; Alkhatib et al., 2012). Although anammox also has a large N isotope effect of 24 ‰ for NH4+ oxidation, it does not present as similarly strong of a dynamic as AMO. Reasons for this are difficult to disentangle due to the tight coupling of the N turnover pathways, but the depth in the sediment where AMO and AMX take place may be important. Ammonium oxidation is restricted to the oxidized surface sediment that is only a few millimeters thick, which allows residual 15NH4+ to quickly escape to the bottom water. Anammox, in contrast, occurs over a greater depth interval where NO3- and NO2- are available (Dalsgaard et al., 2005), implying a greater path length for residual 15NH4+ to diffuse into the bottom water. We suggest that this raises the likelihood that residual 15NH4+ can be oxidized by AMO or AMX, thereby muting the intrinsic isotope fingerprint of AMX on 15ϵSed. High rates of AMX (and AMO) even tend to decrease 15ϵSed, presumably because the total flux of NH4+ leaving the sediment is reduced at higher consumption rates.
A final point of significance is that 15ϵSed and 15ϵapp display opposing trends with regards to AMO. At low rates, AMO is associated with a decrease in 15ϵapp, whilst simultaneously increasing 15ϵSed, and vice-versa at high rates (blue curves Figures 5A, D). 15ϵapp is not, therefore, a reliable indicator of the total sediment N isotope effect, 15ϵSed. The interplay of the N cycle leads to a difference between 15ϵSed and 15ϵapp that can be several ‰ at intermediate AMO/AMF values. This is a non-trivial amount considering that the oceanic N isotope balance is sensitive to small changes in the benthic N isotope effect (Brandes and Devol, 2002). For the continental margin, where most benthic denitrification takes place, the contribution of the NH4+ flux to the total benthic N isotope effect may be as important as NO3-. Consequently, δ15N-NH4 measurements in benthic chambers should be prioritized alongside δ15N-NO3.
5.3. Interannual variability of nutrient fluxes
As with most continental margins, benthic fluxes and N turnover pathways on the Mauritanian margin at 18°N reveal an intensification of nutrient recycling on the shelf and a sharp decrease offshore (Jahnke et al., 1990). This trend is driven by the increasingly recalcitrant nature of bulk sedimentary POC and POC rain rate with water depth (Dale et al., 2014).
The deposition flux of labile POC to the seafloor is positively correlated with benthic denitrification, and high rates of fixed N loss to N2 are observed in both fine-grained and sandy continental shelves (Middelburg et al., 1996; Cook et al., 2006). The mean fraction of POC respired by denitrification on the Mauritanian margin (24%, Figure 1C) is higher than the global average of ≤10% (Middelburg et al., 1996). This can be explained by the amplification of denitrification in sediments underlying oxygen – deficient bottom waters due to less inhibition by O2. The impact of denitrification is to raise the RQ since it produces DIC whilst not impacting TOU. If the 24% of POC that is remineralized by denitrification on the margin would instead be channeled through aerobic pathways, we might expect the TOU to increase by a similar amount with a corresponding decrease in RQ from 1.5 to 1.2. This is higher than the theorical value of 0.7 based on complete aerobic mineralization of organic matter with an average phytoplankton composition (Anderson, 1995) and supports the idea that benthic carbonate dissolution is driving an excess DIC flux across the margin.
The loss of fixed N relative to PO43- generates N-depleted recycling fluxes (negative N*) compared to the standard phytoplankton N:P composition of ~16. If the calculated denitrification rates are added to FN*, the mean FN* increases from -2.8 to -1 mmol m-2 d-1. indicating that N loss accounts for roughly two thirds of the negative N* flux. Enhanced PO43- release under low-oxygen bottom waters probably accounts for the remaining third (Schroller-Lomnitz et al., 2019). Low or negative N* fluxes are characteristic of sediments under oxygen-deficient waters. Outside of these areas, where O2 levels are > 100 µM, N-depleted fluxes are much more muted (Bohlen et al., 2012), partly due to more efficient sequestration of PO43- by adsorption onto iron (oxyhydr)oxide minerals (Sundby et al., 1986). Mixing of low N:P waters from the benthic boundary layer into oxygen-poor water columns has the potential to enhance N2 fixation, leading to a positive feedback between primary production, O2 drawdown and benthic P release (Kemena et al., 2019).
On average, NH4+ and PO43- fluxes on the shelf were 2 to 3 times higher in June 2014 compared to 2011 (Dale et al., 2014; Schroller-Lomnitz et al., 2019). NO3- and H4SiO4 fluxes were also elevated by 40 and 25%, respectively. Mean TOU in 2011 and 2014 was the same (ca. 10 mmol m-2 d-1), and benthic carbon respiration rates on the shelf in 2014 were similar (RPOCTOT = 10 – 11 mmol m-2 d-1). Given that the release of NH4+ and PO43- from sediments is typically regulated by nitrification and adsorption by iron (oxyhydr)oxide minerals, respectively (Sundby et al., 1986; Sloth et al., 1992), the higher NH4+ and PO43- fluxes in 2014 suggest that the bottom waters might have become more reducing since 2011. Indeed, a long-term decline of O2 concentrations in the ETNA has received much publicity (Stramma et al., 2008; Schmidtko et al., 2017). Our data corroborate these findings, with a decrease in minimum bottom water O2 concentrations on the shelf from 42 µM in 2011 (Dale et al., 2014) to 25 µM in 2014 (Table 1).
One could conclude that the observed increase in NH4+ and PO43- fluxes between 2011 and 2014 is caused by the long-term decrease in bottom water O2. Yet, other contributing factors that are not easily quantifiable deserve careful consideration, such as (i) seasonal accumulation and depletion of nutrients in porewaters (e.g. Dale et al., 2013), (ii) changes in the faunal community structure and sediment reworking rates (Dale et al., 2013; Gier et al., 2017), (iii) low frequency changes in O2 respiration close to the seabed associated with particle resuspension (Thomsen et al., 2019), and (iv) the episodic formation and export of oxygen-poor mesoscale eddies over the shelf on quasi-monthly time-scales (Thomsen et al., 2019). The magnitude of the O2 decrease between 2011 and 2014 observed on the landers (17 µM) is also much higher than observed deoxygenation rates in the ETNA of ca. 0.5 µmol kg–1 yr–1 (Stramma et al., 2008). Long-term monitoring of sediment fluxes is needed to address this issue more precisely, preferably using autonomous methodologies such as bottom crawlers that can operate independently of costly ship-based surveys (Wenzhöfer et al., 2016). Until the technology to do so becomes more accessible, future projections of the nutrient budgets and the economic sustainability of fisheries in tropical upwelling regions will carry larger uncertainties (Wallmann et al., 2022).
6. Conclusions
This study presents in situ fluxes of O2, DIC, nutrients and stable isotopes of dissolved inorganic nitrogen species in benthic chambers deployed on the Mauritanian margin in 2014. The aim was to quantify the recycling rates of biogenic debris with particular emphasis on the N cycle. The trends in benthic fluxes were generally similar to those measured in an earlier campaign to the region in 2011, and associated with a decrease in organic matter remineralization and denitrification rates with water depth. Notably, though, the fluxes of NH4+ and PO43- on the shelf were 2 – 3 times higher in 2014. We were unable to pinpoint the cause of this increase from only two sets of field data. Long-term, or more frequent, monitoring of sediment-water interactions is needed to determine whether the seafloor is becoming more reducing and to elucidate possible linkages with the observed long-term decline in O2 concentration in the tropical Atlantic. Elevated release of PO43- from the standing stock of iron-bound P might stimulate the productivity of surface waters and continue to drive down subsurface O2 levels, leading to a positive feedback between benthic PO43- release and deoxygenation.
The mean isotopic fractionations of N (15ϵapp) and O (18ϵapp) accompanying benthic NO3- uptake were low and in good agreement with previously reported isotope effects for NO3- respiration in marine sediments. Analysis of the data using a numerical model showed that the overall benthic N isotope effect (15ϵsed) that includes the efflux of 15N-enriched NH4+ from the seafloor, and the one that is of relevance to the global N isotope budget, bears no straightforward relationship with 15ϵapp. The model predicted 15ϵSed = 3.6 ‰ for the Mauritanian shelf which, whilst lower than observed isotope effects of pelagic N loss in oxygen-deficient regions, adds to the growing body of evidence that the assumption of a universally low or negligible benthic N isotope effect is not applicable to oxygen-deficient settings.
The isotope model was used to constrain the relative rates of N turnover processes in the sediment. The model showed that observed trajectories in 18ϵapp:15ϵapp > 1 on the shelf were likely the result of aerobic ammonium oxidation and nitrite oxidation in surface sediments. Anammox has little influence on 18ϵapp:15ϵapp in this setting. This finding may be more widely applicable because the isotopic impact of anammox is less easily communicated to the water column than ammonium and nitrite oxidation. Anammox, however, tends to increase 15ϵsed if the fraction of NH4+ consumed is not too high. Our model suggests that NO2- isotope data from benthic chambers would help to constrain further the rates of N turnover in sediments, provided that the analytical challenge of low sample volumes from benthic chambers and low NO2- concentrations can be overcome.
Data availability statement
The datasets presented in this study can be found in online repositories. The names of the repository/repositories and accession number(s) can be found below: https://doi.pangaea.de/10.1594/PANGAEA.928206 https://doi.pangaea.de/10.1594/PANGAEA.941569.
Author contributions
AD conceived and wrote the paper. AD, DC, US-L and SS conducted fieldwork and chemical analyses. KD and FK performed isotope measurements. All authors contributed to the article and approved the submitted version.
Funding
This work is supported by the Sonderforschungsbereich 754 “Climate – Biogeochemistry Interactions in the Tropical Ocean” (www.sfb754.de) financed by the Deutsche Forschungsgemeinschaft (DFG), and also by the German Federal Ministry of Education and Research (BMBF, funding ref. no. 03F0815A) through the research project REEBUS (Role of Eddies in the Carbon Pump of Eastern Boundary Upwelling Systems).
Acknowledgments
We thank A. Petersen, M. Türk, and S. Cherednichenko for their assistance in deploying the landers, and B. Domeyer, V. Thönissen, S. Trinkler, S. Kriwanek, A. Bleyer, R. Suhrberg, F. Jung geochemical analyses. We also thank Thomas Hansen (GEOMAR) for measuring the C and N isotopes in sediment samples and to Fabian Jung for assisting with the BIGO isotope measurements. We are grateful to the crew of RV Meteor and RV Maria S. Merian for their enthusiastic support. We express our gratitude to Annie Bourbonnais for editorial handling of the manuscript, and to the reviewers for their expertise and input that improved the finalized version.
Conflict of interest
The authors declare that the research was conducted in the absence of any commercial or financial relationships that could be construed as a potential conflict of interest.
Publisher’s note
All claims expressed in this article are solely those of the authors and do not necessarily represent those of their affiliated organizations, or those of the publisher, the editors and the reviewers. Any product that may be evaluated in this article, or claim that may be made by its manufacturer, is not guaranteed or endorsed by the publisher.
Supplementary material
The Supplementary Material for this article can be found online at: https://www.frontiersin.org/articles/10.3389/fmars.2022.902062/full#supplementary-material
References
Alkhatib M., Lehmann M. F., del Giorgio P. A. (2012). The nitrogen isotope effect of benthic remineralization–nitrification–denitrification coupling in an estuarine environment. Biogeosciences 9, 1633–1646. doi: 10.5194/bg-9-1633-2012
Altabet M. A. (2007). Constraints on oceanic n balance/imbalance from sedimentary. Biogeosciences 4, 75–86. doi: 10.5194/bg-4-75-2007
Anderson L. A. (1995). On the hydrogen and oxygen content of marine phytoplankton. Deep-Sea Res. Part I-Oceanogr. Res. Pap. 42, 1675–1680. doi: 10.1016/0967-0637(95)00072-E
Bender M. L. (1990). The δ18O of dissolved O2 in seawater: A unique tracer of circulation and respiration in the deep sea. J. Geophys. Res. 95, 22243–22252. doi: 10.1029/JC095iC12p22243
Berner R. A. (1980). Early diagenesis–a theoretical approach. Princeton univ (Princeton, N. J: Press).
Bohlen L., Dale A. W., Sommer S., Mosch T., Hensen C., Noffke A., et al. (2011). Benthic nitrogen cycling traversing the Peruvian oxygen minimum zone. Geochim. Cosmochim. Acta 75, 6094–6111. doi: 10.1016/j.gca.2011.08.010
Bohlen L., Dale A. W., Wallmann K. (2012). Simple transfer functions for calculating benthic fixed nitrogen losses and C:N:P regeneration ratios in global biogeochemical models. Glob. Biogeochem. Cy. 26, GB3029. doi: 10.1029/2011GB004198
Böhlke J. K., Mroczkowski S. J., Coplen T. B. (2003). Oxygen iso-topes in nitrate: new reference materials for18O :17O :16O mea-surements and observations on nitrate-water equilibration. Rapid Commun. Mass Spectrom. 17, 1835–1846. doi: 10.1002/rcm.1123
Bourbonnais A., Altabet M. A., Charoenpong C. N., Larkum J., Hu H., Bange H. W., et al. (2015). N-loss isotope effects in the Peru oxygen minimum zone studied using a mesoscale eddy as a natural tracer experiment. Global Biogeochem. Cycles 29, 793–811. doi: 10.1002/2014GB005001
Brandes J. A., Devol A. H. (1997). Isotopic fractionation of oxygen and nitrogen in coastal marine sediments. Geochim. Cosmochim. Acta 61, 1793–1801. doi: 10.1016/S0016-7037(97)00041-0
Brandes J. A., Devol A. H. (2002). A global marine-fixed nitrogen isotopic budget: Implications for Holocene nitrogen cycling Global Biogeochem. Cycles 16 (4), 1120. doi: 10.1029/2001GB001856
Brüchert V., Jørgensen B. B., Neumann K., Riechmann D., Schlösser M., Schulz H. (2003). Regulation of bacterial sulfate reduction and hydrogen sulfide fluxes in the central namibian coastal upwelling zone. Geochim. Cosmochim. Acta 67, 4505–4518. doi: 10.1016/S0016-7037(03)00275-8
Brunner B., Contreras S., Lehmann M. F., Matantseva O., Rollog M., Kalvelage T., et al. (2013). Nitrogen isotope effects induced by anammox bacteria. Proc. Natl. Acad. Sci. U.S.A. 110, 18994–18999. doi: 10.1073/pnas.1310488110
Brzezinski M. A. (1985). The Si:C:N ratio of marine diatoms: Interspecific variability and the effect of some environmental variables. J. Phycol. 21, 347–357. doi: 10.1111/j.0022-3646.1985.00347.x
Buchwald C., Casciotti K. L. (2010). Oxygen isotopic fractionation and exchange during bacterial nitrite oxidation. Limnol. Oceanogr. 55, 1064–1074. doi: 10.4319/lo.2010.55.3.1064
Buchwald C., Casciotti K. L. (2013). Isotopic ratios of nitrite as tracers of the sources and age of oceanic nitrite. Nat. Geosci. 6, 1–6. doi: 10.1038/ngeo1745
Buchwald C., Homola K., Spivack A. J., Estes E. R., Murray R. W., Wankel S. D. (2018). Isotopic constraints on nitrogen transformation rates in the deep sedimentary marine biosphere. Glob. Biogeochem. Cy. 32, 1688–1702. doi: 10.1029/2018GB005948
Buchwald C., Santoro A. E., McIlvin M. R., Casciotti K. L. (2012). Oxygen isotopic composition of nitrate and nitrite produced by nitrifying cocultures and natural marine assemblages. Limnology Oceanography 57, 1361–1375. doi: 10.4319/lo.2012.57.5.1361
Burdige D. J. (2006). Geochemistry of marine sediments (Princeton: Princeton University Press), 609.
Carr M.-E. (2001). Estimation of potential productivity in Eastern boundary currents using remote sensing. Deep-Sea Res. Part II Top. Stud. Oceanogr. 49, 59–80. doi: 10.1016/S0967-0645(01)00094-7
Casciotti K. L. (2009). Inverse kinetic isotope fractionation during bacterial nitrite oxidation. Geochim. Cosmochim. Acta 73, 2061–2076. doi: 10.1016/j.gca.2008.12.022
Casciotti K. L. (2016). Nitrite isotopes as tracers of marine n cycle processes. Philos. Trans. R. Soc A 374, 20150295. doi: 10.1098/rsta.2015.0295
Casciotti K. L., Buchwald C., McIlvin M. (2013). Implications of nitrate and nitrite isotopic measurements for the mechanisms of nitrogen cycling in the Peru oxygen deficient zone. Deep-Sea Res. I 80, 78–93. doi: 10.1016/j.dsr.2013.05.017
Casciotti K. L., McIlvin M. R. (2007). Isotopic analyses of nitrate and nitrite from reference mixtures and application to Eastern tropical north pacific waters. Mar. Chem. 107, 184–201. doi: 10.1016/j.marchem.2007.06.021
Casciotti K. L., McIlvin M. R., Buchwald C. (2010). Oxygen isotopic exchange and fractionation during bacterial ammonia oxidation. Limnol. Oceanogr. 55, 753–762. doi: 10.4319/lo.2010.55.2.0753
Casciotti K. L., Sigman D. M., Galanter Hastings M., Böhlke J. K. (2002). Measurement of the oxygen isotopic composition of nitrate in seawater and freshwater using the denitrifier method. Analyt. Chem. 74, 4905–4912. doi: 10.1021/ac020113w
Casciotti K. L., Sigman D. M., Ward B. B. (2003). Linking diversity and stable isotope fractionation in ammonia-oxidizing bacteria. Geomicrobiol. J. 20, 335–353. doi: 10.1080/01490450303895
Cook P. L. M., Wenzhoefer F., Rysgaard S., Galaktionov O. S., Meysman F. J. R., Eyre B. D., et al. (2006). Quantification of denitrification in permeable sediments: Insights from a two–dimensional simulation analysis and experimental data. Limnol. Oceanogr. Meth. 4, 294–307. doi: 10.4319/lom.2006.4.294
Cowie G., Mowbray S., Kurian S., Sarkar A., White C., Anderson A., et al. (2014). Comparative organic geochemistry of Indian margin (Arabian Sea) sediments: estuary to continental slope. Biogeosciences 11, 6683–6696. doi: 10.5194/bg-11-6683-2014
Dähnke K., Thamdrup B. (2013). Nitrogen isotope dynamics and fractionation during sedimentary denitrification in boknis eck, Baltic Sea. Biogeosciences 10, 3079–3088. doi: 10.5194/bg-10-3079-2013
Dale A. W., Bertics V. J., Treude T., Sommer S., Wallmann K. (2013). Modeling benthic-pelagic nutrient exchange processes and porewater distributions in a seasonally-hypoxic sediment: evidence for massive phosphate release by Beggiatoa? Biogeosciences 10, 629–651. doi: 10.5194/bg-10-629-2013
Dale A. W., Bourbonnais A., Altabet M., Wallmann K., Sommer S. (2019). Isotopic fingerprints of benthic nitrogen cycling in the Peruvian oxygen minimum zone. Geochim. Cosmochim. Acta 245, 406–425. doi: 10.1016/j.gca.2018.10.025
Dale A. W., Sommer S., Lomnitz U., Montes I., Treude T., Liebetrau V., et al. (2015). Organic carbon production, mineralisation and preservation on the Peruvian margin. Biogeosciences 12, 1537–1559. doi: 10.5194/bg-12-1537-2015
Dale A. W., Sommer S., Ryabenko E., Noffke A., Bohlen L., Wallmann K., et al. (2014). Benthic nitrogen fluxes and fractionation of nitrate in the Mauritanian oxygen minimum zone (Eastern tropical north Atlantic). Geochim. Cosmochim. Acta 134, 234–256. doi: 10.1016/j.gca.2014.02.026
Dalsgaard T., Thamdrup B., Canfield D. E. (2005). Anaerobic ammonium oxidation (anammox) in the marine environment. Res. Microbiol. 156, 457–464. doi: 10.1016/j.resmic.2005.01.011
Deutsch C., Sigman D. M., Thunell R. C., MEckler A. N., Haug G. H. (2004). Isotopic constraints on glacial/interglacial changes in the oceanic nitrogen budget. Glob. Biogeochem. Cy. 18, GB4012. doi: 10.1029/2003GB002189
Devol A. H., Uhlenhopp A. G., Naqvi S. W. A., Brandes J. A., Jayakumar D. A., Naik H., et al. (2006). Denitrification rates and excess nitrogen gas concentrations in the Arabian Sea oxygen deficient zone. Deep. Res. I 53, 1533–1547. doi: 10.1016/j.dsr.2006.07.005
Fischer G., Neuer S., Davenport R., Romero O., Ratmeyer V., Donner B., et al. (2010). “The Northwest African margin, in: Carbon and nutrient fluxes in continental margins,” in A global synthesis. Eds. Liu K.-K., Atkinson L., Quiñones R., Talaue-McManus L. (Berlin: IGBP Book Series, Springer), 77–103.
Fütterer D. K. (1983). “The modern upwelling record off northwest Africa, in coastal upwelling: Its sedimentary record, part b,” in Sedimentary records of ancient coastal upwelling. Eds. Thiede J., Suess E. (Plenum, New York: Springer), 105–121.
Gaye B., Nagel B., Dähnke K., Rixen T., Emeis K.-C. (2013). Evidence of parallel denitrification and nitrite oxidation in the ODZ of the Arabian Sea from paired stable isotopes of nitrate and nitrite. Glob. Biogeochem. Cy. 27, 1059–1071. doi: 10.1002/2011GB004115
Gier J., Löscher C. R., Dale A. W., Sommer S., Lomnitz U., Treude T. (2017). Benthic dinitrogen fixation traversing the oxygen minimum zone off Mauritania (NW Africa). Front. Mar. Sci. 4. doi: 10.3389/fmars.2017.00390
Granger J., Prokopenko M. G., Sigman D. M., Mordy C. W., Morse Z. M., Morales L. V., et al. (2011). Coupled nitrification-denitrification in sediment of the eastern Bering Sea shelf leads to 15N enrichment of fixed n in shelf waters. J. Geophys. Res. 116. doi: 10.1029/2010JC006751
Granger J., Sigman D. M., Lehmann M. F., Tortell P. D. (2008). Nitrogen and oxygen isotope fractionation during dissimilatory nitrate reduction by denitrifying bacteria. Limnol. Oceanogr. 53, 2533–2545. doi: 10.4319/lo.2008.53.6.2533
Granger J., Wankel S. D. (2016). Environmental overprinting of nitrate isotopes. Proc. Nat. Acad. Sci. 113 (42), E6391–E6400. doi: 10.1073/pnas.1601383113
Gruber N. (2008). The marine nitrogen cycle and atmospheric CO2.In: Nitrogen in the Marine Environment (Second Edition) Capone DG, Bronk DA, Mulholland MR, Carpenter EJ (Academic Press) 1–50. doi: 10.1016/B978-0-12-372522-6.00001-3
Gruber N., Sarmiento J. (1997). Global patterns of marine nitrogen fixation and denitrification. Glob. Biogeochem. Cy. 11, 235–266. doi: 10.1029/97GB00077
Hansen T., Sommer U. (2007). Increasing the sensitivity of δ13C and δ15N abundance measurements by a high sensitivity elemental analyser connected to an isotope ratio mass spectrometer. Rapid Commun. Mass Spectrom. 21, 314–318. doi: 10.1002/rcm.2847
Hartmann M., Müller P. J., Suess E., van der Weijden C. H. (1976). Chemistry of late quaternary sediments and their interstitial waters from the NW African continental margin. Meteor Forschungsergebnisse. Reihe C: Geologie und Geophysik 24, 1–67.
Huntsman S. A., Barber R. T. (1977). Primary production off northwest Africa: the relationship to wind and nutrient conditions. Deep Sea Res. 24, 25–33. doi: 10.1016/0146-6291(77)90538-0
Jahnke R. A., Jahnke D. B. (2004). Calcium carbonate dissolution in deep sea sediments: Reconciling microelectrode, pore water and benthic flux chamber results. Geochim. Cosmochim. Acta 68, 47–59. doi: 10.1016/S0016-7037(03)00260-6
Jahnke R. A., Reimers C. E., Craven D. B. (1990). Organic matter recycling at the seafloor: intensification near ocean margins. Nature 348, 50–54. doi: 10.1038/348050a0
Jourabchi P., Van Cappellen P., Reginer P. (2005). Quantitative interpretation of pH distributions in aquatic sediments: A reaction-transport modeling approach. Am. J. Sci. 305, 919–956. doi: 10.2475/ajs.305.9.919
Jorgensen B. B., Wenzh.fer F., Egger M, Glud R. N. (2022). Sediment oxygen consumption: Role in the global marine carbon cycle. Earth-Science Reviews 228, 103987. doi: 10.1016/j.earscirev.2022.103987
Karstensen J., Stramma L., Visbeck M. (2008). Oxygen minimum zones in the eastern tropical Atlantic and pacific oceans. Prog. Oceanogr. 77, 331–350. doi: 10.1016/j.pocean.2007.05.009
Kemena T. P., Landolfi A., Oschlies A., Wallmann K., Dale A. W. (2019). Ocean phosphorus inventory: large uncertainties in future projections on millennial timescales and their consequences for ocean deoxygenation. Earth Syst. Dynam. 10, 539–553. doi: 10.5194/esd-10-539-2019
Klenz T., Dengler M., Brandt P. (2018). Seasonal variability of the Mauritania current and hydrography at 18°N. J. Geophys. Res. Oceans 123, 8122–8137. doi: 10.1029/2018JC014264
Krahmann G., Arévalo-Martínez D. L., Dale A. W., Dengler M., Engel A., Glock N., et al. (2021). Climate-biogeochemistry interactions in the tropical ocean: data collection and legacy. Front. Mar. Sci. 8. doi: 10.3389/fmars.2021.723304
Kritee K., Sigman D. M., Granger J., Ward B. B., Jayakumar A., Deutsch C. (2012). Reduced isotope fractionation by denitrification under conditions relevant to the ocean. Geochim. Cosmochim. Acta 92, 243–259. doi: 10.1016/j.gca.2012.05.020
Lam P., Kuypers M. M. M. (2011). Microbial nitrogen cycling processes in oxygen minimum zones. Ann. Rev. Mar. Sci. 3, 317–345. doi: 10.1146/annurev-marine-120709-142814
Lehmann M. F., Sigman D. M., Berelson W. M. (2004). Coupling the 15N/14N and 18O/16O of nitrate as a constraint on benthic nitrogen cycling. Mar. Chem. 88, 1–20. doi: 10.1016/j.marchem.2004.02.001
Lehmann M. F., Sigman D. M., McCorkle D. C., Granger J., Hoffmann S., Cane G., et al. (2007). The distribution of nitrate 15N/14N in marine sediments and the impact of benthic nitrogen loss on the isotopic composition of oceanic nitrate. Geochim. Cosmochim. Acta 71, 5384–5404. doi: 10.1016/j.gca.2007.07.025
Marioitti A., Germon J. C., Hubert P., Kaiser P., Letolle R., Tardieux A., et al. (1981). Experimental determination of nitrogen kinetic isotope fractionation: Some principles; illustration for the denitrification and nitrification processes. Plant Soil 62, 413–430. doi: 10.1007/BF02374138
Mcilvin M. R., Altabet M. A. (2005). Chemical conversion of nitrate and nitrite to nitrous oxide for nitrogen and oxygen isotopic analysis in freshwater and seawater. Anal. Chem. 77, 5589–5595. doi: 10.1021/ac050528s
Meyers P. A. (1994). Preservation of elemental and isotopic source identification of sedimentary organic matter. Chem. Geol. 114, 289–302. doi: 10.1016/0009-2541(94)90059-0
Middelburg J. J. (1989). A simple rate model for organic matter decomposition in marine sediments. Geochim. Cosmochim. Acta 53, 1577–1581. doi: 10.1016/0016-7037(89)90239-1
Middelburg J. J., Soetaert K., Herman P. M. J., Heip C. H. R. (1996). Denitrification in marine sediments: A model study. Glob. Biogeochem. Cy. 10, 661–673. doi: 10.1029/96GB02562
Mittelstaedt E. (1983). The upwelling area off Northwest Africa – a description of phenomena related to coastal upwelling. Prog. Oceanogr. 12, 307–331. doi: 10.1016/0079-6611(83)90012-5
Möbius J. (2013). Isotope fractionation during nitrogen remineralization (ammonification): Implications for nitrogen isotope biogeochemistry. Geochim. Cosmochim. Acta 105, 422–432. doi: 10.1016/j.gca.2012.11.048
Mortazavi B., Chanton J. P. (2004). Use of keeling plots to determine sources of dissolved organic carbon in nearshore and open ocean systems. Limnol. Oceanogr. 49, 102–110. doi: 10.4319/lo.2004.49.1.0102
Prokopenko M. G., Hirst M. B., De Brabandere L., Lawrence D. J. P., Berelson W. M., Granger J., et al. (2013). Nitrogen losses in anoxic marine sediments driven by Thioploca-anammox bacterial consortia. Nature 500, 194–198. doi: 10.1038/nature12365
Rooze J., Meile C. (2016). The effect of redox conditions and bioirrigation on nitrogen isotope fractionation in marine sediments. Geochim. Cosmochim. Acta 184, 227–239. doi: 10.1016/j.gca.2016.04.040
Ryabenko E., Altabet M. A., Wallace D. W. R. (2009). Effect of chloride on the chemical conversion of nitrate to nitrous oxide for delta n–15 analysis. Limnol. Oceanogr. Meth. 7, 245–552. doi: 10.4319/lom.2009.7.545
Schafstall J., Dengler M., Brandt P., Bange H. (2010). Tidal induced mixing and diapycnal nutrient fluxes in the Mauritanian upwelling region. J. Geophys. Res. 115, C10014. doi: 10.1029/2009JC005940
Schmidtko S., Stramma L., Visbeck M. (2017). Decline in global oceanic oxygen content during the past five decades. Nature 542, 335–339. doi: 10.1038/nature21399
Schroller-Lomnitz U., Hensen C., Dale A. W., Scholz F., Clemens D., Sommer. S., et al. (2019). Dissolved benthic phosphate, iron and carbon fluxes in the Mauritanian upwelling system and implications for ongoing deoxygenation. Deep-Sea Res. I 143, 70–84. doi: 10.1016/j.dsr.2018.11.008
Sigman D. M., Casciotti K. L., Andreani M., Barford C., Galanter M., Böhlke J. K. (2001). A bacterial method for the nitrogen isotopic analysis of nitrate in seawater and freshwater. Anal. Chem. 73, 4145–4153. doi: 10.1021/ac010088e
Sigman D. M., DiFiore P. J., Hain M. P., Deutsch C., Wang Y., Karl D. M., et al. (2009). The dual isotopes of deep nitrate as a constraint on the cycle and budget of oceanic fixed nitrogen. Deep-Sea Res. I Oceanogr. Res. Pap. 56, 1419–1439. doi: 10.1016/j.dsr.2009.04.007
Sigman D. M., Granger J., DiFiore P. J., Lehmann M. F., Ho R., Cane G., et al. (2006). Coupled nitrogen and oxygen isotope measurements of nitrate along the eastern north pacific margin. Global Biogeochem. Cycles 19, GB4022. doi: 10.1029/2005GB002458
Sloth N. P., Nielsen L. P., Blackburn T. H. (1992). Nitrification in sediment cores measured with acetylene inhibition. Limnol. Oceanogr. 37, 1108–1112. doi: 10.4319/lo.1992.37.5.1108
Sokoll S., Lavik G., Sommer S., Goldhammer T., Kuypers M. M. M., Holtappels M. (2016). Extensive nitrogen loss from permeable sediments off north-West Africa. J. Geophys. Res. Biogeosci. 121, 1144–1157. doi: 10.1002/2015JG003298
Somes C. J., Oschlies A., Schmittner A. (2013). Isotopic constraints on the pre-industrial oceanic nitrogen budget. Biogeosciences 10, 5889–5910. doi: 10.5194/bg-10-5889-2013
Sommer S., Adam N., Becker K., Dale A. W., Hahn J., Kampmeier M., et al. (2020). Role of eddies in the carbon pump of Eastern boundary upwelling systems, REEBUS, cruise no. M156, 03.07. – 01.08.2019 mindelo (Cap Verde) – mindelo (Bonn: Meteor Berichte, M156. Gutachterpanel Forschungsschiffe), 53 pp. doi: 10.2312/cr_m156
Sommer S., Dengler M., Treude T. (2015). Benthic element cycling, fluxes and transport of solutes across the benthic boundary layer in the Mauritanian oxygen minimum zone, (SFB754) - cruise no. M107, may 30 - July 03, 2014, fortaleza (Brazil) - las palmas (Spain). METEOR-berichte, M107 (Bremen: DFG-Senatskommission für Ozeanographie), 67 pp. doi: 10.2312/cr_m107
Sommer S., Türk M., Kriwanek S., Pfannkuche O. (2008). Gas exchange system for extended in situ benthic chamber flux measurements under controlled oxygen conditions: First application – Sea bed methane emission measurements at captain arutyunov mud volcano. Limnol. Oceanogr. Meth. 6, 23–33. doi: 10.4319/lom.2008.6.23
Stolpovsky K., Dale A. W., Wallmann K. (2015). Toward a parameterization of global-scale organic carbon mineralization kinetics in surface marine sediments. Glob. Biogeochem. Cy. 29, 812–829. doi: 10.1002/2015GB005087
Stramma L., Johnson G. C., Sprintall J., Mohrholz V. (2008). Expanding oxygen–minimum zones in the tropical oceans. Science 320, 655–658. doi: 10.1126/science.1153847
Strous M., Fuerst J. A., Kramer E. H. M., Logemann S., Muyzer G., van de Pas-Schoonen K. T., et al. (1999). Missing lithotroph identified as new planctomycete. Nature 400, 446–449. doi: 10.1038/22749
Sundby B., Anderson L. G., Hall P. O. J., Iverfeldt Å., van der Loeff M. M. R., Westerlund S. F. G. (1986). The effect of oxygen on release and uptake of cobalt, manganese, iron and phosphate at the sediment-water interface. Geochim. Cosmochim. Acta 50 (6), 1281–1288. doi: 10.1016/0016-7037(86)90411-4
Thomsen S., Karstensen J., Kiko R., Krahmann G., Dengler M., Engel A. (2019). Remote and local drivers of oxygen and nitrate variability in the shallow oxygen minimum zone off Mauritania in June 2014. Biogeosciences 16, 979–998. doi: 10.5194/bg-16-979-2019
Voss M., Dippner J. W., Montoya J. P. (2001). Nitrogen isotope patterns in the oxygen–deficient waters of the Eastern tropical north pacific ocean. Deep–Sea Res. I 48, 1905–1921. doi: 10.1016/S0967-0637(00)00110-2
Wallmann K., José Y. S., Hopwood M. J., Somes C. J., Dale A. W., Scholz F., et al. (2022). Biogeochemical feedbacks may amplify ongoing and future ocean deoxygenation: A case study from the Peruvian oxygen minimum zone. Biogeochemistry 159, 45–67. doi: 10.1007/s10533-022-00908-w
Wenzhöfer F., Lemburg J., Hofbauer M., Lehmenhecker S., Färber P. (2016). TRAMPER – an autonomous crawler for long-term benthic oxygen flux studies in remote deep-sea ecosystems (Monterey: OCEANS 2016 MTS/IEEE), 1–6.
Keywords: nitrogen isotopes, fractionation, particulate organic carbon (POC), continental margin, denitrification, anammox, NW Africa upwelling, marine sediments
Citation: Dale AW, Clemens D, Dähnke K, Korth F, Wankel SD, Schroller-Lomnitz U, Wallmann K and Sommer S (2022) Nitrogen cycling in sediments on the NW African margin inferred from N and O isotopes in benthic chambers. Front. Mar. Sci. 9:902062. doi: 10.3389/fmars.2022.902062
Received: 22 March 2022; Accepted: 10 November 2022;
Published: 08 December 2022.
Edited by:
Annie Bourbonnais, University of South Carolina, United StatesReviewed by:
Karen L. Casciotti, Stanford University, United StatesXin Zhou, Guangdong Ocean University, China
Su Mei Liu, Ocean University of China, China
Copyright © 2022 Dale, Clemens, Dähnke, Korth, Wankel, Schroller-Lomnitz, Wallmann and Sommer. This is an open-access article distributed under the terms of the Creative Commons Attribution License (CC BY). The use, distribution or reproduction in other forums is permitted, provided the original author(s) and the copyright owner(s) are credited and that the original publication in this journal is cited, in accordance with accepted academic practice. No use, distribution or reproduction is permitted which does not comply with these terms.
*Correspondence: Andrew W. Dale, adale@geomar.de
†Present address: Frederike Korth, Institute of Agricultural Engineering, University of Natural Resources and Life Sciences, Wien, Austria