Field Application of Automated Spectrophotometric Analyzer for High-Resolution In Situ Monitoring of pH in Dynamic Estuarine and Coastal Waters
 Münevver Nehir
 Mario Esposito
 Socratis Loucaides
 Eric P. Achterberg
- 1Marine Biogeochemistry, Chemical Oceanography GEOMAR Helmholtz Centre for Ocean Research Kiel, Kiel, Germany
- 2 Ocean Technology and Engineering National Oceanography Centre, Southampton, United Kingdom
High quality pH measurements are required in estuarine and coastal waters to assess the impacts of anthropogenic atmospheric CO2 emissions on the marine carbonate system, including the resulting decrease in pH. In addition, pH measurements are needed to determine impacts on carbonate chemistry of phytoplankton blooms and their breakdown, following enhanced anthropogenic nutrient inputs. The spectrophotometric pH technique provides high quality pH data in seawater, and is advantageous for long-term deployments as it is not prone to drift and does not require in situ calibration. In this study, a field application of a fully automated submersible spectrophotometric analyzer for high-resolution in situ pH measurements in dynamic estuarine and coastal waters is presented. A Lab-on-Chip (LOC) pH sensor was deployed from a pontoon in the inner Kiel Fjord, southwestern Baltic Sea, for a total period of 6 weeks. We present a time-series of in situ pHT (total pH scale) and ancillary data, with sensor validation using discretely collected samples for pHT and laboratory analysis. The difference between the sensor and laboratory analyses of discrete samples was within ±0.015 pHT unit, with a mean difference of 0.001 (n=65), demonstrating that the LOC sensor can provide stable and accurate pHT measurements over several weeks.
Introduction
The oceans play a significant role in the global carbon cycle as one of the main reservoirs of carbon. Since the beginning of the Industrial Revolution, anthropogenic CO2 emissions have perturbed the exchange of CO2 between the atmosphere and oceans. Oceans have absorbed about a quarter of anthropogenic carbon dioxide (CO2) emissions (Friedlingstein et al., 2020), a process causing a long-term pH decrease (ocean acidification). To date, several studies have focused on determining the progression of ocean acidification by using long-term ocean observations datasets (Dore et al., 2009; Midorikawa et al., 2010; Hu et al., 2015; Van Dam and Wang, 2019; Ishida et al., 2021). Time-series measurements of surface ocean pH over the past two decades have reported a decrease of about 0.1 units since the pre-industrial era from ca. 8.2 to 8.1 (Orr et al., 2005). An additional decrease in surface ocean pH of more than 0.4 units is expected by the end of the 21st century (Feely et al., 2009; Jiang et al., 2019; Kwiatkowski et al., 2020).
Estuarine and coastal waters are more complex than open ocean waters and are highly dynamic environments where freshwater discharges mix with seawater, with many systems impacted by anthropogenic activities. For example, nutrient run-off results in eutrophication with the ensuing breakdown of organic matter produced by phytoplankton blooms causing high pCO2 and reduced pH values, adding to the acidification caused by anthropogenic CO2 uptake (Wallace et al., 2014; Zhao et al., 2020). The acidification of estuarine and coastal waters is affecting ecosystems negatively and various biogeochemical processes in a water column (Guinotte and Fabry, 2008; Hall et al., 2020; Thomas et al., 2022). For example, enhanced acidic conditions threaten the growth, abundance, and survival of shell-forming organisms (corals, some plankton species, and commercial shellfish (Doney et al., 2020; Fox et al., 2020; Wilson et al., 2020; Blaisdell et al., 2021) and affect the solubility and speciation of trace metals (Millero et al., 2009; Hoffmann et al., 2012). To improve our understanding of the current state of the kinetics and dynamics of various physical and biogeochemical processes in estuarine and coastal waters, monitoring activities with a high-resolution are essential (Carstensen et al., 2018), and pH is one of the keystone parameters to be observed.
High-resolution measurements of pH are essential for tracking the thermodynamic state of acid-base processes in seawater. pH is a measure of the concentrations of hydrogen ion on a logarithmic scale and one of the four measurable parameters of the marine carbonate system. Others are the partial pressure of carbon dioxide (pCO2), dissolved inorganic carbon (DIC) and total alkalinity (AT) (Millero, 2007). The gaseous form of CO2 dissolve in surface waters and is converted into carbonic acid (H2CO3), hydrogen (H+), bicarbonate (HCO3-), carbonate (CO32-) ions (Dickson et al., 2007) as follows:
Four different seawater pH scales; NBS (U.S. National Bureau of Standards), free, total, and seawater, are described in literature and the total scale is favored in oceanography as it includes the effect of sulfate ions (Mosley et al., 2004; Riebesell et al., 2010; Fassbender et al., 2021). The calculation of the dissociation constant of the sulfate ion can be eliminated using the total proton scale (Zeebe and Wolf-Gladrow, 2001). All pH data reported in this study are on the total [H+]T scale, expressed as: .
The traditional carbonate chemistry observations in marine systems are based on discrete water sample collection, storage, transportation, and land-based laboratory analysis. Discrete water samples for carbonate chemistry can be collected using dedicated samplers such as Niskin bottles, and then stored following poisoning using mercuric chloride until laboratory analysis for pH, DIC and AT using standard operational procedures (Dickson et al., 2007). pH can be determined directly using potentiometric or spectrophotometric techniques (Dickson et al. (2007), but also calculated via the CO2Sys software following e.g. AT and DIC measurements (Lewis and Wallace, 1998; Pierrot et al., 2006). The main limitations of this approach are the inadequate temporal resolution and duration and the high costs associated with the collection, preservation, shipping, and analysis of samples.
Advancements in marine technology and observational oceanography have enabled the development of miniaturized in situ pH sensors that can be integrated into stationary or autonomous platform for monitoring marine environments at a high temporal and spatial resolution (Sastri et al., 2019). To date, a range of pH sensors have been reported for autonomous in situ pH measurements, and are based on three different analytical methods, potentiometry (electrodes), fluorescence (optodes) and, spectrophotometry (indicator dyes). Table 1 presents examples of the current in situ pH sensors and their application in multiple oceanographic studies. Each system has a range of advantages and limitations (Rérolle et al., 2012; Rérolle et al., 2018; Sastri et al., 2019). Potentiometric pH sensors for seawater (i.e., Honeywell Durafet Ion-Sensitive Field Effect Transistor (ISFET), SeaFET, SeapHOx) do not require chemical reagents and have a fast sampling frequency (6 seconds per measurement), but measurements are limited to a salinity range between 20 and 40 (Sea-Bird Electronics, Inc.). Besides, Honeywell Durafet based pH sensors may be prone to drift (potentially more than 0.02 pH unit/week) (Rérolle et al., 2016), therefore require preconditioning of the electrode for 5 to 10 days and frequent calibrations (Sabine et al., 2004; Martz et al., 2010; Bresnahan et al., 2014; Mclaughlin et al., 2017; Miller et al., 2018). To date, the Deep Sea Durafet sensor has been deployed on a range of profiling floats, and the assessment and correction for any potential drift to reduce bias in the pH measurements have been comprehensively evaluated by Johnson et al., 2016. Recent work introduced a self-calibrating SeapHOx system for seawater, periodic flushing of the sample cell with a calibration solution of Tris buffer in artificial seawater (Bresnahan et al., 2021), which is yet limited to seawater applications. The main limitations of fluorescent-based pH measurements are the interfering compounds of natural seawater (i.e., chlorophyll-a), drift with time, and the sensor spot is also light sensitive (Clarke et al., 2015). Staudinger et al. (2018) presented a stand-alone optode sensor system for pH, oxygen, and carbon dioxide with an integrated battery and logger and its short-term applications in the Baltic Sea and mentioned the need for drift correction and assessment of biofouling for long-term deployments.
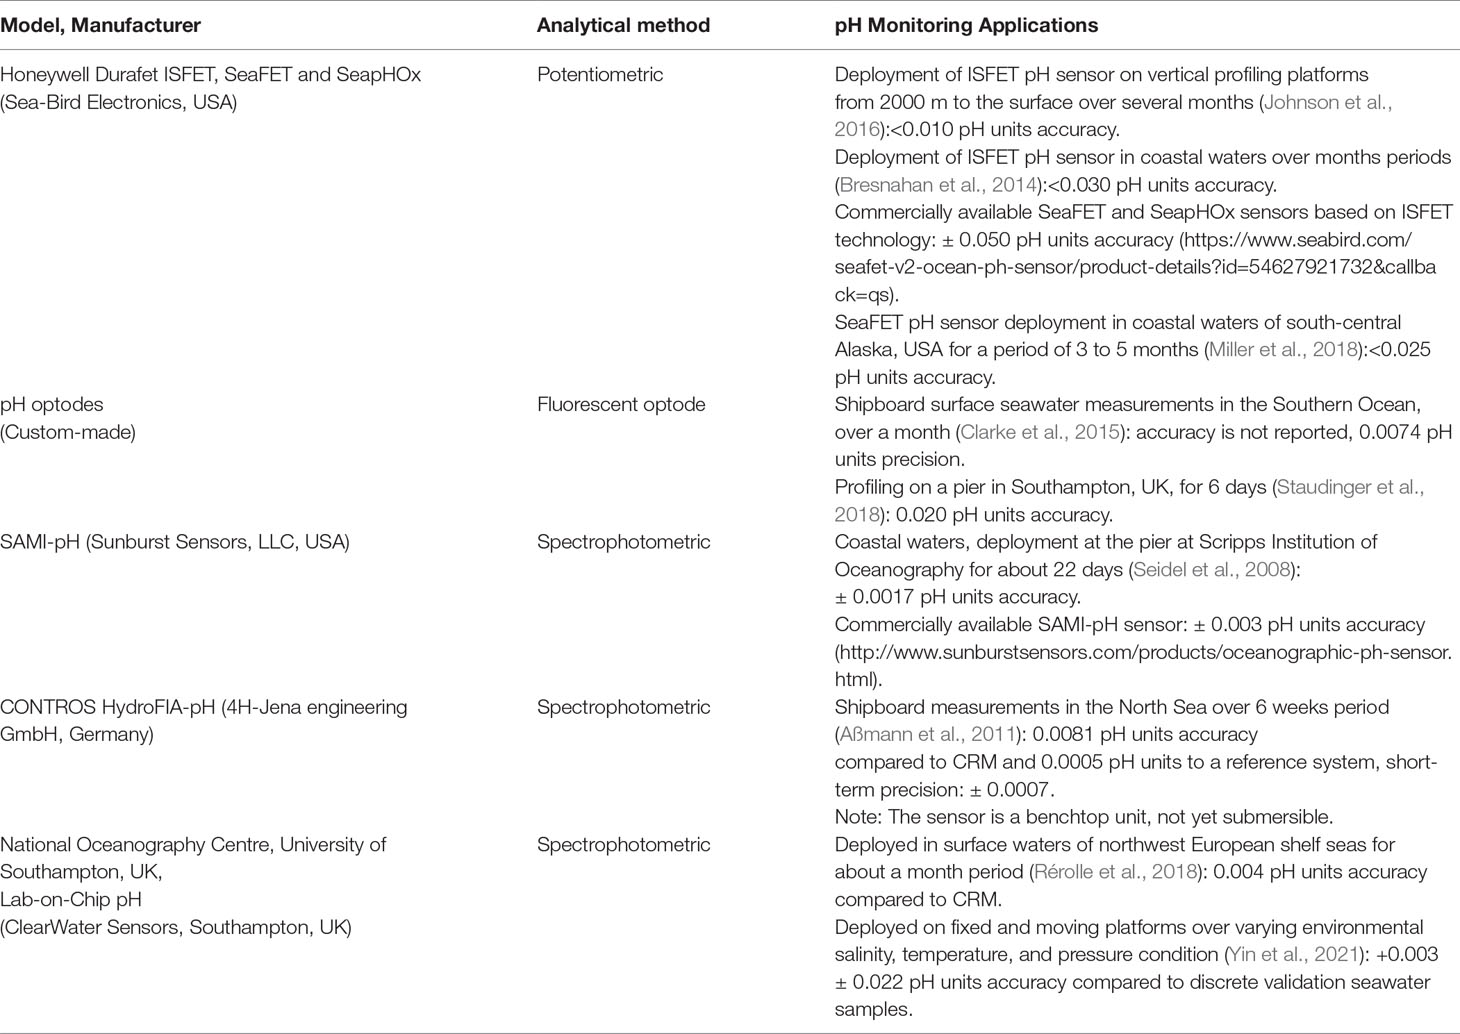
Table 1 Examples of the current in situ pH sensors used in oceanographic studies.
The spectrophotometric method for pH, developed in the 1980s (Robert-Baldo et al., 1985), provides many advantages for marine studies as it is robust, stable, calibration-free and not prone to drift (Rérolle et al., 2012). Under oceanic conditions, spectrophotometric pH measurement systems have demonstrated excellent performance (Clayton and Byrne, 1993; Bellerby et al., 2002; Aßmann et al., 2011; Rérolle et al., 2016). Commercially available, submersible spectrophotometric sensors (see Table 1, Lab-on-Chip (LOC) and SAMI-pH) have been successfully tested for fine-scale, autonomous and in situ monitoring of pH in a wide variety of environments, from freshwater (Martz et al., 2003) to seawater (Seidel et al., 2008; Rérolle et al., 2018; Yin et al., 2021). Indicator impurities and wavelength accuracy of spectrophotometers are some of the potential sources of uncertainty in spectrophotometric pH measurements, which DeGrandpre et al. (2014) has reported in detail. The quality of the pH data is related to how well the molar extinction coefficients and the second dissociation constant of an indicator dye have been determined as a function of sample temperature and salinity. To date, the experimental characterization and modelling of a meta-Cresol Purple (mCP) for estuarine (S ≤ 20, Mosley et al., 2004; Lai et al., 2016; Douglas and Byrne, 2017; Lai et al., 2017; Müller and Rehder, 2018) and hypersaline (35≤S ≤ 100, Loucaides et al., 2017) waters have been reported.
Recently, the capabilities of the LOC pH sensor have been successfully demonstrated on fixed and moving platforms under different environmental conditions, including deployments in surface waters of Southampton (S>24) for several months, and in deep ocean waters (~4820 m) (Yin et al., 2021). However, the performance of this LOC pH sensor in estuarine and coastal waters has not yet been thoroughly investigated.
The aim of this study was to evaluate the performance of an automated spectrophotometric analyzer, a LOC sensor, for high-resolution in situ pH determinations in dynamic estuarine and coastal waters, and expand the applicability of the sensor to waters with a wide salinity range (13.2-21.8). The sensor was deployed from a floating pontoon at GEOMAR Helmholtz Centre for Ocean Research (Kiel, Germany) in the southwestern Baltic Sea between summer and autumn 2018 for a total period of 6 weeks. Ancillary data were obtained to assess the control of pH dynamics at the sampling site. Additional spectrophotometric pHT measurements were conducted in the laboratory on discretely collected samples, and the measurements were validated with certified reference material (DIC-AT CRM, Batch-151, obtained from Prof. A. G. Dickson at Scripps Institute of Oceanography, USA).
Materials and Methods
Sensor Overview
The LOC pH sensor is a submersible unit that performs autonomous in situ pH analysis with a spectrophotometric technique using microfluidic components and was initially developed in 2012 by the Ocean Technology and Engineering group at National Oceanography Centre (NOC) and University of Southampton, UK (Rérolle et al., 2013). It is now (since 2021) commercially available from ClearWater Sensors, Southampton, UK. A schematic diagram of the fluidic design of the sensor is shown in Figure 1. All components were mounted on a three-layer microfluidic chip made from tinted poly(methylmethacrylate) (PMMA, (Floquet et al., 2011; Perez et al., 2016), and together with the electronics placed in a mineral oil-filled (M3516 from Merck, viscosity ≤ 30.0cps) pressure compensated, watertight cylindrical polyvinylchloride housing (15 cm diameter, 56 cm height, 920 g weight in air). Detailed information of the sensor housing and microfluidic chip unit can be found in (Grand et al., 2017).
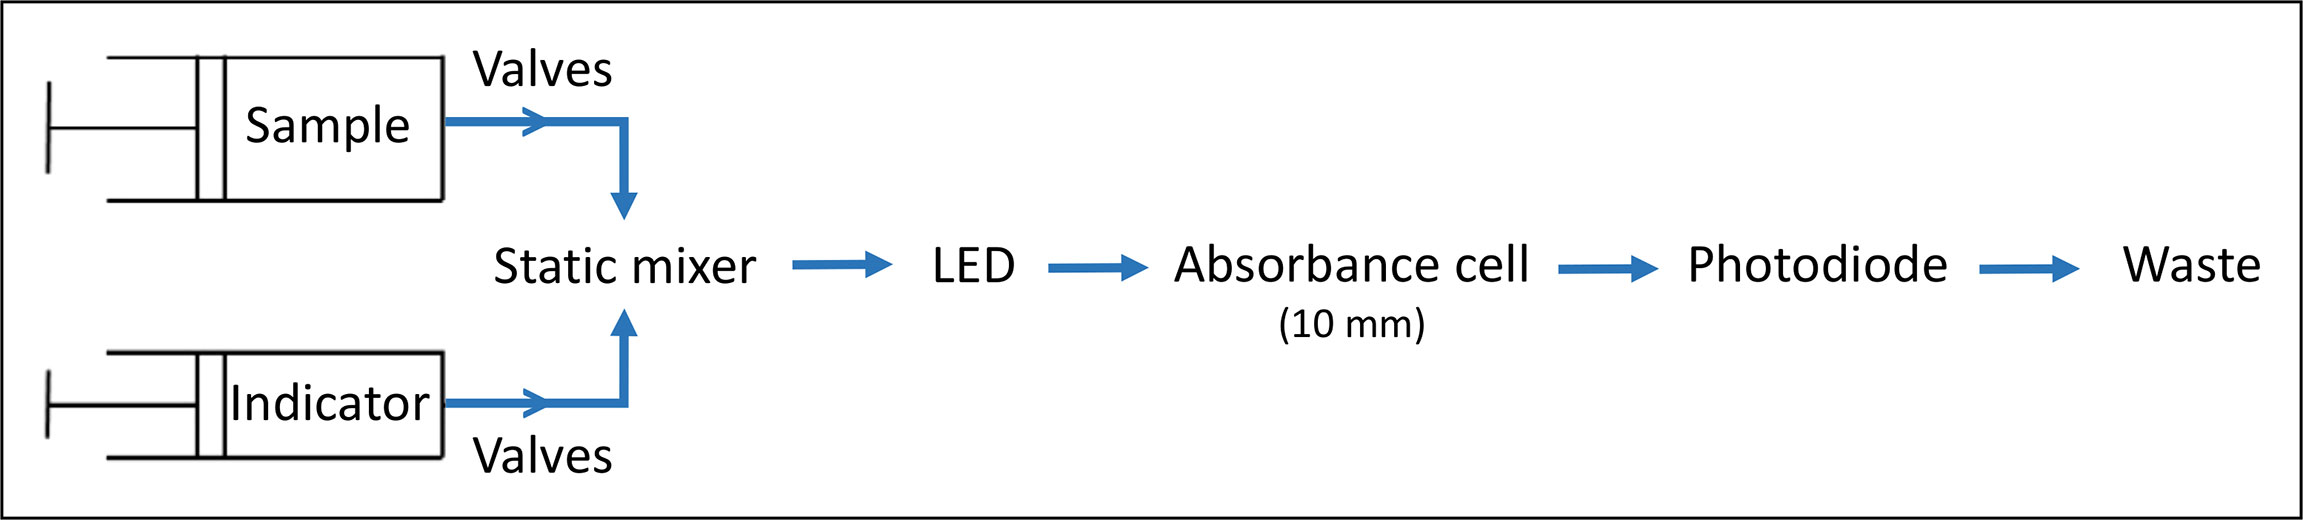
Figure 1 The schematic diagram of the fluidic design of the LOC pH sensor.
The operation of the sensor is explained in brief here. A sample and indicator dye are injected by two separate syringe pumps, controlled by valves, and mixed in a static mixer before entering a 10 mm optical cell. The change in the intensity of light transmitted by a Light Emitting Diode (LED, Roithner Lasertechnik, Austria) at 435 nm (15 nm full width at half maximum (FWHM)) and 590 nm (15 nm FWHM) through the optical cell is recorded by a photodiode detector (TSL257, TAOS Inc., USA) (Floquet et al., 2011; Rérolle et al., 2013; Perez et al., 2016). To account for slight discrepancies between the wavelengths of the LED’s emission and the mCP’s absorption maxima (434 and 578 nm) the pH sensor is calibrated post-manufacture according to Yang et al. (2014). The ratio of absorbances at the absorbance maxima of the acidic and basic forms of the indicator dye is then used to assess the pH value of a sample (Clayton and Byrne, 1993). In continuous operation mode, the sensor requires low power about 3 W or 1300 J per measurement and one measurement takes approximately 8 minutes (Yin et al., 2021). For each measurement, 3 µl of indicator dye is added to 700 µl of sample according to a pre-programmed measurement routine stored internally on the sensor unit. Approximately 0.4 mL of indicator is consumed per day when the sensor operates in continuous mode. Stock solutions of mCP are stored in 50 mL gas impermeable Flexboy bags (Sartorius Stedim Biotech, UK), wrapped in black tape to protect from light and avoid photo bleaching. The mCP stock solution remains stable for several months up to 2 years, when stored appropriately (Takeshita et al., 2021). It is possible to conduct up to 16.666 analyses with one reagent bag of 50 mL, which was attached externally to the LOC pH unit. Waste was collected into an additional external bag attached to the sensor. The WetChem Graphical User Interface (GUI) was used to operate the sensor and visualize intensity values, measurement time, pump position, internal temperature in real-time.
Analytical Principle and Data Processing of the LOC pH Sensor
The analytical principle of spectrophotometric pH determination is based on an addition of a pH-sensitive diprotic sulfonephthalein indicator dye (H2I) to a water sample. The dye changes color according to the pH of the seawater sample, i.e., the color changes from pink to yellow when it is in the acidic [HI-] and to purple when it is in the more basic [I2-] form (Clayton and Byrne, 1993). Chemical equilibria between three dissociation forms of the dye can be expressed as follows:
where [] indicates concentration, K1 and K2 are first and second dissociation constant of the indicator, respectively. The pK2 (in other terms –log(K2)) of mCP is close to the pH of seawater, which is typically between 7.6 to 8.3 (Dickson et al., 2007).
The pH of a seawater sample (pH=−log[H+] ) can then be quantified as:
According to the Beer-Lambert Law, the amount of [I2-] and [HI-] can be calculated using their distinct absorption properties at 434 and 578 nm:
where Aλ is the absorbance, ελ is the molar absorptivity values at wavelength λ, and l is the optical path length.
Then, the equation used to quantify pH can be rearranged as follows:
where R is the ratio of absorbance at 578 (maximum peak for [I2− ]) to 434 nm (maximum peak for [HI− ]), R = A578/A434 (Clayton and Byrne, 1993; Liu et al., 2011).
A recent study reports on the characterization of a range of sulfonephthalein indicator dyes in detail, including mCP, for a broad range of environmental conditions (Hudson-Heck et al., 2021). Data processing of the LOC sensors raw data involves computation of molar extinction coefficients (in terms of e1, e3/e2), and second dissociation constant value (pK2) of mCP at sample temperature and salinity using the equations and coefficients obtained from the literature (e1, e3/e2 were computed from (Liu et al., 2011) and pK2was computed from Müller and Rehder, 2018, which is valid for salinity range 5-20 and temperature range 5-35°C). In situ temperature and salinity data of the sample were collected in parallel by external sensors (see section 2.3.).
In this study, a purified mCP (Acros Organics, 99%) indicator dye was used as its ελ and pK2are well-established for estuarine waters (Lai et al., 2016; Lai et al., 2017; Müller and Rehder, 2018). The purification of mCP was done by following the protocol described in Liu et al. (2011) and Loucaides et al. (2017). A 4 mM mCP reagent solution adjusted to pH 8.0 ± 0.1 at 25°C was prepared and verified by a glass pH electrode.
Field Deployments: Sampling Site and Ancillary Data
In situ field demonstration of the LOC pH sensor was performed on a floating pontoon facility of GEOMAR (Kiel, Germany; 54°19’48.78”N, 10° 8’59.44”E) for a period of 6 weeks between August 1st to 13th and October 20th to November 19th, 2018. The sampling site is surrounded by dockyards and cruise ship terminals, and the city of Kiel with a population of ca. 250,000. The Kiel Fjord has a length of 9.5 km, an inner width of 250 m with depth of 10 to 12 m, an outer width of up to 7.5 km with depths greater than 20 m (Nikulina et al., 2008). The fjord drains into the southwest Baltic Sea. The waters in the inner fjord are homogeneously mixed, except during the summer period following water column stratification. Most of the freshwater delivered to the system is from rainwater and the Schwentine River on the eastern shore (Nikulina et al., 2008).
The LOC sensor was programmed to sample at hourly intervals (except for the first 5 days in August: 20 min intervals). A 0.45 µm Millex HP PES in-line filter (Millipore, Merck, Darmstadt, Germany) was placed at the sample inlet of the LOC sensor to prevent particles from entering the microfluidic channels (Rérolle et al., 2013). The filter surface area is relatively large compared to the volume of sample withdrawn and therefore no significant underpressure is required to draw sample through. The sensor was powered externally by a 12 V power supply.
Salinity, temperature and oxygen were measured with a sampling interval of one minute using a SBE 37-SMP-ODO MicroCAT CTD and dissolved oxygen (DO, dO2) sensor (Sea-Bird Electronics, USA). The LOC, CTD, and DO sensors were mounted on a stainless steel sensor frame that was lowered from the side of the pontoon and positioned at a depth of ca 2 m. Discrete water samples were collected daily, once in the morning and/or once in the evening, using a peristaltic pump (Cole Palmer, Masterflex L/S series) placed on the floating pontoon. The inlet of an acid cleaned (with 1 M HCl) 6.4 mm ID C-Flex tubing (Cole Palmer Masterflex) was attached to the frame close to the sample inlet of the LOC pH sensor. Discrete seawater samples for direct spectrophotometric laboratory analysis of pHT (Yin et al., 2021) were pumped into 250 mL borosilicate bottles and sealed with a ground stopper. Analyses of unpreserved samples were performed within few hours in the laboratory using a benchtop spectrophotometric CONTROS HydroFIA pH analyzer (4H-Jena engineering GmbH, Aßmann et al., 2011). Measurements of the LOC sensor and HydroFIA analyzer were validated using the DIC-AT CRM (Batch-151, pHT 7.862 at temperature 25°C and salinity 33) from Prof. A. G. Dickson (Scripps Institute of Oceanography, USA) before and after deployments. The correction of sample pHT was done using equations described in section 2.2 and in situ temperature and salinity values. Seawater samples of inorganic nutrients (NO3-, PO43- and SiO4-4) were collected after filtration through an AcroPak 500 (Pall GmbH, Germany) in acid-cleaned (1 M HCl) 50 mL polypropylene centrifuge tubes (Jet Bio-Filtration Co., Ltd., Guangzhou, China) and stored at -20°C for about a month until the wet-chemical colorimetric laboratory analysis using a Seal QuAAtro autoanalyser (Becker et al., 2019).
The GEOMAR pontoon facility is used for continuous time-series measurements of various biogeochemical and physical parameters in Kiel Fjord as part of the KIMOCC environmental data monitoring program. Here, we used the one-minute interval post-processed pCO2 data of the installed CONTROS HydroC CO2 sensor (4H-Jena engineering GmbH, Germany). An overview of the analytical principle of the CO2 sensor and data processing can be found in Fietzek et al. (2014). CO2Sys was used to calculate concentration of dissolved CO2 gas in the water sample. Throughout the study, in situ pCO2 levels are in µatm and dissolved CO2 gas levels are in µmol·kg-1 SW.
Weather data (wind speed, rainfall, solar irradiation) were obtained from the GEOMAR weather station, and were available for every 8 min. The tide gauge water level (meter) measurements at Kiel Fjord were obtained from the IOC Sea Level Monitoring Facility (http://www.ioc-sealevelmonitoring.org/station.php?code=kiel). All sensors and ancillary data presented throughout this study were examined and processed using Python software (version 3.7.4).
Results and Discussion
Validation of In Situ pH Sensor Measurements
A total of 65 individual samples were collected during deployments that were analyzed employing a benchtop spectrophotometric analyzer to ensure the accuracy of pH values reported using the LOC sensor. The LOC sensor and discrete water samples pH data followed a consistent pattern throughout both deployments (Figure 2A) and were significantly indifferent (a paired t-test, p ≤ 0.05). A linear regression yielded y=0.998x+0.004 (R2 = 0.99) for a total of 65 samples. No offset was applied to the sensor data and both sensor and discrete pH results were calculated independently. The average difference between the sensor and discrete samples pH (ΔpHT=LOC sensor-discrete water samples) was 0.001 pH units, but ranged from -0.015 to 0.015 over the duration of the summer and autumn deployments (Figure 3). No clear correlation was found between ΔpHT and ancillary data (T, S, dO2), however, the relationship between pHT and ancillary data will be detailed in the next section. Additional validation of the sensor pH measurements was done by calculating pHT from salinity-derived AT and in situ pCO2. Computational details of salinity-derived AT will be clarified in section 3.2. pH data from the summer and autumn deployments pooled together and for a total pH value of 978, a linear regression analysis resulted in R2 = 0.86, with an equation of y=1.030x-0.217 (Figure 2B).
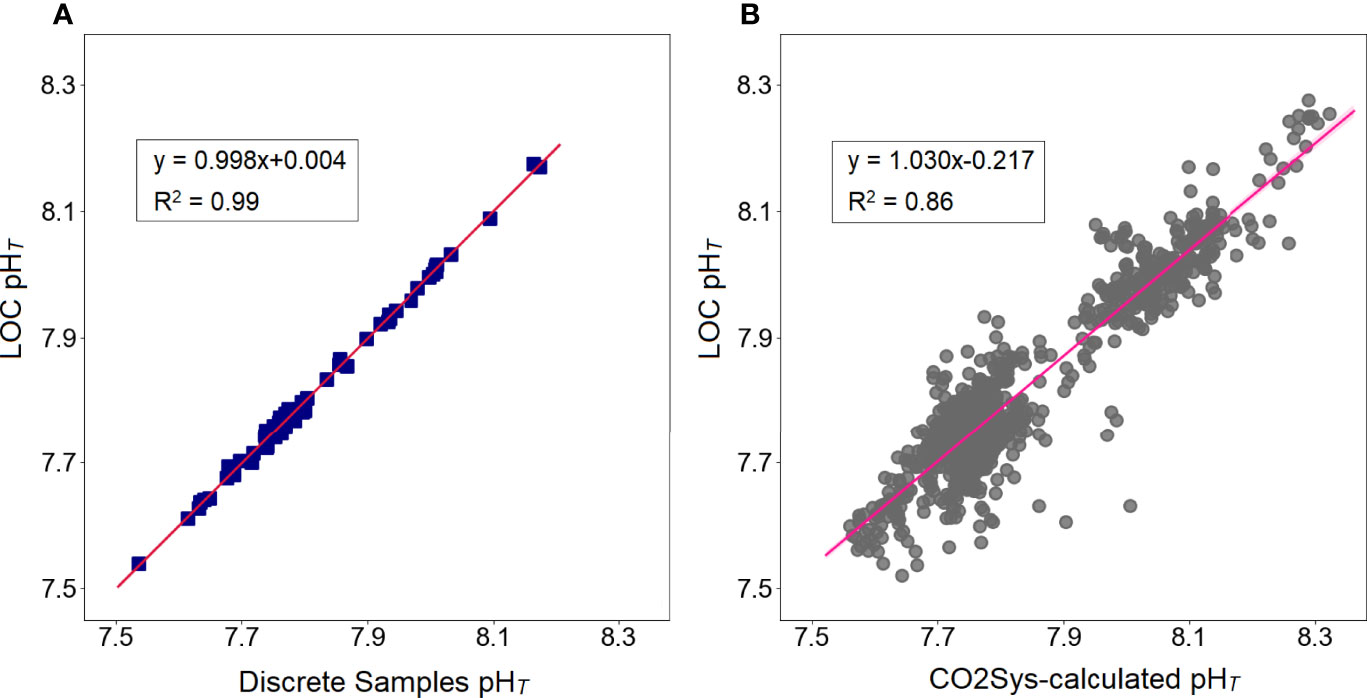
Figure 2 Linear regression fits between all summer and autumn pHT values obtained from (A) discrete water samples vs LOC sensor (data: blue squares, linear fit; solid red line, n=65), and (B) CO2Sys-calculation vs LOC sensor (data: grey circles, linear fit; solid pink line, n=978).
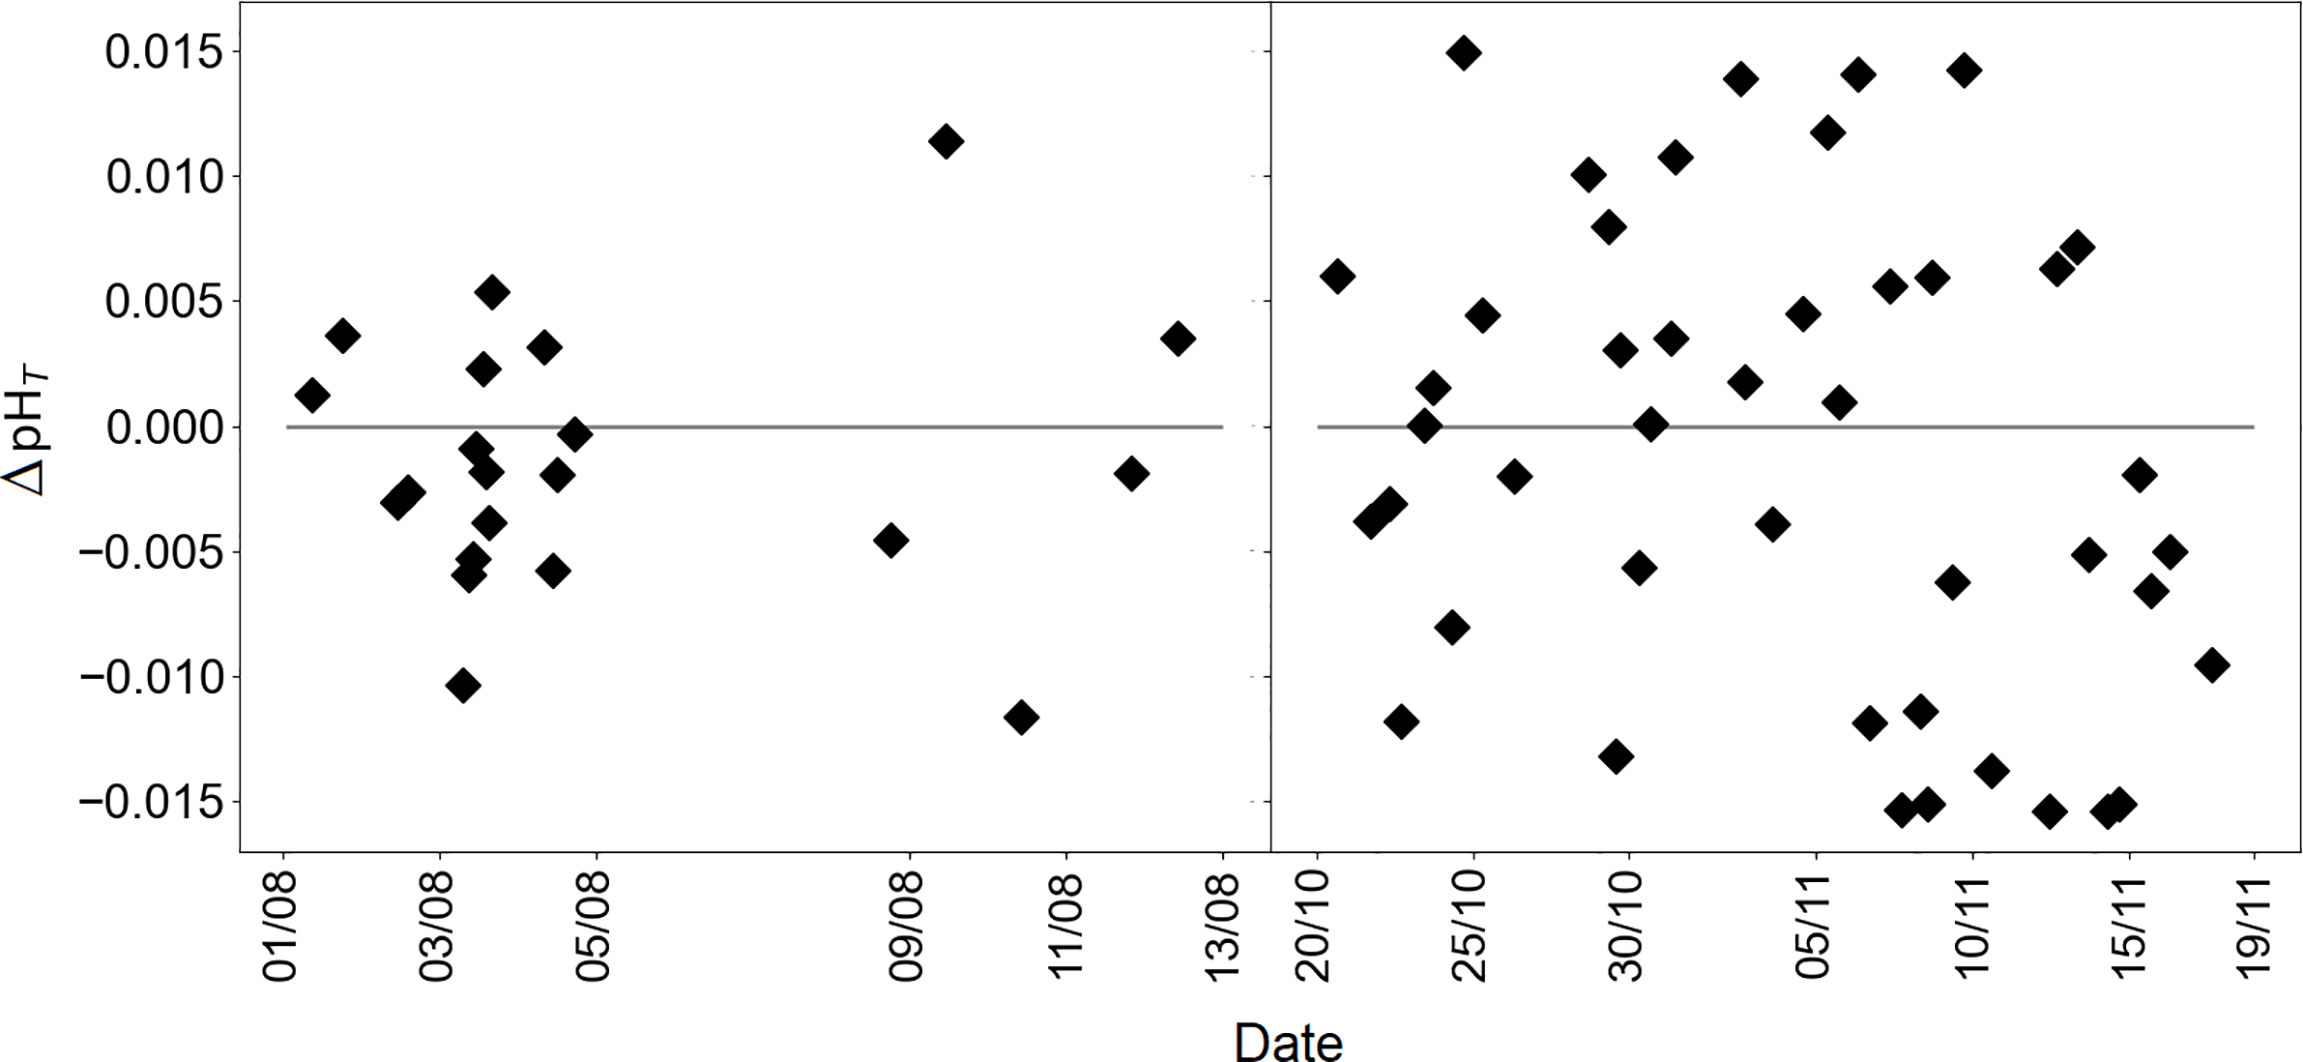
Figure 3 The residuals of ΔpHT (LOC sensor-discrete water samples) over the duration of summer and autumn deployments, respectively.
Both the LOC sensor and HydroFIA analyzer measurements were validated by consecutive measurements of DIC-TA Certified Reference Material (CRM) (Batch-151, pHT=7.862 at T=25°C, S=33) before and after the field deployments. The mean pH values obtained from ten consecutive CRM measurements in July, September, and November 2018 were 7.858 ± 0.002, 7.860 ± 0.002 and 7.859 ± 0.001 pH units for the LOC pH sensor and 7.861 ± 0.001, 7.862 ± 0.002 and 7.860 ± 0.001 pH units for the HydroFIA pH analyzer. Both analyzers had a precision of about 0.001 pH units, and the accuracy of the measurements were slightly better with the HydroFIA analyzer (<0.002 pH units).
Statistical Distribution and Diel Variations of In Situ pH and Ancillary Data
The main focus of this work was to demonstrate the capability of the LOC pH sensor in a highly dynamic system, and analysis of the biogeochemical data was completed to investigate the biogeochemical processes influencing carbonate chemistry dynamics in the Kiel Fjord. The statistical distribution of all data (seawater temperature, salinity, pHT, dO2, pCO2, NO3-, PO43- and SiO4-4 is presented in Table 2 and allows a closer examination of the summer and autumn data. The seawater temperature and salinity, characterizing the hydrographic situation, showed marked changes; the mean salinity values were about 4 units higher and the mean temperature values were about 10 units lower in autumn, indicating saltier and colder water intrusion in the fjord, with fresher waters in summer. Highly dynamic salinity conditions for Kiel Fjord ranging from 2.6 to 22.4 have been reported, with a mean of 14.3 (Schories et al., 2006). During our summer deployment the salinity values ranged between 13.2 and 18 (mean 15.7), and in autumn deployment within 19.6 to 21.8 (mean 20.7). Enhanced seawater temperatures ranging between 18.1 and 24.2°C (mean 22.1°C) characterized the summer deployment. In autumn, temperature dropped to a minimum value of 8.7 and ranged up to 14.1°C (mean 11.5°C).
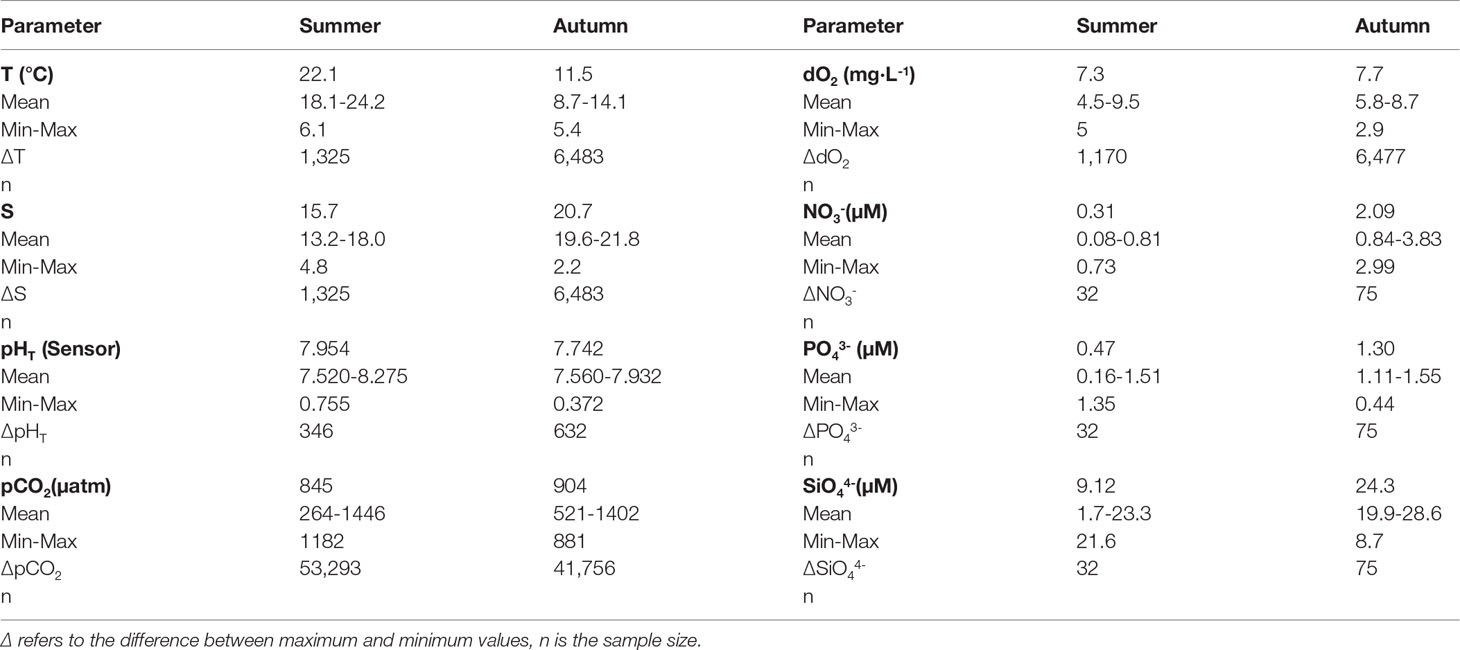
Table 2 Summary statistics for in situ pHT and ancillary data from summer and autumn deployments.
The LOC sensor determined in situ pHT values were within 7.520-8.275 (mean 7.954) and within 7.560-7.932 (mean, 7.742) in summer and autumn, respectively. High mean pCO2 levels were observed related to lower pH values towards autumn. The pCO2 values ranged between 264-1446 µatm (mean 845 µatm) in summer and between 521-1402 µatm (mean, 904 µatm) in autumn. The dO2 observations showed values between 4.5-9.5 mg·L-1 (mean 7.3 mg·L-1) in summer, and 5.8-8.7 mg·L-1 (mean, 7.7 mg·L-1) in autumn, respectively. Although, the mean dO2 levels were almost identical in two seasons, dO2 levels were about two times more dynamic in summer (ΔdO2 was 5 mg·L-1 in summer and 2.9 mg·L-1 in autumn, respectively).
Discretely analyzed samples of nutrients exhibited that NO3- concentrations in summer were depleted with values between 0.08 and 0.81 µM (mean 0.31 µM), and was followed by an increase in autumn, with concentrations between 0.84 and 3.83 µM (mean 2.09 µM). Mean PO43- and SiO4-4 concentrations were also higher in autumn. In summer, the concentration range for PO43- was 0.16-1.51 µM (mean 0.47 µM) and for SiO4-4 1.7-23.3 µM (mean 9.12 µM), whilst in autumn PO43- concentrations varied from 1.1 to 1.55 µM (mean 1.30 µM) and SiO4-4 from 19.9 to 28.6 µM (mean 24.3 µM). The wind speed was maximum 11 m·s-1 in summer (mean 3.2 m·s-1), and 13 m·s-1 in autumn (mean 4.1 m·s-1).
Diel variations of seawater temperature, salinity, pHT, and ancillary variables (pCO2, AT, dO2, nutrients, water level, solar irradiance and wind speed) obtained during the first deployment in summer 2018 are presented in Figure 4. A total of 346 LOC sensor measurements and 21 discrete seawater samples for pH and 32 for nutrients were collected from August 1 to August 13 on the GEOMAR pontoon facility in Kiel Fjord. The 3-day gap in the dataset, between August 5 and 8, was associated with an electrical failure of the power supply to the sensor. The ranges of all variables and the number of samples measured are presented in Table 2.
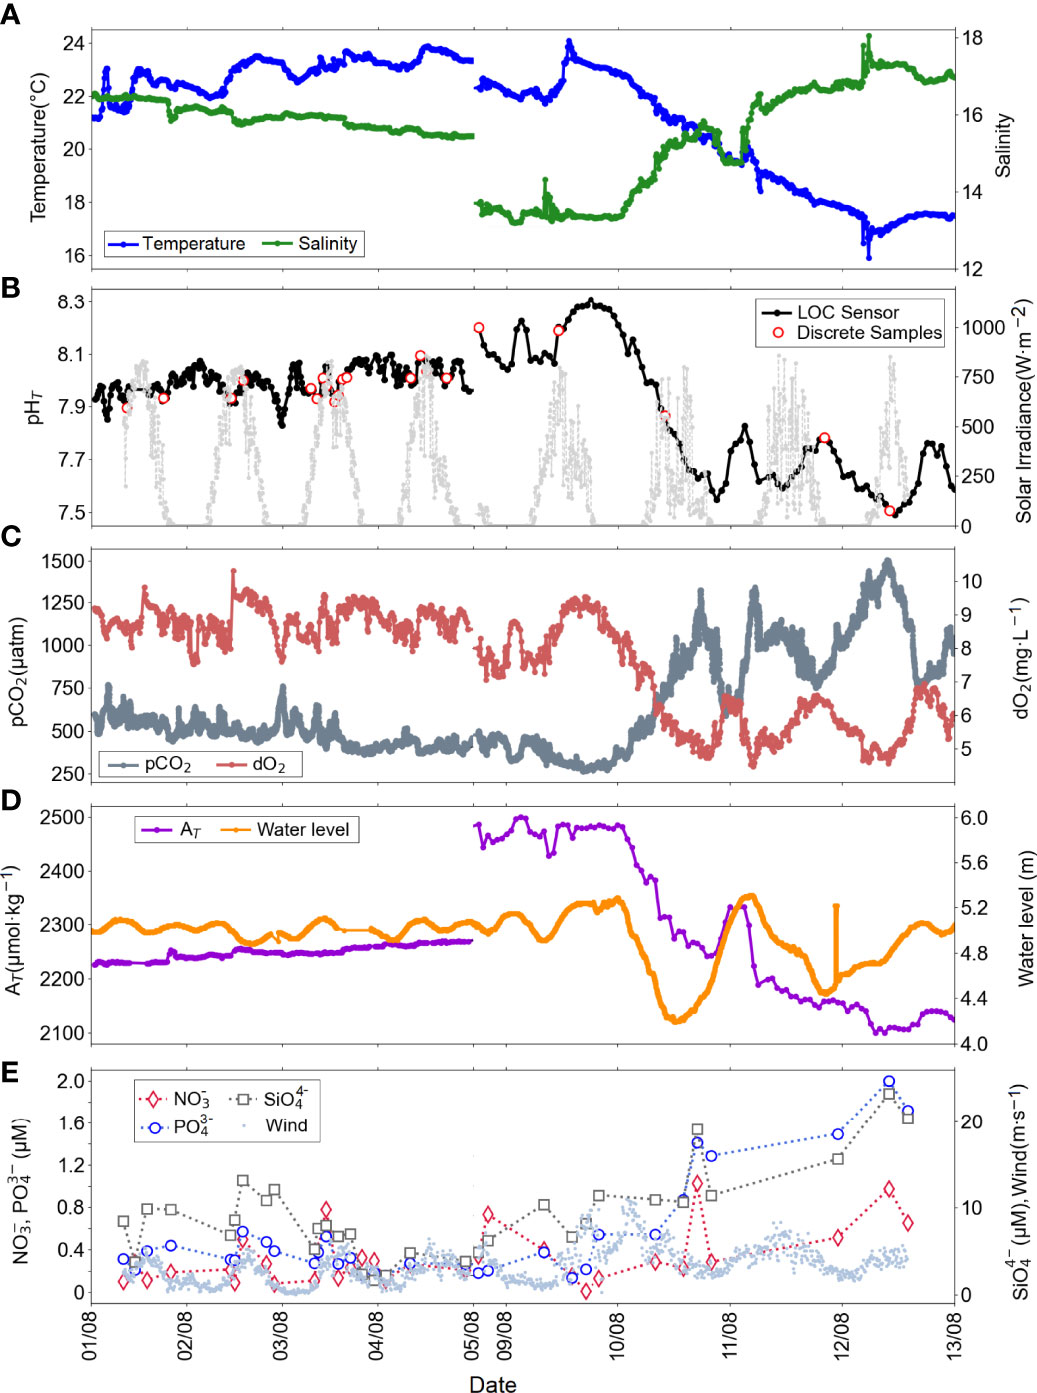
Figure 4 Diel variations of (A)in situ temperature (blue), in situ salinity (green), (B)in situ pHT (black: LOC sensor, red circles: discrete water samples , yellow circle: outliers), solar irradiance (light grey), (C)in situ pCO2 (dark grey), in situ dO2 (coral), (D) salinity-derived AT (purple), water height (orange), and (E) NO3- (red diamond), PO43-, (blue circles), SiO4-4 (grey squares), and wind speed (pale blue dots) with multiple sensors deployed at the GEOMAR pontoon in Kiel Fjord in summer 2018, from 01.08 to 05.08 and from 08.08 to 13.08.
Co-located deployment of independent sensors facilitated the validation of the time-series data at a higher spatial and temporal resolution than can be achieved by analysis of discrete samples (Martz et al., 2015). Considering the high diel variability in temperature, salinity, pHT, and the ancillary data presented in Figure 4, there was a clear difference between the waters sampled at the beginning and end of the deployment. At the beginning of the deployment period until about August 9, 2018, it can be stated that there was not much activity in the water, referring to tidal ranges (difference between high tide and low tide) below 0.3 m and relatively stable ancillary data.
A rapid decrease in pHT from 8.249 to 7.573 (determined by the LOC sensor), increase in pCO2 from 292 to 1029 µatm and decrease in dO2 from 9.2 to 5.4 mg·L-1 was observed within 24 h from August 9 to 10, 2018, corresponded to a heavy storm event with wind speeds up to 11 m·s-1. This event coincided with the extreme weather alert from the German Weather Service (https://www.dwd.de/DE/presse/pressemitteilungen/DE/2018/20180830_deutschlandwetter_august_news.html). A typical tidal range for the Fjord is ±1 m (Geißler et al., 2021). The water level, temperature and salinity measurements presented in Figure 4 illustrate the impact of the storm on the sampled waters. The surface waters of the Kiel Fjord are characterized by enhanced temperature and low salinity, as opposed to the bottom waters of low temperature and high salinity. Shifts in seawater temperature (approximately 3°C decrease) and salinity (approximately 2 units increase) values were observed during the storm. Nutrients were in a trend consistent with pCO2, and both increased in response to increased wind speed and decreased temperatures (Figure 4). Enhanced biological activity was evidenced as while nutrients and pCO2 were increasing, AT and dO2 were in decreasing trend. The in situ determined pHT values were a reflection of pCO2 and dO2 levels.
Anomalous characteristics of the Baltic Sea waters with respect to major ions and hence alkalinity do not allow a straightforward calculation of alkalinity using salinity that applies to all regions of the Baltic Sea in general (Hammer et al., 2014; Müller et al., 2016). Müller et al. (2016) describes the temporal alkalinity trends in the Baltic Sea using long-term historical datasets and shows the relationship between alkalinity and salinity at four different basins. Instead, we have theoretically calculated AT using in situ salinity data from our deployments and the equation for the Atlantic waters (0°C<T<20°C, 31<S<37) from Lee et al. (2006) to compute pHT using CO2Sys and have a view of AT values for our study site. During the summer deployment, salinity-derived AT values ranged between 2205 and 2427 µmol·kg-1 with a mean of 2267 µmol·kg-1. Although the salinity-derived AT values are not exactly suitable for our study area, when the pHT values calculated using these AT and in situ pCO2 data are compared with the sensor pHT values, a significant relationship is seen (Figure 2B).
The second deployment at the same location took place in autumn 2018, from October 20 to November 19, during which 632 LOC sensor measurements were conducted, and discrete seawater samples for discrete seawater samples for pH (n=44) and for nutrients (n=75) were collected. Diel variations of the seawater pHT and ancillary data are shown in Figure 5 and the corresponding value ranges are provided in Table 2. The tide gauge water level measurements at Kiel Fjord corresponding to our measuring period indicated that during a heavy storm (wind speed up to ca. 13 m·s-1, Figure 5E), the water level increased by about 1 m (from 4.46 to 5.46 m, Figure 5D).
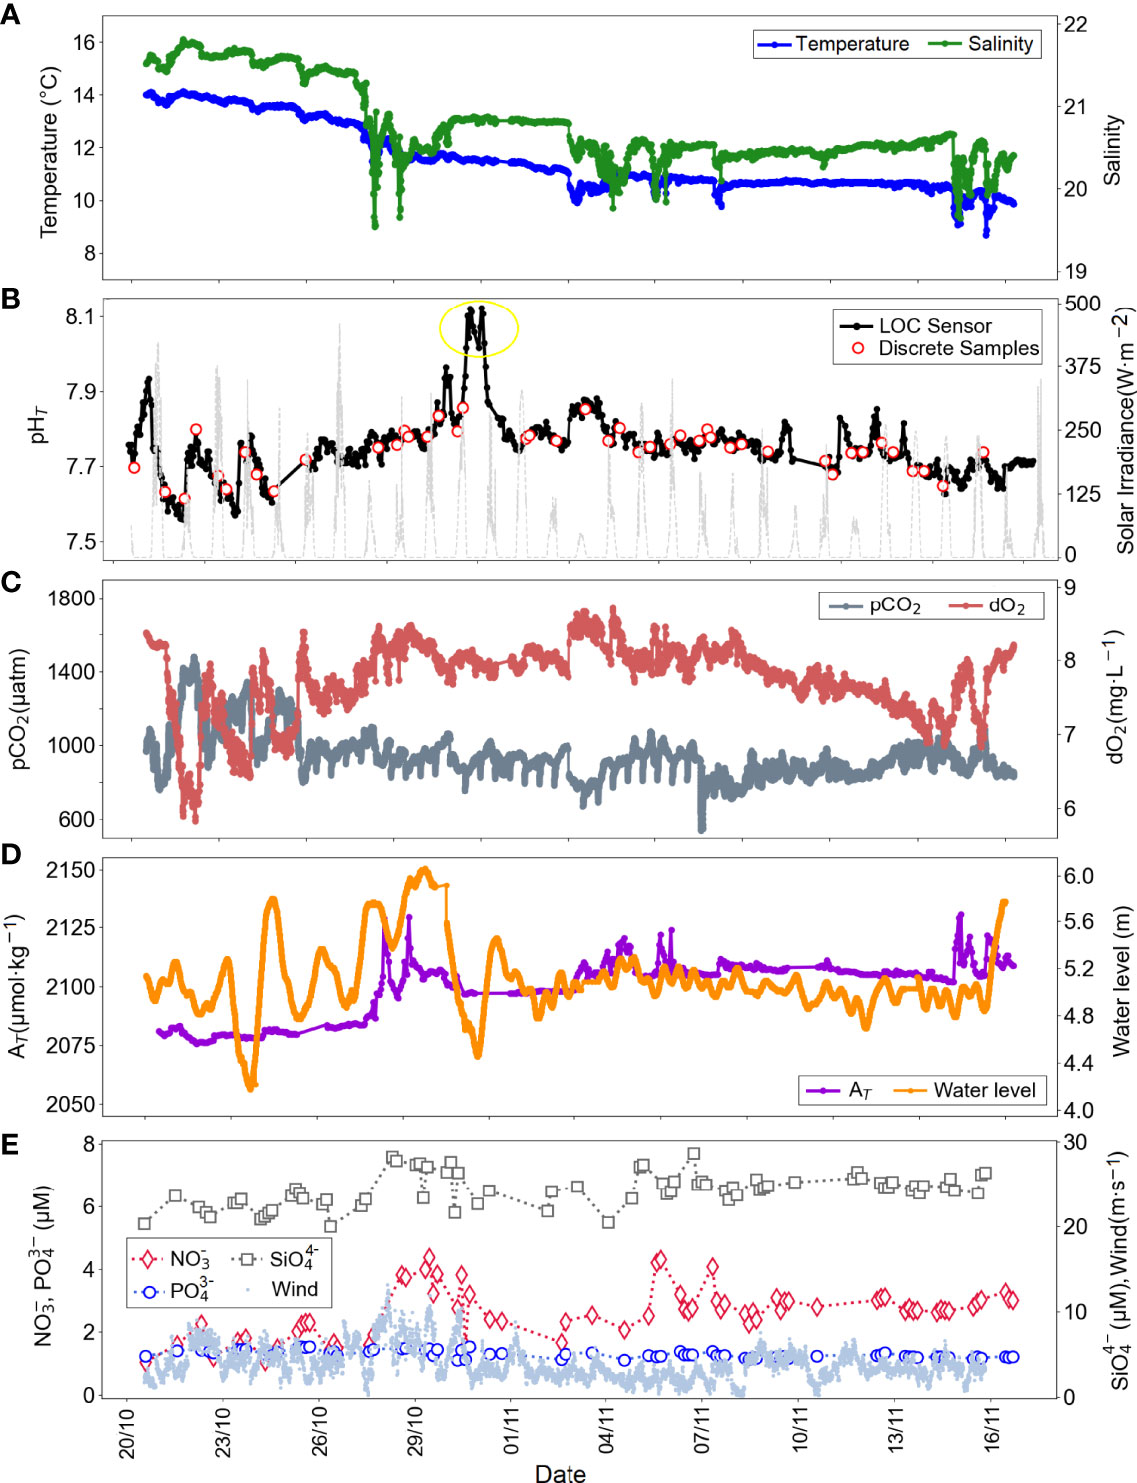
Figure 5 Diel variations of (A)in situ temperature (blue), in situ salinity (green), (B)in situ pHT (black: LOC sensor, red circles: discrete water samples, yellow circle: outliers), solar irradiance (light grey), (C)in situ pCO2 (dark grey), in situ dO2 (coral), (D) salinity-derived AT (purple), water height (orange), and (E) NO3- (red diamond), PO43-, (blue circles), SiO4-4 (grey squares), and wind speed (pale blue dots) with multiple sensors deployed at the GEOMAR pontoon in Kiel Fjord in autumn 2018, from October 20 to November 19.
During the autumn deployment a further notable weather event occurred starting from October 26th, a storm flood approached at the sampling site, followed by successive winds (speed >10 m·s-1) for about 3 days. Over the same period, daily rain intensities (precipitation) of ca. 10 mm were captured, which is a threshold of a heavy rainfall event for Germany (Deumlich and Gericke, 2020), and reductions in water temperature and salinity of about 2 units were observed with additional responses in pHT, pCO2, dO2 and NO3- levels. Strongly variable increases in pHT values were observed, presented in the yellow circle in Figure 5B, and were not included in Table 2. This was likely due to the variations in the physical conditions of the fjord waters with winds and tides. The in line filter of the LOC sensor was changed on November 1, 2018, to avoid possible clogging after dynamic water conditions. The gaps (couple of hours) in the LOC sensor dataset between October 25 and 26, as well as November 11 and 12, were related to the power cuts.
The salinity-derived AT values ranged between 2075 and 2130 µmol·kg-1 with a mean of 2099 µmol·kg-1 in autumn, much lower than those reported in summer. Compared to the first deployment (Figure 4), the time series data presented in Figure 5 were relatively uniform with small differences between maximum and minimum values of all parameters (as indicated by low Δ values, Table 2). An increase in NO3- concentrations, from 1.70 to 3.83 µM, was noticed over a one-day period, between November 5 and 6, 2018. The dO2 levels decreased from 8.5 to 7.9 mg·L-1, whilst pCO2 levels increased from 704 to 961 µatm. The acidification process was evidenced with decreasing pH values from 7.858 to 7.752. This event can be ascribed to supply of subsurface waters enriched in DIC due to organic matter respiration process (see also section 3.3).
Carbonate Chemistry Dynamics in Kiel Fjord
Estuarine and coastal waters feature complex hydrological conditions, often including strong variations in surface salinity (Castelao et al., 2010). Carbonate chemistry in coastal waters is regulated by variety of factors, including biological metabolic (photosynthesis, respiration, and calcium carbonate precipitation or dissolution), and physical processes (ocean currents, tide, weather conditions) (Kristiansen et al., 2001; Feely et al., 2010; Stokowski et al., 2020; Huang et al., 2021). A change in the mass balance of the carbonate system or thermodynamic conditions of the waters affect the surface pCO2 levels, consequently the pH dynamics (Dai et al., 2009).
pHT and ancillary data, presented in this study, exhibited clear diel variations (Figures 4, 5), and the patterns were different in the two seasons, suggesting that distinct internal processes may be involved in regulating these variations. At our deployment site, observations indicated that in the nearshore surface waters of Kiel Fjord were colder, saltier, and more acidic in autumn compared to summer (Figure 6). The ΔpHT was 0.372 units in autumn and 0.755 units in summer, respectively.
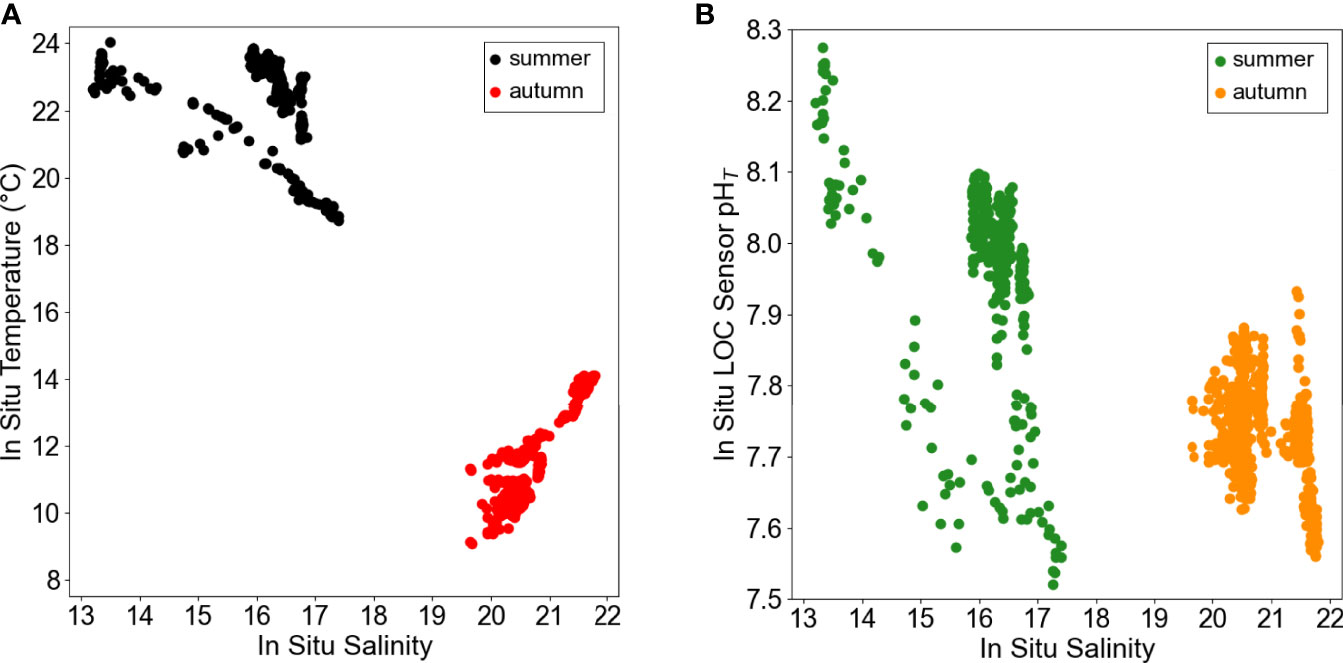
Figure 6 In situ(A) temperature-salinity and (B) pHT-salinity diagram of the period investigated, illustrating different hydrological periods in summer (black, green circles) and autumn (red, orange circles).
pH, pCO2 and dO2 are important indicators for characterizing water masses and biological processes (Orr et al., 2005; Staudinger et al., 2018). An increase in dO2 concentrations corresponded to an increase in pH and decrease in pCO2 levels in waters, due to enhanced photosynthetic activity of algae. The mean differences in dO2 between summer and autumn can also be attributed to the fact that the effect of wind mixing on the water was sharper in our summer distributions, as the waters are generally not well mixed in the summer. The increase in nutrient concentrations and pCO2 while the dO2 decreases are evidence of the biological life in the environment. The pH time-series data mirrors that of pCO2 and dO2, when fit to a linear regression yielded r2 = 0.85 and r2 = 0.77 in summer and yielded r2 = 0.46 and r2 = 0.70 in autumn, respectively (Figure 7). Besides, pCO2 data can be considered as a form of validation of the pH data, as in situ measurements were conducted using two different sensors; CONTROS HydroC and LOC.
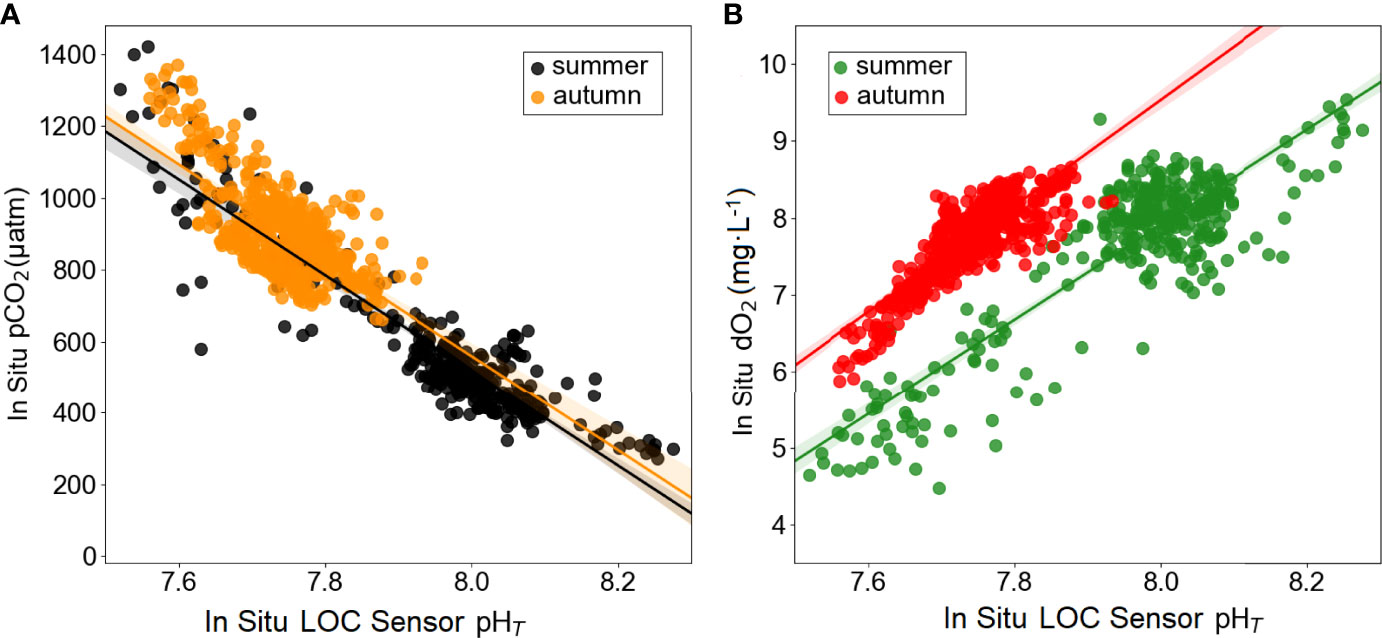
Figure 7 Linear regression (solid lines) plots between (A) pCO2 and pHT (black circles present the data from the summer time-series in situ data presented in Figure 4, linear fit yielded r2 = 0.85 (n=346) and orange circles present the data from the autumn time-series in situ data presented in Figure 5, linear fit yielded r2 = 0.46 (n=632), and (B) dO2 and pHT (green circles present the data from the summer time-series in situ data presented in Figure 4, linear fit yielded r2 = 0.77 (n=346) and red circles present the data from the autumn time-series in situ data presented in Figure 5, linear fit yielded r2 = 0.70 (n=632).
The observed Redfield ratios, defining the stoichiometry of the photosynthesis and respiration reactions (Redfield et al., 1963), are shown in Table 3. The molar ratios between carbon, nitrogen, and phosphorus from simultaneous measurements on the deployment site indicated that the C:N ratio was largely above the proposed Redfield ratio of 106C:16N, which may be related to N loss processes due to denitrification (Gruber, 2008). The N:P ratio in our data was below the Redfield ratio of 16N:1P, which may again be related to N loss through denitrification and additional benthic P supply from anoxic sediments (Lenton and Watson, 2000).
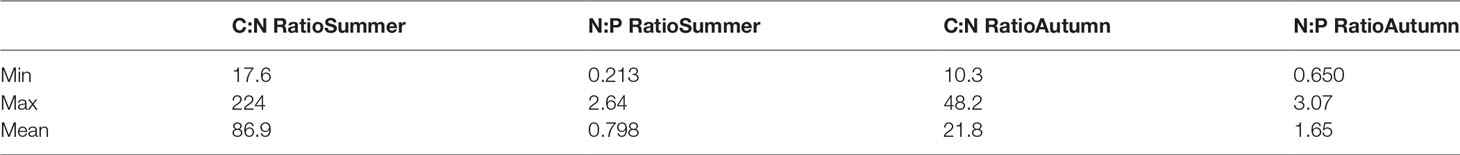
Table 3 Molar ratios of C, N and P derived from simultaneous observations during deployment periods.
Our data from the Kiel Fjord shows strongly elevated in situ pCO2 (maximum of 1420 µatm) levels, even higher than reported for other estuaries. For example the Polish Oder Estuary which also drains into the Baltic Sea has reported pCO2 values of<1200 µatm (Stokowski et al., 2020). Higher CO2 levels were related to nutrient enrichment in the system (Figure 8), with respiration resulting in O2 consumption and CO2 production (Figures 4, 5).
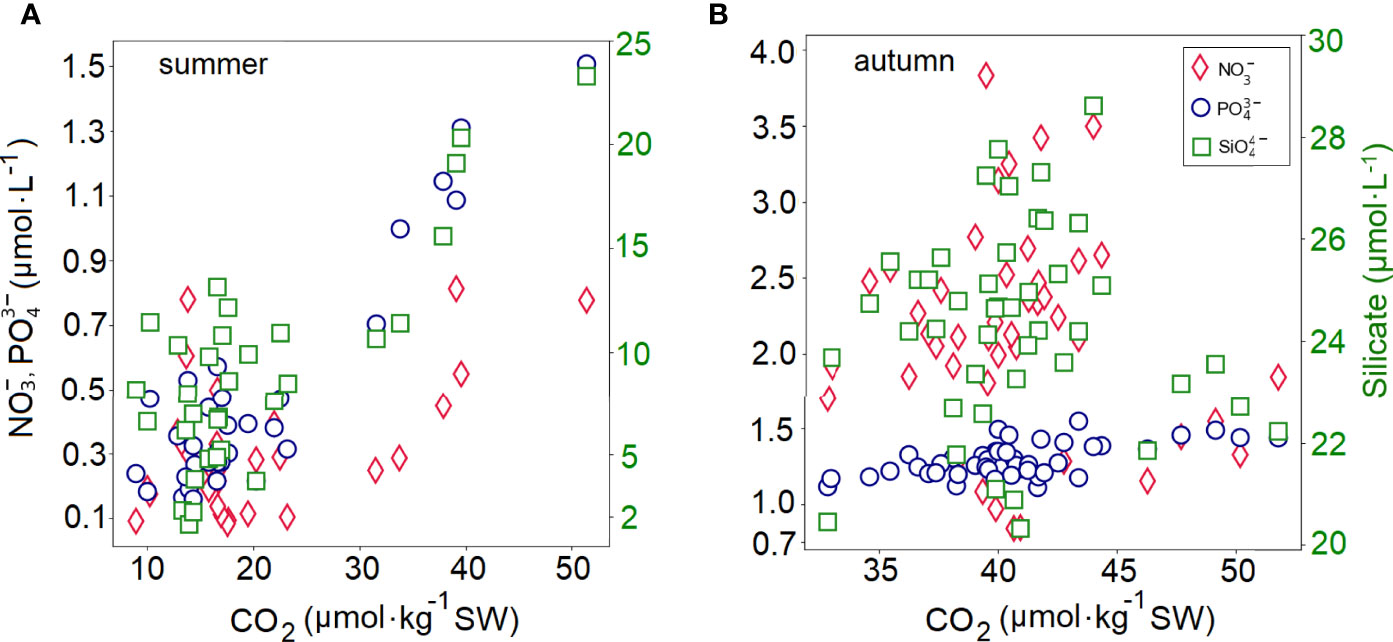
Figure 8 Dynamics of in situ concentration of dissolved CO2 gas in the water sample (calculated using the CO2Sys) vs nutrients during the (A) summer and (B) autumn deployment.
The physical mixing and enhanced remineralization of organic substances in estuaries, promoted by high nutrient loads from land, determine the chemical composition of the system (Bauer et al., 2013; Stokowski et al., 2020). While it is beyond the scope of this study to precisely quantify the intensity of photosynthesis/respiration processes, studies from different estuaries have suggested that intensity levels of biological activities are modulated by wind-driven inputs of nutrients from subsurface waters (Gazeau et al., 2005; Saderne et al., 2013; Li et al., 2020).
Given our in situ data and the main biological and physical drivers of the carbonate chemistry of the estuarine systems, the carbonate system in Kiel Fjord is regulated by i) respiration, and ii) wind-driven mixing. During the deployment periods storm events were captured, in which subsurface waters (with enhanced pCO2 and nutrient levels) were transferred to the surface, evidenced by temperature and salinity observations.
Conclusion
Understanding spatial and temporal changes in pH in association with environmental variables is essential for a sustainable management of marine systems. Hydrodynamic and biogeochemical processes in coastal estuaries change rapidly from minutes to days, triggering acidification in the system (Xu et al., 2017; Wright-Fairbanks et al., 2020). Those sudden changes often cannot be resolved through sampling and analyses of discrete water samples. The automated real-time observation of carbonate chemistry dynamics with sensors like LOC offer a potentially substantial improvement in that regard. While the performances of the LOC sensor for high-resolution spectrophotometric pH measurements has been demonstrated in surface waters of shelf seas with salinities above 24 (Rérolle et al., 2018; Yin et al., 2021), this is the first report on deployments of the sensor in dynamic estuarine waters (S<20).
Our study shows the effects of respiration and wind-driven mixing of water masses leading to consecutive impacts on the carbonate chemistry of the Kiel Fjord. The presented in situ data from observations conducted within a period of six weeks in two seasons (summer and autumn) showed the suitability of the LOC pH sensor for revealing the strong dynamics in highly dynamic estuarine waters on a fine temporal scale. The applicability of the sensor is broad, it was integrated on a Seaglider (iRobot/Kongsberg) (Possenti et al., 2021), on an Autosub Long Range AUV (Yin et al., 2021), and on an ROV (Monk et al., 2021). The unique depth rating (6000 m), low power and reagent consumption, low cost, high portability, and ease to use without calibration for long-term monitoring make the LOC sensor a good choice for autonomous pH observations on various monitoring platforms. Work is currently underway for integration of the LOC pH sensor on other AUVs (pers. comm. Socratis Loucaides). The measurement frequency (~8 min) is the main weakness of the sensor when deployed on fast-moving and profiling platforms such as gliders and floats. Future works should focus on optimizing the measurement duration of the sensor to achieve better performance on such platforms.
Data Availability Statement
The raw data supporting the conclusions of this article will be made available by the authors, without undue reservation.
Author Contributions
MN performed the laboratory and field work, statistical analysis and data visualization. ME performed the installation of the sensors on the deployment platform. MN wrote the first draft of the manuscript. All authors contributed to the article and approved the submitted version.
Funding
This study was supported by funding to EA from the European Union’s Horizon 2020 Research and Innovation Program under the AtlantOS program, grant agreement No. 633211. EA acknowledges funding for the OCEANSensor project as part of the MARTERA Programme and financed by the German Federal Ministry of Economic Affairs and Energy (BMWi; Funding Agreement 03SX459A).
Conflict of Interest
The authors declare that the research was conducted in the absence of any commercial or financial relationships that could be construed as a potential conflict of interest.
Publisher’s Note
All claims expressed in this article are solely those of the authors and do not necessarily represent those of their affiliated organizations, or those of the publisher, the editors and the reviewers. Any product that may be evaluated in this article, or claim that may be made by its manufacturer, is not guaranteed or endorsed by the publisher.
Acknowledgments
The authors thank Class Hiebenthal and Christian Begler for providing the post-processed pCO2 data of the CONTROS HydroC CO2 sensor, and Björn Buchholz for assistance with the deployment facility on a floating pontoon at GEOMAR Helmholtz Centre for Ocean Research (Kiel, Germany). The authors also thank Maria Martinez-Cabanas and Felix Geissler for their assistance with the collection of discrete water samples.
References
Aßmann S., Frank C., Körtzinger A. (2011). Spectrophotometric High-Precision Seawater pH Determination for Use in Underway Measuring Systems. Ocean. Sci. 7, 597–607. doi: 10.5194/os-7-597-2011
Bauer J. E., Cai W. J., Raymond P. A., Bianchi T. S., Hopkinson C. S., Regnier P.A.G. (2013). The Changing Carbon Cycle of the Coastal Ocean. Nature 504, 61–70. doi: 10.1038/nature12857
Becker S., Aoyama M., Woodward E. M. S., Bakker K., Coverly S., Mahaffey C., et al. (2019). GO-SHIP Repeat Hydrography Nutrient Manual: The Precise and Accurate Determination of Dissolved Inorganic Nutrients in Seawater, Using Continuous Flow Analysis Methods. Front. Marine. Sci. 7 (581790), 1−15. doi: 10.3389/fmars.2020.581790
Bellerby R. G. J., Olsen A., Johannessen T., Croot P. (2002). A High Precision Spectrophotometric Method for on-Line Shipboard Seawater pH Measurements: The Automated Marine pH Sensor (AMpS). Talanta 56, 61–69. doi: 10.1016/S0039-9140(01)00541-0
Blaisdell J., Thalmann H. L., Klajbor W., Zhang Y., Miller J. A., Laurel B. J., et al. (2021). A Dynamic Stress-Scape Framework to Evaluate Potential Effects of Multiple Environmental Stressors on Gulf of Alaska Juvenile Pacific Cod. Front. Mar. Sci. 8, 656088. doi: 10.3389/fmars.2021.656088
Bresnahan P. J., Martz T. R., Takeshita Y., Johnson K. S., LaShomb M. (2014). Best Practices for Autonomous Measurement of Seawater pH With the Honeywell Durafet. Methods Oceanogr. 9, 44–60. doi: 10.1016/j.mio.2014.08.003
Bresnahan P. J., Takeshita Y., Wirth T., Martz T. R., Cyronak T., Albright R., et al. (2021). Autonomous In Situ Calibration of Ion-Sensitive Field Effect Transistor pH Sensors. Limnol. Oceanogr. Methods. 19, 132−144. doi: 10.1002/lom3.10410
Carstensen J., Chierici M., Gustafsson B. G., Gustafsson E. (2018). Long-Term and Seasonal Trends in Estuarine and Coastal Carbonate Systems. Global Biogeochem. Cycles. 32, 497–513. doi: 10.1002/2017GB005781
Castelao R., Glenn S., Schofield O. (2010). Temperature, Salinity, and Density Variability in the Central Middle Atlantic Bight. J. Geophys. Res. Ocean. 115, 1−14. doi: 10.1029/2009JC006082
Clarke J. S., Achterberg E. P., Rérolle V. M. C., Abi Kaed Bey S., Floquet C. F. A., Mowlem M. C. (2015). Characterisation and Deployment of an Immobilised pH Sensor Spot Towards Surface Ocean pH Measurements. Anal. Chim. Acta 897, 69–80. doi: 10.1016/j.aca.2015.09.026
Clayton T. D., Byrne R. H. (1993). Spectrophotometric Seawater pH Measurements: Total Hydrogen Ion Concentration Scale Calibration of M-Cresol Purple and at-Sea Results. Deep. Res. 40, 2115–2129. doi: 10.1016/0967-0637(93)90048-8
Dai M., Lu Z., Zhai W., Chen B., Cao Z., Zhou K., et al. (2009). Diurnal Variations of Surface Seawater pCO2 in Contrasting Coastal Environments. Limnol. Oceanogr. 54, 735−745. doi: 10.4319/lo.2009.54.3.0735
DeGrandpre M. D., Spaulding R. S., Newton J. O., Jaqueth E. J., Hamblock S. E., Umansky A. A., et al. (2014). Considerations for the Measurement of Spectrophotometric pH for Ocean Acidification and Other Studies. Limnol. Oceanogr. Methods 12, 830–839. doi: 10.4319/lom.2014.12.830
Deumlich D., Gericke A. (2020). Frequency Trend Analysis of Heavy Rainfall Days for Germany. Water 12,1–29. doi: 10.3390/w12071950
Dickson A. G., Sabine C. L., Christian J. R. (2007). Guide to Best Practices for Ocean CO2 Measurements. Available at: http://aquacomm.fcla.edu/1443/.
Doney S. C., Busch D. S., Cooley S. R., Kroeker K. J. (2020). The Impacts of Ocean Acidification on Marine Ecosystems and Reliant Human Communities. Annu. Rev. Environ. Resour. 45, 83–112. doi: 10.1146/annurev-environ-012320-083019
Dore J. E., Lukas R., Sadler D. W., Church M. J., Karl D. M. (2009). Physical and Biogeochemical Modulation of Ocean Acidification in the Central North Pacific. Proc. Natl. Acad. Sci. U.S.A. 106, 12235–12240. doi: 10.1073/pnas.0906044106
Douglas N. K., Byrne R. H. (2017). Spectrophotometric pH Measurements From River to Sea: Calibration of mCP for 0 ≤ S ≤ 40 and 278.15 ≤ T ≤ 308.15 K. Mar. Chem. 197, 64–69. doi: 10.1016/j.marchem.2017.10.001
Fassbender A., Orr J., Dickson A. (2021). Technical Note: Interpreting pH Changes. Biogeosciences 18, 1407 −1415. doi: 10.5194/bg-18-1407-2021
Feely R. A., Alin S. R., Newton J., Sabine C. L., Warner M., Devol A., et al. (2010). The Combined Effects of Ocean Acidification, Mixing, and Respiration on pH and Carbonate Saturation in an Urbanized Estuary. Estuar. Coast. Shelf. Sci. 88, 442–449. doi: 10.1016/j.ecss.2010.05.004
Feely R. A., Doney S. C., Cooley S. R. (2009). Ocean Acidification: Present Conditions and Future Changes in a High-CO2 World. Oceanography 22, 36–47. doi: 10.5670/oceanog.2009.95
Fietzek P., Fiedler B., Steinhoff T., Körtzinger A. (2014). In Situ Quality Assessment of a Novel Underwater Pco2 Sensor Based on Membrane Equilibration and NDIR Spectrometry. J. Atmos. Ocean. Technol. 31, 181–196. doi: 10.1175/JTECH-D-13-00083.1
Floquet C. F. A., Sieben V. J., Milani A., Joly E. P., Ogilvie I. R. G., Morgan H., et al. (2011). Nanomolar Detection With High Sensitivity Microfluidic Absorption Cells Manufactured in Tinted PMMA for Chemical Analysis. Talanta 84, 235–239. doi: 10.1016/j.talanta.2010.12.026
Fox L., Stukins S., Hill T., Miller C. G.(2020). Quantifying the Effect of Anthropogenic Climate Change on Calcifying Plankton. Sci. Rep. 10,1–9. doi: 10.1038/s41598-020-58501-w
Friedlingstein P., O’Sullivan M., Jones M. W., Andrew R. M., Hauck J., Olsen A., et al. (2020). Global Carbon Budget 2020. Earth Syst. Sci. Data 12, 3269–3340. doi: 10.5194/essd-12-3269-2020
Gazeau F., Borges A. V., Barrón C., Duarte C. M., Iversen N., Middelburg J. J., et al. (2005). Net Ecosystem Metabolism in a Micro-Tidal Estuary (Randers Fjord, Denmark): Evaluation of Methods. Mar. Ecol. Prog. Ser. 301, 23–41. doi: 10.3354/meps301023
Geißler F., Achterberg E. P., Beaton A. D., Hopwood M. J., Esposito M., Mowlem M. C., et al. (2021). Lab-On-Chip Analyser for the in Situ Determination of Dissolved Manganese in Seawater. Sci. Rep. 11, 1−13. doi: 10.1038/s41598-021-81779-3
Grand M. M., Clinton-Bailey G. S., Beaton A. D., Schaap A. M., Johengen T. H., Tamburri M. N., et al. (2017). A Lab-On-Chip Phosphate Analyzer for Long-Term In Situ Monitoring at Fixed Observatories: Optimization and Performance Evaluation in Estuarine and Oligotrophic Coastal Waters. Front. Mar. Sci. 4, 255. doi: 10.3389/fmars.2017.00255
Gruber N. (2008). “The Marine Nitrogen Cycle: Overview and Challenges,” in Nitrogen in the Marine Environment (Netherlands: Elsevier Inc), 1–50. doi: 10.1016/B978-0-12-372522-6.00001-3
Guinotte J. M., Fabry V. J. (2008). Ocean Acidification and its Potential Effects on Marine Ecosystems. Ann. N. Y. Acad. Sci. 1134, 320–342. doi: 10.1196/annals.1439.013
Hall E. R., Wickes L., Burnett L. E., Scott G. I., Hernandez D., Yates K. K., et al. (2020). Acidification in the U.S. Southeast: Causes, Potential Consequences and the Role of the Southeast Ocean and Coastal Acidification Network. Front. Mar. Sci. 7, 548. doi: 10.3389/fmars.2020.00548
Hammer K., Schneider B., Kuli K. (2014). Precision and Accuracy of Spectrophotometric pH Measurements at Environmental Conditions in the Baltic Sea. Estuar. Coast. Shelf. Sci. 146, 24–32. doi: 10.1016/j.ecss.2014.05.003
Hoffmann L. J., Breitbarth E., Boyd P. W., Hunter K. A. (2012). Influence of Ocean Warming and Acidification on Trace Metal Biogeochemistry. Mar. Ecol. Prog. Ser. 470, 191–205. doi: 10.3354/meps10082
Huang W. J., Cai W. J., Hu X. (2021). Seasonal Mixing and Biological Controls of the Carbonate System in a River-Dominated Continental Shelf Subject to Eutrophication and Hypoxia in the Northern Gulf of Mexico. Front. Mar. Sci. 8, 621243. doi: 10.3389/fmars.2021.621243
Hudson-Heck E., Liu X., Byrne R. H. (2021). Purification and Physical-Chemical Characterization of Bromocresol Purple for Carbon System Measurements in Freshwaters, Estuaries, and Oceans. ACS Omega. 6, 17941–17951. doi: 10.1021/acsomega.1c01579
Hu X., Pollack J. B., McCutcheon M. R., Montagna P. A., Ouyang Z. (2015). Long-Term Alkalinity Decrease and Acidification of Estuaries in Northwestern Gulf of Mexico. Environ. Sci. Technol. 49, 3401–3409. doi: 10.1021/es505945p
Ishida H., Isono R. S., Kita J., Watanabe Y. W. (2021). Long-Term Ocean Acidification Trends in Coastal Waters Around Japan. Sci. Rep. 11, 1–7. doi: 10.1038/s41598-021-84657-0
Jiang L., Carter B. R., Feely R. A., Lauvset S. K., Olsen A. (2019). Surface Ocean pH and Buffer Capacity: Past, Present and Future. Sci. Rep. 9,1−11. doi: 10.1038/s41598-019-55039-4
Johnson K. S., Jannasch H. W., Coletti L. J., Elrod V. A., Martz T. R., Takeshita Y., et al. (2016). Deep-Sea DuraFET: A Pressure Tolerant pH Sensor Designed for Global Sensor Networks. Anal. Chem. 88, 3249–3256. doi: 10.1021/acs.analchem.5b04653
Kristiansen S., Farbrot T., Naustvoll L.-J. (2001). Spring Bloom Nutrient Dynamics in the Oslofjord. Mar. Ecol. Prog. Ser. 219, 41–49. doi: 10.3354/meps219041
Kwiatkowski L., Torres O., Bopp L., Aumont O., Chamberlain M., R. Christian J., et al. (2020). Twenty-First Century Ocean Warming, Acidification, Deoxygenation, and Upper-Ocean Nutrient and Primary Production Decline From CMIP6 Model Projections. Biogeosciences 17, 3439–3470. doi: 10.5194/bg-17-3439-2020
Lai C., Degrandpre M. D., Wasser B. D., Brandon T. A., Clucas D. S., Jaqueth E. J., et al. (2016). Spectrophotometric Measurement of Freshwater pH With Purified Meta-Cresol Purple and Phenol Red. Limnol. Oceanogr. Methods 14, 864–873. doi: 10.1002/lom3.10137
Lai C., Degrandpre M. D., Wasser B. D., Brandon T. A., Clucas D. S., Jaqueth E. J., et al. (2017). Corrigendum Spectrophotometric Measurement of Freshwater pH With Purified Meta-Cresol Purple and Phenol Red. Limnol. Oceanogr. Methods 15, 903. doi: 10.1002/lom3.10210
Lee K., Tong L. T., Millero F. J., Sabine C. L., Dickson A. G., Goyet C., et al. (2006). Global Relationships of Total Alkalinity With Salinity and Temperature in Surface Waters of the World’s Oceans. Geophys. Res. Lett. 33, 1−5. doi: 10.1029/2006GL027207
Lenton T. M., Watson A. J. (2000). Redfield Revisited 1. Regulation of Nitrate, Phosphate, and Oxygen in the Ocean. Global Biogeochem. Cycles. 14, 225–248. doi: 10.1029/1999GB900065
Lewis E., Wallace D. W. R. (1998). Program Developed for CO2 System Calculations ( Oak Ridge National Laboratory). ORNL/ CDIAC-105.
Li M., Li R., Cai W. J., Testa J. M., Shen C. (2020). Effects of Wind-Driven Lateral Upwelling on Estuarine Carbonate Chemistry. Front. Mar. Sci. 7, 588465. doi: 10.3389/fmars.2020.588465
Liu X., Patsavas M. C., Byrne R. H. (2011). Purification and Characterization of Meta-Cresol Purple for Spectrophotometric Seawater pH Measurements. Environ. Sci. Technol. 45, 4862–4868. doi: 10.1021/es200665d
Loucaides S., Rèrolle V. M. C., Papadimitriou S., Kennedy H., Mowlem M. C., Dickson A. G., et al. (2017). Characterization of Meta-Cresol Purple for Spectrophotometric pH Measurements in Saline and Hypersaline Media at Sub-Zero Temperatures. Sci. Rep. 7, 1−11. doi: 10.1038/s41598-017-02624-0
Martz T. R., Carr J. J., French C. R., Degrandpre M. D. (2003). A Submersible Autonomous Sensor for Spectrophotometric pH Measurements of Natural Waters. Anal. Chem. 75, 1844–1850. doi: 10.1021/ac020568l
Martz T. R., Connery J. G., Johnson K. S. (2010). Testing the Honeywell Durafet for Seawater pH Applications. Limnol. Oceanogr. Methods 8, 172–184. doi: 10.4319/lom.2010.8.172
Martz T., Mclaughlin K., Weisberg S. B. (2015). Best Practices for Autonomous Measurement of Seawater pH With the Honeywell Durafet pH Sensor. 1–20
Mclaughlin K., Dickson A., Weisberg S. B., Coale K., Elrod V., Hunter C., et al. (2017). An Evaluation of ISFET Sensors for Coastal pH Monitoring Applications. Reg. Stud. Mar. Sci. 12, 11–18. doi: 10.1016/j.rsma.2017.02.008
Midorikawa T., Ishii M., Saito S., Sasano D., Kosugi N., Motoi T., et al. (2010). Decreasing pH Trend Estimated From 25-Yr Time Series of Carbonate Parameters in the Western North Pacific. Tellus. Ser. B. Chem. Phys. Meteorol. 62, 649–659. doi: 10.1111/j.1600-0889.2010.00474.x
Millero F. J. (2007). The Marine Inorganic Carbon Cycle. Chem. Rev. 107, 308–341. doi: 10.1021/cr0503557
Millero F. J., Woosley R., Ditrolio B., Waters J. (2009). Effect of Ocean Acidification on the Speciation of Metals in Seawater. Oceanography 22, 72–85. doi: 10.5670/oceanog.2009.98
Miller C. A., Pocock K., Evans W., Kelley A. L. (2018). An Evaluation of the Performance of Sea-Bird Scientific’s SeaFETTM Autonomous pH Sensor: Considerations for the Broader Oceanographic Community. Ocean. Sci. 14, 751–768. doi: 10.5194/os-14-751-2018
Monk S. A., Schaap A., Hanz R., Borisov S. M., Loucaides S., Arundell M., et al(2021). Detecting and Mapping a CO2 Plume With Novel Autonomous pH Sensors on an Underwater Vehicle. Int. J. Greenh. Gas. Control. 112, 1–13. doi: 10.1016/j.ijggc.2021.103477
Mosley L. M., Husheer S. L. G., Hunter K. A. (2004). Spectrophotometric pH Measurement in Estuaries Using Thymol Blue and M-Cresol Purple. Mar. Chem. 91, 175–186. doi: 10.1016/j.marchem.2004.06.008
Müller J. D., Rehder G. (2018). Metrology of pH Measurements in Brackish Waters — Part 2: Experimental Characterization of Purified Meta-Cresol Purple for Spectrophotometric pHT Measurements. Front. Mar. Sci. 5, 177. doi: 10.3389/fmars.2018.00177
Müller J. D., Schneider B., Rehder G. (2016). Long-Term Alkalinity Trends in the Baltic Sea and Their Implications for CO2-Induced Acidification. Limnol. Oceanogr. 61, 1984–2002. doi: 10.1002/lno.10349
Nikulina A., Polovodova I., Schönfeld J. (2008). Foraminiferal Response to Environmental Changes in Kiel Fjord, SW Baltic Sea. eEarth 3, 37–49. doi: 10.5194/ee-3-37-2008
Orr J. C., Fabry V. J., Aumont O., Bopp L., Doney S. C., Feely R. A., et al. (2005). Anthropogenic Ocean Acidification Over the Twenty-First Century and its Impact on Calcifying Organisms. Nature 437, 681–686. doi: 10.1038/nature04095
Perez I. M., Sansalvador D. V., Fay C. D., Cleary J., Nightingale A. M., Mowlem M. C., et al. (2016). Autonomous Reagent-Based Microfluidic pH Sensor Platform. Sensors. Actuators. B. Chem. 225, 369–376. doi: 10.1016/j.snb.2015.11.057
Pierrot D., Lewis E., Wallace D. W. R. (2006). MS Excel Program Developed for CO2 System Calculations. Carbon Dioxide Information Analysis Center (US: Oak Ridge National Laboratory). doi: 10.3334/CDIAC/otg.CO2SYSXLSCD
Possenti L., Humphreys M. P., Bakker D. C. E., Cobas-García M., Fernand L., Lee G. A., et al. (2021). Air-Sea Gas Fluxes and Remineralization From a Novel Combination of pH and O2 Sensors on a Glider. Front. Mar. Sci. 8, 696772. doi: 10.3389/fmars.2021.696772
Redfield A. C., Ketchum B. H., Richards F. A. (1963). “The Influence of Organisms on the Composition of the Sea Water,” in Sea, vol. 2 . Ed. Hill M. N. (New York, London: Intersci. Publ), 26–77.
Rérolle V. M. C., Achterberg E. P., Ribas-Ribas M., Kitidis V., Brown I., Bakker D. C. E., et al. (2018). High Resolution pH Measurements Using a Lab-On-Chip Sensor in Surface Waters of Northwest European Shelf Seas. Sensors 18, 1−23. doi: 10.3390/s18082622
Rérolle V. M. C., Floquet C. F. A., Harris A. J. K., Mowlem M. C., Bellerby R. R. G. J., Achterberg E. P. (2013). Development of a Colorimetric Microfluidic pH Sensor for Autonomous Seawater Measurements. Anal. Chim. Acta 786, 124–131. doi: 10.1016/j.aca.2013.05.008
Rérolle V. M. C., Floquet C. F. A., Mowlem M. C., Bellerby R. R. G. J., Connelly D. P., Achterberg E. P. (2012). Seawater-pH Measurements for Ocean-Acidification Observations. Trends Anal. Chem. 40, 146–157. doi: 10.1016/j.trac.2012.07.016
Rérolle V., Ruiz-Pino D., Rafizadeh M., Loucaides S., Papadimitriou S., Mowlem M., et al. (2016). Measuring pH in the Arctic Ocean: Colorimetric Method or SeaFET? Methods Oceanogr. 17, 32–49. doi: 10.1016/j.mio.2016.05.006
Riebesell U., Fabry V., Hansson L., Gattuso J. P. (2010). Guide to Best Practices for Ocean Acidification Research and Data Reporting (Brussels, Belgium: Publications Office of the European Union).
Robert-Baldo G. L., Morris M. J., Byme R. H. (1985). Spectrophotometric Determination of Seawater pH Using Phenol Red. Anal. Chem. 57, 2564–2567. doi: 10.1021/ac00290a030
Sabine C. L., Feely R. A., Gruber N., Key R. M., Lee K., Bullister J. L., et al. (2004). The Oceanic Sink for Anthropogenic Co2. Sci. (80-. ). 305, 367–371. doi: 10.1126/science.1097403
Saderne V., Fietzek P., Herman P. M. J. (2013). Extreme Variations of Pco2 and pH in a Macrophyte Meadow of the Baltic Sea in Summer: Evidence of the Effect of Photosynthesis and Local Upwelling. PloS One 8 , 1−8 doi: 10.1371/journal.pone.0062689
Sastri A. R., Christian J. R., Achterberg E. P., Atamanchuk D., Buck J. J. H., Bresnahan P., et al. (2019). Perspectives on In Situ Sensors for Ocean Acidification Research. Front. Mar. Sci. 6, 653. doi: 10.3389/fmars.2019.00653
Schories D., Selig U., Schubert H., Jegzentis K., Mertens M., Schubert M., et al. (2006). Küstengewässer-Klassifizierung deutsche Ostsee nach EU-WRRL. Tl. A Äußere Küstengewässer. Forschungsbericht.Sea-Bird Electronics Inc. Available at: http://satlantic.com/seafet (Accessed January 11, 2021). Sea-Bird Scientific, USA. SeaFETTM V2 and SeapHOxTM V2 User manual. Sea-Bird Electron. Inc.
Seidel M. P., Degrandpre M. D., Dickson A. G. (2008). A Sensor for In Situ Indicator-Based Measurements of Seawater Ph. Mar. Chem. 109, 18–28. doi: 10.1016/j.marchem.2007.11.013
Staudinger C., Strobl M., Fischer J. P., Thar R., Mayr T., Aigner D., et al. (2018). A Versatile Optode System for Oxygen, Carbon Dioxide, and pH Measurements in Seawater With Integrated Battery and Logger. Limnol. Oceanogr. Methods 16, 459–473. doi: 10.1002/lom3.10260
Stokowski M., Schneider B., Rehder G., Kuliński K. (2020). The Characteristics of the CO2 System of the Oder River Estuary (Baltic Sea). J. Mar. Syst. 211, 1−11. doi: 10.1016/j.jmarsys.2020.103418
Takeshita Y., Warren J. K., Liu X., Spaulding R. S., Byrne R. H., Carter B. R., et al. (2021). Consistency and Stability of Purified Meta-Cresol Purple for Spectrophotometric pH Measurements in Seawater. Mar. Chem. 236, 1−10. doi: 10.1016/j.marchem.2021.104018
Thomas A., Ramkumar A., Shanmugam A. (2022). CO2 Acidification and its Differential Responses on Aquatic Biota-a Review. Environ. Adv. 8, 1−6. doi: 10.1016/j.envadv.2022.100219
Van Dam B. R., Wang H. (2019). Decadal-Scale Acidification Trends in Adjacent North Carolina Estuaries: Competing Role of Anthropogenic CO2 and Riverine Alkalinity Loads. Front. Mar. Sci. 6 , 136. doi: 10.3389/fmars.2019.00136
Wallace R. B., Baumann H., Grear J. S., Aller R. C., Gobler C. J. (2014). Coastal Ocean Acidification: The Other Eutrophication Problem. Estuar. Coast. Shelf. Sci. 148, 1–13. doi: 10.1016/j.ecss.2014.05.027
Wilson T. J. B., Cooley S. R., Tai T. C., Cheung W. W. L., Tyedmers P. H. (2020). Potential Socioeconomic Impacts From Ocean Acidification and Climate Change Effects on Atlantic Canadian Fisheries. PloS One 15, 1−29. doi: 10.1371/journal.pone.0226544
Wright-Fairbanks E. K., Miles T. N., Cai W. J., Chen B., Saba G. K. (2020). Autonomous Observation of Seasonal Carbonate Chemistry Dynamics in the Mid-Atlantic Bight. J. Geophys. Res. Ocean. 125, 1−20. doi: 10.1029/2020JC016505
Xu Y.-Y., Chen B., Cai W.-J., Gao Y., Wanninkhof R., Salisbury J., et al. (2017). Short-Term Variability of Aragonite Saturation State in the Central Mid-Atlantic Bight. J. Geophys. Res. Ocean. 122, 4274–4290. doi: 10.1002/2017JC012901.Received
Yang B., Patsavas M. C., Byrne R. H., Ma J. (2014). Seawater pH Measurements in the Field: A DIY Photometer With 0.01 Unit pH Accuracy. Mar. Chem. 160, 75–81. doi: 10.1016/j.marchem.2014.01.005
Yin T., Papadimitriou S., Rérolle V. M. C., Arundell M., Cardwell C. L., Walk J., et al. (2021). A Novel Lab-On-Chip Spectrophotometric pH Sensor for Autonomous In Situ Seawater Measurements to 6000 M Depth on Stationary and Moving Observing Platforms. Environ. Sci. Technol. 55 (21), 14968−14978. doi: 10.1021/acs.est.1c03517
Zeebe R. E., Wolf-Gladrow D. A. (2001). CO2 in Seawater: Equilibrium, Kinetics, Isotopes (Amsterdam: Elsevier). doi: 10.1016/s0924-7963(02)00179-3
Keywords: pH sensor, Lab-on-Chip, spectrophotometric, mCP, Kiel Fjord, coastal carbonate system,ocean acidification
Citation: Nehir M, Esposito M, Loucaides S and Achterberg EP (2022) Field Application of Automated Spectrophotometric Analyzer for High-Resolution In Situ Monitoring of pH in Dynamic Estuarine and Coastal Waters. Front. Mar. Sci. 9:891876. doi: 10.3389/fmars.2022.891876
Received: 08 March 2022; Accepted: 08 June 2022;
Published: 15 July 2022.
Edited by:
Laura Lorenzoni, National Aeronautics and Space Administration (NASA), United StatesReviewed by:
Mike D. DeGrandpre, University of Montana, United StatesEllen Briggs, University of Hawaii at Manoa, United States
Xuewu Liu, University of South Florida, United States
Copyright © 2022 Nehir, Esposito, Loucaides and Achterberg. This is an open-access article distributed under the terms of the Creative Commons Attribution License (CC BY). The use, distribution or reproduction in other forums is permitted, provided the original author(s) and the copyright owner(s) are credited and that the original publication in this journal is cited, in accordance with accepted academic practice. No use, distribution or reproduction is permitted which does not comply with these terms.
*Correspondence: Münevver Nehir, mnehir@web.de