Oligotrophic Phytoplankton Community Effectively Adjusts to Artificial Upwelling Regardless of Intensity, but Differently Among Upwelling Modes
 Joaquin Ortiz1*
  Javier Arístegui2
  Nauzet Hernández-Hernández2
  Mar Fernández-Méndez1,3
  Ulf Riebesell1
- 1Marine Biogeochemistry, Biological Oceanography, Geomar Helmholtz Centre for Ocean Research Kiel, Kiel, Germany
- 2Oceanografía Biológica, Instituto de Oceanografía y Cambio Global, IOCAG, Universidad de Las Palmas de Gran Canaria, Las Palmas de Gran Canaria, Spain
- 3Polar Biological Oceanography Section, Alfred Wegener Institute Helmholtz Centre for Polar and Marine Research, Bremerhaven, Germany
Artificial upwelling has been proposed as a means of enhancing oceanic CO2 sequestration and/or raising fishery yields through an increase in primary production in unproductive parts of the ocean. However, evidence of its efficacy, applicability and side effects is scarce. Here we present part of the results of a 37-day mesocosm study conducted in oligotrophic waters off the coast of Gran Canaria. The goal was to assess in situ the effects of artificial upwelling on the pelagic community. Upwelling was simulated via two modes: i) a singular deep-water pulse and ii) a recurring supply every 4 days; each mode at four different intensities defined by the total amount of nitrate added: approx. 1.5, 3, 5.7, and 11 µmol L-1. In this study we focus on the phytoplankton response through size-fractionated 14C primary production rates (PP), Chlorophyll a and biomass. We observed increases in PP, accumulated PP, Chlorophyll a and biomass that scaled linearly with upwelling intensity. Upwelling primarily benefitted larger phytoplankton size fractions, causing a shift from pico- and nano- to nano- and microphytoplankton. Recurring deep-water addition produced more biomass under higher upwelling intensities than a single pulse addition. It also reached significantly higher accumulated PP per unit of added nutrients and showed a stronger reduction in percentage extracellular release with increasing upwelling intensity. These results demonstrate that oligotrophic phytoplankton communities can effectively adjust to artificial upwelling regardless of upwelling intensity, but differently depending on the upwelling mode. Recurring supply of upwelled waters generated higher efficiencies in primary production and biomass build-up than a single pulse of the same volume and nutrient load.
1 Introduction
Marine primary production is a key process in the ocean that directly and indirectly supports all trophic levels of the pelagic ecosystem. However, unabated climate change is negatively impacting this ecosystem by enhancing ocean stratification and reducing nutrient mixing, which lead to a decline of marine production particularly in low latitude regions (Frölicher et al., 2016; Li et al., 2020). Artificial upwelling has been suggested as a nature-based technology to supply nutrient-rich deep water to the sunlit surface layers. This would not only, at least locally, counteract the increasing stratification thereby restoring marine productivity. It could also lead to increased fishery yields through enhanced food web productivity and carbon sequestration via the biological carbon pump, especially if applied in presently oligotrophic waters. Consequently, it could provide a sustainable food source and potentially reduce atmospheric CO2 concentrations (Kirke, 2003; Lovelock and Rapley, 2007; GESAMP, 2019). Mechanisms tested so far to power the upwelling process include (i) pumps (Miyabe et al., 2004; White et al., 2010), (ii) release of air-bubbles at depth to create an upward flow (McClimans et al., 2010; Handå et al., 2014), (iii) pumping of brackish water to depth that then rises to the surface (Aure et al., 2007), (iv) a perpetual salt fountain (Maruyama et al., 2004) and (v) the creation of an artificial sea mount (Jeong et al., 2013).
Empirical evidence on the effects of artificial upwelling is mostly limited to either small-scale lab experiments or model simulations. Some experimental studies have shown promising results though: McAndrew et al. (2007) conducted 25 L bottle incubation experiments in oligotrophic waters adding nutrient-rich deep water (DW) from 700 m depth. Following fertilization, the phytoplankton community shifted from a picoplankton-dominated net heterotrophic to a highly autotrophic community in the course of 5 days with up to 60-fold increases in gross PP and 13-fold increases in respiration. Giraud et al. (2016) found a community shift towards diatoms in oligotrophic waters after DW (1100 m depth) addition to 2.3 L incubators. And Casareto et al. (2017) reported increased PP and phytoplankton biomass after very mild natural upwelling in oligotrophic waters close to Japan. Previous mesocosm studies have included simulated upwelling among other manipulations (such as elevated CO2 concentration), but never focused exclusively on artificial upwelling effects (Riebesell et al., 2013b; Hernández-Hernández et al., 2018). Among the only field studies, Jeong et al. (2013) studied the effects on several trophic levels around an artificial seamount created to induce upwelling over 5 years. They found a 50- and 2.3-fold increase in standing stock of phyto- and zooplankton, respectively and a significant increase in both phytoplankton diversity and richness index. A first attempt at in situ implementation of artificial upwelling wave pumps in the open ocean was made by White et al. (2010), but had to be aborted due to technical problems with the pipes before sufficient data could be gathered. Masuda et al. (2010) succeeded in pumping up water from 205 m depths, leading to increases in phytoplankton growth, but only monitored the upwelling plume for approx. 3 days. Meanwhile Maruyama et al. (2011) reported strongly elevated surface layer Chla concentrations (but no further parameters) in the water body around their upwelling pump using the perpetual salt fountain technique.
All this points out the urgent need for more extensive in situ studies to assess the effects of artificial upwelling on natural communities. To expand our knowledge on the potential of artificial upwelling to increase ecosystem productivity, in this study we evaluated the response of the phytoplankton community of the Gran Canaria oligotrophic waters to different intensities and modes of artificial upwelling. The technical concept of the upwelling modes applied in this experiment (a single pulse of upwelled water vs recurring i.e., multiple upwelling events) roots in the design of potentially applicable pump types: stationary (moored) pumps would provide singular upwelling, as the fertilized water mass moves away with currents and winds; while free drifting pumps would provide recurring upwelling as they would move along with the water mass. Using large off-shore mesocosms we added different amounts of nutrient-rich deep-sea water to a natural community adapted to oligotrophic conditions. During 37 days, we examined the effects of artificial upwelling on PP, Chlorophyll a (Chla) and phytoplankton biomass (B) of micro-, nano- and picophytoplankton through a comprehensive set of size-fractionated 14C uptake measurements, fluorometry, flow cytometry and microscopy. Our aim was to understand how the phytoplankton community adapts to the treatments and how upwelling intensity and mode impact PP distribution among primary producers of different size classes. And whether the adaptations create the conditions needed to sustain a productive food web.
2 Materials and Methods
2.1 Experimental Setup
Nine KOSMOS (Kiel Offshore Mesocosms for Ocean Simulations; Riebesell et al., 2013a) units of 43.78 m3 each were set up in Gando Bay on the east coast of the island of Gran Canaria (27.9279°N, 15.3654°W) from November to December 2018. This location provided protection against common swells and winds. The mesocosm bags were deployed and left open for a seven-day period of open water exchange in order to enclose a homogeneous as possible natural phytoplankton community. To close the mesocosms the sediment traps were attached and the top ends of the bags were pulled above the water surface. A net (3 mm mesh size) was pulled from bottom to top right after closure to exclude unevenly distributed large organisms. Transparent plastic roofs were attached on top of the mesocosms to prevent contamination by precipitation and bird droppings. Total length of the mesocosm bags was 13 m plus an additional 2.7 m for the sediment trap, hereby enclosing a mean water volume of 43.78 m3.
The DW was pumped into a custom-built 100 m3 collector bag by means of an electric pump with the support of RRS James Cook (UK) and J Socas (ES). It was collected between 28°00’N, 15°18’E and 27°57’N, 15°10’E at 330 m depth. The water was then towed to the mesocosm site and stored in the same bag collector. Mesocosm water was removed evenly along the entire water column with the help of a pump-powered dispersion device before adding the DW through the same procedure (Riebesell et al., 2013a). For technical specifications about the pumping procedure see Taucher et al. (2017). It was calculated based on vertical nutrient distribution of the region (Perez et al., 2001; Schlitzer and Mieruch-Schnülle, 2021) that the nutrient-rich DW suitable for our experimental design should be at about 600 m depth (~25/~1.5/~10 µmol L-1 / /Si(OH)4). However, due to technical constraints the intended pumping depth could not be reached. Therefore, collected DW was spiked with additional inorganic nutrients (N, P & Si as sodium nitrate, disodium phosphate and sodium silicate) to adjust the concentrations and stoichiometry to that at the intended pumping depth. Deep water nutrient concentrations after amendment were 25 µmol L-1, 1.38 µmol L-1 and 12.1 µmol L-1 for , and Si(OH)4, respectively. Nutrient concentrations inside the collector bag were measured routinely and adjusted, when necessary, before each addition to the mesocosms. During the 39 days of the experiment, mesocosms were cleaned regularly on the inside with a large rubber ring pulled along the entire mesocosm length and outside by divers to remove biofouling. Potential stratification of the enclosed water column was monitored through CTD casts measuring temperature, salinity and pH, but no indications were found.
Integrated water column samples (0-13 m) for PP, Chla, phytoplankton abundances and inorganic nutrients were collected by means of depth-Integrated Water Samplers (IWS, Hydro-Bios, Kiel) every second day, starting from d1 (for details on all activities see Supplementary Figure 1). IWS are pre-set to the mesocosm length and evenly sample the entire column in one draft through constant automated water intake. The water samples were transferred to 10 L canisters, transported in the dark from the field to the laboratory on land and then sub-sampled for every parameter. Samples labeled “Atlantic” were taken from the water surrounding the mesocosm field.
2.2 Artificial Upwelling Treatments
The experimental treatments consisted of one control mesocosm (M5) and two groups of four mesocosms subjected to: i) a one-off (“singular”; M1, M3, M7, M9) DW addition on day four (d4) or ii) a total of eight DW additions every four days (“recurring”; M2, M4, M6, M8) from d4 onwards. With the exception of d20, where the recurring DW addition was delayed by one day (d21). Within each upwelling mode, a 4-step gradient in simulated upwelling intensity was established from “low” to “extreme” treatments. See Table 1 for the upwelling intensity corresponding to each mesocosm. This refers to the total amount of nutrients added through replacement of mesocosm water by DW. In accordance with upwelling intensity, respective singular and recurring upwelling treatments were intended to receive an equal total amount of DW, and therefore nutrients. I.e., low treatments should ideally receive the same total amount either at once (singular) or as a sum of all eight additions (recurring; Table 1). For the sake of simplicity “µmol of nutrients” henceforth refers to total added inorganic nitrogen (only ). For details on the methodology of nutrient concentration measurements see Ortiz et al. (2022).
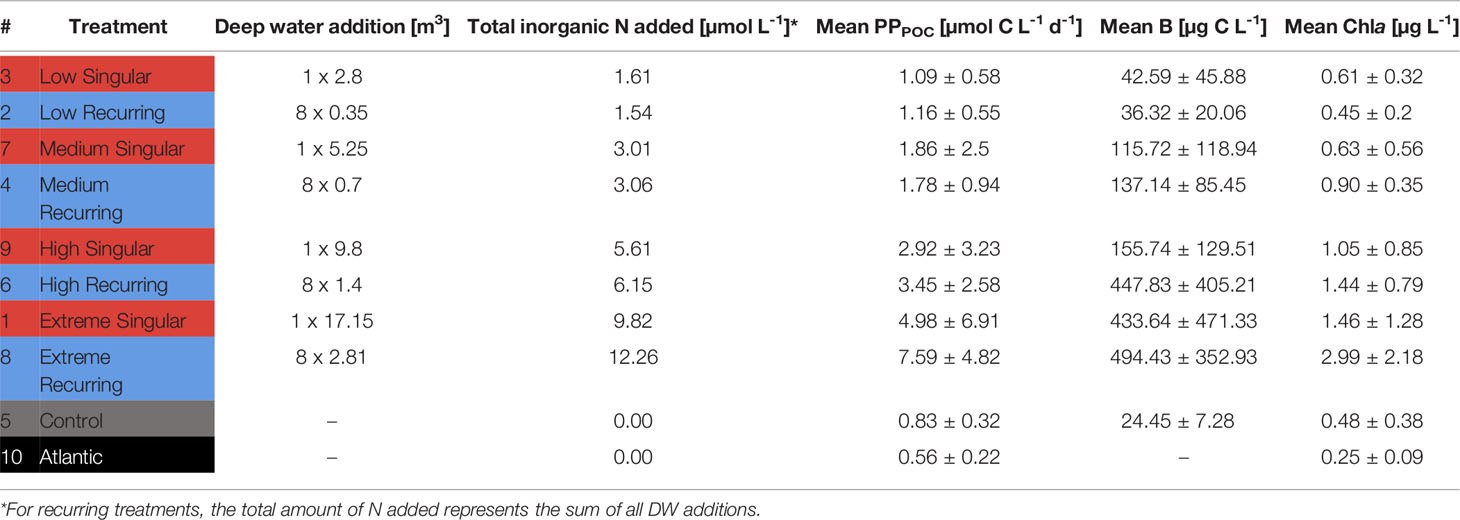
Table 1 Treatment overview, total inorganic nutrients added and mean values for particulate primary production (PPPOC), Biomass (B) and Chlorophyll a (Chla).
2.3 Primary Production
Primary production was measured using a modification of the method described by Cermeño et al. (2012) for size-fractionated 14C uptake. A 5 mL ampoule of 14C-labeled sodium bicarbonate [NaH14CO3] (Perkin Elmer, Waltham, USA) with a specific activity of 37 MBq mL-1 was diluted with 45 mL of Milli-Q water to obtain a stock solution with an activity of 3.7 MBq mL-1. Four culture flasks (Sarstedt TC Flask d15, Nümbrecht, Germany) per mesocosm were first filled to the bottleneck (70 mL) with water from the 10 L canisters. Samples were pre-filtered through a 250 µm mesh to preclude large organisms. 80 µl of 14C stock solution (i.e., 0.296 MBq) were added, the flask closed and then mixed gently. All bottles were incubated in a climate chamber (Pol-Eko KK350, Loslau, Poland) for 24 hours simulating mesocosm water temperature and light conditions of the area and season (12 h light-dark cycle with a mean daily light intensity of ~500 µmol photons m-2 s-1). Mesocosm light intensities as assessed by CTD casts ranged from roughly 1000-50 µmol photons m-2 s-1 between the surface and bottom of the enclosure. Three out of four flasks were incubated directly in the chamber (light triplicates) while the fourth was incubated inside a light-proof bag within the chamber to prevent photosynthesis (dark/control).
After incubation, all samples were sequentially filtered on a circular filtration manifold (Oceomic, Fuerteventura, Spain) under low vacuum pressure (<200 mbar) through superimposed polycarbonate membrane filters with pore sizes of 20 µm (PPmicro), 2 µm (PPnano) and 0.2 µm (PPpico)(DHI GVS 20 µm, Hørsholm, Denmark, Whatman Nuclepore 2 µm & 0.2 µm, Maidstone, UK). Filters were then placed into 5 mL scintillation vials (Sarstedt HD-PE Mini-vial, Nümbrecht, Germany) and left in a desiccator with fuming hydrochloric acid (HCl 37%) for 24 hours. For quantification of dissolved organic carbon production (PPDOC) 5 mL of the filtrate (i.e., <0.2 µm) were placed in 20 mL scintillation vials (Sarstedt HD-PE Scintillation vial, Nümbrecht, Germany), acidified with 100 µL of hydrochloric acid (HCl, 37%) and placed on an orbital oscillator for 24 hours at 60 rpm. Acidifying of all samples was done to remove any remaining inorganic 14C. On the following day, 10 mL of scintillation cocktail (Ultima Gold XR, Perkin Elmer, Waltham, USA) were added to all liquid samples. Filters were pushed into the vials taking care not to touch the side with the retained material and 3.5 mL of scintillation cocktail were added. All samples were shaken vigorously and left in darkness overnight before being measured on the scintillation counter (Beckman LS-6500, Brea, USA). To obtain primary production rates [µg C L-1 h-1] from the counted disintegrations per minute the following equation was used:
VS = sample volume [L]; VF = filtered volume [L]; DPMS = sample disintegrations per minute; DPMD = dark/control disintegrations per minute; DIC = dissolved inorganic carbon [µg C L-1]; DPMA = added 14C in disintegrations per minute; ti = incubation time [h]
The final PP rate was calculated from the mean of the triplicates. To detect outliers, a deviation coefficient consisting of the percentage deviation of each triplicate from the standard deviation (SD) of the sample was calculated and the cutoff set at 20%. Each triplicate was checked for values that increased the cutoff to >20% and these were excluded as outliers. All resulting values were transformed to molar units before further analysis (µmol C = µg C·12.01 µg µmol-1). Total particulate organic carbon production (PPPOC) was calculated from the sum of all three size fractions. To estimate cumulated PP (PPcum) over the course of the experiment PPPOC of all days was added together for each mesocosm. Production on non-sampling days was calculated as the mean PPPOC of the day before and after (e.g., PP for d10 was the mean of PPPOC from d9 & d11). Percentage of Extracellular Release (PER) was calculated through [PPDOC/(PPPOC + PPDOC)] * 100. If a sample was lost, an estimate of the PP rate was calculated through the mean PP rate of the sampling day before and after (only the case on d13 for PPmicro samples of the control, medium & high singular and high & extreme recurring).
Dissolved Inorganic Carbon (DIC) samples were taken from a separate IWS and directly subsampled with special precaution to avoid contamination (bubble-free, generous overflowing of the bottle and no headspace). Samples were sterile filtered (0.2 µm pore size) under low pressure with a peristaltic pump and poisoned with HgCl2 before storing them until analysis. Measurements were carried out through infrared absorption on an AIRICA system (Marianda, Kiel, Germany) with a LI-COR LI-7000.
2.4 Phytoplankton Abundances and Biomass
Picophytoplankton (0.2-2 µm) and nanophytoplankton (2-20 µm) cells were counted using a FACScalibur (Becton and Dickinson, USA) flow cytometer. Duplicate samples were collected in sterile cryovials (2 mL and 5 mL for pico- and nanoplankton, respectively), immediately fixed with paraformaldehyde (2% final concentration), refrigerated at 4°C for half an hour, and quickly frozen in liquid nitrogen (-196°C). Until their analysis, samples were stored at -80°C. For picoplankton, a yellow-green 1µm latex bead (Polysciences Inc., Warrington, USA) suspension (~105 beads mL-1) was added to every sample as an internal standard before being run at an average flowrate of 66.4 ± 2.6 µL·m-1 during 150 seconds. Red latex beads of 2 µm diameter (~105 beads mL-1, Polysciences Inc.) were used as internal standard in nanoplankton samples, which were run at 165.1 ± 3.0 µL·m-1 during 300 seconds. Picoplankton (Prochlorococcus, Synechococcus and picoeukaryotes) and nanoplankton groups were identified by their signatures in side scatter (SSC) versus red (FL3) and orange (FL2) fluorescence bivariate plots.
In order to estimate pico- and nanoplankton cell-sizes, the flow cytometer was calibrated with nonfluorescent latex beads of 1, 2, 4, 6, 10 and 15 µm diameter (Molecular Probes). SSC’s from calibration beads were normalized to the SSC measured for the fluorescent standard beads added to every sample (1 and 2 µm for pico- and nanoplankton settings, respectively). Linear regression between bead diameters and normalized SSC were conducted for picoplankton (ø = 9.914 log (SSC) - 0.219; R2 = 0.92) and nanoplankton settings (ø = 4.753 log (SSC) + 0.008; R2 = 0.93). Cell diameters (µm) were inferred from relative SSC for every group and then used to calculate cell biovolume (µm3) assuming a spherical shape. Cell carbon content was estimated using conversion factors obtained from phytoplankton of the Canary waters by Maria F. Montero (unpublished data): 230 fg C µm-3 for Synechococcus; 237 fg C µm-3 for picoeukaryotes; and 220 fg C µm-3 for nanoeukaryotes.
Microphytoplankton (20-250 µm cell size) biovolume and biomass (B) were calculated based on microscopy counts of diatoms (Utermöhl, 1931; on a Zeiss Axiovert 100, Carl Zeiss, Germany).
On-site size measurements were performed on all identified diatom species and used to calculate species-specific biovolumes (V) following Hillebrand et al. (1999) and Olenina et al. (2006). Biovolumes were then converted to B using the conversion factor from Menden-Deuer and Lessard (2000) (C [pg Cell-1] = 0.288 V0.811). Almost all diatom species identified were >20 µm in size, so that we assume no relevant number of organisms <20 µm were falsely categorized as microphytoplankton. Dinoflagellates in this size range were quantified as well, with almost all genera being potentially mixotrophic, heterotrophic or inaccurately categorized (Ortiz et al., 2022). Because the 14C uptake method only measures photosynthetic PP however, dinoflagellates were excluded for better comparability of both datasets.
2.5 Chlorophyll a
500 mL subsamples were collected in dark bottles for Chla concentration measurements and sequentially filtered through superimposed Polycarbonate filters of 20 µm, 2 µm and 0.2 µm ø pore size (DHI GVS 20 µm, Hørsholm, Denmark, Whatman Nuclepore 2 µm and 0.2 µm, Maidstone, UK) to obtain Chla concentrations for micro-, nano-, and picophytoplankton, respectively. Filters were then frozen at -20°C until analysis. For pigment extraction the filters were left submerged in 10 ml of acetone (90%) for 24 hours and at 4°C. The extract was subsequently analyzed on a fluorometer (Turner Design AU-10, San Jose, USA) according to Welschmeyer (1994). The sum of all size fractions was taken as total Chla.
2.6 Data Analysis
Simple linear regressions were performed on PPcum and mean PER per unit of nutrients (Figures 1B, 2A) to examine the relationship between upwelling intensity and PP, and to check for differences between both upwelling modes. The control treatment was used twice in the linear regression model analysis of singular and recurring treatments. Statistical comparison of the regression lines of both upwelling modes required the control to be removed, since using the same control for both groups would create a paired data-point in otherwise unpaired data. Data analysis was performed with R (Version 4.0.3, packages stats, ggplot2; The R Foundation, Wickham, 2016). Assumptions of normality and homoscedasticity were tested using q-q and residual versus fitted variable plots.
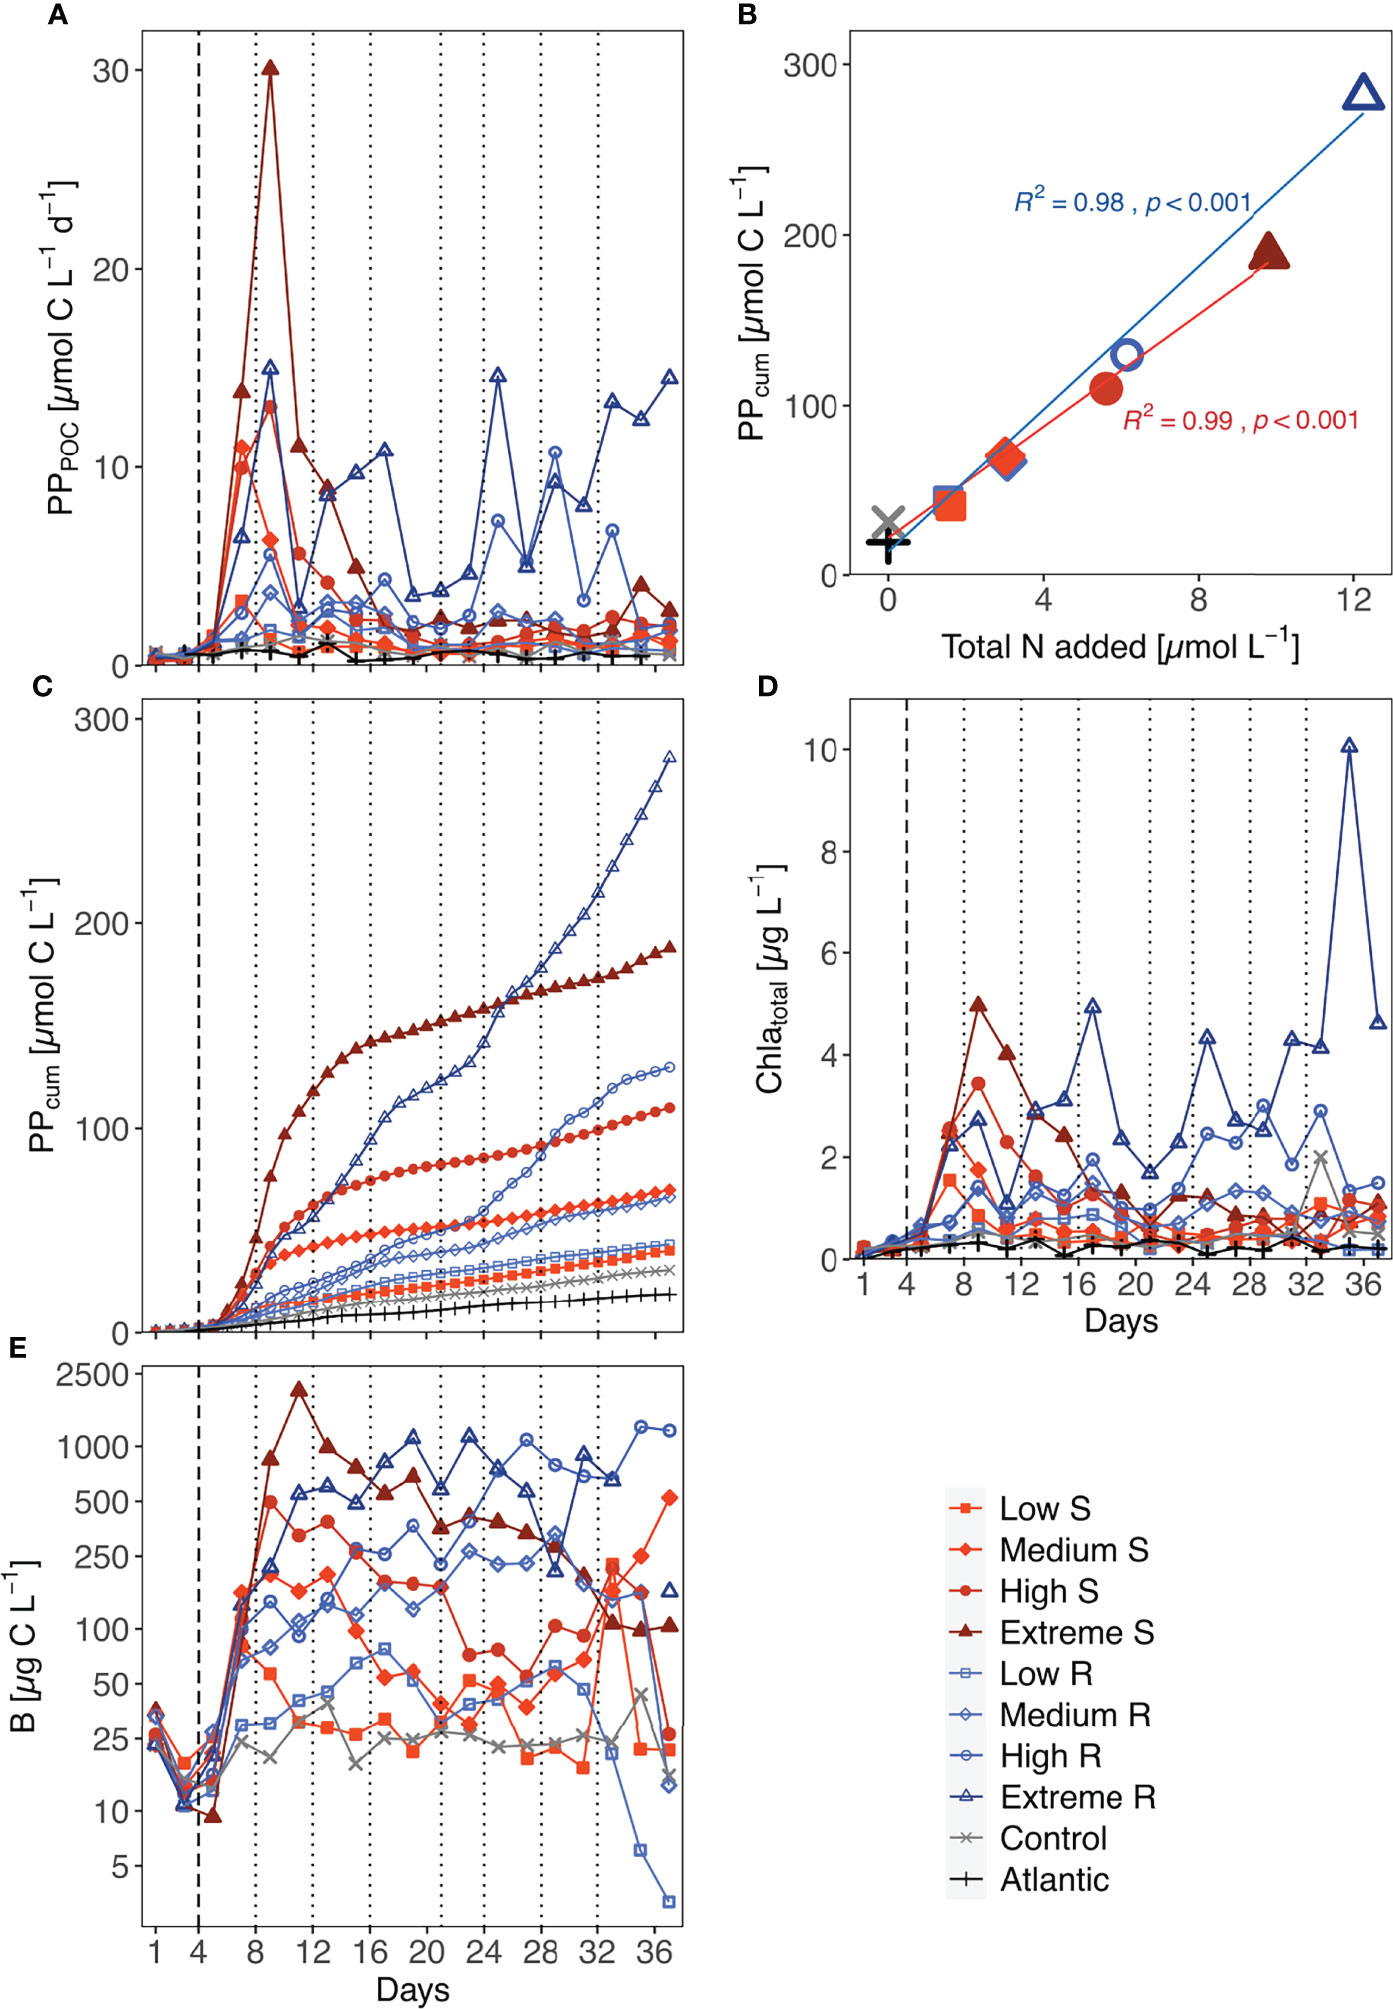
Figure 1 Temporal development of (A) total primary production (PPPOC), (C) accumulated primary production (PPcum, even day data points calculated as described in 2.3), (D) total Chla concentration and (E) total phytoplankton biomass (mind the logarithmic y-axis scale). Biomass values of the Atlantic were not measured. S, Singular; R, Recurring. (B) shows the accumulated organic carbon production per µmol of nutrients added at the end of the experiment. Linear regression shown for singular (n = 5) and recurring (n = 5) treatments; Difference between both upwelling modes as a whole was significant (p=0.029). Dotted lines represent DW additions, dashed line marks the single DW addition to singular treatments.
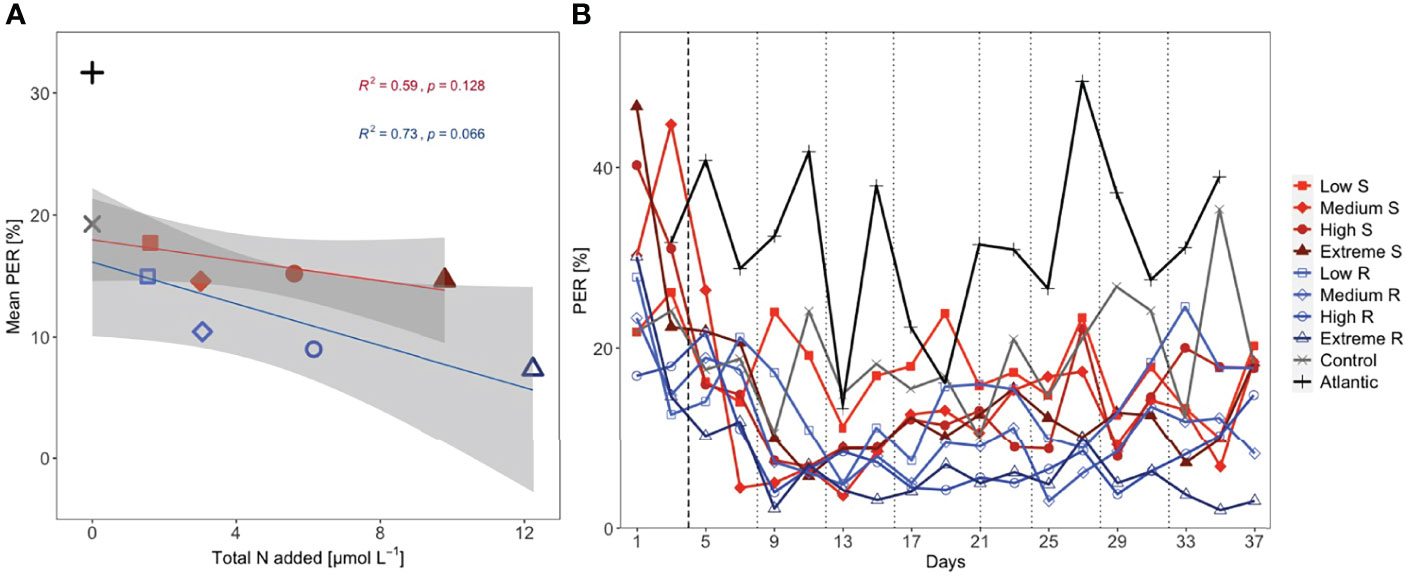
Figure 2 (A) Mean percentage extracellular release (PER) per total amount of added nutrients (shaded area: 95% CI) and (B) temporal development of PER. Linear regression analysis shown for Singular (S; n = 5) and Recurring (R; n = 5) treatments. Dotted lines represent DW additions, dashed line marks the single DW addition to singular treatments.
Due to the strong variability encountered among carbon to Chla ratios (C:Chla) compared to values reported in the literature by e.g., Sathyendranath et al. (2009); Wang et al. (2009) and Jakobsen and Markager (2016), this dataset was additionally checked for outliers using the “outlier_check” function of the performance package in R on each mesocosm (Lüdecke et al., 2021). This function runs a set of 14 outlier detection methods and creates a composite score, based on which it classifies a data point as an outlier. Identified outliers were excluded from Figure 5. Carbon assimilation numbers (µg C µg Chla-1 h-1) were based on hourly PP rates of the entire incubation period (24h).
3 Results
3.1 Temporal Development of PP, Chla, B and Nutrients
Total PP rates increased between 6.5- and 53-fold in all singular treatments after DW addition and reached their maximum rate either three (low & medium) or five (high & extreme) days after it (Figure 1A). Afterwards, PP rates decreased in all singular treatments to <4.5 µmol C L-1 d-1, which was still above pre-treatment levels (<0.8 µmol C L-1 d-1). Recurring low and medium treatments did not surpass rates of ~3.7 µmol C L-1 d-1 throughout the experiment (Figure 1A). The most variable progression was displayed by the extreme recurring treatment. A pronounced peak with a 38-fold increase in PP on d9 was followed by an immediate drop before steadily increasing until d17. Considering the amount of nutrients added to this treatment in the first addition (1.53 µmol N L-1 e.g., comparable to the single addition to low singular), this peak was disproportionately high. Afterwards, extreme recurring PP rates steadily increased until the end of the experiment. Control and Atlantic maintained overall low PP rates (maxima of 1.47 and 1.14 µmol C L-1 d-1, respectively).
All treatments showed an increased PPcum compared to the untreated control and the Atlantic. But there was a visible difference in the pattern of increase between upwelling modes: singular upwelling led to a strong PPcum increase after DW addition which then flattened quickly between d11 and d15, while recurring upwelling led to a more stable and steady increase in PPcum until the end of the experiment (Figure 1C). Within the low, medium and high upwelling intensities upwelling mode did not lead to large absolute differences in PPcum. Extreme treatments showed by far the highest PPcum, with extreme recurring outperforming singular by a factor of 1.47. Normalized to the amount of nutrients added, the extreme recurring treatment still led to 20% higher PPcum.
An overview on the amount of organic carbon produced (based on PPcum) in each treatment per unit of nutrients added throughout the experiment is shown in Figure 1B. Total nutrient supply and cumulative PP were significantly correlated in both treatment groups (R2 = 0.98/0.99 and p < 0.001 for both upwelling modes). The statistical comparison of both groups with each other confirmed that the recurring treatments reached significantly higher PPcum per µmol of nutrients than the singular treatments (p = 0.029).
The development of total Chla concentrations exhibited similar trends to those of PPPOC (Figure 1D): Singular treatments showed initial peaks corresponding to upwelling intensity after the DW addition (i.e., low & medium peaked on d7, high & extreme on d9), while recurring treatments differed more in their development. Responses in Chla concentration to the first addition ranged from a roughly 1.3-fold increase in low recurring up to a 28-fold increase in extreme singular. Further DW additions also mostly led to immediate increases in Chla concentrations on the following day. Unexpectedly, Chla concentration decreased in the high recurring after the last DW addition, while it peaked at 10.1 µg L-1 in the extreme recurring on d35 before decreasing.
Overall, phytoplankton biomass (B) decreased between closure of the mesocosms and treatment onset. After treatment onset, singular treatment B rose in accordance with upwelling intensity, reaching peak values between 80.26 µg C L-1 in the low and 2013.18 µg C L-1 in the extreme treatment, before shifting into a steady decrease until the end of the experiment (Figure 1E). An exception was the medium singular, where B increased during d27-d37. Recurring treatments on the other hand displayed a steady increase in B throughout the treatment period. After the last addition, B in the low and medium recurring treatment decreased substantially, while the high and extreme maintained high B concentrations or even increased until the end in the former.
Singular treatments displayed mean PER values close to the control (14.6-17.7%) and were negatively correlated with increasing upwelling intensity (Figure 2A). This pattern was more pronounced in the recurring treatments, with mean PER being highest in the low (15.0%) and lowest in the extreme recurring (7.4%). Mean PER in the control was reduced compared to the Atlantic, amounting to 19.3% and 31.7%, respectively. There was a fairly good correlation between mean PER and nutrient input (R2 = 0.59 for singular and R2 = 0.73 for recurring) although p-values were not significant. The temporal development of PER conveys the same message, with the singular treatments mostly maintaining values above the respective recurring (Figure 2B).
Nutrient concentrations peaked in all treatments according to the amounts of DW introduced after the first addition (Figure 3). Despite the high nutrient load of the DW (25 µmol L-1 , 1.38 µmol L-1 and 12.1 µmol L-1 Si(OH)4), all nutrients were entirely consumed within five days (by d9) in the singular treatments, while recurring treatments exhausted most nutrients within two days after each addition. Silicate was no longer fully taken up after d27 in the extreme recurring, and ammonium displayed some variability around very low concentrations in most treatments throughout the experiment.
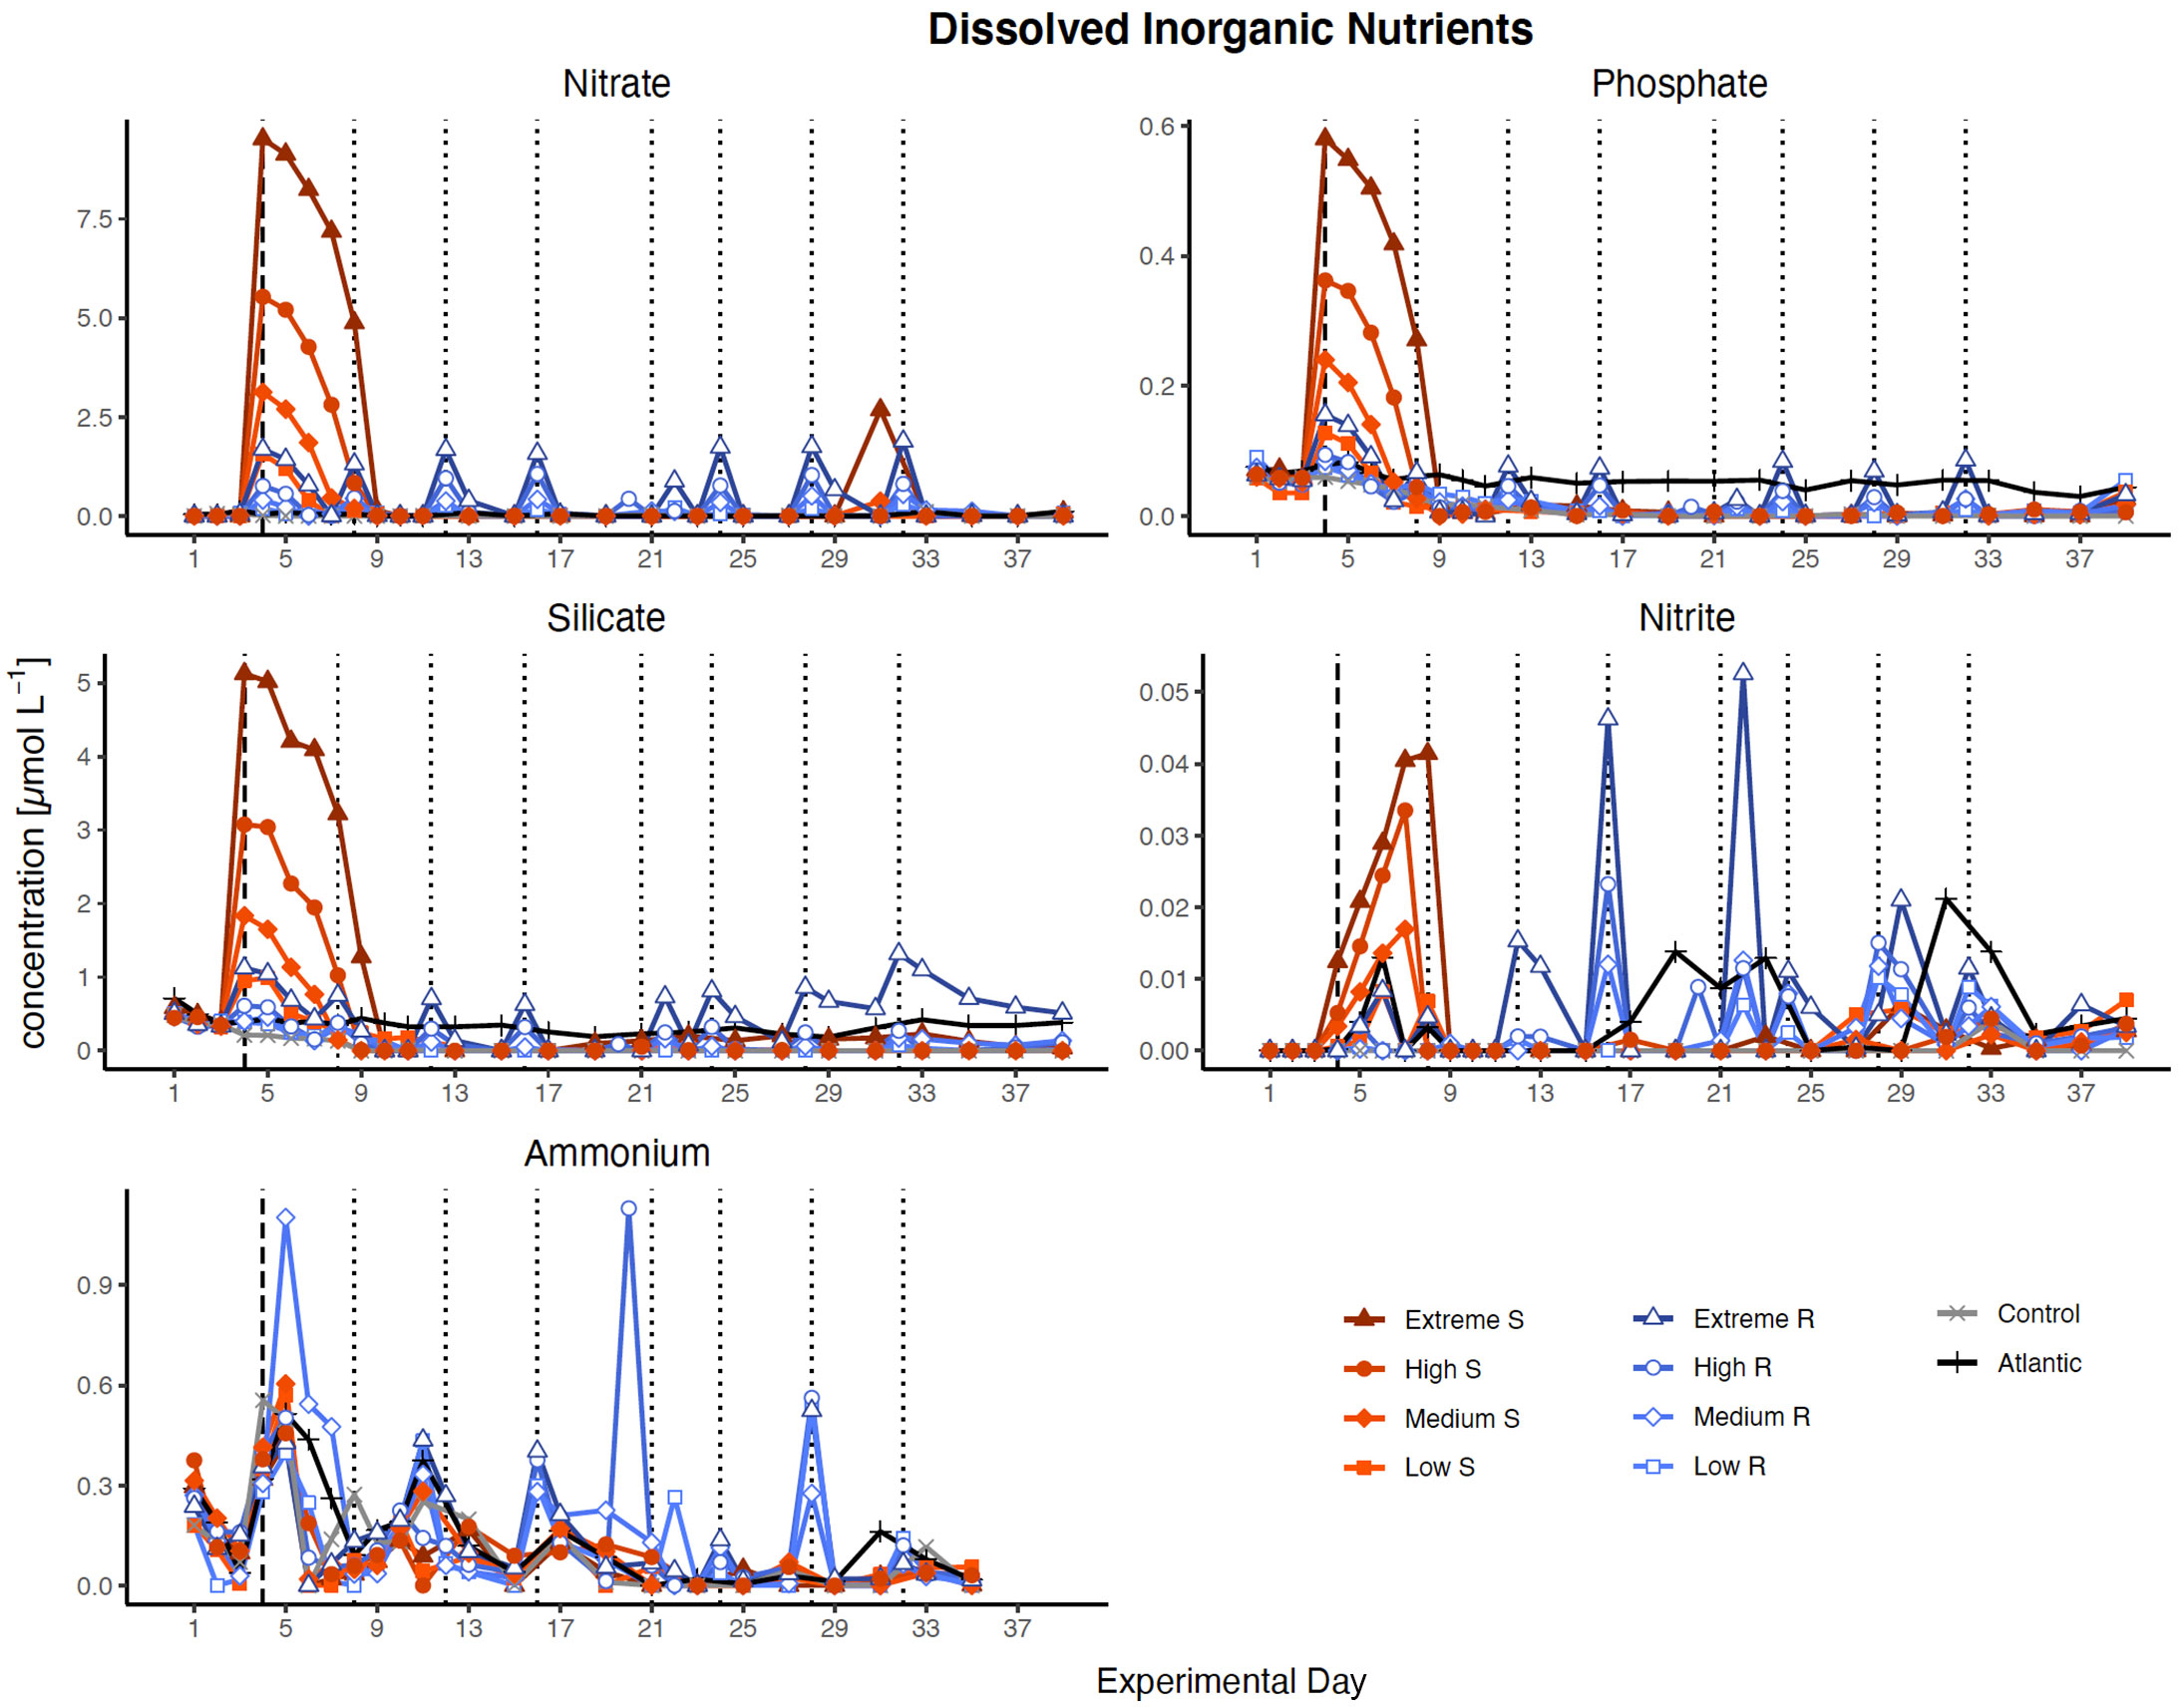
Figure 3 Inorganic nutrient concentration over the course of the study. Dotted lines represent DW additions, dashed line marks the single DW addition to singular treatments. S, singular, R, recurring treatment. Atlantic refers to samples taken from the water surrounding the mesocosm field.
3.2 Size Class Contributions to PP, Chla and B
The initial peaks in PP and Chla in the singular treatments (Figure 4, red labels) were increasingly dominated by microphytoplankton with rising upwelling intensity. Overall, the main contribution to PP and Chla came from microphytoplankton, followed towards the end by nanophytoplankton. However, B was composed almost exclusively of microphytoplankton even at the end of the experiment. A shift from micro- to nanophytoplankton as main contributor to B occurred in the low, medium and high singular treatments during the last five days.
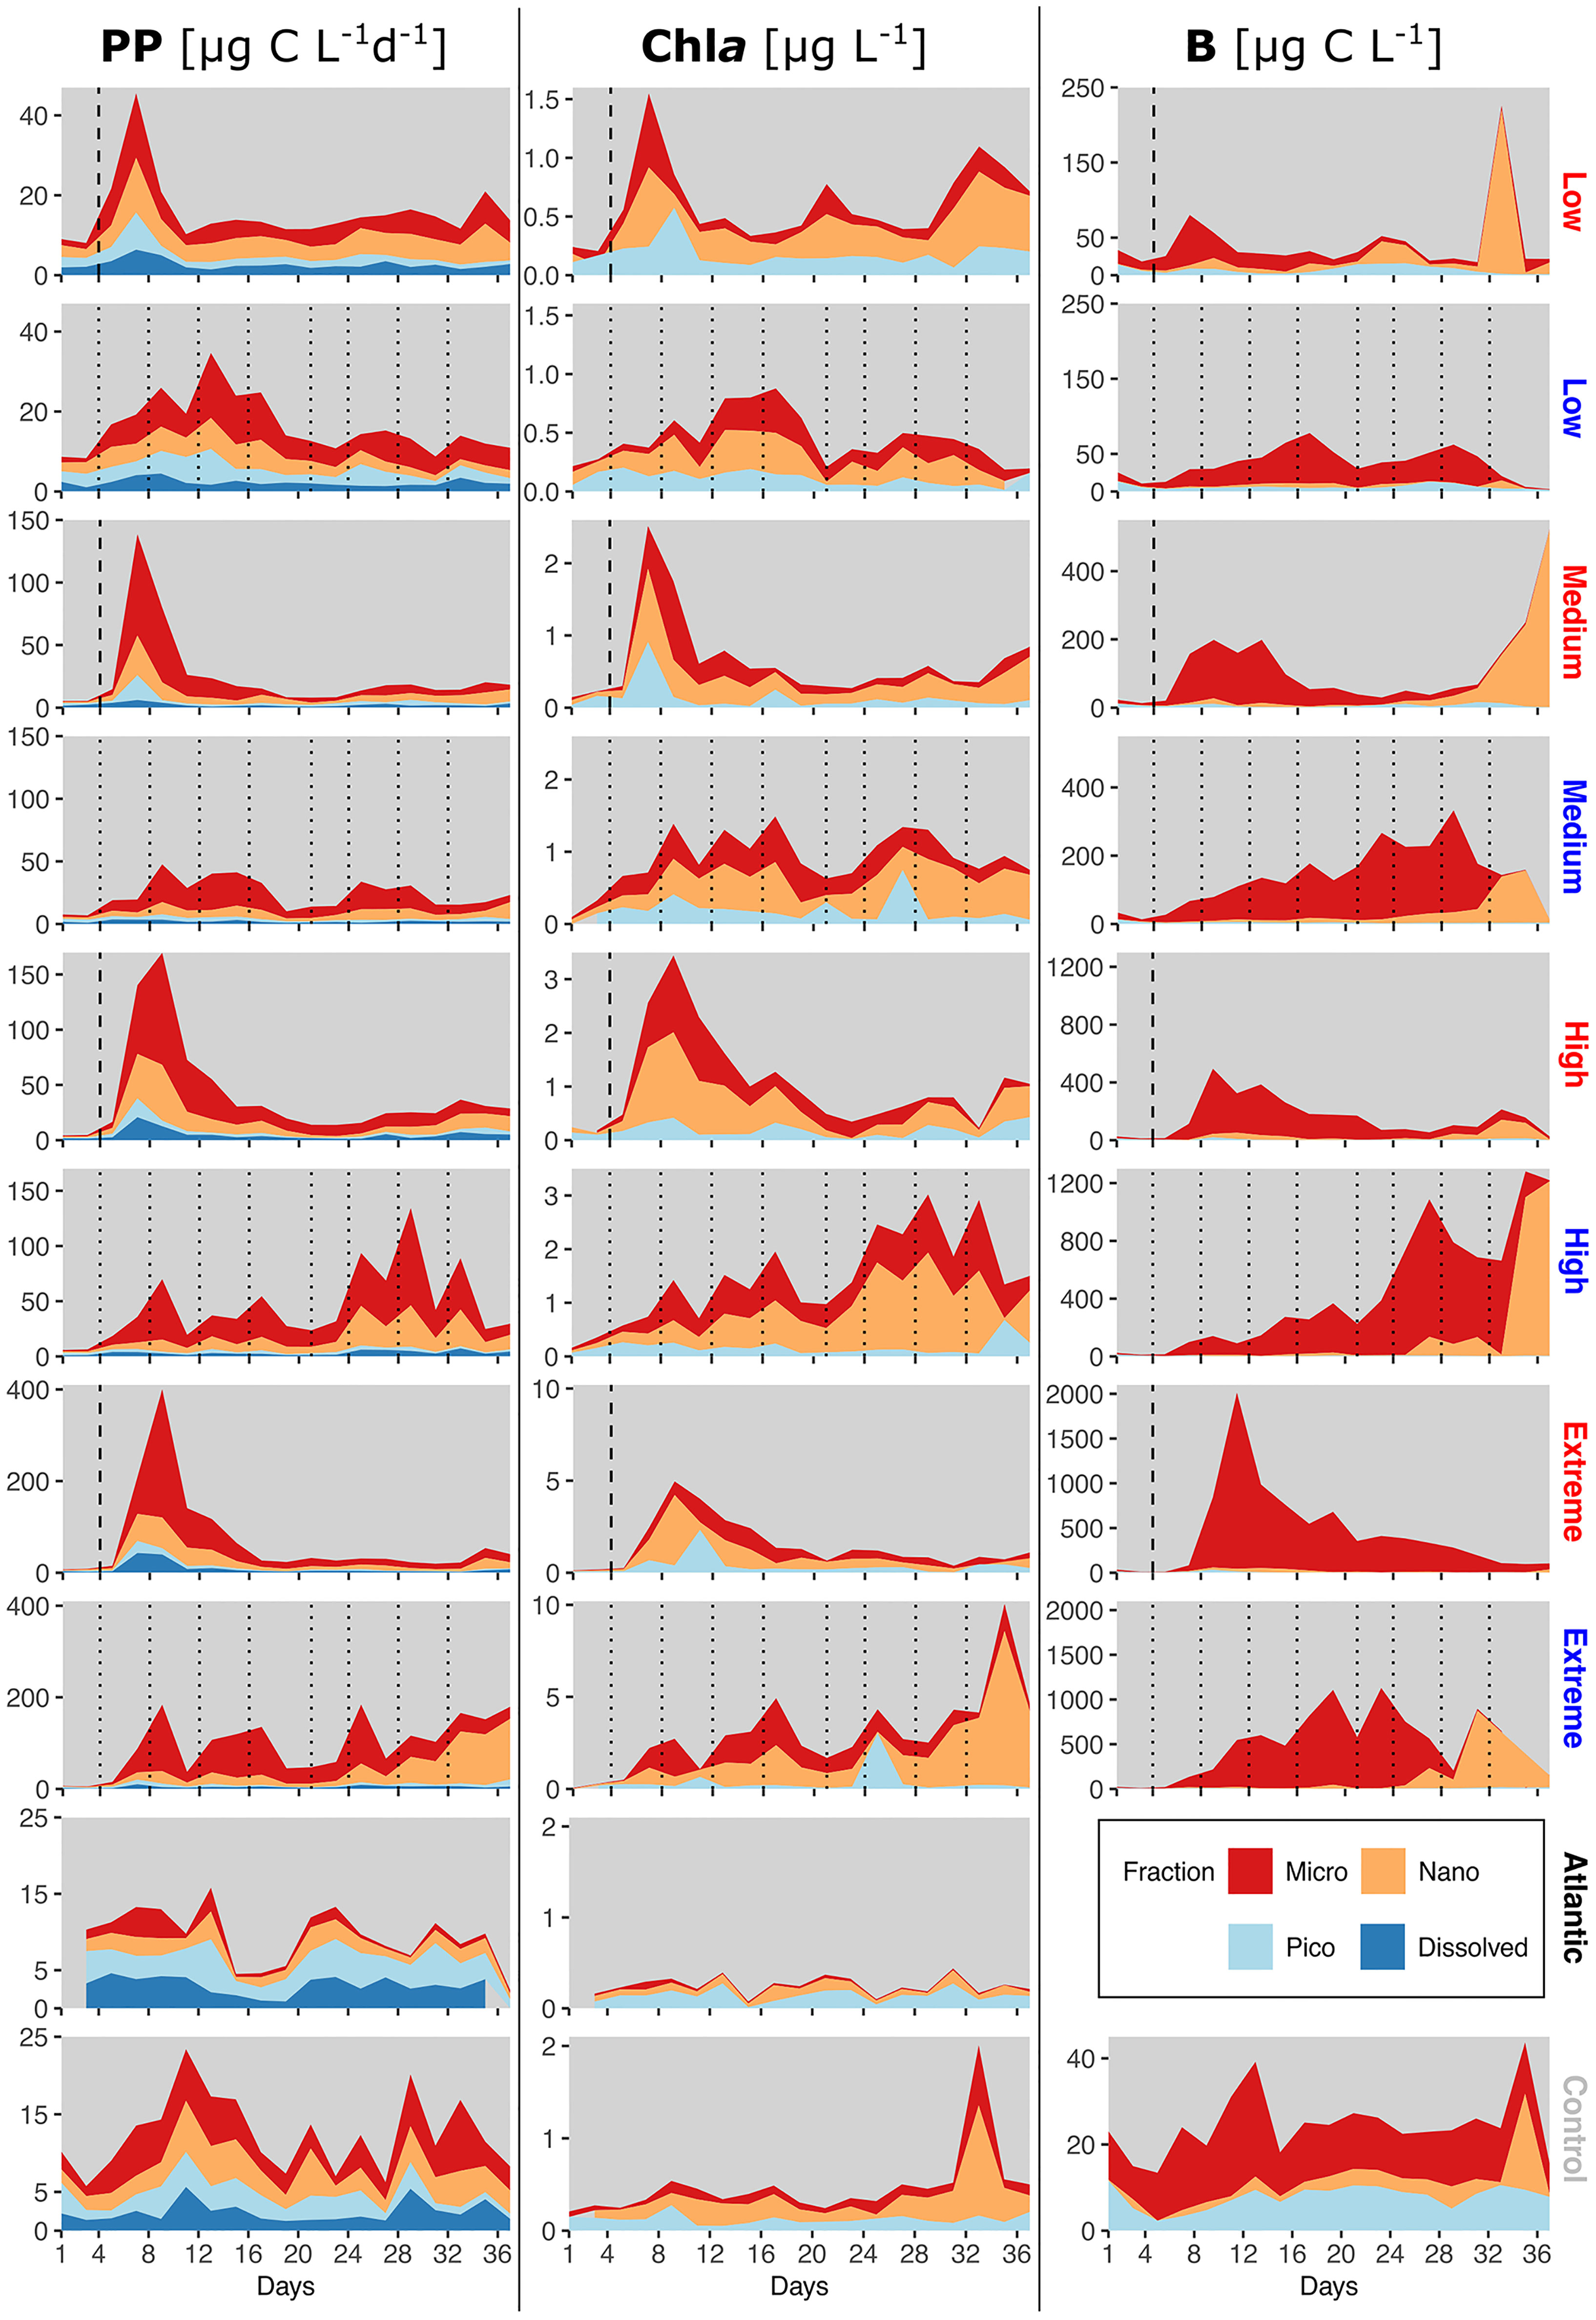
Figure 4 Relative size class contributions of micro-, nano- and picoplankton to total PP rates, Chla concentration and phytoplankton C. PP plots also include PPDOC rates. Mind the different y-axis scales. The blank spot in the Atlantic between d35-37 is due to one missing data point. Dotted lines represent DW additions, dashed line marks the single DW addition to singular treatments. Recurring treatments labelled in blue, singular in red.
The recurring treatments (Figure 4, blue labels) displayed a shift away from a more even distribution among all sizes before treatment onset towards a strong dominance of microphytoplankton in PP. Contribution to Chla in the medium, high and extreme recurring treatments came almost exclusively from micro- and nanophytoplankton throughout most of the experiment. Picophytoplankton B was wholly negligible, whereas nanophytoplankton B increased exceptionally in all recurring treatments except low from d33-d35 on, similar to the aforementioned shift in the low, medium and high singular treatment. Simultaneously, microphytoplankton B plummeted during these days until the end of the experiment.
Across all treatments PPDOC did not increase as a consequence of artificial upwelling (Figure 4 left column). Under singular upwelling, PPDOC increased slightly after the addition, but then receded to pre-treatment levels.
The control and Atlantic (Figure 4, bottom plots) displayed mixed size class contributions in all parameters, but with generally higher presence of picophytoplankton, as well as higher DOC contributions to PP than in all the treatments.
3.3 Carbon to Chlorophyll Ratios and Assimilation Numbers
The temporal development of total C:Chla ratios was characterized by strong oscillations, ranging from 1 up to 1708 (Figure 5). Looking at the different size fractions it becomes evident that most of the variability was driven by the temporal B changes described in 3.2 and hence by microphytoplankton overall and nanophytoplankton towards the end. Picophytoplankton C:Chla ratios mostly stayed below 150 in the singular and below 100 in the recurring treatments. An impact of upwelling intensity on C:Chla ratios was only recognizable in the singular treatments, where increasing upwelling intensity led to higher values in the total and microphytoplankton fraction.
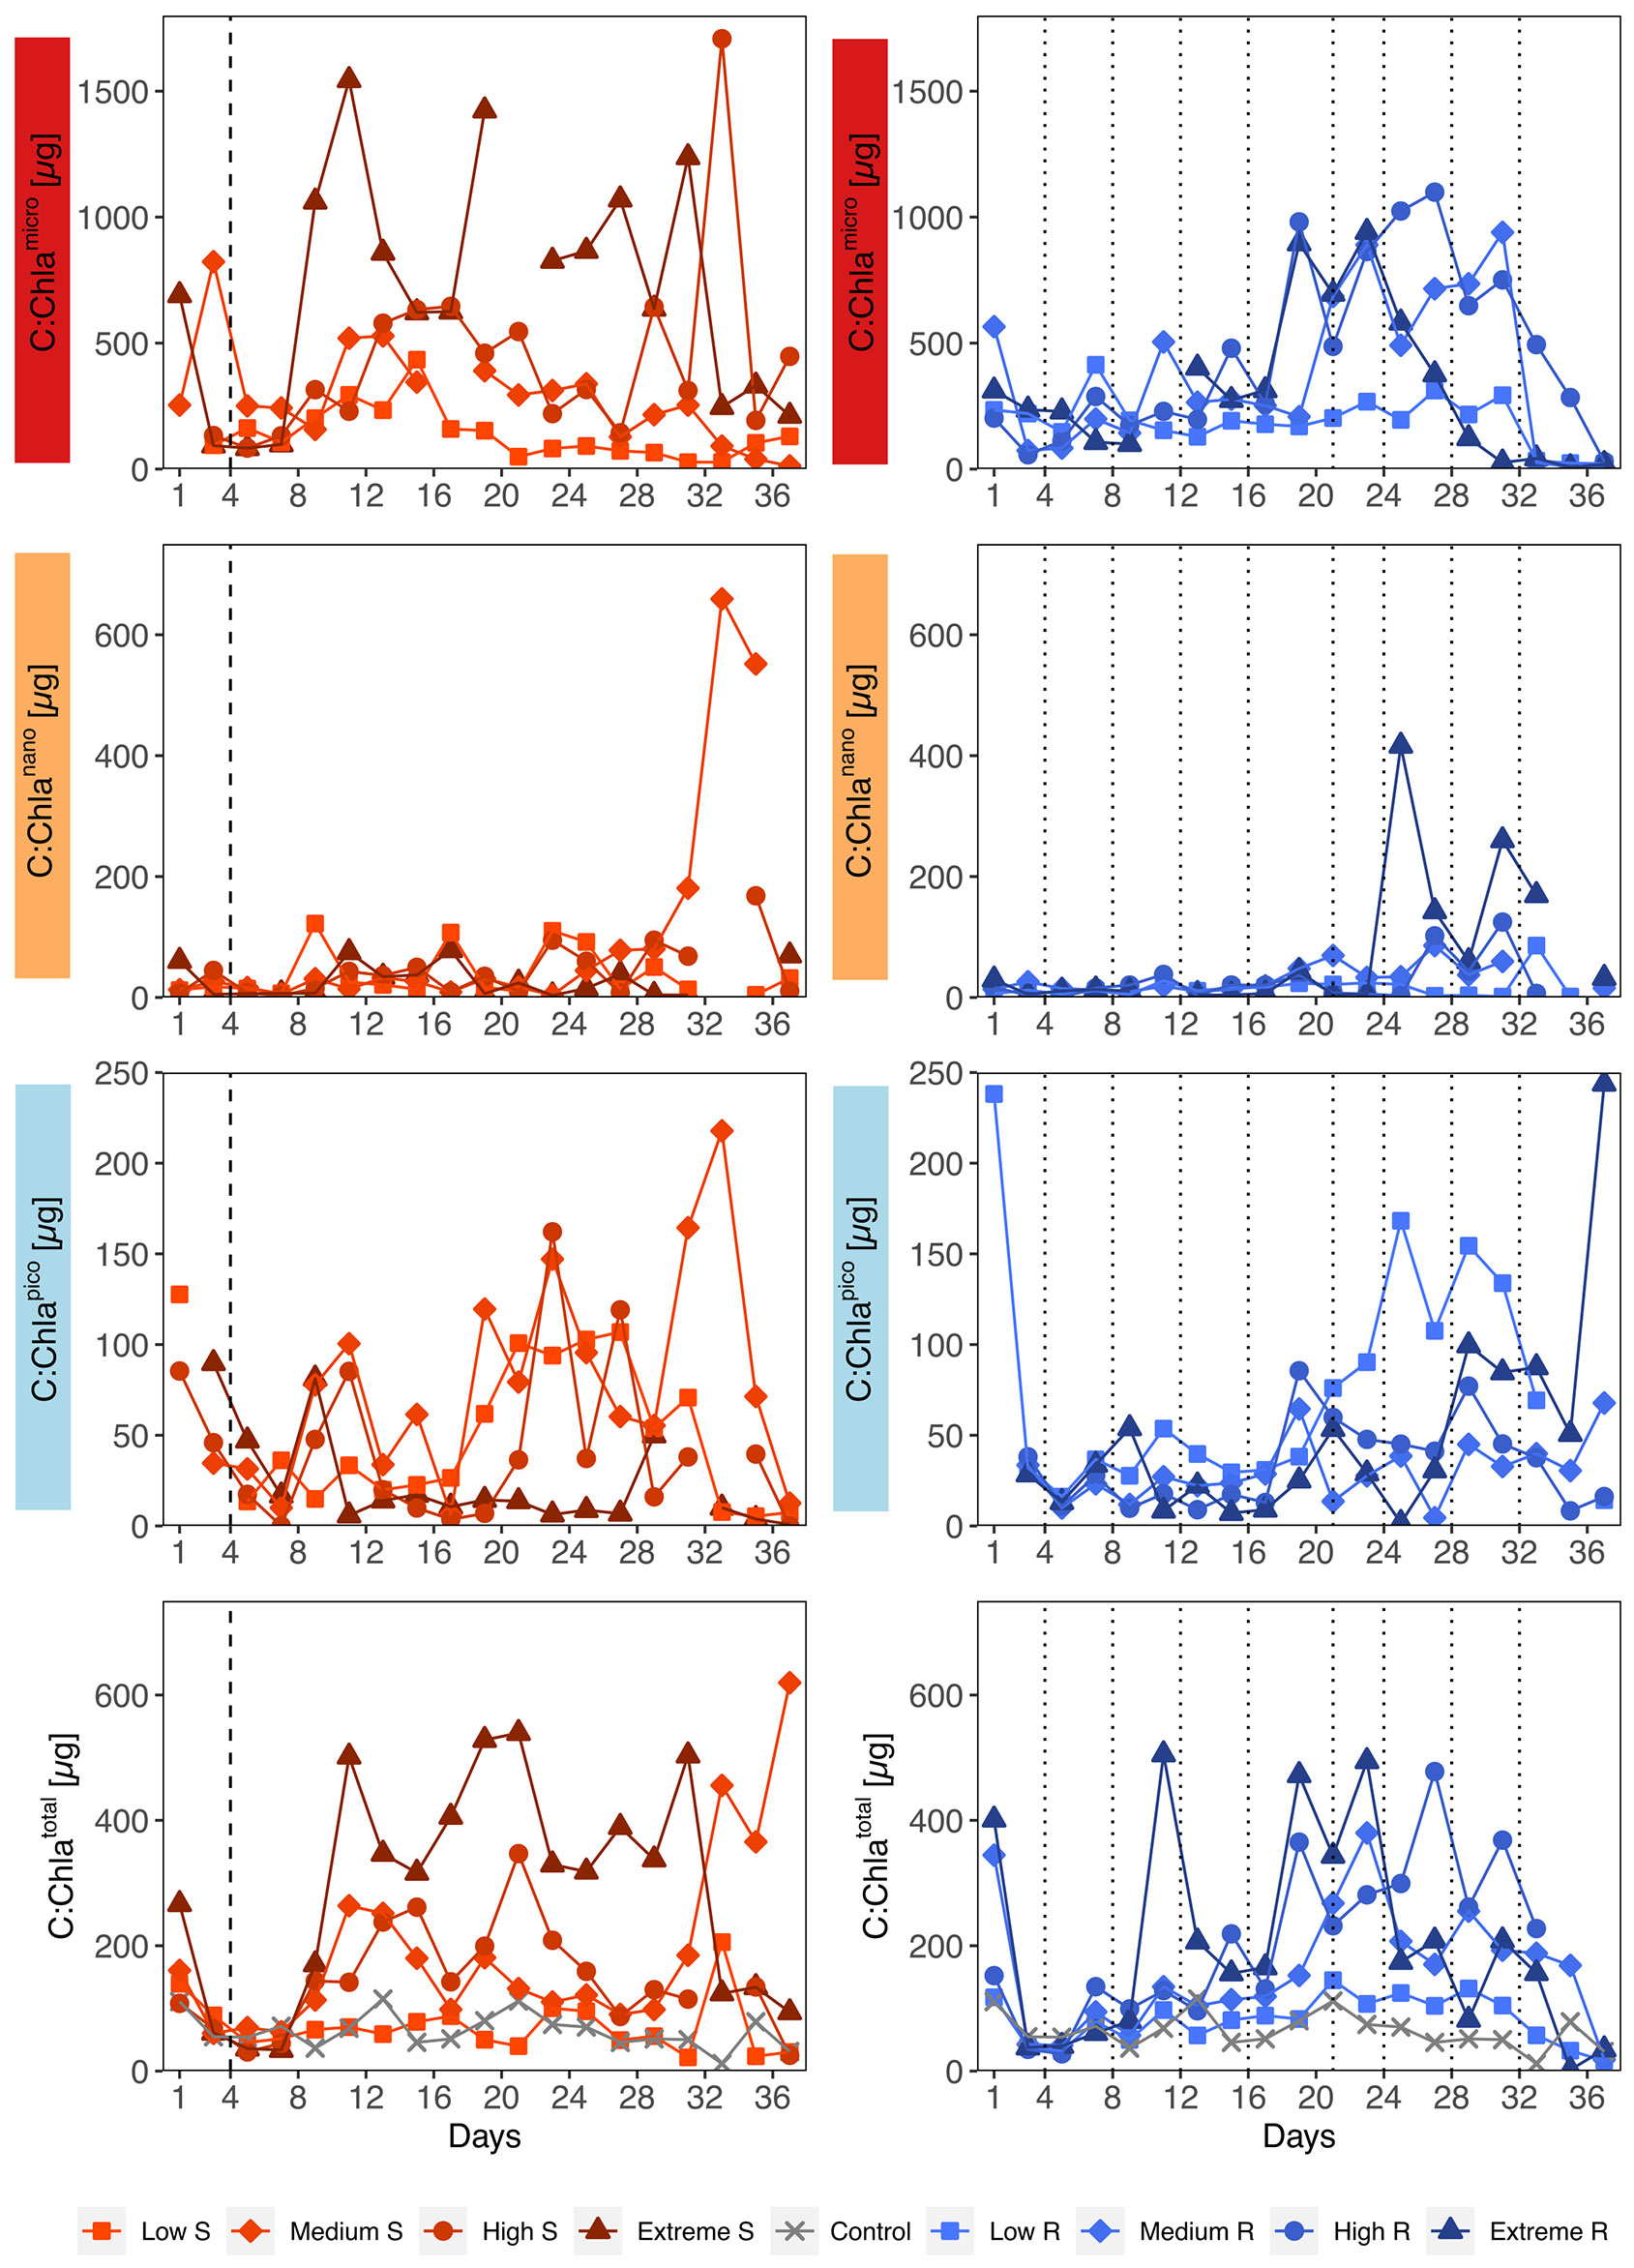
Figure 5 Temporal development of carbon to chlorophyll ratios (C:Chla) separated by size fractions and upwelling mode. S, Singular; R, Recurring. Mind the different y-axis scales. Dotted lines represent DW additions, dashed line marks the single DW addition to singular treatments.
Assimilation numbers (as the rate of carbon produced per unit Chla) were not strongly affected by upwelling intensity nor upwelling mode though variability increased with upwelling intensity among microphytoplankton in the singular treatments. (Figure 6; Supplementary Figure S2). Mean AN of pico- and nanophytoplankton ranged from 0.59 ± 0.35 - 1.87 ± 1.89 µg C µg Chla-1 h-1, while those of microphytoplankton reached values of 1.87 ± 0.82 - 2.98 ± 2.83 µg C µg Chla-1 h-1.
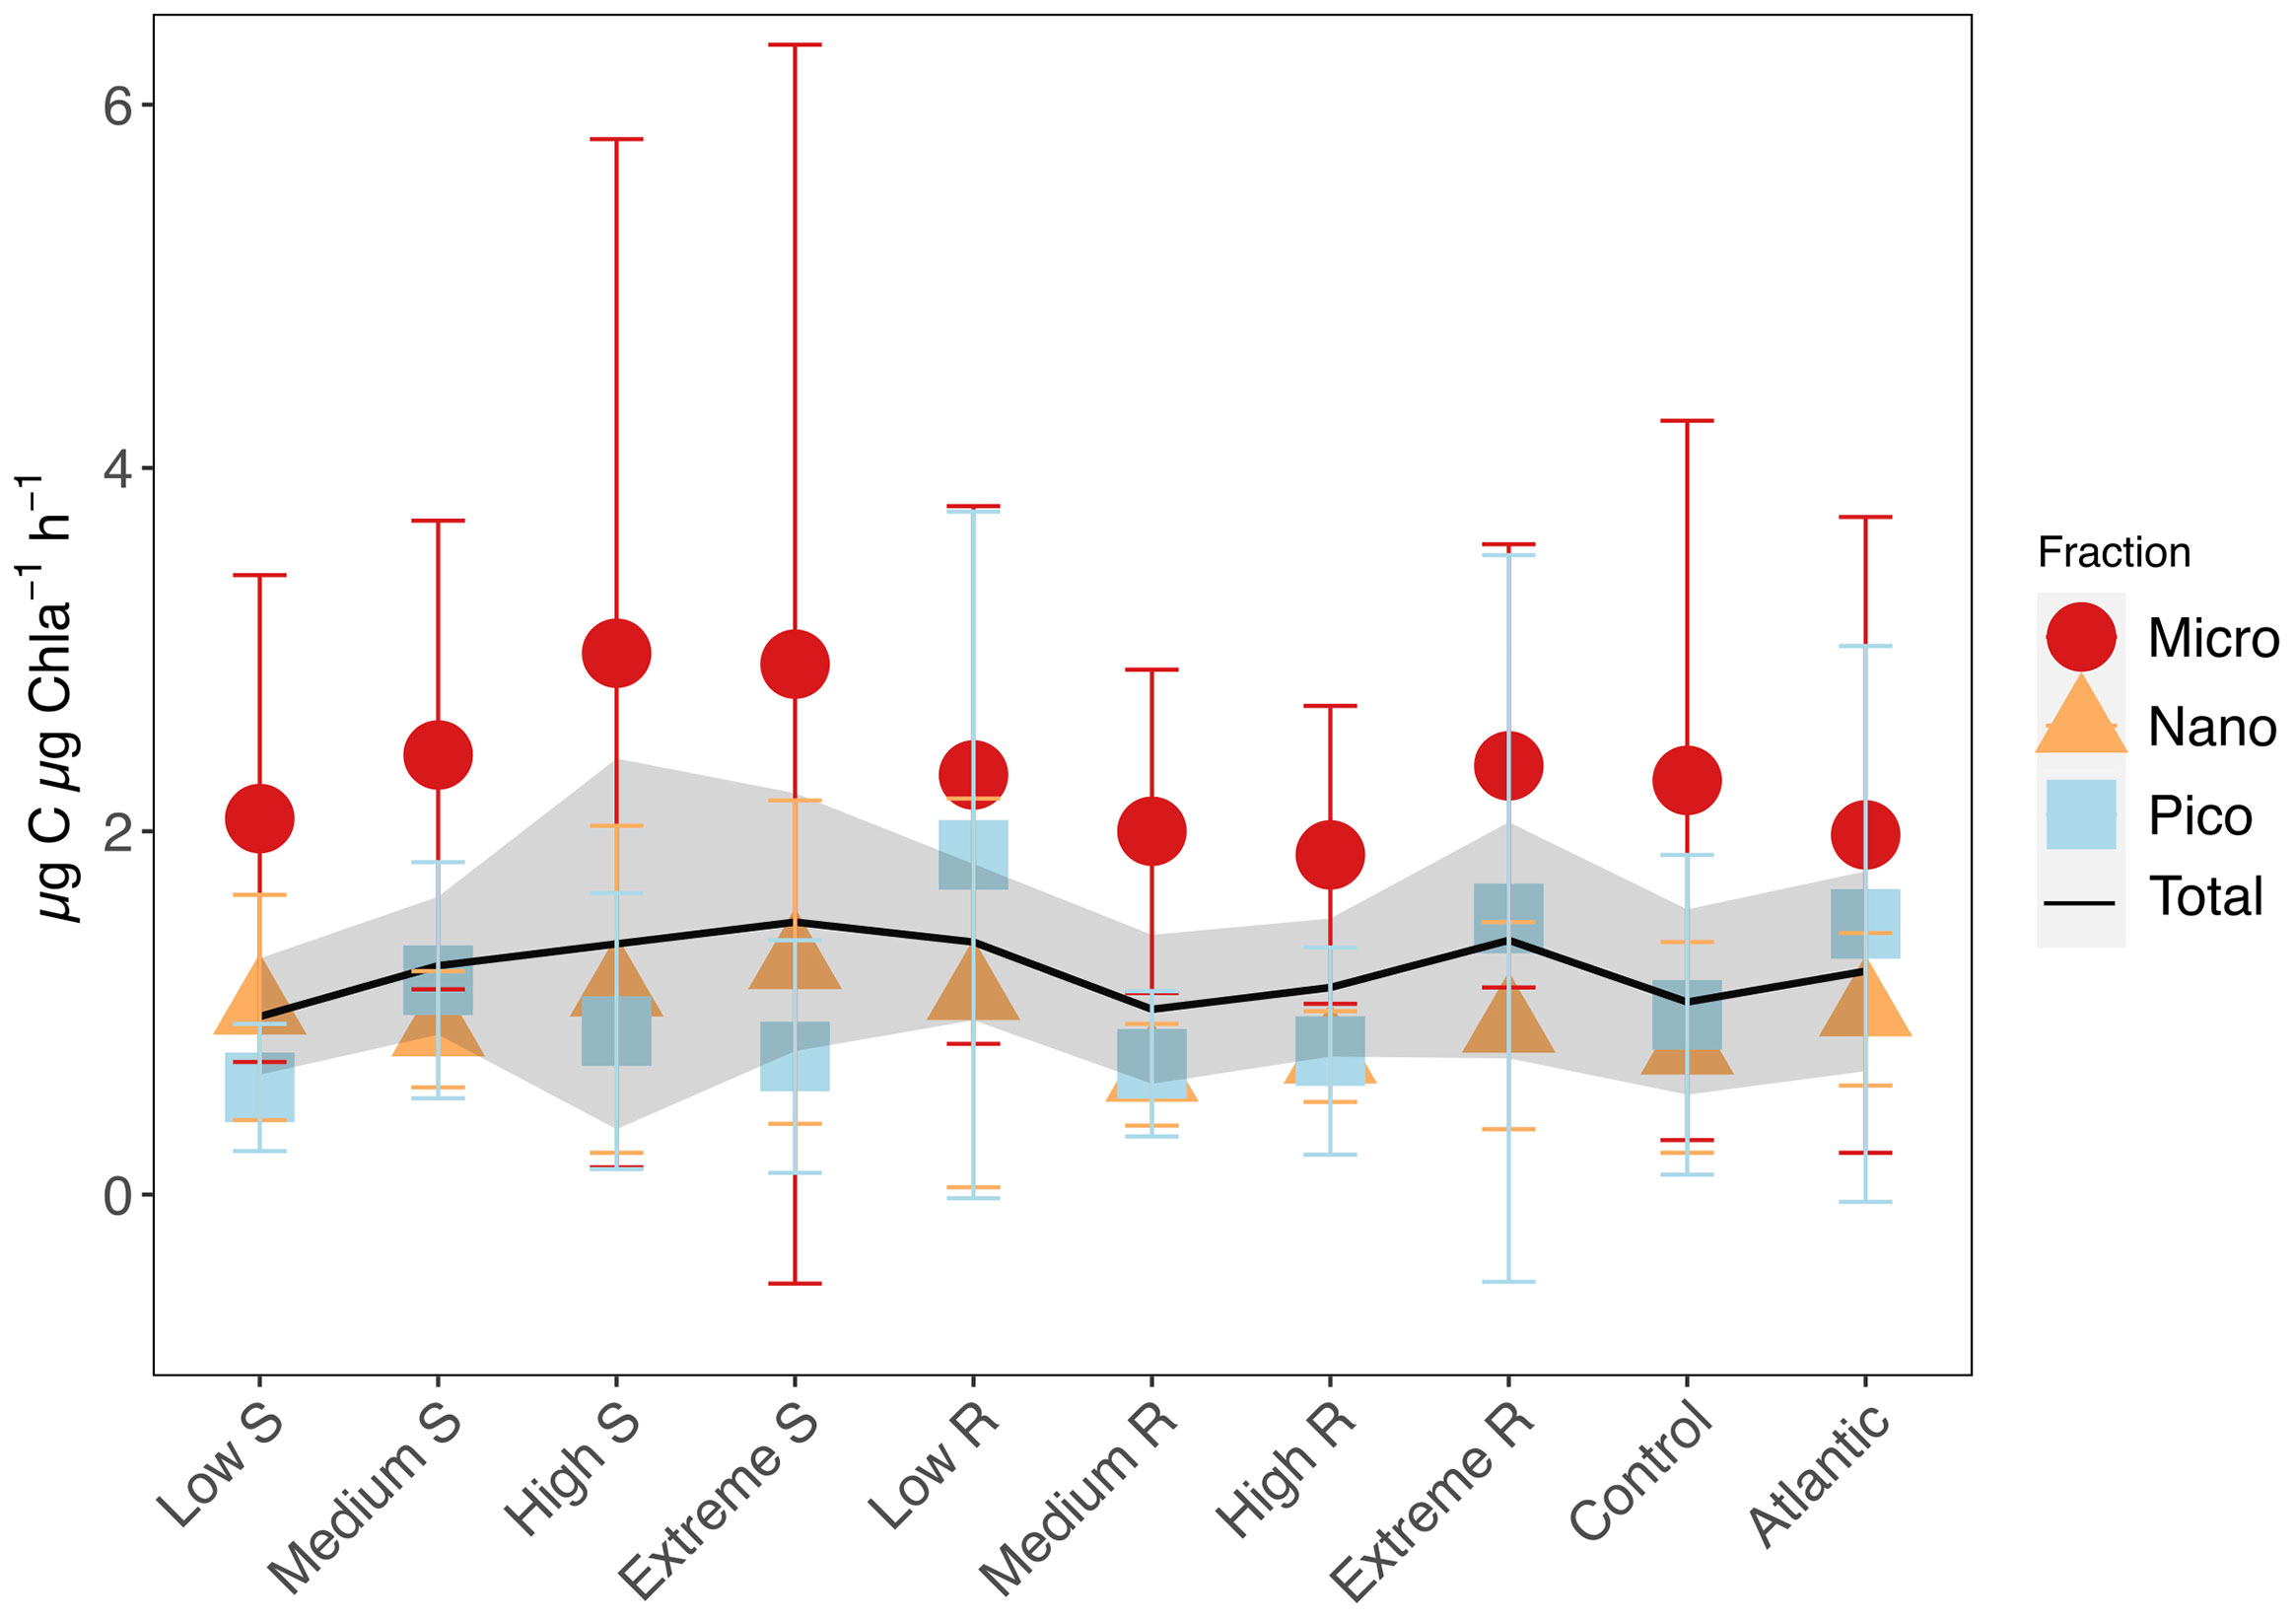
Figure 6 Mean carbon assimilation numbers (AN) and standard deviations for total phytoplankton, microphytoplankton (20-250 µm), nanophytoplankton (2-20 µm) and picophytoplankton (0.2-2 µm). Shaded area shows standard deviation for total phytoplankton AN.
4 Discussion
4.1 Developments Within the Primary Producer Community
Poulton et al. (2006) reasonably argued that time is a crucial factor when environmental forcing, in this case artificial upwelling, is applied. On a short time scale the community likely responds through metabolic adaptation, whereas on a long time scale these adaptations lead to actual trophic reorganization. Our results show that, on the primary producer level, both metabolic and trophic adaptation occurred as a consequence of artificial upwelling. This became evident in form of (i) permanent shifts in the dominating size classes towards larger phytoplankton (Figure 4), (ii) reduction of PER compared to the control (Figure 2) and (iii) increased B build-up and PPcum until the end of our experiment (Figures 3, 1C). While the magnitude of the observed effects mostly increased with increasing upwelling intensity, as expected, some effects such as the increase in PPcum were only very prominent in the high and extreme upwelling intensities. Simultaneously, all observed effects (i)-(iii) were more pronounced under recurring upwelling compared to the respective singular upwelling intensities (or a synthesis of the main results surrounding PP, B and PER see Figure 7). This happened most probably because the singular treatments ran into strong nutrient limitation after all nutrients introduced by the DW addition were consumed.
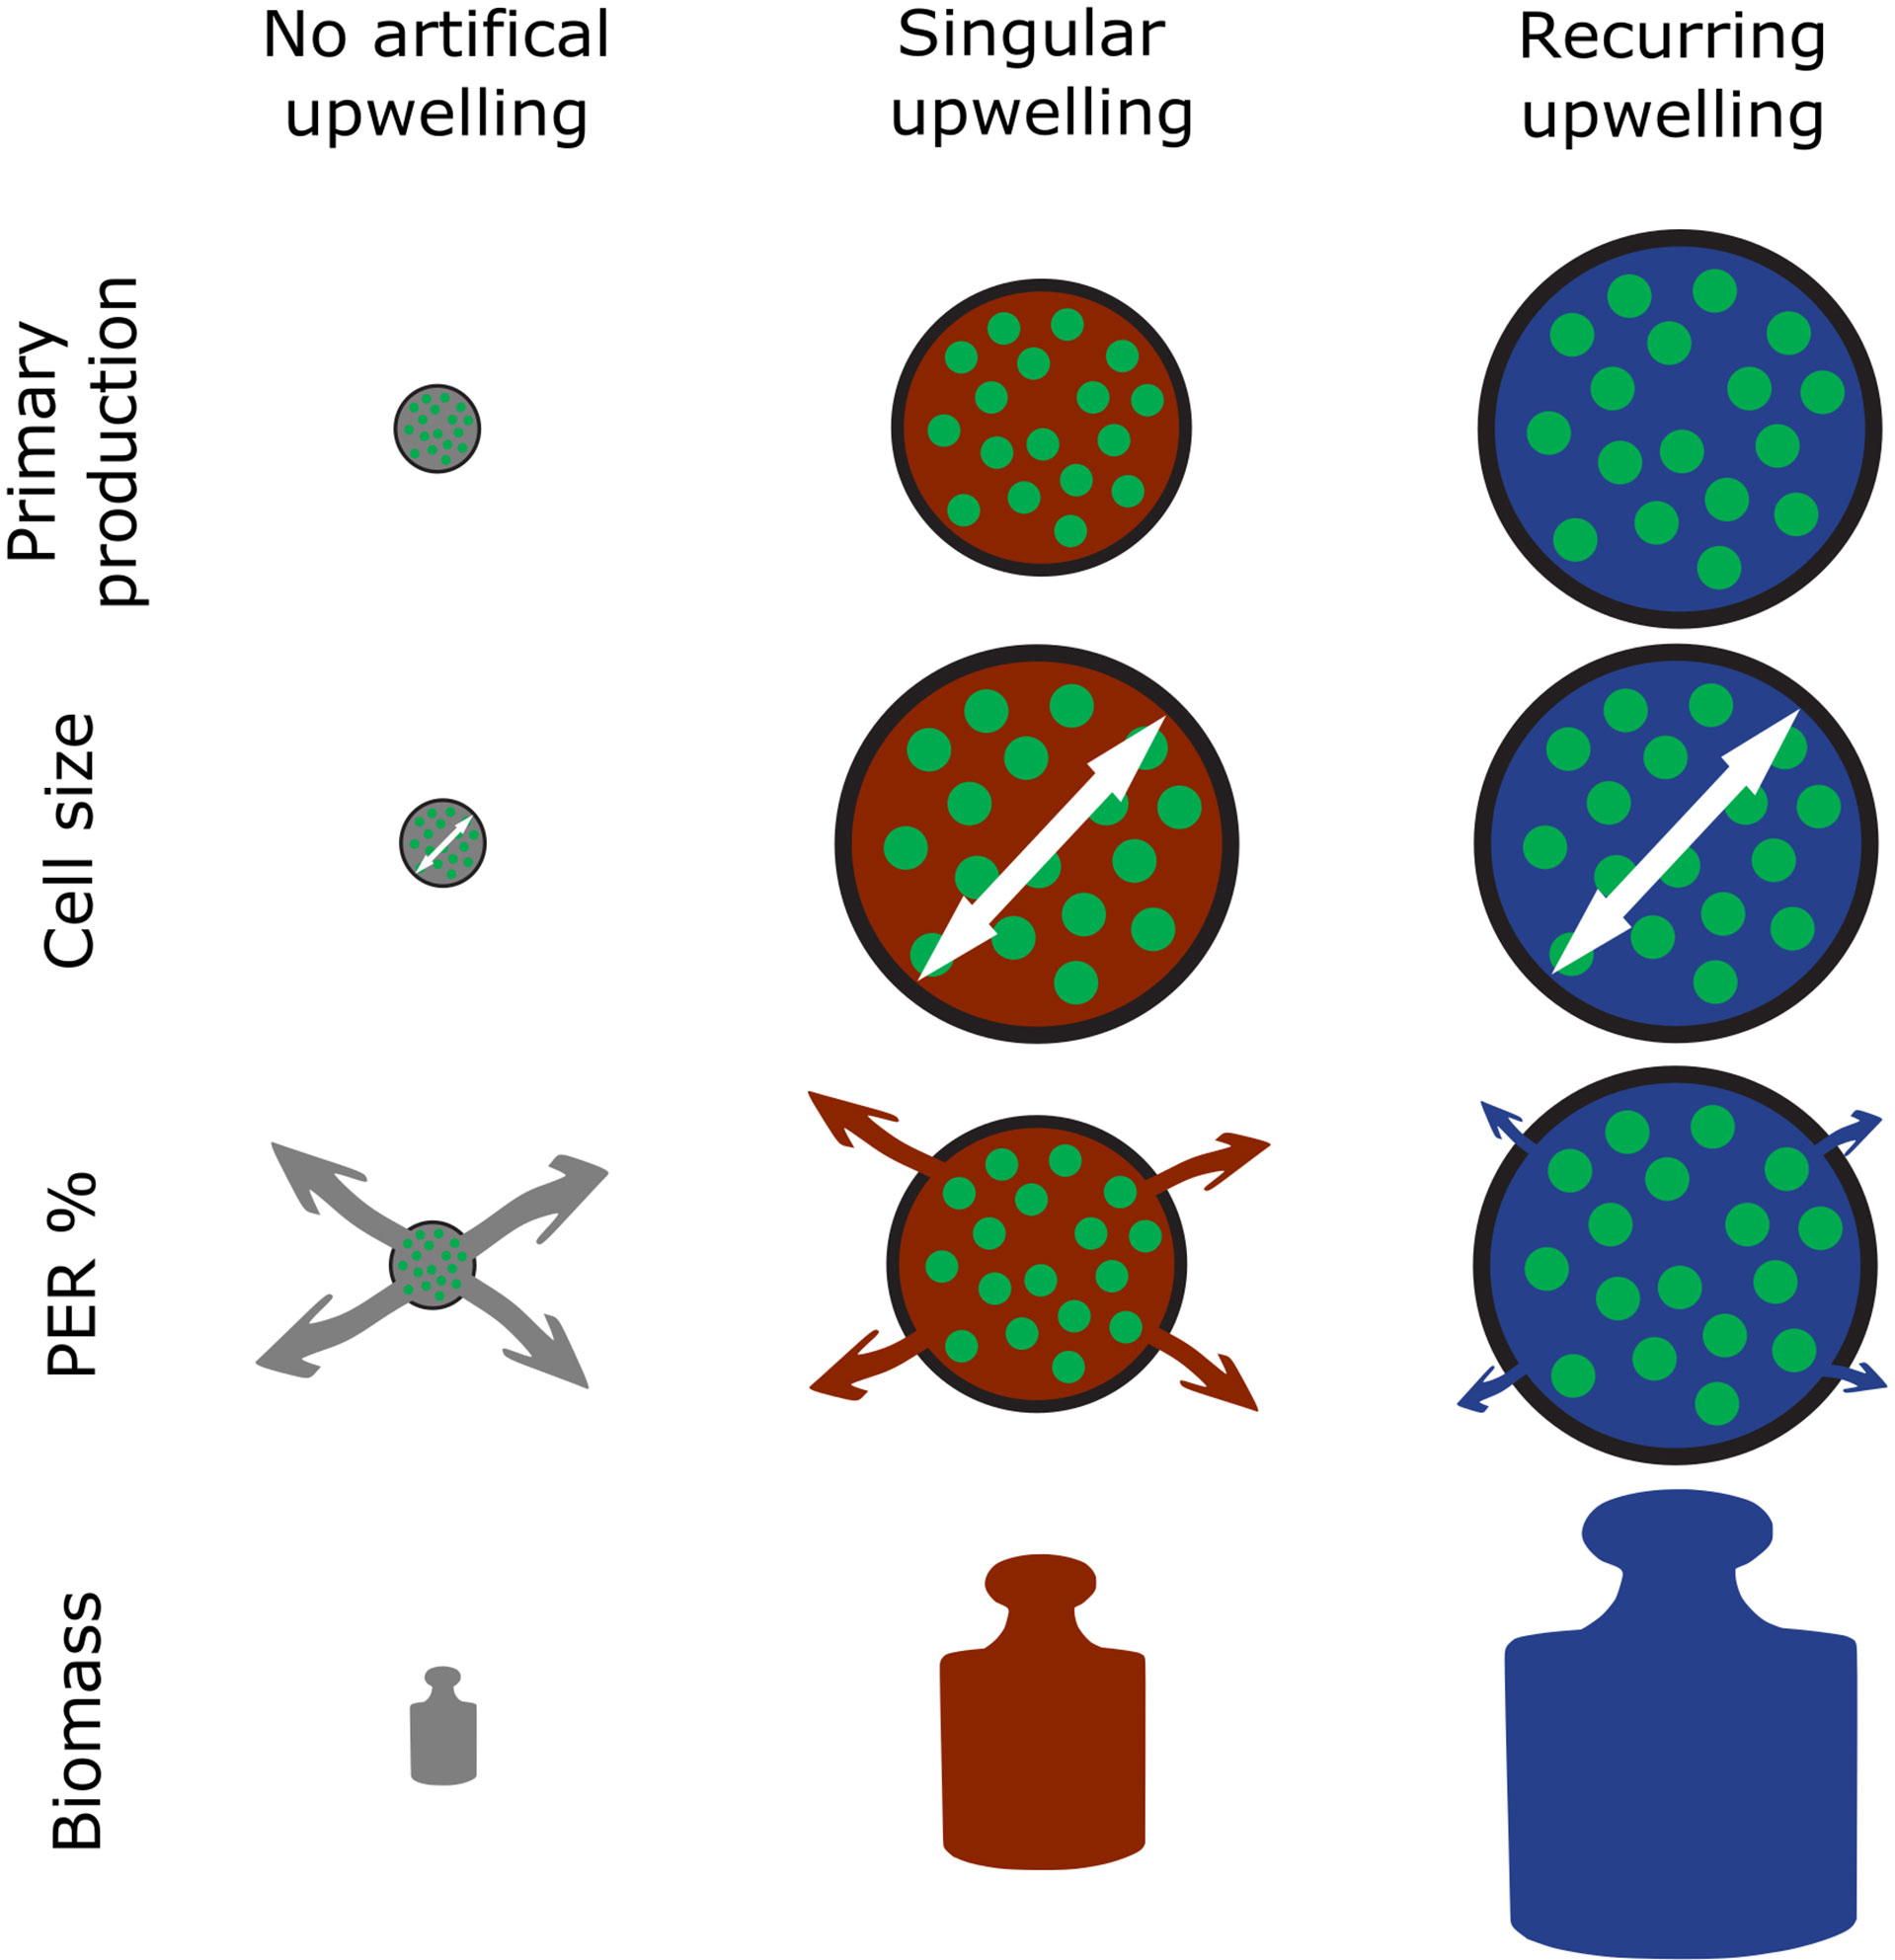
Figure 7 Schematic depiction of the main findings surrounding primary production in this study. PER, Percentage Extracellular Release. The white arrows illustrate cell size and arrows under PER% the magnitude of extracellular release.
The size class shift was due to a strong increase in diatom abundance, followed by Prymnesiophyceae which became more abundant towards the end of the experiment (Ortiz et al., 2022). This is in accordance with large amounts of literature describing succession patterns of small picophytoplankton under oligotrophic to larger microphytoplankton (mainly diatoms) under nutrient replete conditions both in the field and mesocosm experiments (Mann, 1993; Arístegui et al., 2004; Fawcett and Ward, 2011). On the other hand, the in situ application of artificial upwelling conducted by Masuda et al. (2010) showed increased growth of pico- and nanophytoplankton rather than diatoms. They suggested this could have been due to low light availability in the artificially fertilized waters combined with insufficient shade adaptation of diatom species, the former of which was not the case in our experiment. Other possibilities such as silicate limitation were not discussed. Compared to an in situ application, phytoplankton in the mesocosms can be more strongly affected by differences in the seed communities enclosed at the start. However, we did not find compelling evidence for large differences in the starting communities. Responses to artificial upwelling were spearheaded by Diatoms in all treatments, with L. danicus, L. minimus and G. striata as the main contributors to biomass (Ortiz et al., 2022).
The late Prymnesiophyceae increase was, at least in the medium, high and extreme recurring treatment, identified as a strong bloom of coccolithophores from d29 onwards (unpublished data), which explains the almost exclusive contribution of nanophytoplankton to biomass (PP and Chla to a lesser extent) during those last days. What exactly triggered this bloom remains unclear though. In the singular treatments, the extended period of nutrient depletion might have promoted a terminal shift towards more nano- and less microphytoplankton, as smaller cells have been shown to have physiological advantages under oligotrophic conditions (Sommer et al., 2017). Based on experience from previous mesocosm studies we know that Prochlorococcus, a globally present and typically dominant species under the oligotrophic conditions in these waters, sometimes doesn’t thrive well in the mesocosm enclosures (Schulz et al., 2017). Apart from the grazing pressure affecting the picophytoplankton overall, this has been attributed to the sudden reduction in the mixed layer depth and consequently higher light exposure inside, to which these genera are more sensitive (Llabrés and Agustí, 2006) and offers an explanation to why they did not pick up more in the singular treatments after these became nutrient-depleted again. Synechococcus, similarly prevalent in these waters, might have failed to increase in abundance due to grazing. In summary, all treatments displayed trophic reorganization, but the extent scaled with upwelling intensity.
Another key message lies in the changes in PER. DOC produced by phytoplankton serves as substrate for heterotrophs. Unless recirculated through the microbial loop, it does not contribute to the pool of particulate organic material consumed by higher trophic levels such as copepods (Fogg, 1983; Cushing, 1989). Compared to the Atlantic, all treatments and the control led to a strong reduction in PER. But PER in the treatments was still consistently lower than in the control, and much more under recurring mode. The negative relationship between PER and the amount of added nutrients in the recurring treatments (Figures 2A, B) indicates a better suitability of high intensity recurring upwelling to fuel a food web that ultimately sustains harvestable fish, since less organic carbon would be lost to heterotrophic bacteria. This pattern is also consistent with literature PER values of naturally nutrient-rich (low PER) and oligotrophic (high PER) waters, placing the high and extreme recurring treatments in the spectrum of nutrient-replete upwelling areas (Teira et al., 2001; Teira et al., 2003). It is worth noting that the PER values obtained likely reflect “net” PER at equilibrium with bacterial uptake of PPDOC rather than the gross amount of exudate released given the long incubation times applied (Wolter, 1982), and might therefore be underestimated. Shorter incubation times are commonly used to measure gross amounts of exudate release, as PPDOC rates are influenced by bacterial uptake lag phases in release kinetics (Lancelot, 1979; López-Sandoval et al., 2013). Moreover, nutrient limitation under singular as well as low intensity recurring DW supply likely led to not only increased phytoplankton PER, but also to reduced bacterial uptake of exudates (Obernosterer and Herndl, 1995). In summary with the other main findings (i-iii) this supports the conclusion, that long-term intense recurring upwelling is better suited to achieve a permanent shift from an oligotrophic community to one resembling that of productive upwelling regions. At least on the primary producer level this change was achieved during our experiment, visible in the higher PPcum and lower PER under elevated upwelling intensity (Figures 1B, 2) as well as the marked shift in PP and B (Chla less so) contributions from pico-/nano- towards nano-/microphytoplankton (Figure 4). Though the singular treatments also displayed a similar development, PP rates and B of the high and extreme mostly remained below those of their recurring counterparts, apart from the initial peaks. Ortiz et al. (2022) also reported an analogous development in the metabolic balance (net community production and ratio of gross production versus respiration) of the phytoplankton community: Recurring treatments of medium to extreme upwelling intensity consistently maintained a net autotrophic state whereas singular treatments swiftly reassumed a balanced to net heterotrophic state after nutrient depletion.
Comparison of our data with in situ PP measurements from the vicinity of the islands was only possible for total PP rates, since we found no reported measurements on size-fractionated PP for this region except for one dataset from the Atlantic Meridional Transect, several hundred kilometers away, collected by Marañón et al. (2001; 1.2-7.2 µg C L-1 d-1 with highest rates being PPpico). Peak PPPOC rates measured in the Canary Islands area during blooms or higher production periods range from 913 to 2780 mg C m-2 d-1 (Supplementary Table 1). Peak PP rates obtained in the recurring treatments were comparable to this, while the singular extreme treatment reached PP rates almost 1.7 times higher (4689 mg C m-2 d-1). The mean PP rates, on the other hand, were within the spectrum found during upwelling periods or other settings supporting elevated production (Supplementary Table 1). This confirms that the scenarios simulated in the mesocosms are realistic and that the phytoplankton community adjusted to artificial upwelling the same way it adjusts to natural nutrient input events. The particularly low PP in the control mesocosm and Atlantic samples matches the low productivity season in which the experiment took place (Arístegui, 1990). And although the general trends of increased system productivity under artificial upwelling align, comparative interpretation of the few previous in situ applications of artificial upwelling is difficult, due to strongly varying time-scales (hours to years of monitoring) and different parameters used by other authors; such as surface layer Chla values (as opposed to depth integrated), plankton standing stocks or species diversity/richness indexes (Masuda et al., 2010; Jeong et al., 2013).
4.2 Carbon Dynamics and Implications for Primary Production Models
Assimilation numbers (µg C µg Chla-1 h-1) were not impacted much by the different treatments except for a slight increase in mean microphytoplankton AN with increasing upwelling intensity (Figure 6), which can be attributed to the few very high datapoints that skewed the mean values. Microphytoplankton having generally higher AN than smaller phytoplankton is consistent with literature (Poulton et al., 2006; Cotti-Rausch et al., 2020). The absence of a strong upwelling mode or intensity effect on AN seems counterintuitive, but follows observations made by Harrison and Platt (1980) and Falkowski (1981) that showed no observable relationship between available total inorganic nitrogen and AN. Marra et al. (2007) argued that environmental variability is better described by pigment absorption properties rather than the quantity of Chla. A case also made by Milligan et al. (2015), who further summarized the substantial evidence on AN not reflecting the availability of nutrients. Moreover, AN also decrease due to increased packaging and consequent decreased absorption efficiency when the average cell size increases (Bricaud et al., 1995). All this offers an explanation to the non-existent impact on Chla concentration-based AN in our experiment despite the forcing of substantial stoichiometric changes on the community through the treatment.
We interpret the high variability found across C:Chla ratios in all size fractions and especially among microphytoplankton with some caution, due to constraints related to the biomass estimates discussed later in 4.3. But it nonetheless picks up on an issue that has been raised repeatedly in ecosystem production models: an over-simplified depiction of the primary producer community (Marañón et al., 2000; Marañón et al., 2001; Richardson, 2019). Chla-based models mostly assume constant C:Chla ratios and cell sizes and directly translate changes in Chla to B (Westberry et al., 2008; Silsbe et al., 2016), although it has been shown that the relationship between Chla and B is not necessarily linear (Saba et al., 2010; Pasqueron De Fommervault et al., 2017). Our findings support the critique on this over-simplified approach. Although more recent models like the Carbon-based Productivity Model (CbPM) and the Carbon, Absorption, and Fluorescence Euphotic-resolving model (CAFE) have improved at this, the issue still persists (Westberry and Behrenfeld, 2014). Baklouti et al. (2021) have coherently summarized both the ongoing debate in this topic as well as the importance of considering detailed information and variability on phytoplankton elemental stoichiometry, abundances and cell size shifts, the latter of which is highlighted by our findings. Oddly enough, model validation with in situ data also seems to completely ignore the influence of major players in global ocean primary production like eastern boundary upwelling systems.
4.3 Interpretational Limitations
Large mesocosm experiments of this type bring about their own set of caveats and limitations as is thoroughly discussed by, e.g., Bach et al. (2020) (and more generally by Gamble and Davies (1982)). Perhaps the most evident is the small number of replicates imposed by the technical and logistical efforts that go into experiments of this magnitude. In this study we chose two different upwelling modes on top of different intensities in order to enhance the topical scope of the study, although this meant limiting the statistical power since the regression analyses had to be run through a small number of data points only. Moreover, compared to the Atlantic, there was a reduction of both PER (Figure 2) and overall picophytoplankton contribution to PP and Chla (Figure 4) in the control. Whether this could represent an enclosure effect is unclear, since the Atlantic was obviously subject to constant changes and is therefore not directly comparable to any mesocosm unit. Notwithstanding, all treatments differed strongly from the control in their development and the establishment of similar starting conditions (see d1-d3 in Figures 1 and 3) also worked well. Hence, we are confident that the results discussed are a realistic representation of how oligotrophic communities of the subtropical Atlantic would react to artificial upwelling.
The unusually high C:Chla ratios found among microphytoplankton (Figure 5, top row) also demand further discussion, as these exceeded the highest values we found in literature (Sathyendranath et al., 2009). Literature C:Chla values are often based on total particulate organic carbon rather than calculated phytoplankton B and only few authors have gone through the lengths of additional fractionations to differentiate between C:Chla ratios of micro-, nano-, and/or picophytoplankton (e.g., Pérez et al., 2006; Calvo-Díaz et al., 2008). Going into size fractionated C:Chla ratios increases the detail richness of the data, but comes at a cost of added uncertainty. In our case, we assume that we might have slightly overestimated microphytoplankton B, since small errors in size measurements using light microscopy can get enhanced along the conversion from size to biovolume and biovolume to biomass. Which in turn strongly affects the C:Chla ratio, particularly at low Chla concentrations. This is less likely for nano- and picophytoplankton, because the applied method, flow cytometry, is less prone to human error (see section 2.4).
4.4 Conclusions
In summary, artificial upwelling applied to an oligotrophic plankton community led to increases in PP, PPcum, Chla and B that scaled linearly with upwelling intensity (illustrated in Figure 7). Larger phytoplankton size classes benefitted disproportionately stronger from the upwelling of inorganic nutrients, leading to a shift in the phytoplankton community composition towards larger cells, predominantly composed of diatoms. The observed stimulation in primary production, build-up in phytoplankton biomass and shift in community structure in response to artificial upwelling are well within the range of the seasonal variation occurring in this region, with enhanced productivity and accumulation of larger-sized phytoplankton typically occurring under intensified vertical mixing in mid to late winter. The observed responses differed with regard to the applied mode of artificial upwelling. Under high upwelling intensity the recurring treatments generated more B than their singular counterparts and yielded significantly higher PPcum per unit of nutrient supply. The loss of primary produced organic matter via extracellular release (PER) declined with increasing upwelling intensity and was lower in the recurring compared to the singular upwelling mode. Our results demonstrate that (i) oligotrophic phytoplankton communities are capable to rapidly and effectively adjust to artificial upwelling, (ii) this response is independent of the upwelling intensity, i.e. it scales linearly with the mixing ratio of nutrient-rich deep to nutrient-impoverished surface waters, and (iii) the response differs depending on the upwelling mode, with recurring upwelling yielding higher rates of primary production, stronger biomass build-up per unit of deep-water nutrient supply and lower extracellular release of primary produced organic matter than single pulsed upwelling. These findings indicate that a key objective of artificial upwelling, the efficient use of upwelled nutrients by the larger phytoplankton size fractions, is met even under conditions where the resident community is adapted to highly oligotrophic conditions. This opens up the pathway for either a more efficient transfer of primary produced organic matter to higher trophic levels or enhanced export efficiency via organic matter sinking.
Data Availability Statement
The raw data supporting the conclusions of this article will be made available by the authors, without undue reservation.
Author Contributions
Experimental concept and design: UR, JA. Execution of the experiment: All authors. Data analysis: JO, NH-H, MF-M. Manuscript writing: JO with input from all co-authors. All authors contributed to the article and approved the submitted version.
Funding
This project was conducted in the framework of the project Ocean Artificial Upwelling (Ocean artUp) funded by an Advanced Grant of the European Research Council. Additional support was provided through Transnational Access funds by the EU project AQUACOSM, EU H2020-INFRAIA-project No. 731065, and by project TRIATLAS (AMD-817578-5) from the European Union’s Horizon 2020 to JA. JA was also supported by a Helmholtz International Fellow Award, 2015 (Helmholtz Association, Germany).
Conflict of Interest
The authors declare that the research was conducted in the absence of any commercial or financial relationships that could be construed as a potential conflict of interest.
Publisher’s Note
All claims expressed in this article are solely those of the authors and do not necessarily represent those of their affiliated organizations, or those of the publisher, the editors and the reviewers. Any product that may be evaluated in this article, or claim that may be made by its manufacturer, is not guaranteed or endorsed by the publisher.
Acknowledgments
The authors are grateful to the Oceanic Platform of the Canary Islands (PLOCAN) and its staff for the use of their facilities, and for their hospitality and help with the logistics and organization of this research campaign. We thank the biological oceanography group of the University of Las Palmas de Gran Canaria (GOB-ULPGC) for providing additional lab facilities. The captain and crew of RV James Cook are thanked for deploying the mesocosms and collecting the deep water. Special thanks go to the KOSMOS team of GEOMAR for taking care of all logistical and technical aspects of this mesocosm campaign and for coordinating the research activities on site as well as the data management and exchange.
Supplementary Material
The Supplementary Material for this article can be found online at: https://www.frontiersin.org/articles/10.3389/fmars.2022.880550/full#supplementary-material
References
Arístegui J. (1990). La Distribución De La Clorofila a En Aguas De Canarias. Boletín. Del. Inst. Español. Oceanogr. 6, 61–71.
Arístegui J., Barton E. D., Tett P., Montero M. F., García-Muñoz M., Basterretxea G., et al. (2004). Variability in Plankton Community Structure, Metabolism, and Vertical Carbon Fluxes Along an Upwelling Filament (Cape Juby, NW Africa). Prog. Oceanogr. 62, 95–113. doi: 10.1016/j.pocean.2004.07.004
Aure J., Strand Ø., Erga S. R., Strohmeier T. (2007). Primary Production Enhancement by Artificial Upwelling in a Western Norwegian Fjord. Mar. Ecol. Prog. Ser. 352, 39–52. doi: 10.3354/meps07139
Bach L. T., Paul A. J., Boxhammer T., von der Esch E., Graco M., Schulz K. G., et al. (2020). Factors Controlling Plankton Community Production, Export Flux, and Particulate Matter Stoichiometry in the Coastal Upwelling System Off Peru. Biogeosciences 17, 4831–4852. doi: 10.5194/bg-17-4831-2020
Baklouti M., Pagès R., Alekseenko E., Guyennon A., Grégori G. (2021). On the Benefits of Using Cell Quotas in Addition to Intracellular Elemental Ratios in Flexible-Stoichiometry Plankton Functional Type Models. Application to the Mediterranean Sea. Prog. Oceanogr. 197, 102634. doi: 10.1016/j.pocean.2021.102634
Bricaud A., Babin M., Morel A., Claustre H. (1995). Variability in the Chlorophyll-Specific Absorption Coefficients of Natural Phytoplankton : Analysis and Parameterization Phytoplankton a • H ( A ) was Analyzed Using a Data Set Including 815 Spectra Determined Chlorophyll Concentration Range Ph Values Wer. J. Geophys. Res. 100, 13321–13332. doi: 10.1029/95JC00463
Calvo-Díaz A., Morán X. A. G., Suárez L.Á. (2008). Seasonality of Picophytoplankton Chlorophyll a and Biomass in the Central Cantabrian Sea, Southern Bay of Biscay. J. Mar. Syst. 72, 271–281. doi: 10.1016/j.jmarsys.2007.03.008
Casareto B. E., Niraula M. P., Suzuki Y. (2017). Marine Planktonic Ecosystem Dynamics in an Artificial Upwelling Area of Japan: Phytoplankton Production and Biomass Fate. J. Exp. Mar. Bio. Ecol. 487, 1–10. doi: 10.1016/j.jembe.2016.11.002
Cermeño P., Fernández A., Marañón E. (2012). “Libro Blanco De Métodos Y Técnicas De Trabajo Oceanográfico (MALASPINA 2010): Determinación De La Producción Primaria Fraccionada Por Tamaños”. Ed. Moreno-Ostos E. (S.A., Spain: Gráficas/85).
Cotti-Rausch B. E., Lomas M. W., Lachenmyer E. M., Baumann E. G., Richardson T. L. (2020). Size-Fractionated Biomass and Primary Productivity of Sargasso Sea Phytoplankton. Deep. Res. Part I Oceanogr. Res. Pap. 156, 103141. doi: 10.1016/j.dsr.2019.103141
Cushing D. H. (1989). A Difference in Structure Between Ecosystems in Strongly Stratified Waters and in Those That are Only Weakly Stratified. J. Plankton. Res. 11, 1–13. doi: 10.1093/plankt/11.1.1
Falkowski P. G. (1981). Light-Shade Adaptation and Assimilation Numbers. J. Plankton. Res. 3, 203–216. doi: 10.1093/plankt/3.2.203
Fawcett S. E., Ward B. B. (2011). Phytoplankton Succession and Nitrogen Utilization During the Development of an Upwelling Bloom. Mar. Ecol. Prog. Ser. 428, 13–31. doi: 10.3354/meps09070
Fogg G. E. (1983). The Ecological Significance of Extracellular Products of Phytoplankton Photosynthesis. Bot. Mar. 26, 3–14. doi: 10.1515/botm.1983.26.1.3
Frölicher T. L., Rodgers K. B., Stock C. A., Cheung W. W. L. (2016). Sources of Uncertainties in 21st Century Projections of Potential Ocean Ecosystem Stressors. Global Biogeochem. Cycle. 30, 1224–1243. doi: 10.1111/1462-2920.13280
Gamble J. C., Davies J. M. (1982). ““Application of Enclosures to the Study of Marine Pelagic Systems,”,” in Marine Mesocosms - Biological and Chemical Research in Experimental Ecosystems. Eds. Grice G. D., Reeve M. R. (New York: Springer). doi: 10.1007/978-1-4612-5645-8
GESAMP (2019). “High Level Review of a Wide Range of Proposed Marine Geoengineering Techniques,” in GESAMP Reports Stud, 144. Available at: http://www.gesamp.org/publications/high-level-review-of-a-wide-range-of-proposed-marine-geoengineering-techniques. (London, UK: International Maritime Organisation).
Giraud M., Boye M., Garçon V., Donval A., de la Broise D. (2016). Simulation of an Artificial Upwelling Using Immersed in Situ Phytoplankton Microcosms. J. Exp. Mar. Bio. Ecol. 475, 80–88. doi: 10.1016/j.jembe.2015.11.006
Handå A., McClimans T. A., Reitan K. I., Knutsen Ø., Tangen K., Olsen Y. (2014). Artificial Upwelling to Stimulate Growth of non-Toxic Algae in a Habitat for Mussel Farming. Aquac. Res. 45, 1798–1809. doi: 10.1111/are.12127
Harrison W. G., Platt T. (1980). Variations in Assimilation Number of Coastal Marine Phyto-Phytoplankton: Effects of Environmental Co-Variates. J. Plankton. Res. 2, 249–260. doi: 10.1093/plankt/2.4.249
Hernández-Hernández N., Bach L. T., Montero M. F., Taucher J., Baños I., Guan W., et al. (2018). High CO 2 Under Nutrient Fertilization Increases Primary Production and Biomass in Subtropical Phytoplankton Communities: A Mesocosm Approach. Front. Mar. Sci. 5. doi: 10.3389/fmars.2018.00213
Hillebrand H., Dürselen C. D., Kirschtel D., Pollingher U., Zohary T. (1999). Biovolume Calculation for Pelagic and Benthic Microalgae. J. Phycol. 35, 403–424. doi: 10.1046/j.1529-8817.1999.3520403.x
Jakobsen H. H., Markager S. (2016). Carbon-To-Chlorophyll Ratio for Phytoplankton in Temperate Coastal Waters: Seasonal Patterns and Relationship to Nutrients. Limnol. Oceanogr. 61, 1853–1868. doi: 10.1002/lno.10338
Jeong Y. K., Lee H. N., Park C., Kim D. S., Kim M. C. (2013). Variation of Phytoplankton and Zooplankton Communities in a Sea Area, With the Building of an Artificial Upwelling Structure. Anim. Cells Syst. (Seoul). 17, 63–72. doi: 10.1080/19768354.2012.754381
Kirke B. (2003). Enhancing Fish Stocks With Wave-Powered Artificial Upwelling. Ocean. Coast. Manage. 46, 901–915. doi: 10.1016/S0964-5691(03)00067-X
Lancelot C. (1979). Gross Excretion Rates of Natural Marine Phytoplankton and Heterotrophic Uptake of Excreted Products in the Southern North Sea, as Determined by Short-Term Kinetics. Mar. Ecol. Prog. Ser. 1, 179–186. doi: 10.3354/meps001179
Li G., Cheng L., Zhu J., Trenberth K. E., Mann M. E., Abraham J. P. (2020). Increasing Ocean Stratification Over the Past Half-Century. Nat. Clim. Change 10, 1116–1123. doi: 10.1038/s41558-020-00918-2
Llabrés M., Agustí S. (2006). Picophytoplankton Cell Death Induced by UV Radiation: Evidence for Oceanic Atlantic Communities. Limnol. Oceanogr. 51, 21–29. doi: 10.4319/lo.2006.51.1.0021
López-Sandoval D. C., Rodríguez-Ramos T., Cermeño P., Marañón E. (2013). Exudation of Organic Carbon by Marine Phytoplankton: Dependence on Taxon and Cell Size. Mar. Ecol. Prog. Ser. 477, 53–60. doi: 10.3354/meps10174
Lovelock J. E., Rapley C. G. (2007). Ocean Pipes Could Help the Earth to Cure Itself. Nature 449, 2007. doi: 10.1038/449403a
Lüdecke D., Ben-Shachar M., Patil I., Waggoner P., Makowski D. (2021). Performance: An R Package for Assessment, Comparison and Testing of Statistical Models. J.f Open Source Softw 6 (60), 3139. doi: 10.21105/joss.03139
Mann K. H. (1993). Physical Oceanography, Food Chains, and Fish Stocks: A Review. ICES. J. Mar. Sci. 50, 105–119. doi: 10.1006/jmsc.1993.1013
Marañón E., Holligan P. M., Barciela R., González N., Mouriño B., Pazó M. J., et al. (2001). Patterns of Phytoplankton Size Structure and Productivity in Contrasting Open-Ocean Environments. Mar. Ecol. Prog. Ser. 216, 43–56. doi: 10.3354/meps216043
Marañón E., Holligan P. M., Varela M., Mouriño B., Bale A. J. (2000). Basin-Scale Variability of Phytoplankton Biomass, Production and Growth in the Atlantic Ocean. Deep. Res. Part I Oceanogr. Res. Pap. 47, 825–857. doi: 10.1016/S0967-0637(99)00087-4
Marra J., Trees C. C., O’Reilly J. E. (2007). Phytoplankton Pigment Absorption: A Strong Predictor of Primary Productivity in the Surface Ocean. Deep. Res. Part I Oceanogr. Res. Pap. 54, 155–163. doi: 10.1016/j.dsr.2006.12.001
Maruyama S., Tsubaki K., Taira K., Sakai S. (2004). Artificial Upwelling of Deep Seawater Using the Perpetual Salt Fountain for Cultivation of Ocean Desert. J. Oceanogr. 60, 563–568. doi: 10.1023/B:JOCE.0000038349.56399.09
Maruyama S., Yabuki T., Sato T., Tsubaki K., Komiya A., Watanabe M., et al. (2011). Evidences of Increasing Primary Production in the Ocean by Stommel’s Perpetual Salt Fountain. Deep. Res. Part I Oceanogr. Res. Pap. 58, 567–574. doi: 10.1016/j.dsr.2011.02.012
Masuda T., Furuya K., Kohashi N., Sato M., Takeda S., Uchiyama M., et al. (2010). Lagrangian Observation of Phytoplankton Dynamics at an Artificially Enriched Subsurface Water in Sagami Bay, Japan. J. Oceanogr. 66, 801–813. doi: 10.1007/s10872-010-0065-1
McAndrew P. M., Björkman K. M., Church M. J., Morris P. J., Jachowski N., Williams P. J. L. B., et al. (2007). Metabolic Response of Oligotrophic Plankton Communities to Deep Water Nutrient Enrichment. Mar. Ecol. Prog. Ser. 332, 63–75. doi: 10.3354/meps332063
McClimans T. A., Handå A., Fredheim A., Lien E., Reitan K. I. (2010). Controlled Artificial Upwelling in a Fjord to Stimulate non-Toxic Algae. Aquac. Eng. 42, 140–147. doi: 10.1016/j.aquaeng.2010.02.002
Menden-Deuer S., Lessard E. J. (2000). Carbon to Volume Relationships for Dinoflagellates, Diatoms, and Other Protist Plankton. Limnol. Oceanogr. 45, 569–579. doi: 10.4319/lo.2000.45.3.0569
Milligan A. J., Halsey K. H., Behrenfeld M. J. (2015). HORIZONS:Advancing Interpretations of 14C-Uptake Measurements in the Context of Phytoplankton Physiology and Ecology. J. Plankton. Res. 37, 692–698. doi: 10.1093/plankt/fbv051
Miyabe H., Kobayashi H., Ogiwara S. (2004). Development of the Floating Structure for the Ocean Nutrient Enhancer “TAKUMI.” Ocean ‘04 - MTS/IEEE Techno-Ocean ‘04 Bridg. Across Ocean. - Conf. Proc. 1, 348–353. doi: 10.1109/oceans.2004.1402940
Obernosterer I., Herndl G. J. (1995). Phytoplankton Extracellular Release and Bacterial Growth: Dependence on the Inorganic N:P Ratio. Mar. Ecol. Prog. Ser. 116, 247–258. doi: 10.3354/meps116247
Olenina I., Hajdu S., Edler L., Andersson A., Wasmund N., Busch S., et al. (2006). Biovolumes and Size-Classes of Phytoplankton in the Baltic Sea.
Ortiz J., Arístegui J., Taucher J., Riebesell U. (2022). Artificial Upwelling in Singular and Recurring Mode : Consequences for Net Community Production and Metabolic Balance. Front. Mar. Sci. 8, 1–10. doi: 10.3389/fmars.2021.743105
Pasqueron De Fommervault O., Perez-Brunius P., Damien P., Camacho-Ibar V. F., Sheinbaum J. (2017). Temporal Variability of Chlorophyll Distribution in the Gulf of Mexico: Bio-Optical Data From Profiling Floats. Biogeosciences 14, 5647–5662. doi: 10.5194/bg-14-5647-2017
Perez F. F., Castro C. G., Alvarez M., Kortzinger A., Santana-casiano M., Rueda M. J., et al. (2001). Mixing Analysis of Nutrients, Oxygen and Inorganic Carbon in the Canary Islands Region. J. Mar. Syst. 28, 183–201. doi: 10.1016/S0924-7963(01)00003-3
Pérez V., Fernández E., Marañón E., Morán X. A. G., Zubkov M. V. (2006). Vertical Distribution of Phytoplankton Biomass, Production and Growth in the Atlantic Subtropical Gyres. Deep. Res. Part I Oceanogr. Res. Pap. 53, 1616–1634. doi: 10.1016/j.dsr.2006.07.008
Poulton A. J., Holligan P. M., Hickman A., Kim Y. N., Adey T. R., Stinchcombe M. C., et al. (2006). Phytoplankton Carbon Fixation, Chlorophyll-Biomass and Diagnostic Pigments in the Atlantic Ocean. Deep. Res. Part II. Top. Stud. Oceanogr. 53, 1593–1610. doi: 10.1016/j.dsr2.2006.05.007
Richardson T. L. (2019). Mechanisms and Pathways of Small-Phytoplankton Export From the Surface Ocean. Ann. Rev. Mar. Sci. 11, 57–74. doi: 10.1146/annurev-marine-121916-063627
Riebesell U., Czerny J., Von Bröckel K., Boxhammer T., Büdenbender J., Deckelnick M., et al. (2013a). Technical Note: A Mobile Sea-Going Mesocosm System - New Opportunities for Ocean Change Research. Biogeosciences 10, 1835–1847. doi: 10.5194/bg-10-1835-2013
Riebesell U., Gattuso J. P., Thingstad T. F., Middelburg J. J. (2013b). Arctic Ocean Acidification: Pelagic Ecosystem and Biogeochemical Responses During a Mesocosm Study. Biogeosciences 10, 5619–5626. doi: 10.5194/bg-10-5619-2013
Saba V. S., Friedrichs M. A. M., Carr M. E., Antoine D., Armstrong R. A., Asanuma I., et al. (2010). Challenges of Modeling Depth-Integrated Marine Primary Productivity Over Multiple Decades: A Case Study at BATS and HOT. Global Biogeochem. Cycle. 24, 1–21. doi: 10.1029/2009GB003655
Sathyendranath S., Stuart V., Nair A., Oka K., Nakane T., Bouman H., et al. (2009). Carbon-To-Chlorophyll Ratio and Growth Rate of Phytoplankton in the Sea. Mar. Ecol. Prog. Ser. 383, 73–84. doi: 10.3354/meps07998
Schlitzer R., Mieruch-Schnülle S. (2021) webODV Explore. Available at: https://explore.webodv.awi.de.
Schulz K. G., Bach L. T., Bellerby R. G. J., Bermúdez R., Büdenbender J., Boxhammer T., et al. (2017). Phytoplankton Blooms at Increasing Levels of Atmospheric Carbon Dioxide: Experimental Evidence for Negative Effects on Prymnesiophytes and Positive on Small Picoeukaryotes. Front. Mar. Sci. 4. doi: 10.3389/fmars.2017.00064
Silsbe G. M., Behrenfeld M. J., Halsey K. H., Milligan A. J., Westberry T. K. (2016). The CAFE Model: A Net Production Model for Global Ocean Phytoplankton. Global Biogeochem. Cycle. 30, 1756–1777. doi: 10.1002/2016GB005521
Sommer U., Charalampous E., Genitsaris S., Moustaka-Gouni M. (2017). Benefits, Costs and Taxonomic Distribution of Marine Phytoplankton Body Size. J. Plankton. Res. 39, 494–508. doi: 10.1093/plankt/fbw071
Taucher J., Bach L. T., Boxhammer T., Nauendorf A., Achterberg E. P., Algueró-Muñiz M., et al. (2017). Influence of Ocean Acidification and Deep Water Upwelling on Oligotrophic Plankton Communities in the Subtropical North Atlantic: Insights From an in Situ Mesocosm Study. Front. Mar. Sci. 4. doi: 10.3389/fmars.2017.00085
Teira E., Abalde J., Álvarez-Ossorio M. T., Bode A., Cariño C., Cid Á., et al. (2003). Plankton Carbon Budget in a Coastal Wind-Driven Upwelling Station Off a Coruña (NW Iberian Peninsula). Mar. Ecol. Prog. Ser. 265, 31–43. doi: 10.3354/meps265031
Teira E., Pazó M. J., Serret P., Fernández E. (2001). Dissolved Organic Carbon Production by Microbial Populations in the Atlantic Ocean. Limnol. Oceanogr. 46, 1370–1377. doi: 10.4319/lo.2001.46.6.1370
Utermöhl H. (1931). Neue Wege in Der Quantitativen Erfassung Des Plankton.(Mit Besonderer Berücksichtigung Des Ultraplanktons.). SIL. Proceeding. 1922-2010. 5, 567–596. doi: 10.1080/03680770.1931.11898492
Wang X. J., Behrenfeld M., Le Borgne R., Murtugudde R., Boss E. (2009). Regulation of Phytoplankton Carbon to Chlorophyll Ratio by Light, Nutrients and Temperature in the Equatorial Pacific Ocean: A Basin-Scale Model. Biogeosciences 6, 391–404. doi: 10.5194/bg-6-391-2009
Welschmeyer N. A. (1994). Fluorometric Analysis of Chlorophyll a in the Presence of Chlorophyll B and Pheopigments. Limnol. Oceanogr. 39, 1985–1992. doi: 10.4319/lo.1994.39.8.1985
Westberry T. K., Behrenfeld M. J. (2014). “Oceanic Net Primary Production,” in Biophysical Remote of Satellite Applications Sensing. Ed. Hanes J. M. (Berlin, Germany: Springer), 1–41. doi: 10.1007/978-3-642-25047-7_1
Westberry T., Behrenfeld M. J., Siegel D. A., Boss E. (2008). Carbon-Based Primary Productivity Modeling With Vertically Resolved Photoacclimation. Global Biogeochem. Cycle. 22, 1–18. doi: 10.1029/2007GB003078
White A., Björkman K., Grabowski E., Letelier R., Poulos S., Watkins B., et al. (2010). An Open Ocean Trial of Controlled Upwelling Using Wave Pump Technology. J. Atmos. Ocean. Technol. 27, 385–396. doi: 10.1175/2009JTECHO679.1
Keywords: artificial upwelling, primary production, mesocosm, biomass, phytoplankton, oligotrophic
Citation: Ortiz J, Arístegui J, Hernández-Hernández N, Fernández-Méndez M and Riebesell U (2022) Oligotrophic Phytoplankton Community Effectively Adjusts to Artificial Upwelling Regardless of Intensity, but Differently Among Upwelling Modes. Front. Mar. Sci. 9:880550. doi: 10.3389/fmars.2022.880550
Received: 21 February 2022; Accepted: 24 May 2022;
Published: 20 June 2022.
Edited by:
Monique Messié, Monterey Bay Aquarium Research Institute (MBARI), United StatesReviewed by:
Adrian Marchetti, University of North Carolina at Chapel Hill, United StatesFrance Van Wambeke, UMR7294 Institut Méditerranéen d’océanographie (MIO), France
Renate Scharek, Gijón Oceanographic Center, Spain
Copyright © 2022 Ortiz, Arístegui, Hernández-Hernández, Fernández-Méndez and Riebesell. This is an open-access article distributed under the terms of the Creative Commons Attribution License (CC BY). The use, distribution or reproduction in other forums is permitted, provided the original author(s) and the copyright owner(s) are credited and that the original publication in this journal is cited, in accordance with accepted academic practice. No use, distribution or reproduction is permitted which does not comply with these terms.
*Correspondence: Joaquin Ortiz, jortiz@geomar.de