Vertical Distribution of Particulate Matter in the Clarion Clipperton Zone (German Sector)—Potential Impacts From Deep-Sea Mining Discharge in the Water Column
 Benjamin Gillard
 Rob P. Harbour
 Nicolas Nowald
 Laurenz Thomsen
 Morten H. Iversen
- 1MARUM—Center for Marine Environmental Sciences, University of Bremen, Bremen, Germany
- 2The OceanLab, Jacobs University Bremen gGmbH, Bremen, Germany
- 3The Lyell Centre for Earth and Marine Science and Technology, Heriot-Watt University, Edinburgh, United Kingdom
- 4Alfred Wegener Institute for Polar and Marine Research, Bremerhaven, Germany
Most studies on the potential impacts of deep-sea mining in the Clarion Clipperton Zone (CCZ) have largely focused on benthic ecosystems but ignore the pelagic environment. To model full-scale impacts, it is important to understand how sediment discharge might affect the pelagic zone as well. This study combines in situ optics, hydrography, and remote sensing to describe particle abundance and size distribution through the entire water column in the CCZ (German sector). CCZ surface waters were characterized as productive over the year. During the winter, we observed the formation of a sharp transition zone in Chla concentration, identifying the area as a productive transitional zone toward a more depleted ocean gyre. In the German sector, median particle size was small (± 77 μm), and large particles (>300 μm) were rare. By assessing particle flux attenuation, we could show that the presence of a thick oxygen minimum zone (OMZ) plays an essential role in export and transformation of settling aggregates, with strong diel variations. We suggest that the combination of small aggregate size, bottom currents and slow seafloor consolidation may explain the extremely low sedimentation rate in the CCZ. We conclude that sediment incorporations and ballasting effect on settling particulate matter represent the most significant hazard on midwater and benthic ecosystems.
Introduction
A growing demand for metals and rare earth elements for use in frontier technologies is driving accelerated research and development into viable deep-sea mining solutions (Miller et al., 2018). Of particular economic importance are polymetallic nodules, which have been considered as mining targets since the 1970s and are enriched with metals such as manganese, copper, nickel and cobalt, as well as rare earth elements (Wegorzewski and Kuhn, 2014). Polymetallic nodules may form on the abyssal seafloor at depths between 4,000 and 6,000 m when the water is well oxygenated, and the sedimentation rate is less than 10 mm⋅kyr–1 (Gollner et al., 2017). The highest known abundance of polymetallic nodules has been observed in the Clarion Clipperton Zone (CCZ, Figure 1) in the north-eastern Pacific Ocean, approximately 2,500 km off the coast of Mexico, where ca. 30 billion tons of nodules lay on the seabed over an area of between 4 and 5 million square kilometers (ISA, 2010).
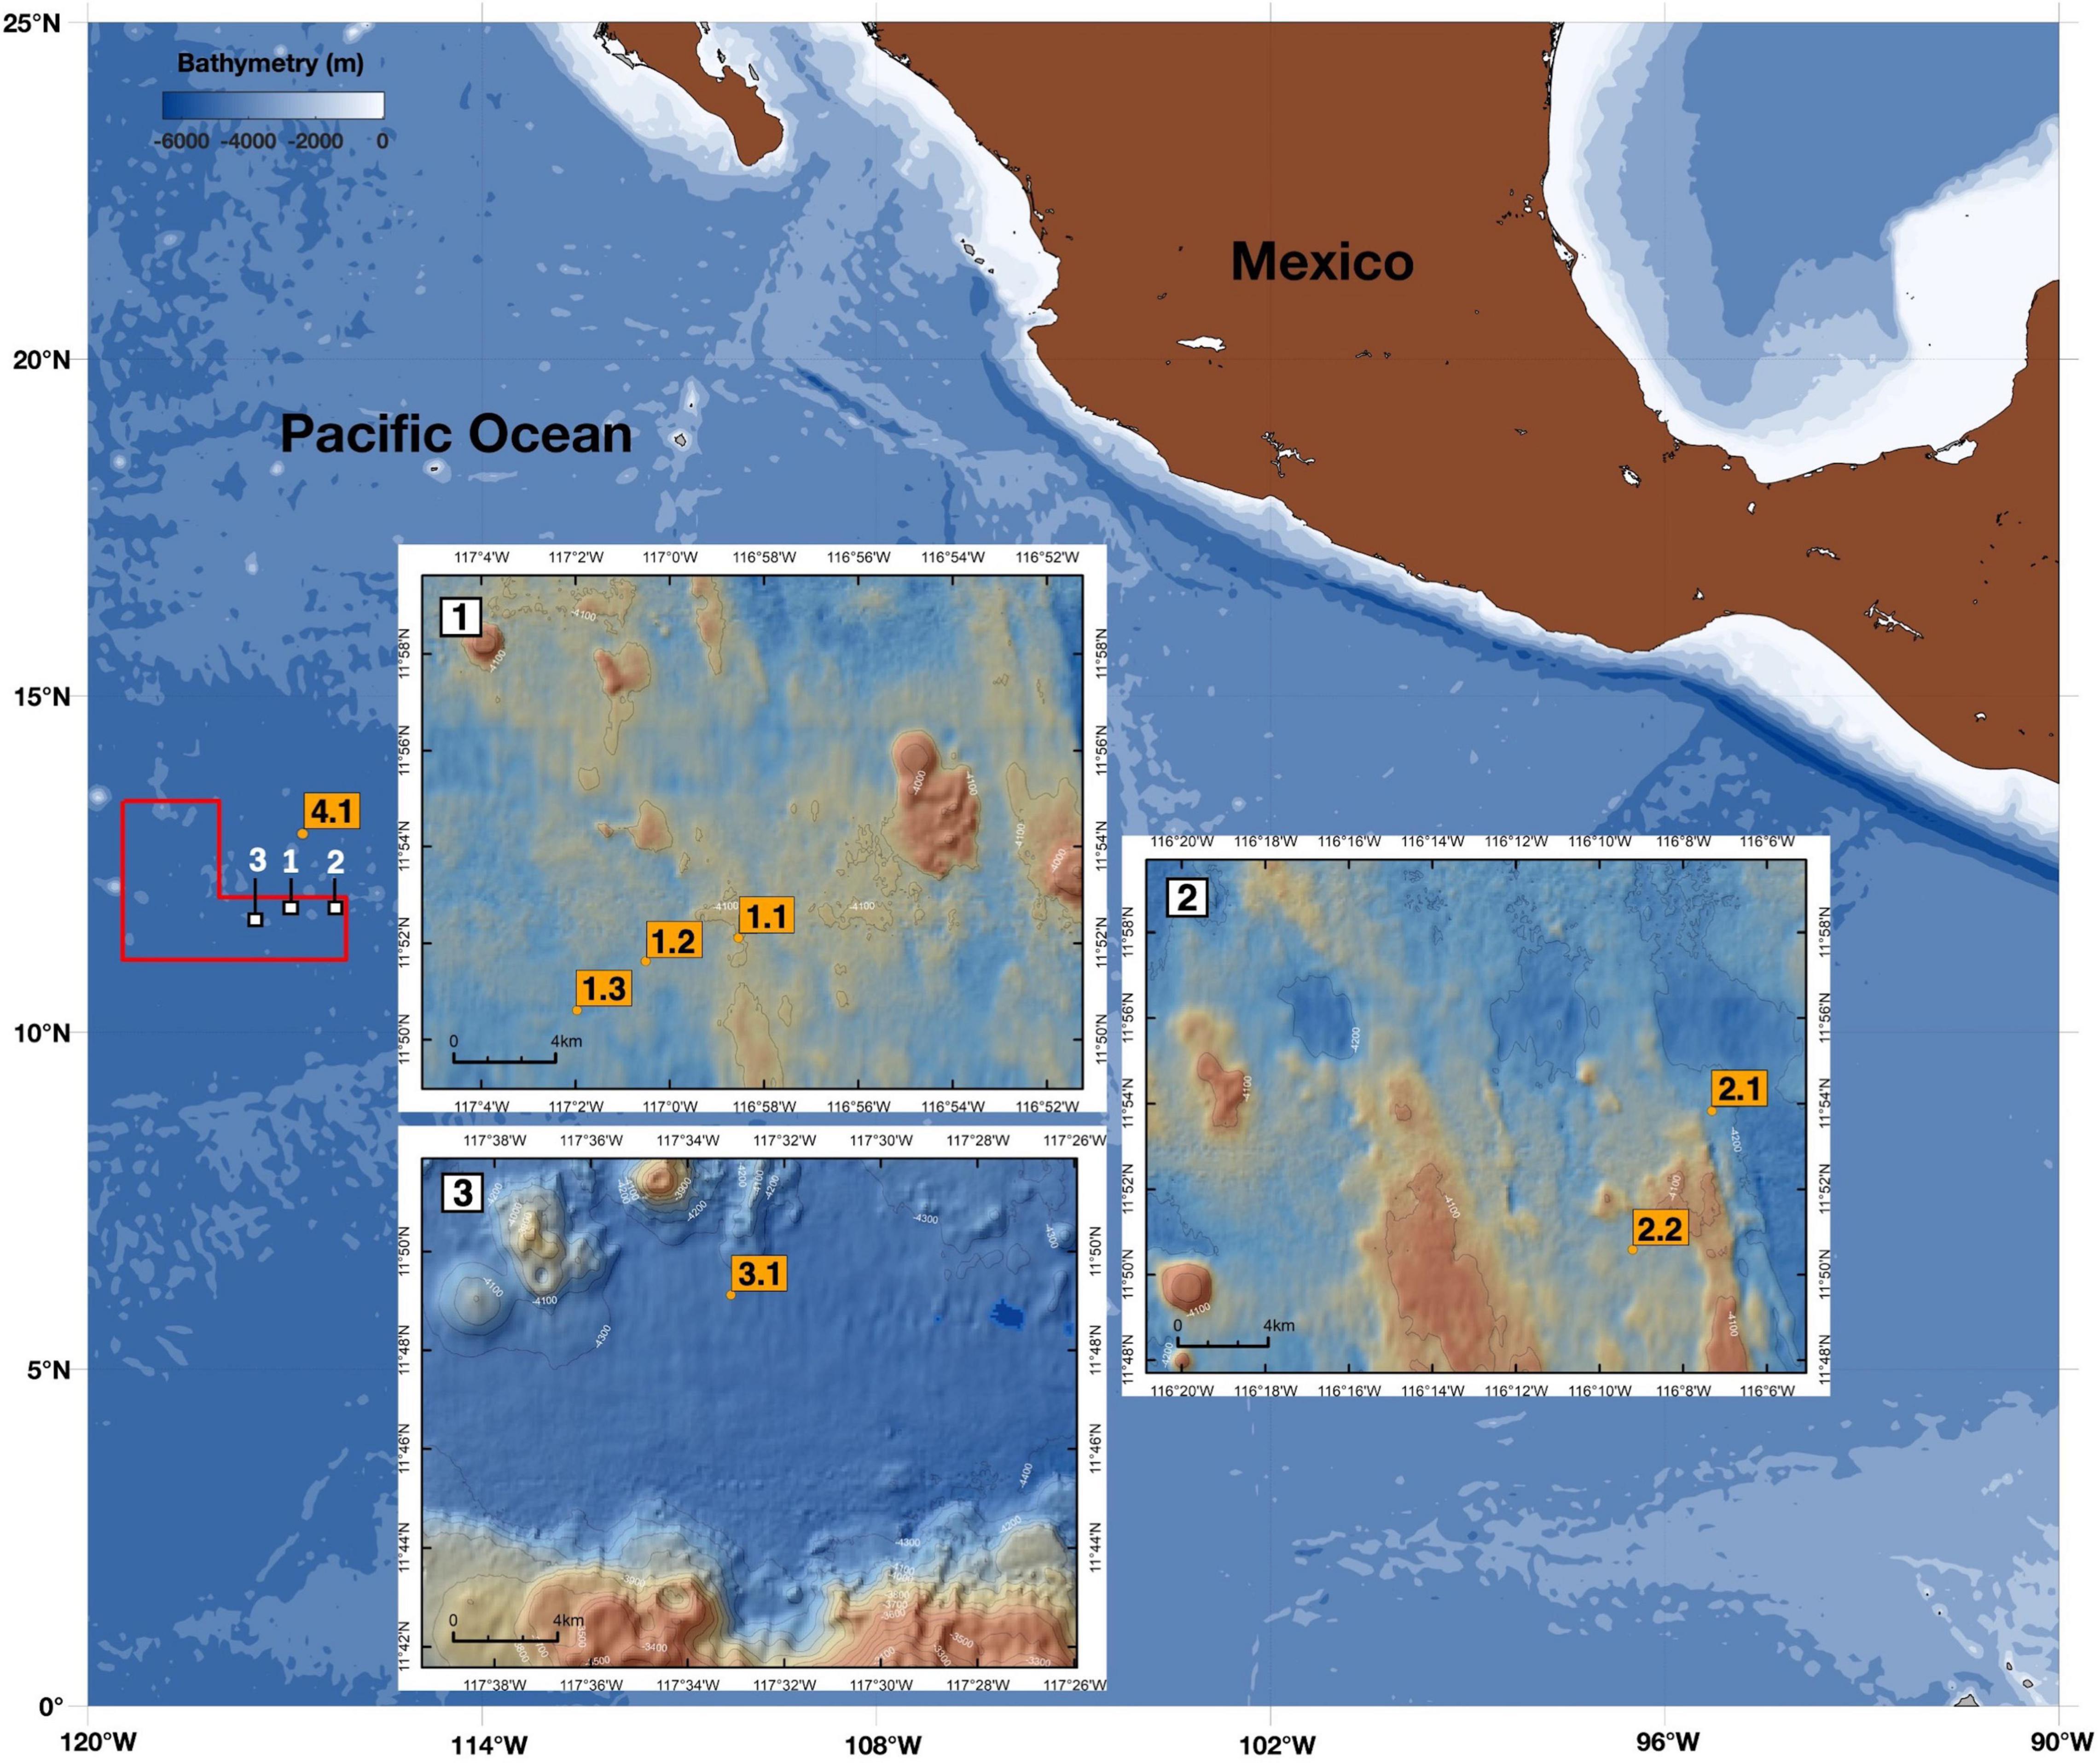
Figure 1. Map showing camera deployment stations in relation to the bathymetry of the study area. The three study sites (WA 1–3) are located within the eastern German license area for nodule exploration (red polygon), in the north-eastern Pacific Ocean. Camera-profiling stations are indicated by yellow boxes. Bathymetry of the WA area is based on EM 120 measurements (Wiedicke-Hombach and Shipboard Scientific Party, 2009). Contours are 100 m; resolution of each data point is 120 m by 120 m.
To date, the International Seabed Authority has awarded 16 licenses for mining exploration in the CCZ, covering a 1 million km2 area of seabed (ISA, 2019). Deep-sea mining activities have been recognized for their potential to drastically impact marine ecosystems (Jones et al., 2017). The collection of nodules will be carried out by autonomous mining crawlers (Figure 2), resulting in sediment plumes released from the seafloor by the crawler’s movement and harvesting activities (Gillard et al., 2019). In addition, accidental waste spills of deep-sea sediment from the mining platform or riser pipe will most likely affect the pelagic environment. To date, the magnitude of the impact generated by mining activity is still unpredictable, as a full-scale mining test that includes a discharge into the midwater column has not yet been performed (Christiansen et al., 2020; Muñoz-Royo et al., 2021). Based on an estimation of 260 days per year of operation, a mining vessel could release up to 1.2 × 10⁸ kg of sediment in the water column (Muñoz-Royo et al., 2021). It has been suggested that a sediment plume released in the epipelagic layer will increase turbidity and decrease light penetration, resulting in a net decrease in primary productivity. After release and dilution of mining plumes, increased inorganic nutrients and trace metal concentrations in the surface water might result in a shift in the planktonic community (e.g., diatoms) and affect the entire food web structure (Hyun et al., 1998).
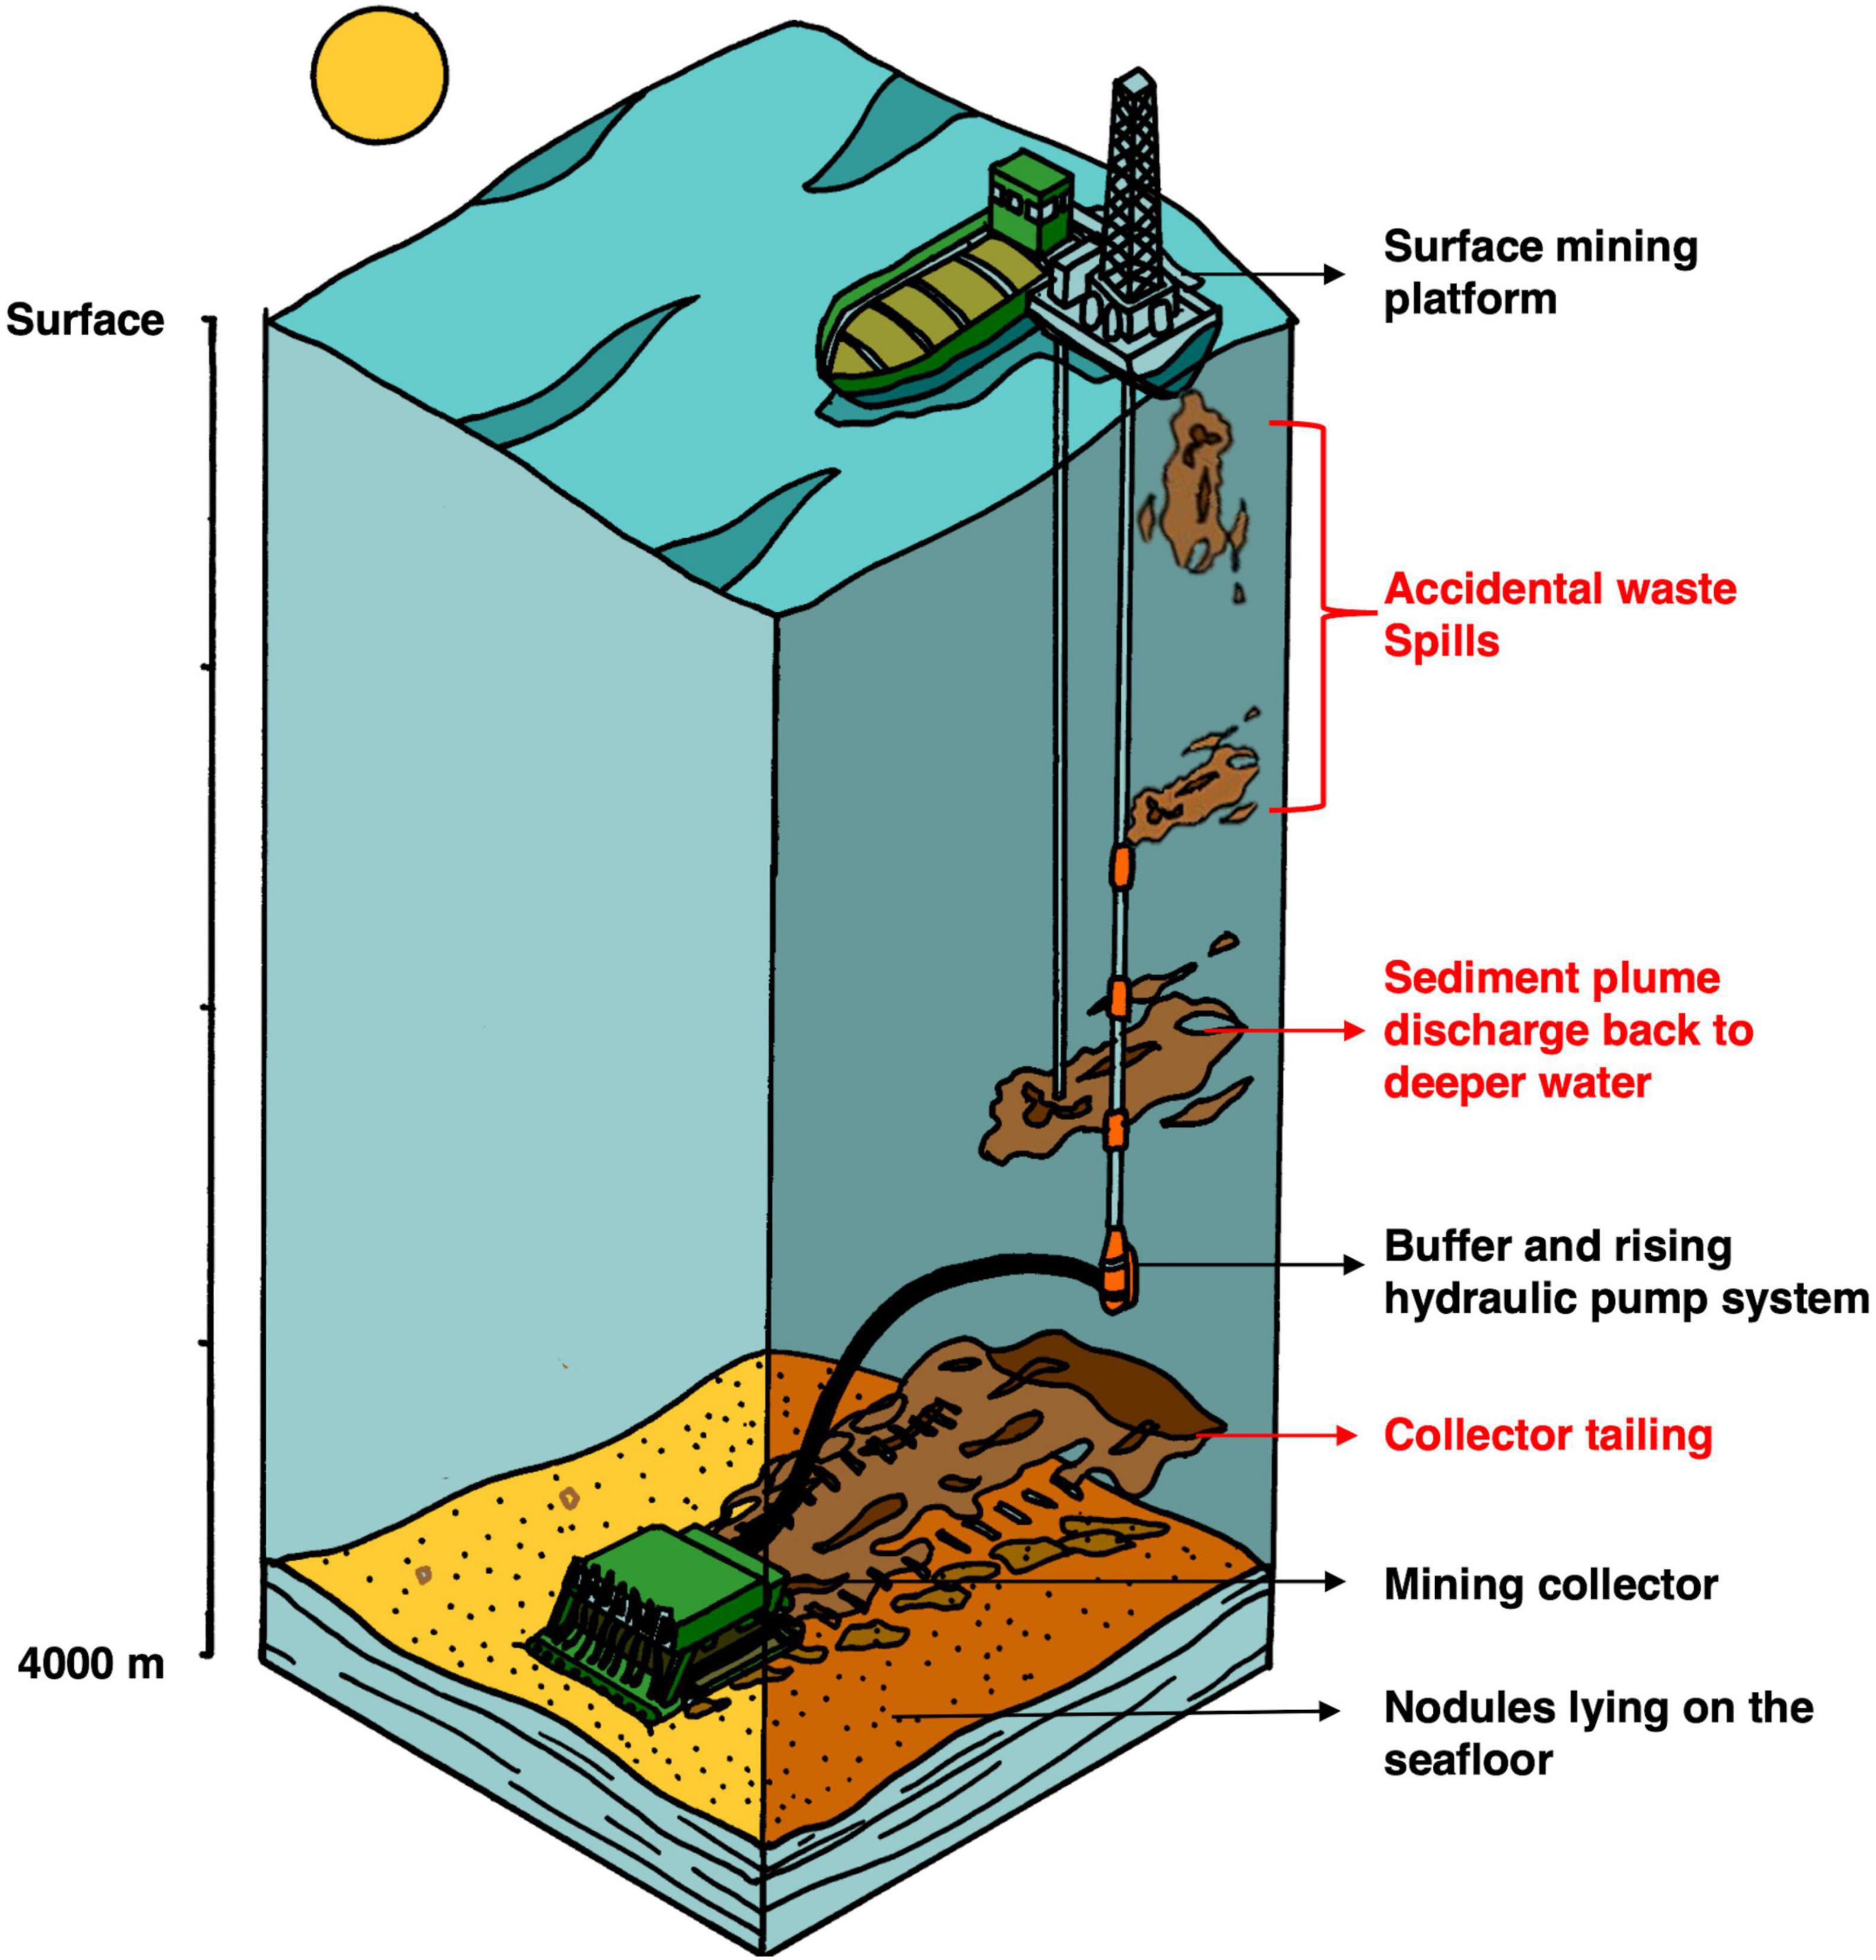
Figure 2. Schematic drawing of deep-sea manganese mining concept. Figure adapted from Gillard (2019).
Phytoplankton fix carbon dioxide into particulate organic carbon (POC) via photosynthesis. The majority of this POC is grazed by zooplankton and remineralized by bacteria within the upper few hundred meters of the water column (Martin et al., 1987). However, a fraction leaves the surface ocean and sinks through the water column as fecal pellets, living, resting (e.g., cyst) or decaying organisms resulting in amorphous aggregates called “marine snow” (particles > 0.5 mm) (e.g., Simon et al., 2002; Turner, 2002, Turner, 2015; Spilling et al., 2006; Elovaara et al., 2020). Combined, these processes are known as the “biological carbon pump”—an important part of the global CO2 cycle (Fowler and Knauer, 1986; Passow and De La Rocha, 2006). Typically, POC transformation and turnover processes during the sinking of organic aggregates result in just ∼1% of POC produced in surface waters reaching the deep seafloor (Lutz et al., 2002).
Particle camera systems (Honjo et al., 1984; Asper, 1987; Ratmeyer and Wefer, 1996; Gorsky et al., 2000) have significantly improved during the past three decades. It is now possible to develop higher resolution camera systems capable of imaging smaller aggregates than previously possible (Picheral et al., 2010; Schmid et al., 2016; Giering et al., 2020). The advantage of particle cameras lies in their non-destructive nature of acquiring particle size-distribution and abundance, in situ. Camera systems can capture both short- and long-term dynamics from individual vertical profiles and moored deployments equipped with camera systems. Previous studies have combined sediment trap fluxes with particle camera data to obtain high-resolution fluxes (e.g., Guidi et al., 2008; Iversen et al., 2010; Nowald et al., 2015; Seifert et al., 2019). Sediment traps collect settling particles at a particular depth and area on daily to weekly intervals over long time periods. But while traps only collect sinking particles, camera systems image both suspended and sinking particles throughout the water column. This provides data on the export history and particle distribution at different depths with a high spatial and temporal resolution (e.g., Picheral et al., 2010; Kiko et al., 2017; Markussen et al., 2020).
So far, most studies in the CCZ have focused on benthic environments, with little attention given to the wider benthic-pelagic coupling influences such as phytoplankton composition, water-column particle distribution, particle transport processes and carbon flux from the surface ocean to the deep sea. Such data are essential for environmental impact assessments, particle export model calibration and to gain understanding of how mining operations may impact and modify pelagic ecosystems in the CCZ.
In the present study, we used a high-resolution profiling camera system to study short-term vertical particle size-distribution and abundance from the surface ocean down to the seafloor of the German license area for nodule exploration, in the CCZ. This study aims to: (i) provide an overview of the oceanographic background of the area, (ii) describe how particulate matter is distributed in the water column, (iii) associate fundamental transport or alteration processes based solely on particle size-distribution and abundance variations through the water column and finally (iv) reappraise the risk of mining waste released into the pelagic environment.
Materials and Methods
Field Sampling
A vertical profiling camera system was deployed during the RV Sonne cruise SO-262 in April/May 2018 to the eastern German license of the CCZ (north-eastern Pacific Ocean; Figure 1 and Table 1). Six deployments including surface (0–400 m) and deep-water column profiles (0–4,000 m) were carried out in three working areas (WA; 1–3). WA-1 was chosen as it corresponds to the location of a mining collector-vehicle test by the Belgian contractor DEME-GSR, that took place during April 2021. WA-2 is located in an economically viable nodule field, and WA-3 is designated as a “Preservation Reference Zone (PRZ).” One surface deployment was performed outside of the German license area during the retrieval of a deep-sea mooring from the United Kingdom license area (referred to henceforth as WA-4).
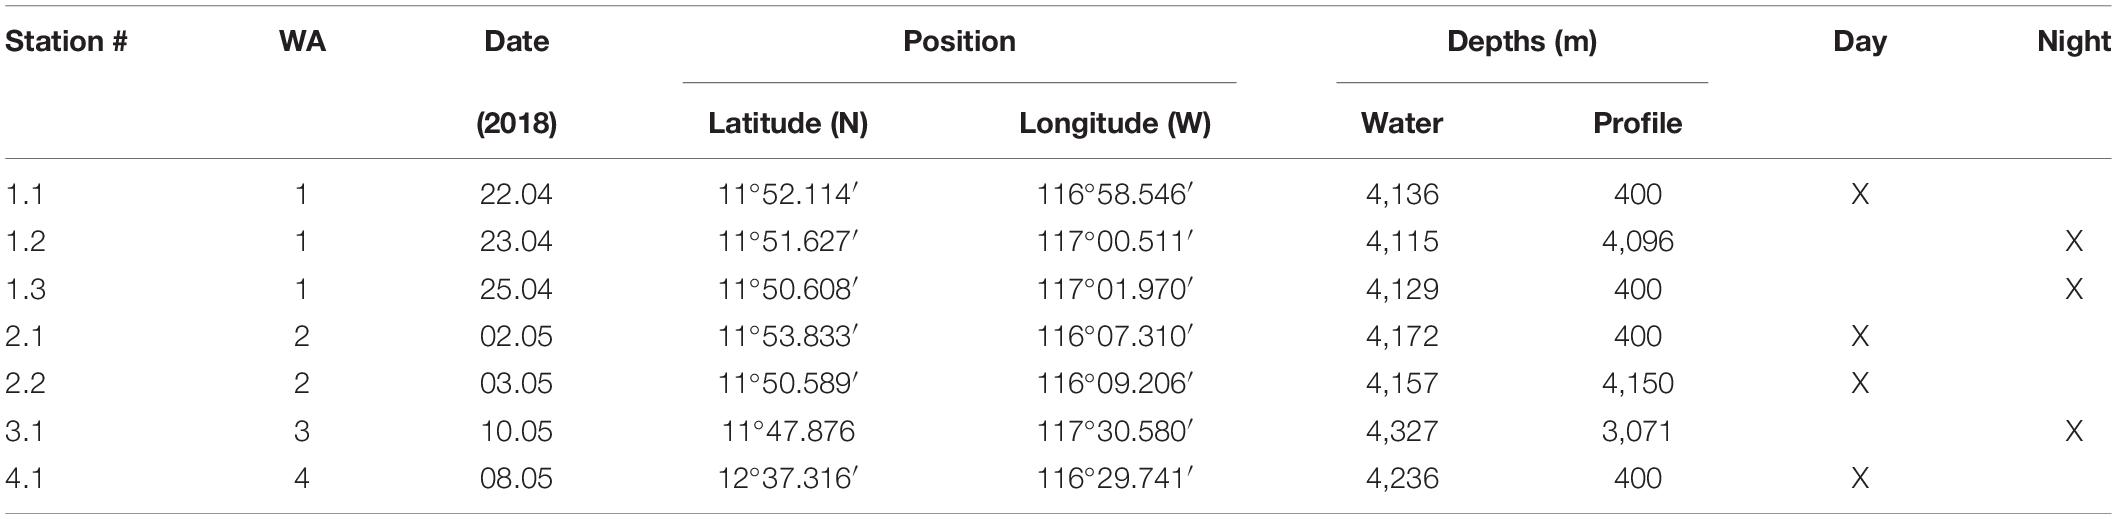
Table 1. Station list description.
Hydrography
Oceanographic data were collected during all deployments using the onboard CTD-Rosette sampler. The CTD (SBE 19 plus V2 SeaCAT) was equipped with an oxygen sensor (Sea-Bird SBE 43), a fluorescence sensor (Wet Labs ECO), a PAR/irradiance sensor (Biospherical QCP2300), and a Seapoint turbidity sensor. Seasoft (version 2.4.0) was used for data processing, and downcast profiles were binned at 1 m intervals. Identification of water masses were made using temperature, salinity, and density parameters following Wijffels et al. (1996).
Camera System Description
The particle camera system (PartiCam; Figure 3) was developed based on the improved version of the ParCa system (Nowald et al., 2006). The PartiCam was designed for deployments down to 6,000 m and is fully autonomous. The system is composed of two separate pressure housings, one containing the camera and one containing the flash.
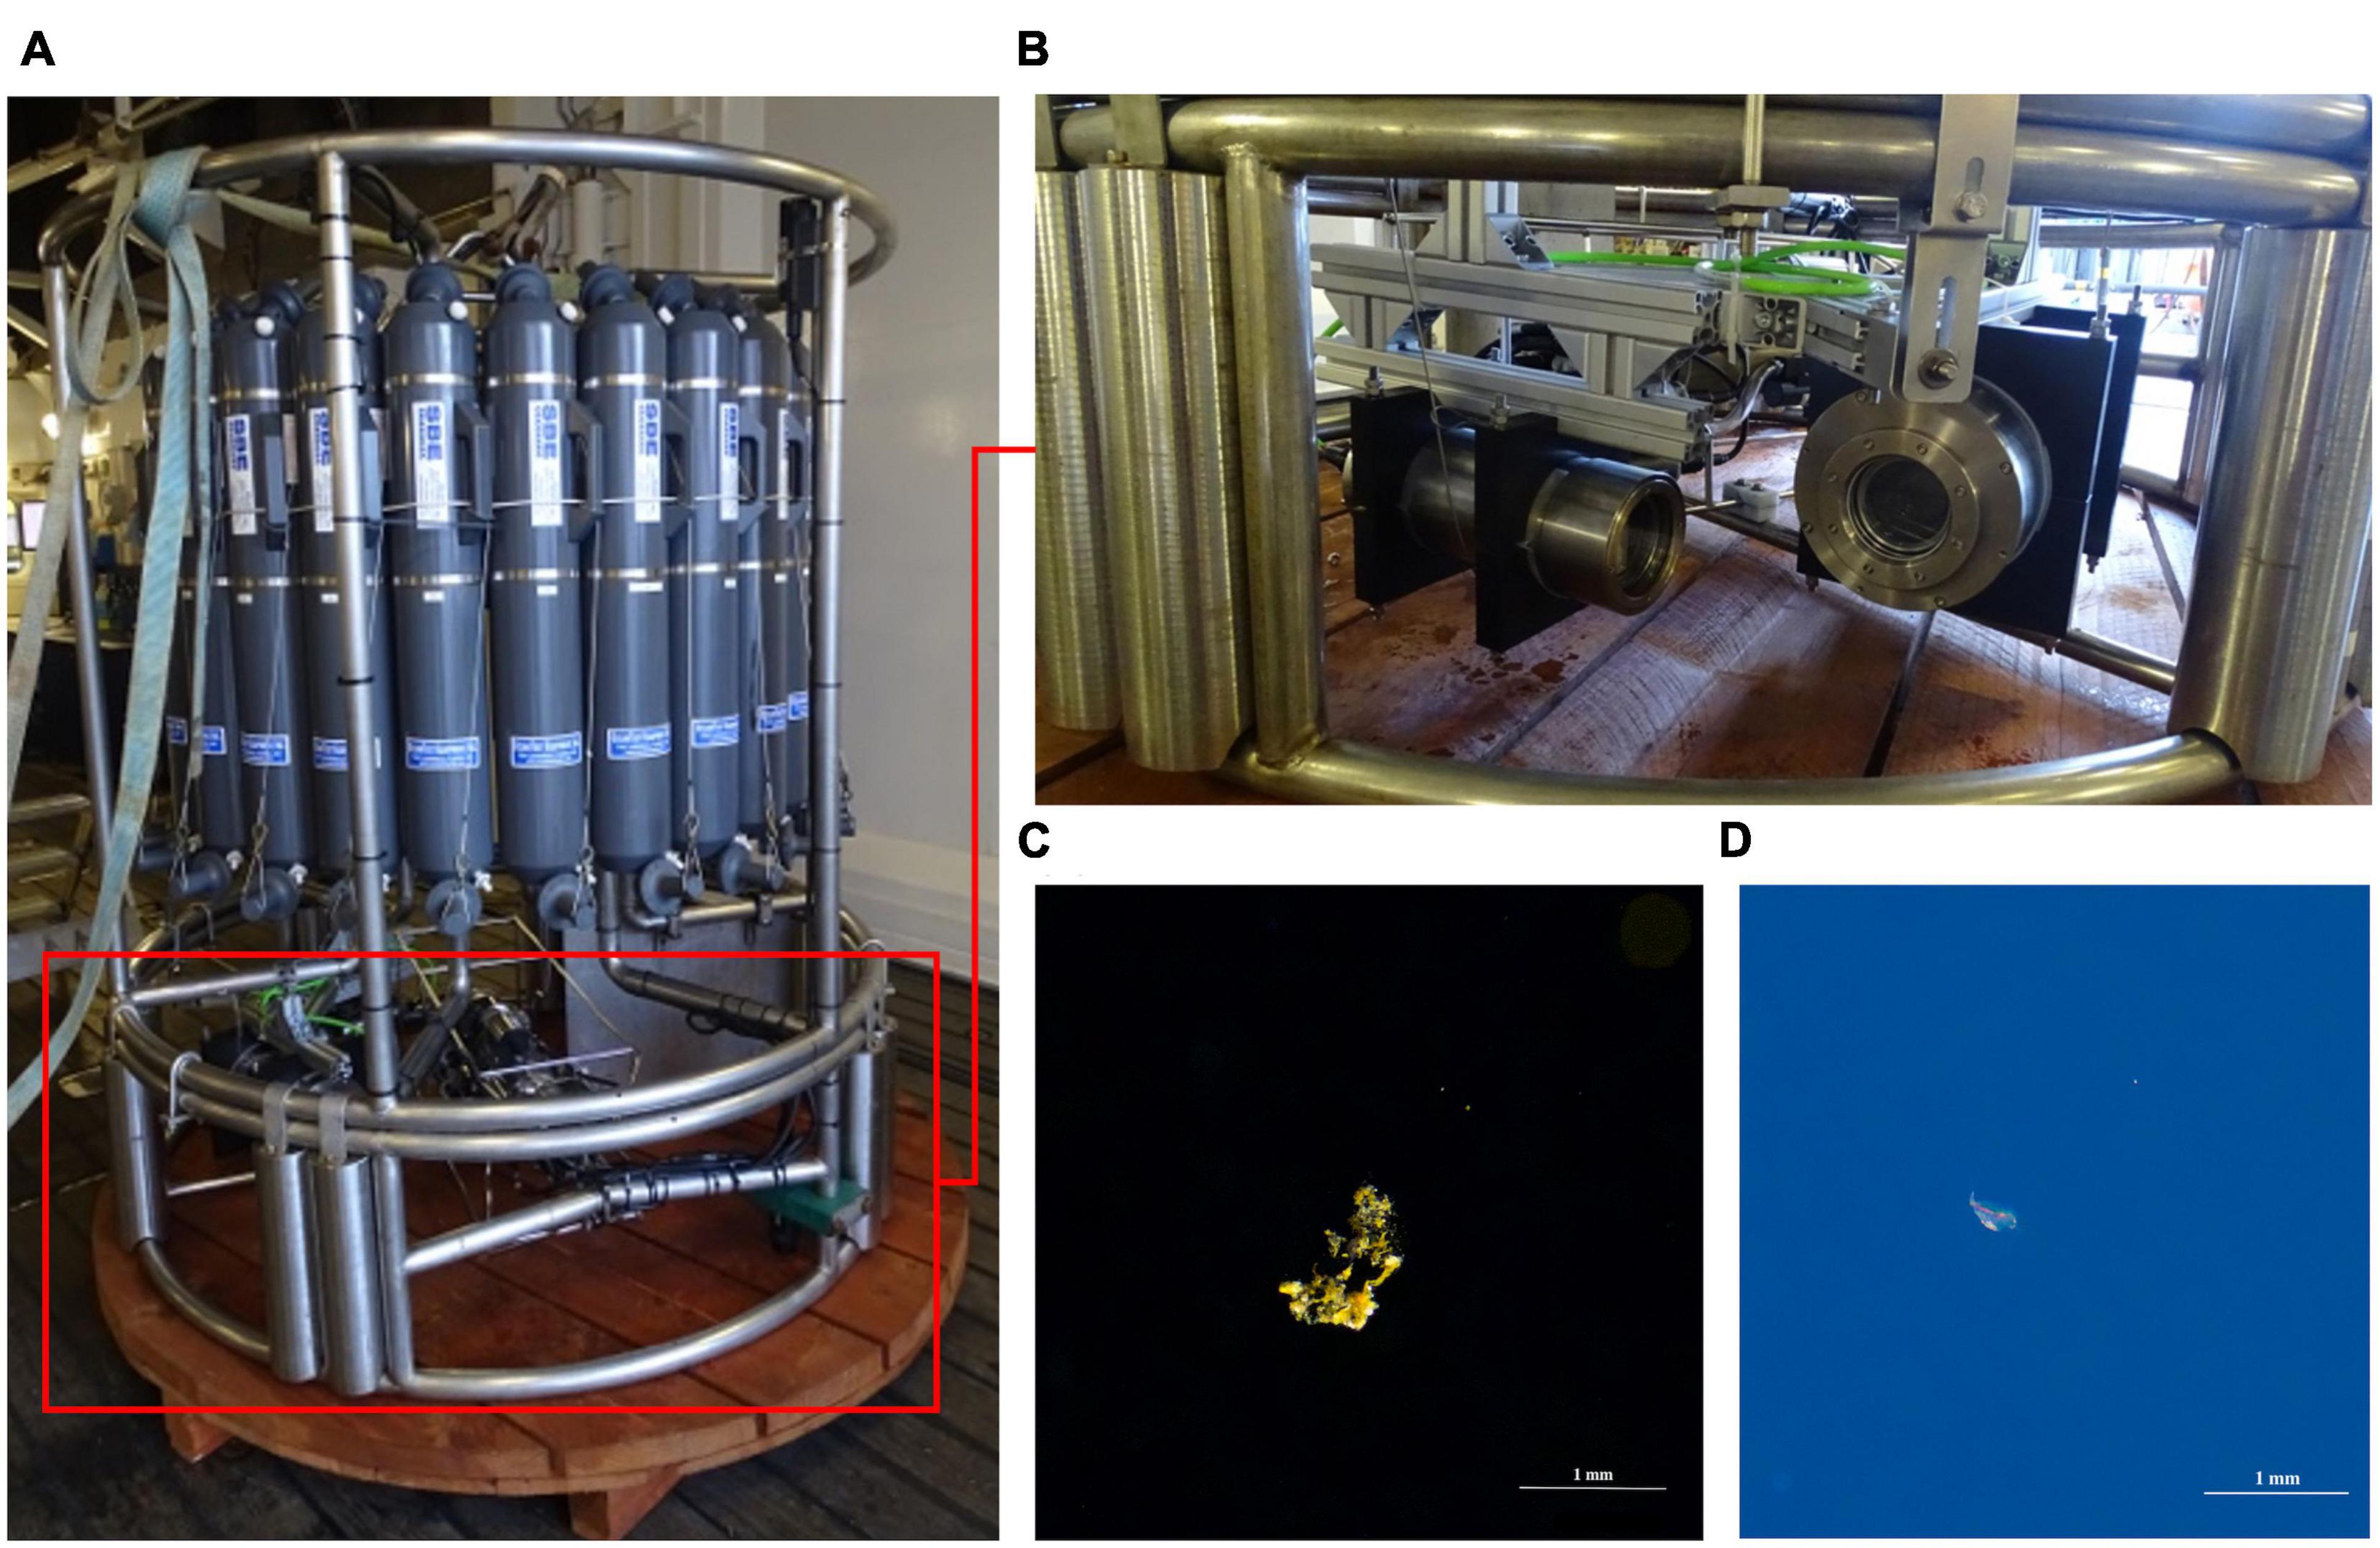
Figure 3. (A) CTD-Rosette in the hangar of RV Sonne. (B) The PartiCam installed in the lower section of the CTD-Rosette next to the CTD. Examples of particles captured by the PartiCam system: marine snow (C) and a swimming copepod (D).
The PartiCam was equipped with a Canon EOS 760D SLR with a resolution of 24.2 megapixels and a Canon EF-S 60 mm f 2.8 macro lens. The use of a macro lens allows the images to be taken closer to the lens and provides a higher optical resolution, and a more even illumination of the sample volume. A collimated light source (Yongnuo YN-468 II Speedlite strobe) was mounted perpendicularly 20 cm from the camera. A short flash duration of (1/200 s) allowed the acquisition of images containing particles that were in focus without motion blur effects (Figure 3C). Originally, the equipment was set up to maximize the volume of water captured per image by the camera (0.6 l). First profiling trials indicated that the system was working, but no particles were detected. We hypothesized that either the particle abundance was extremely low or that the particle size detection range established by the camera setup was insufficient. Images of particles were later acquired successfully by bringing the focal plane closer to the lens and lighting, reducing the depth of field. This resulted in a field of view of 4.0 × 6.0 × 0.7 cm (width × height × depth), corresponding to a sampling volume of 16.8 × 10⁻³ l. The minimum particle diameter that can be detected with this optical setup is 0.03 mm with a pixel resolution of 0.01 mm⋅pixel–1.
The system was mounted inside the lower section of the RV Sonne CTD-Rosette carousel next to the CTD sensor (Figure 3). The position inside the carousel’s frame was best suited for imaging particles without larger disturbances. The mounting position also provided protection for the PartiCam system in case the CTD-Rosette collided with the ship’s hull. Prior to deployment, the system was programmed using mission planner software to trigger the PartiCam at given time intervals (10 s) by a microcontroller. The deployments were performed at a winch speed of 1 m⋅s–1, which translated to trigger depth intervals of 10 m. All images were stored internally and downloaded using an external USB port after each deployment.
Particle Size Detection Limits
Camera system limitations are mainly set by their optical resolution (minimum particle size-spectra), frame acquisition speed (total volume imaged per depth interval) and water column characteristics (size-specific particle concentration). Each camera system provides snapshots in time and space from a discrete fraction of the complete particle size-spectra, throughout the water column (Markussen et al., 2020). The PartiCam was set to its highest resolution to capture smaller-sized aggregates, however the upper size-detection limit should be considered due to the scarcity of large aggregates in the water column and the relatively small, imaged water volume per image acquired by the camera system.
To date, the only camera profiles obtained close to our study area were acquired by the Underwater Vision Profiler 5 in 2011 (UVP5, unpublished, Supplementary Table 6). This existing data set (12 profiles, Supplementary Figure 1) was downloaded from the EcoTaxa database.1 To compare the accuracy of the PartiCam with the UVP5 system, we calculated particle count statistics, (as a percentage of each particle size-class captured by the PartiCam relative to the UVP), based on the compared sampled volume, between the two camera systems (Supplementary Table 7).
Both the UVP5 and the PartiCam observed decreasing particle counts with increasing particle size and depth (Supplementary Figure 2). The size-specific particle concentrations were comparable between the two camera systems for similar particle size-classes. Hence, we consider that the image volume and the optical resolution of the PartiCam were sufficient to provide reliable data for particle size-distribution and abundance of aggregates in the CCZ. Statistically reliable data could only be obtained for large aggregates (particle size-spectra up to 400 μm) in the upper 100 m of the water column, due to their scarcity. When a full water-depth profile was performed, reliability for the detection of these large aggregates was reduced to 323 μm (Supplementary Figure 15).
Increasing the acquisition frame rate (Supplementary Table 8) did not appreciably improve the upper size-range of the particle size-spectra. In oligotrophic water, larger particles (> 500 μm) are often rare (Jackson and Checkley, 2011), as was observed both by PartiCam and the UVP5 (Supplementary Figure 2). However, due to the higher optical resolution of the PartiCam compared to the UVP5, we were able to detect smaller particles in the CCZ.
Image Analysis
We used the MATLAB (R2016a) software package “Image Processing toolbox” as described by Iversen et al. (2010) and the architecture code of Markussen (2016) to remove the image background and extract the size of the particles in each image. Only downcast profiles were used for image analysis, to avoid any water disturbance from the CTD-Rosette. Background illumination was corrected using a rolling set of three pictures to accurately estimate inconsistencies in illumination throughout the profile. The median value of each pixel was assumed to be the background intensity and was subtracted from that set of pictures. A thresholding value was manually determined for the entire profile set based on a combination of the following methods: (1) the pixel gray pixel intensity, which corresponds to the maximum gradient between the background and the particle boundary (Supplementary Figures 3A,B) and, (2) by allowing a maximal thresholding range of the gray pixel intensity level corresponding to a minimal noise detection (single or double pixel) after thresholding (Markussen, 2016; Supplementary Figures 3C–E). An average threshold intensity of 0.24 was found to be optimal for our entire dataset. The area of each particle was converted to equivalent spherical diameter (ESD) and equivalent spherical volume (ESV). Zooplankton were manually removed from the images and excluded from the measurements. All particles from one image were binned into 11 predetermined size classes (Supplementary Table 1).
To illustrate the change of particle size with increasing depth, the number of particles per size-bin were converted into their frequency as a percentage. This conversion was made due to the broad range of particle abundances and sizes captured by the camera system (Nowald et al., 2006). This approach allowed a better illustration of changes in abundance and size-distribution with increasing depth, compared to using absolute particle numbers.
Satellite Imagery-Derived Parameters
The moderate resolution imaging spectroradiometer (MODIS) satellite datasets used were downloaded from the Ocean Biology Processing Group at NASA’s Goddard Space Flight Center.2 Monthly (January 2018–December 2018) Chla, sea surface temperature (SST, 11 μ night-time) and POC were used. Ocean net primary production (NPP) data were retrieved from the vertically generalized production model (VGPM; Behrenfeld and Falkowski, 1997a,b) estimated from the Ocean Productivity website.3 The average value of each parameter was extracted from the area corresponding to the German license area (Figure 1, red polygon) using SeaWiFS Data Analysis System software (SeaDAS version 7.5-1; O’Reilly et al., 1998). Monthly mean climatology (2002–2018) datasets (MODIS) were used as reference values for comparison with 2018 datasets.
Statistical Analysis
MATLAB (R2016a) software was used for the statistical analysis of the datasets. For every deployment, Pearson (R2) and Spearman correlation coefficient (Rs, significance threshold using a P-value < 0.001) was applied to determine the interdependence between two parameters from the PartiCam system (median diameter (D50), abundance) and the CTD (turbidity, fluorescence and Chla).
Results
Oceanographic Conditions
A hydrographic summary of the eastern German license area is shown in Figure 4. The sea surface water parameters derived from monthly satellite imagery analysis (Figure 4A) indicate a pronounced seasonal signal as shown by the variation of sea surface temperatures (SST, amplitude of 1.6°C). The highest SST was observed during June (28.5 ± 0.4°C) and declined at the start of the hurricane season to reach a colder period from November to March (27 ± 0.1°C). Primary production (as indicated by changes in chlorophyll-a; Chla) followed an inverse trend in comparison to SST, with maximum productivity (0.17 ± 0.03 mg⋅m–3 equivalent to net primary productivity of 379 ± 26.2 mg⋅C⋅m–2⋅day–1) at the end of the colder period of the year, during March. In contrast to the monthly climatology 2002–2018 (dotted lines in Figure 4A), 2018 exhibited a net increase of 45% in primary productivity, reaching up to 0.21 ± 0.03 mgC⋅m–3 at the end of the hurricane season (October–November).
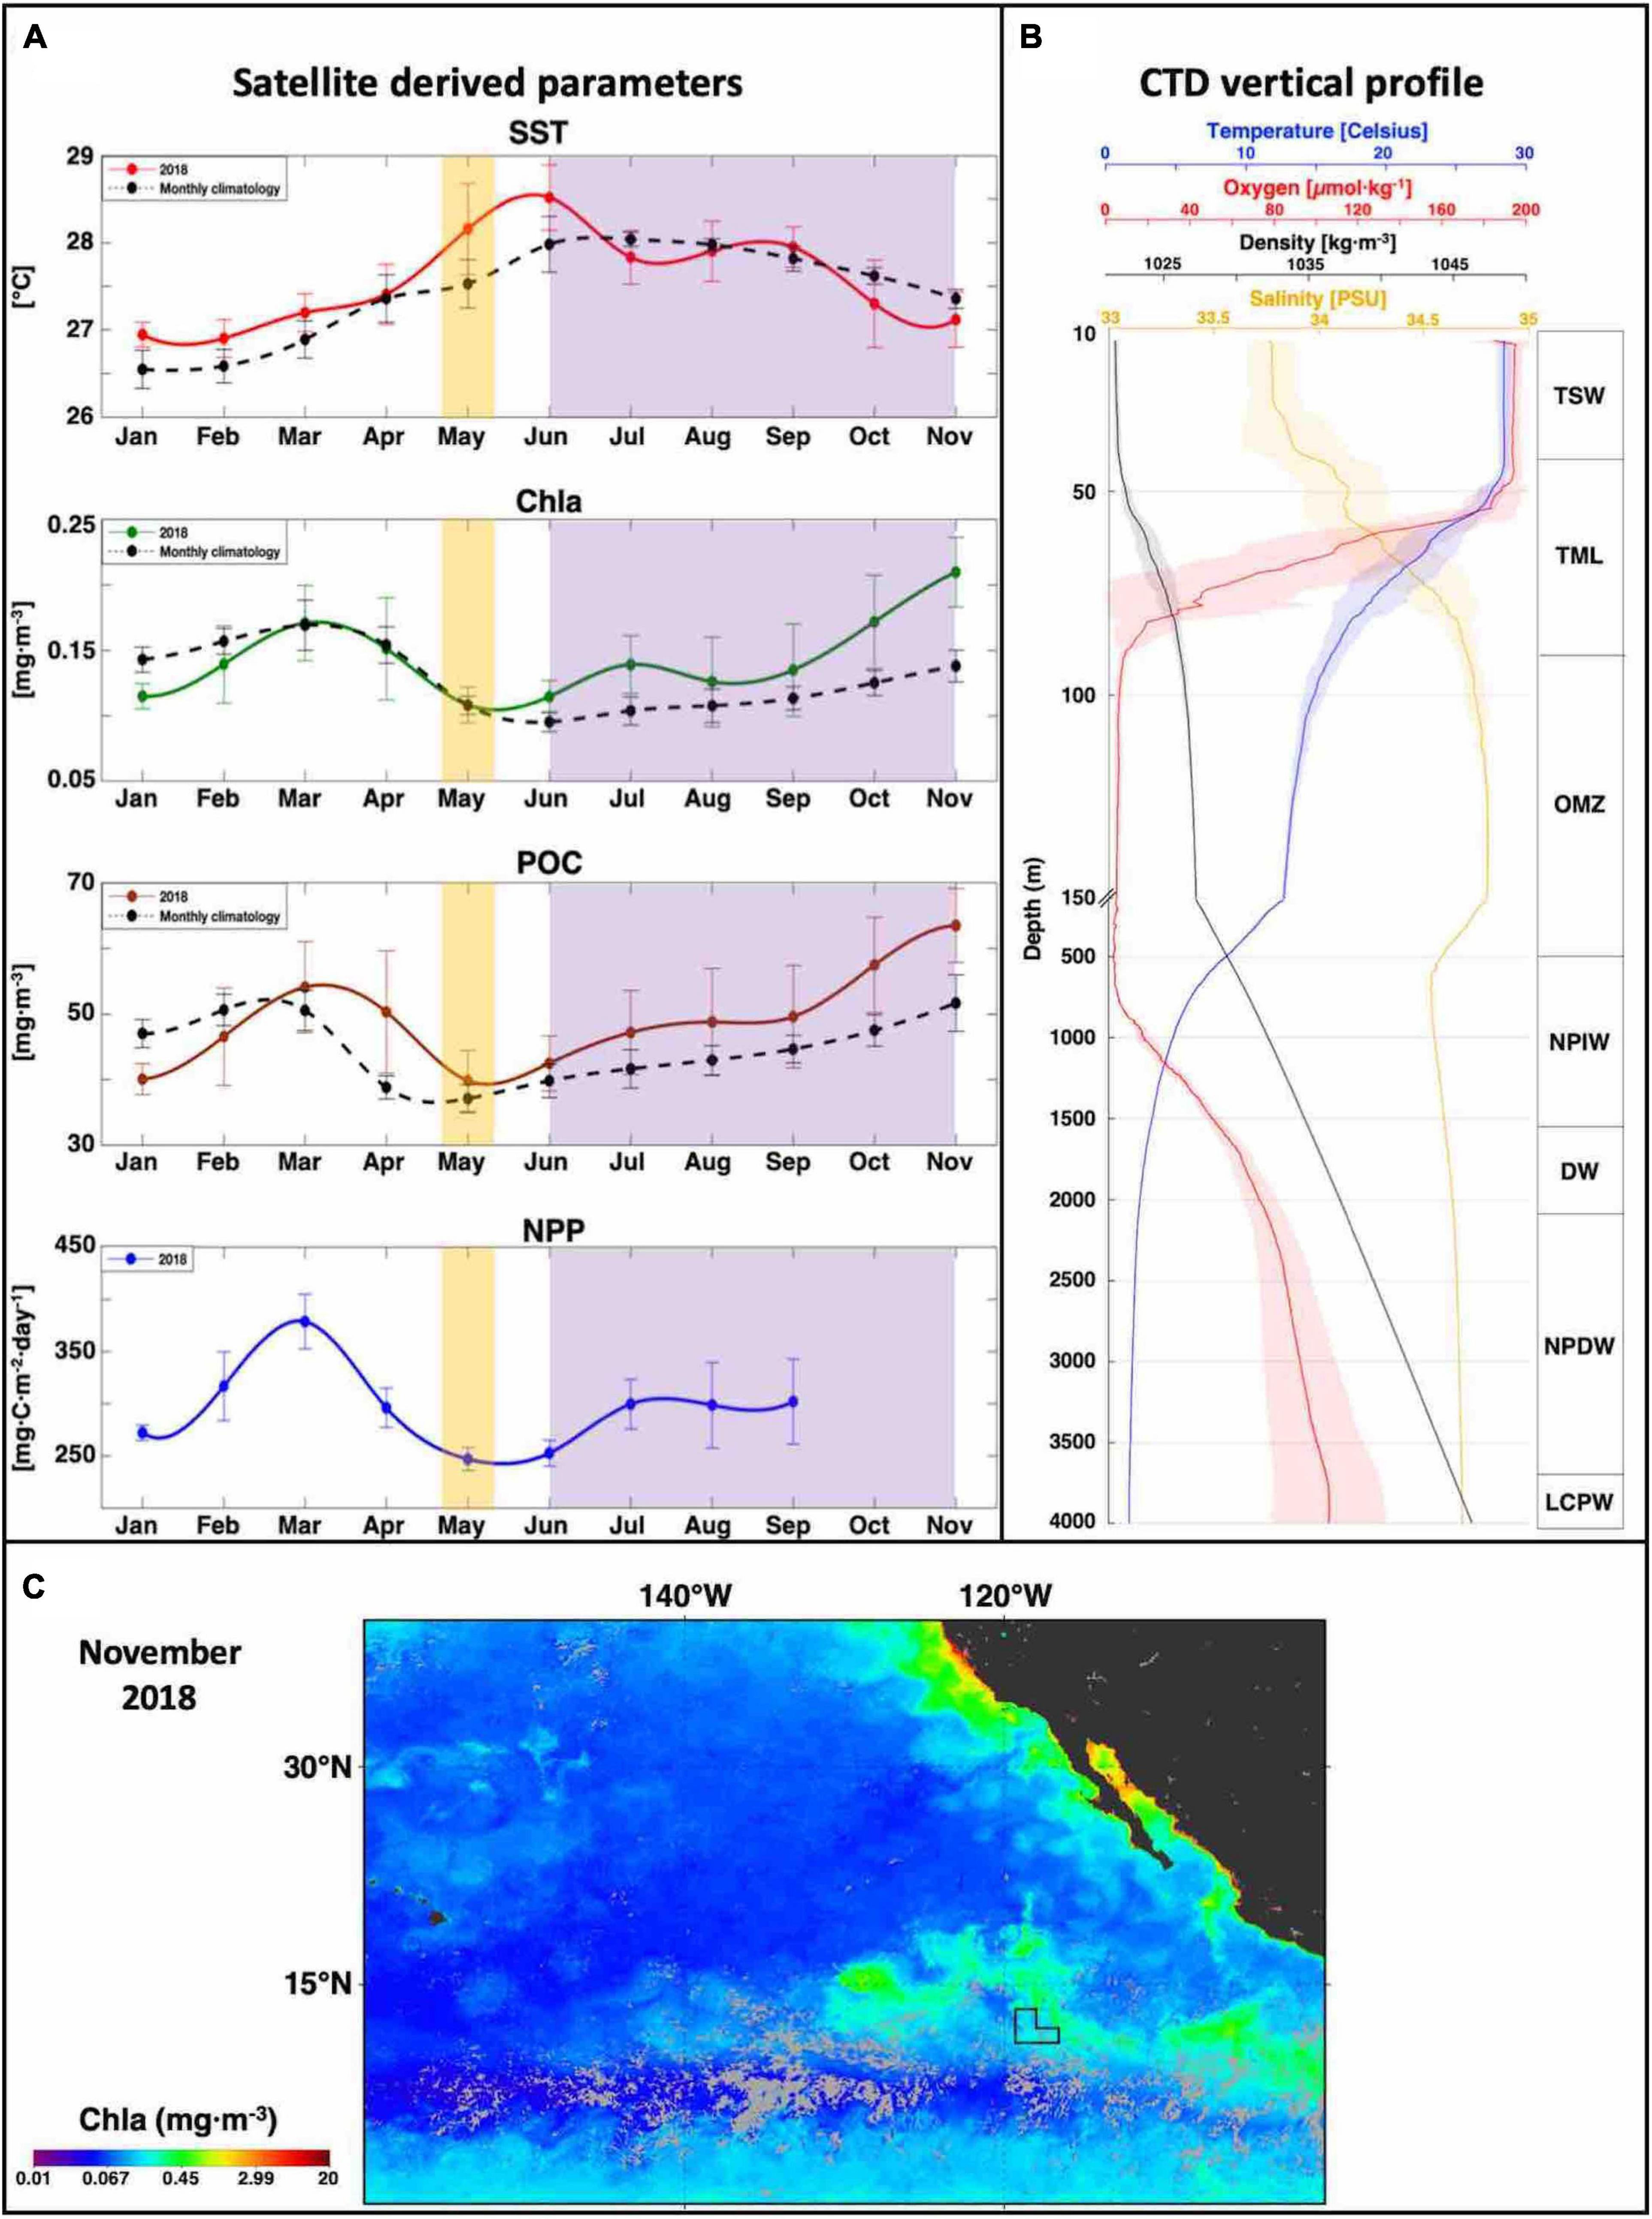
Figure 4. Oceanographic condition of the eastern German license area in CCZ. (A) Surface water characteristics using satellite (MODIS) derived parameters including sea surface temperature (SST), Chlorophyll a (Chla), particulate organic carbon (POC) and net primary production (NPP). Yellow shaded areas represent the timeframe during which all profiles were acquired, and purple shaded areas indicate the hurricane season (Neumann, 1993). (B) Vertical water mass characteristics using CTD downcast profiles. Bold lines represent the median values and shaded areas indicate the variation from all profiles. The vertical water mass distribution is shown on the right-hand side: Tropical Surface Water (TSW), Thermocline Layer (TML), Oxygen Minimum Zone (OMZ), North Pacific Intermediate Water (NPIW), Deep Water (DW), North Pacific Deep Water (NPDW) and Lower Circumpolar Water (LCPW). (C) November 2018 surface Chla distribution in the north-eastern Pacific. Light gray corresponds to cloud coverage and the eastern German license area is indicated by an L-shaped black polygon.
CTD casts obtained from 22nd April until 10th of May throughout the entire water column are presented in Figure 4B. The temperature profiles indicated the presence of a shallow mixed layer down to 40 m depth, followed by a sharp temperature gradient (maximum thermocline strength = 0.6°C⋅m–1) down to 94 ± 10 m depth. Salinity increased steeply from the surface (33.74 ± 0.08 PSU) to reach a maximum value of 34.8 ± 0.01 PSU at around 134 ± 5 m depth. The combination of a strong halocline/thermocline (located at 67 ± 3 m depth) resulted in a strengthening of the sub-pycnocline which separated the epipelagic layer from the deeper, stable layer. The deeper layer was characterized by a slowly decreasing temperature (average Δ of 0.3°C⋅100 m–1) and nearly uniform salinity (average Δ of 0.002 PSU⋅100 m–1). The surface water was well oxygenated within the mixed layer and reached 187.35 ± 25.9 μmol O2⋅l–1, equivalent to 93 ± 13% oxygen saturation. The oxygen concentration started to decrease at a depth that coincided with the thermocline. The oxygen minimum zone (OMZ; Figure 4B) was well established and characterized by an upper (94 ± 9 m) and a lower oxycline (474 ± 8 m) in which the oxygen concentration dropped below 10 μmol O2⋅l–1 (< 4% saturation). Inside the OMZ, the suboxic water was on top of a layer containing a very low oxygen concentration (< 4.5 μmol⋅O2⋅l–1; 0.1% saturation). At the lower oxycline, oxygen concentration started to increase gradually with increasing depth to 97.2 μmol O2⋅l–1 at 4,000 m depth. The density profile (Figure 4B) depicts slight variation throughout all CTD casts, four distinctive water mass signatures were identified and are presented in Table 2.
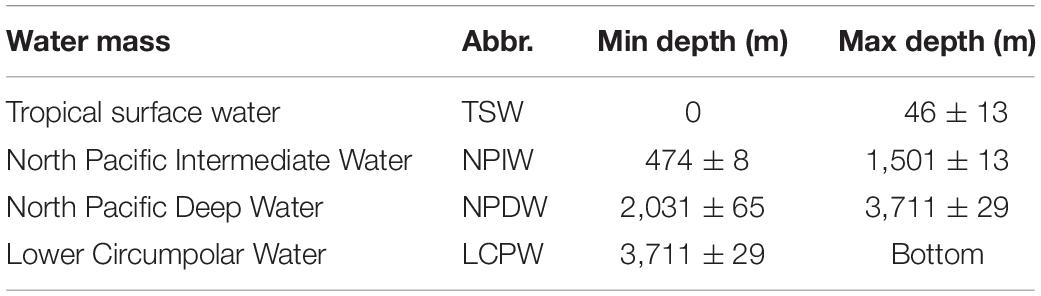
Table 2. Water mass structure of the eastern German License area.
Based on a larger oceanic context, the German license area is located in the transition zone (10° N) between the North Equatorial Current (NEC) and the North Equatorial Counter Current (NECC). Satellite imagery (Figure 4C and Supplementary Figure 4) indicated that surface productivity was influenced by enriched water transported westward from the coast of southwest Mexico and Guatemala through the German license area of the CCZ. During the hurricane season (June–November; Neumann, 1993), a clear separation was observed between the German license area and the Equatorial and North Pacific Gyre Systems.
Shallow Camera Profiles
Analysis of all stations, from the surface water down to 400 m depth, showed evident spatial variability (Figure 5). In the German license area (WA-1 and WA-2), this tendency was observed for satellite analysis of surface Chla (8 rolling days; Supplementary Table 2) which also depicted temporal variability. An increase of surface Chla concentration until mid-May was followed by a general decrease over time and space. In contrast, surface Chla remained constant for station 4.1 (WA-4) and decreased for station 3.1 (WA-3), over time. A positive correlation (Rs = 0.86 ± 0.06, R2 = 0.73 ± 0.06) between turbidity and fluorescence was observed at all stations (Figures 5A,B and Supplementary Table 3). On average, particle abundance (Figure 5C) in the upper water column (< 400 m) varied between stations (WA-1: 29 part⋅l–1; WA-2: 119 part⋅l–1; WA-3: 179 part⋅l–1; WA-4: 149 part⋅l–1) but followed a general increase over the sampling period. Median particle size (based on the ESD, Figure 5D) was relatively constant (96 ± 12 μm) apart from stations 1.2 and 1.3, which showed a smaller median particle size of 30 μm. No aggregate larger than 700 μm was observed for any station.
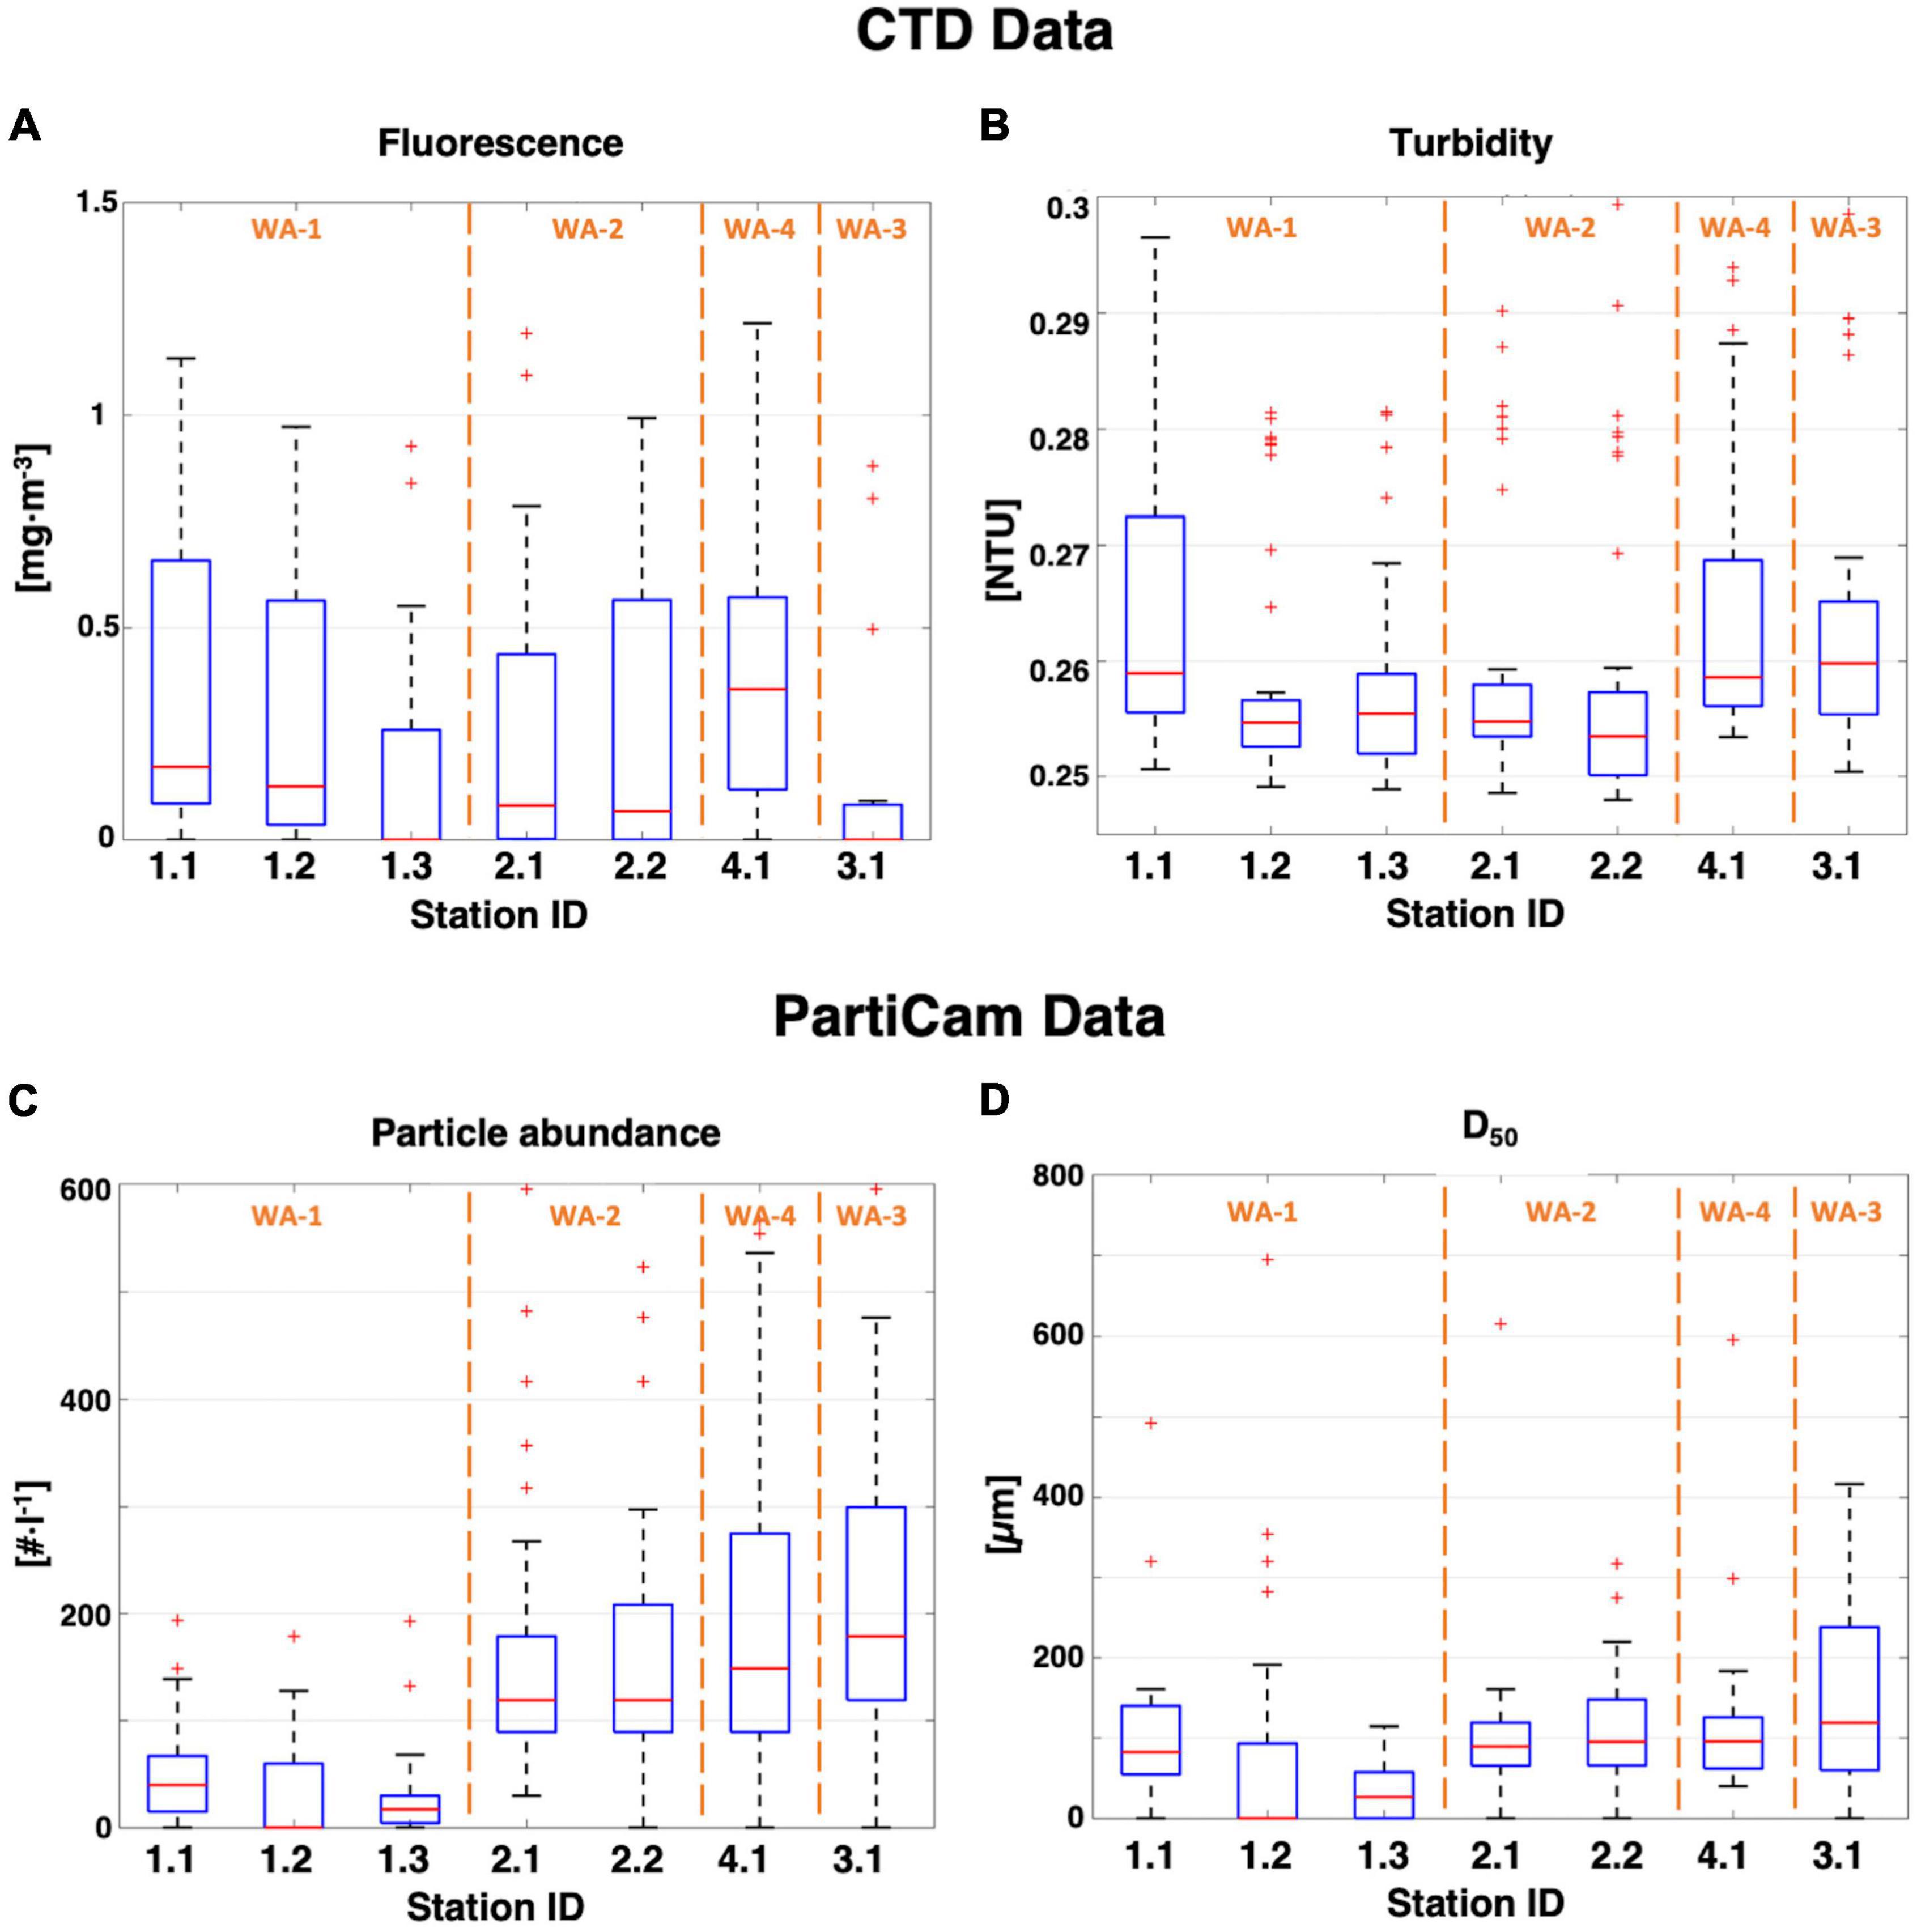
Figure 5. Box plots of all CTD and PartiCam data from the shallow stations. (A) Chla and (B) turbidity data were measured with the CTD. (C) Particle abundance and (D) median diameter values were extracted from the PartiCam pictures. Upper and lower boxplot whisker represent the maximum and minimum values of the dataset. Interquartile range is shown as the blue box (50% of the dataset). Red line indicates the median value and red “+ “ are outliers. Working areas are shown in orange.
Here, the focus is on station 2.1 because it reflects the particle properties seen in most of the camera profiles (Figure 6). Results from other deployments are provided in Supplementary Figures 5–10. PartiCam data from station 2.1 were characterized by a large variation of the particle distribution in the upper 150 m, in comparison to the deeper section (Figure 6A). The maximum particle abundance was found at a depth of 65 m where particle abundance reached 595 part⋅l–1 and particle size distribution varied the most, ranging between 34 and 694 μm (Figure 6B). Below 100 m depth, an increase in particle abundance was observed at 125 m depth (upper section of the OMZ), reaching an abundance of 417 part⋅l–1. Below the subsurface particle maximum (145 m), the particle size-distribution shifted toward increasing particle sizes up to a maximum of 354 μm, corresponding to 50% of the total size distribution, in terms of abundance. Below 200 m depth, the particle abundance fluctuated less, with an average abundance of 113 ± 53 part⋅l–1 and 70% of the particles being smaller than 66 μm. Overall, the size–frequency distribution indicated that smaller particles (≤ 66 μm) were dominant and provided the majority of the particle abundance, with an average of 59 ± 27% throughout the water column. Medium-sized particles (66–295 μm) contributed to 36 ± 25% of the particle abundance, while particles larger than 300 μm in diameter were rarely found (4 ± 11%). A significant linear correlation (Rs = 0.7 ± 0.1; p < 0.001; Supplementary Table 3) was found between both turbidity and fluorescence and the particle abundance. This relationship was more pronounced at the pycnocline and oxycline depth (≈ 65 m) where the Chla (1.19 mg Chla⋅m–3), particle abundance (595 part⋅l–1) and turbidity (0.3 NTU) reached their maximum values (Figure 6).
Figure 6. Particle abundance, size distribution and oceanographic parameters from station 2.1. (A) Vertical cross section from CTD data (fluorescence, turbidity, oxygen, density) and particle abundance vs. depth. (B) Particle size-distribution expressed as percent frequency vs. depth. Pink square: statistically low particle count probability.
Deep-Water Camera Profiles
Particle properties (turbidity, abundance, median particle size [D50]) acquired from deep-ocean profiles (400–4,000 m; Figure 7) indicated much less spatial variability in comparison to the shallow PartiCam profile (0–400 m; Figure 5). Turbidity was relatively constant between the different working areas (WA 1–3), with an average turbidity of 0.273 ± 0.002 NTU. Low particle abundances were measured in WA-1 (stations 1.2 and 1.3), similar to the surface water layer (Figure 5C) with 40 ± 20 part⋅l–1 (D50 = 48 ± 5 μm). A threefold decrease in particle abundance was observed for WA-2 (station 2.2; D50 = 79 μm) and WA-3 (station 3.1; D50 = 94 μm), down to 40 and 60 part⋅l–1, respectively. No significant correlation was found between any of the parameters investigated.
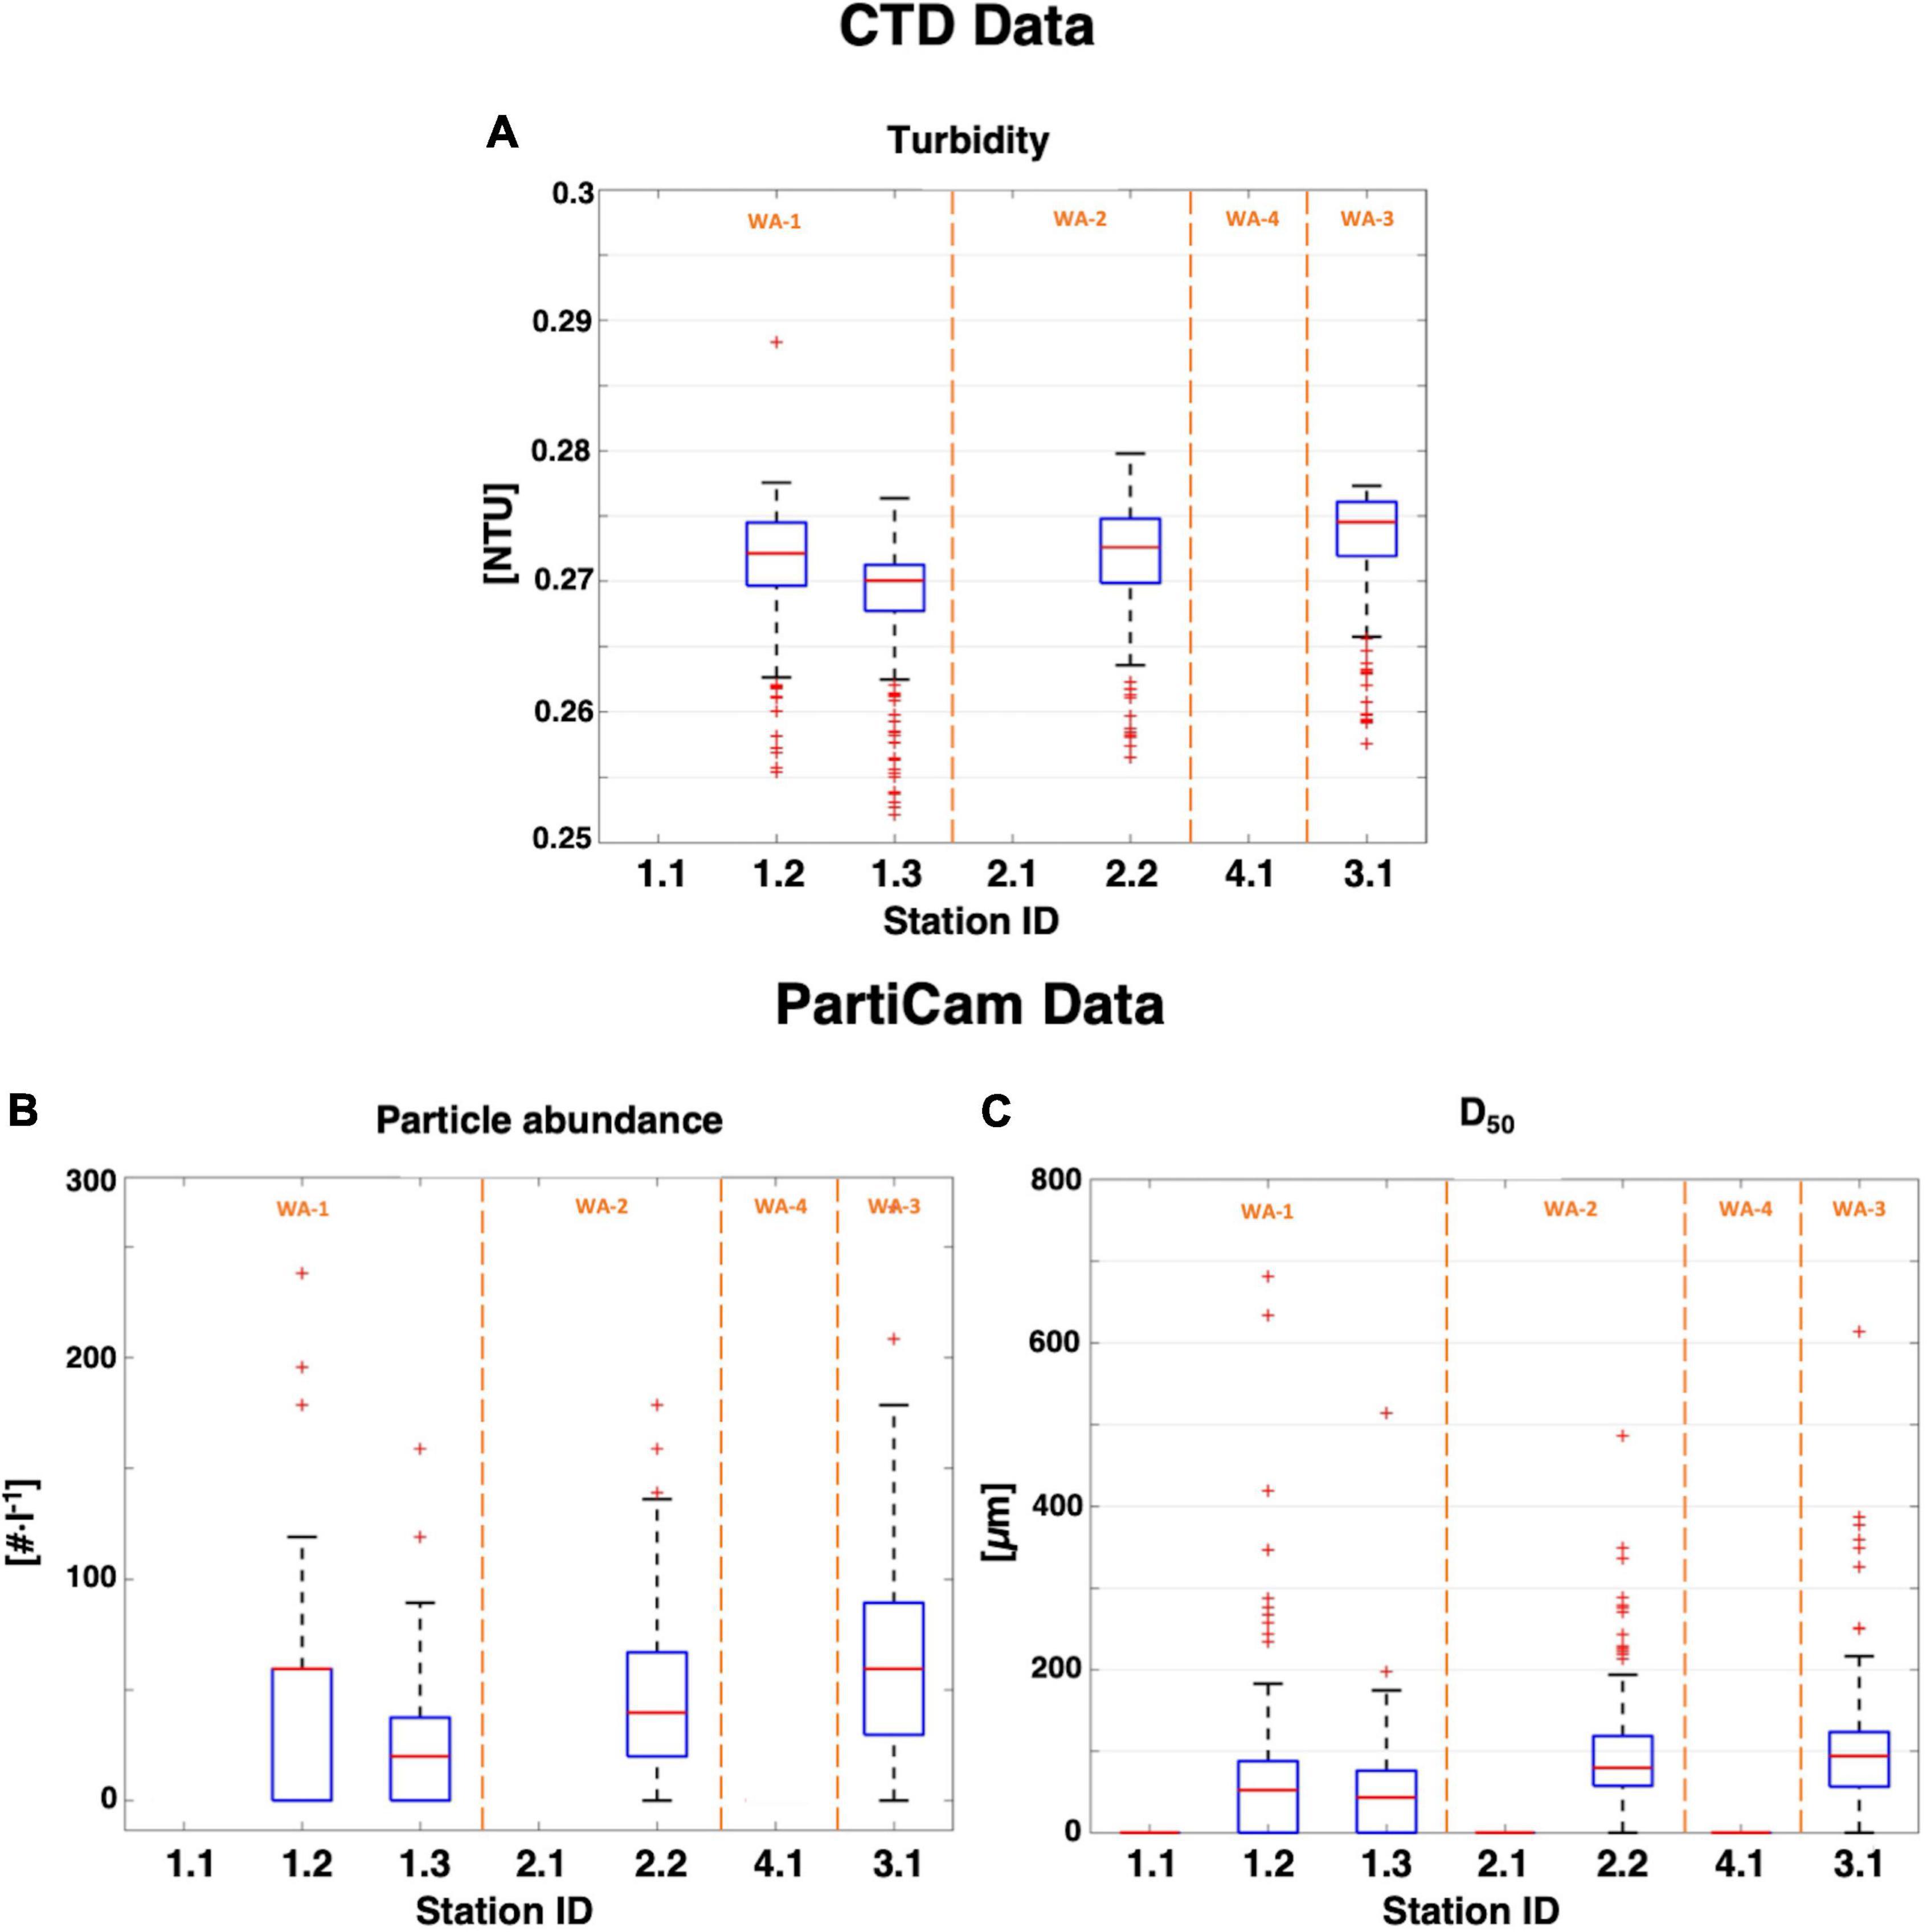
Figure 7. Box plots of all CTD and PartiCam data from the whole water column vs. sampling stations. (A) Turbidity measured with the CTD. (B) Particle abundance and (C) median diameter values measured with the in situ PartiCam system. Upper and lower boxplot whiskers represent the maximum and minimum values of the dataset. Interquartile range is shown as the blue box (50% of the dataset). Red line indicates the median value and red “+” are outliers. Working areas are shown in orange.
The description of the particle abundance and size-distribution for deep-water profiles through the entire water column are presented by profile 2.2 (Figure 8). Table 3 summarizes the general trend from profile 2.2 particle characteristics for every water mass. Profiles from other deployments are provided in Supplementary Figures 11–13. Below the OMZ, the particle abundance followed a net decrease, reaching a minimal particle abundance in the deep-water layer (DW; 38 ± 72 part⋅l–1) and a slight increase in the lower circumpolar water mass (LCPW; 61 ± 73 part⋅l–1). The same trend was observed for the total particle volume (Table 3). Overall, median particle size (D50) was relatively constant, with particle sizes ranging from 71 to 113 μm. There was a dominance (65 ± 4%) of particles smaller than 66 μm to the particle total abundance through the whole water column, followed by medium-sized particles (66–295 μm; 34 ± 6%) and larger particles (> 295 μm; 5 ± 3%).
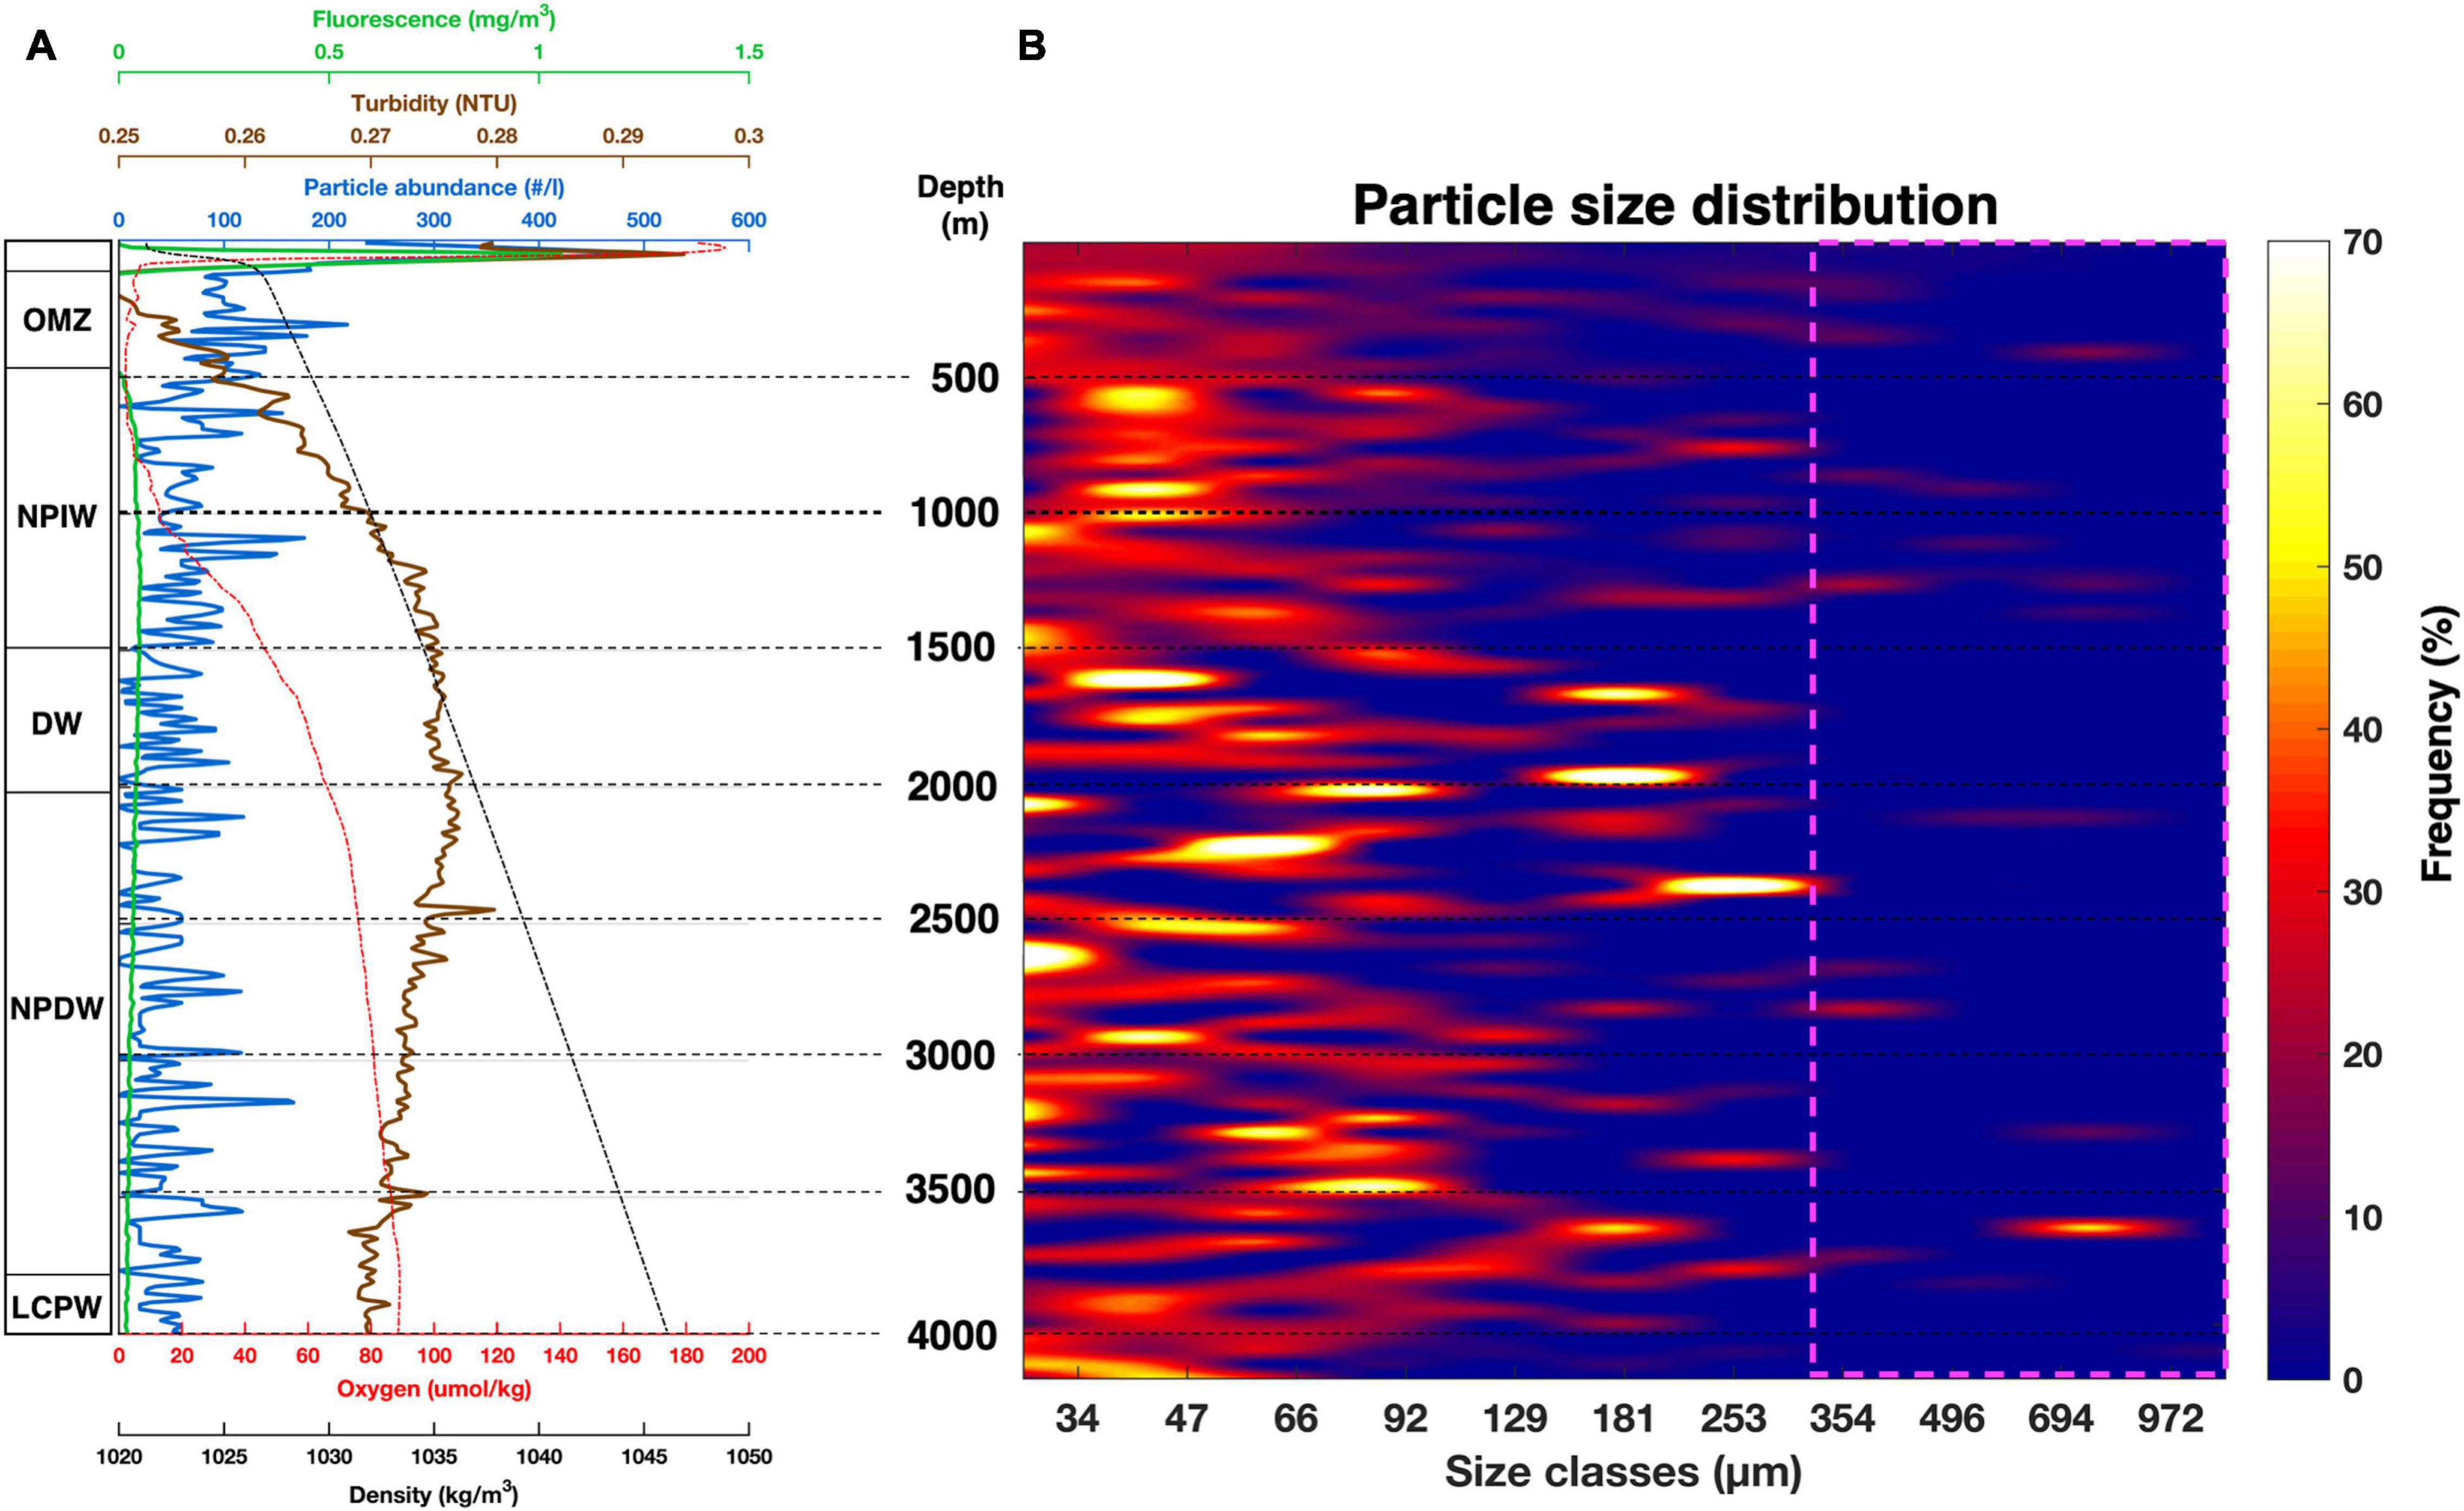
Figure 8. Particle abundance, size distribution and oceanographic parameters from station 2.2. (A) Vertical cross section from CTD data (fluorescence, turbidity, oxygen, density) and particle abundance vs. depth. (B) Particle size-distribution expressed in percent frequency vs. depth. Pink square: statistically low particle count probability. Oxygen minimum zone (OMZ), north Pacific intermediate water (NPIW), deep water (DW), North Pacific deep water (NPDW) and lower circumpolar water (LCPW).
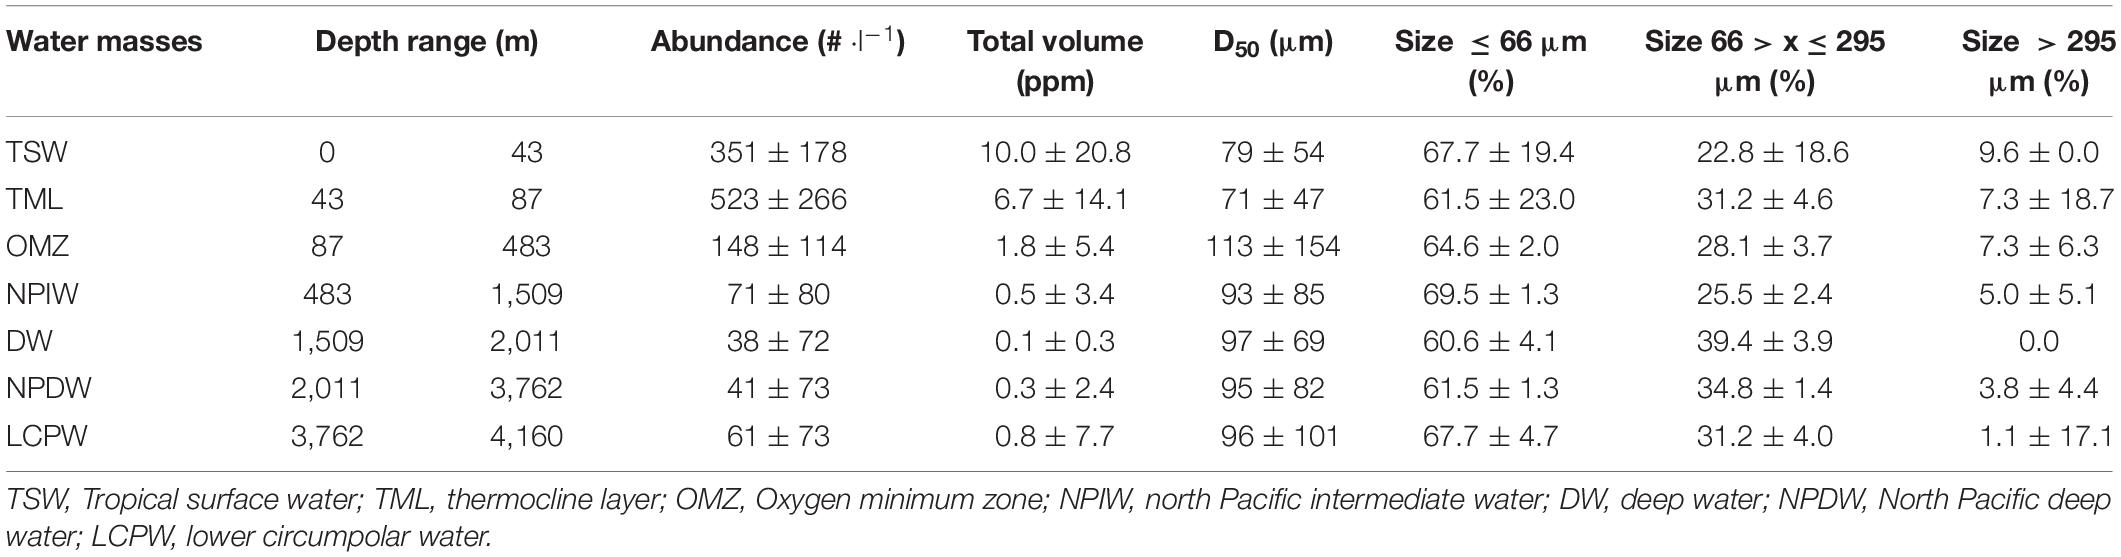
Table 3. Station 2.2 particle-related parameters summary from each water masses.
Particles larger than 300 μm were rarely observed (Figure 8). The total volume profile (Supplementary Figure 14) clearly showed the formation of seven maxima, all related to increased median particle size. Even though smaller particles (≤ 66 μm) were the numerically dominant particle fraction at all depths (Table 3), larger particles contributed 98 ± 4% of the maxima total volume. The depth-range at which those maxima occurred was closely correlated to the transition zone between water masses.
Discussion
Oceanographic Conditions and Productivity
Surface water analysis of the German license area in the CCZ (Figure 4) showed a clear seasonal signal, which was especially pronounced for Chla concentrations. The seasonality in the CCZ is directly coupled to meridional migration of the intertropical convergence zone (ITCZ), which extends to 10° N from August to September and moves closer to the Equator during March (Amador et al., 2006). Regional and global analysis of a similar concentration range of annual surface Chla (Figure 9) has shown a distinct oceanic distribution pattern corresponding to transitional zones located between productive upwelling areas and more oligotrophic subtropical gyres (Figure 9B). In comparison to the North Pacific Subtropical Gyre, the eastern German license area seems to maintain relatively constant productivity (295.9 ± 36.8 mgC⋅m–1⋅day–1; Figure 4) throughout the year of our study. During winter, we observed the formation of a sharp transition zone where a chlorophyll-a (Chla) front is formed (TZCF; Figure 9C), similar to a Chla front observed in the North Pacific (Ayers and Lozier, 2010). Satellite imagery (Supplementary Figure 4) revealed an apparent influence of water masses from the south-eastern coast of Mexico, suggesting that lateral advection of nutrient-rich water may sustain the year-round primary productivity in the area. Surface currents have been described as a combination of northward Ekman transport generated from the easterly trade wind system, seasonal wind-jet episodes from the Gulf of Tehuantepec, Papagayo and Panama, and a geostrophic current balance (Chelton et al., 2002; Kessler, 2006; Willett et al., 2006). Overall, nutrient-rich water upwelled in the Costa Rica Dome is the main nutrient source to the CCZ via lateral advection (Fiedler and Talley, 2006) and seems to explain the continuous and stable productivity throughout all seasons.
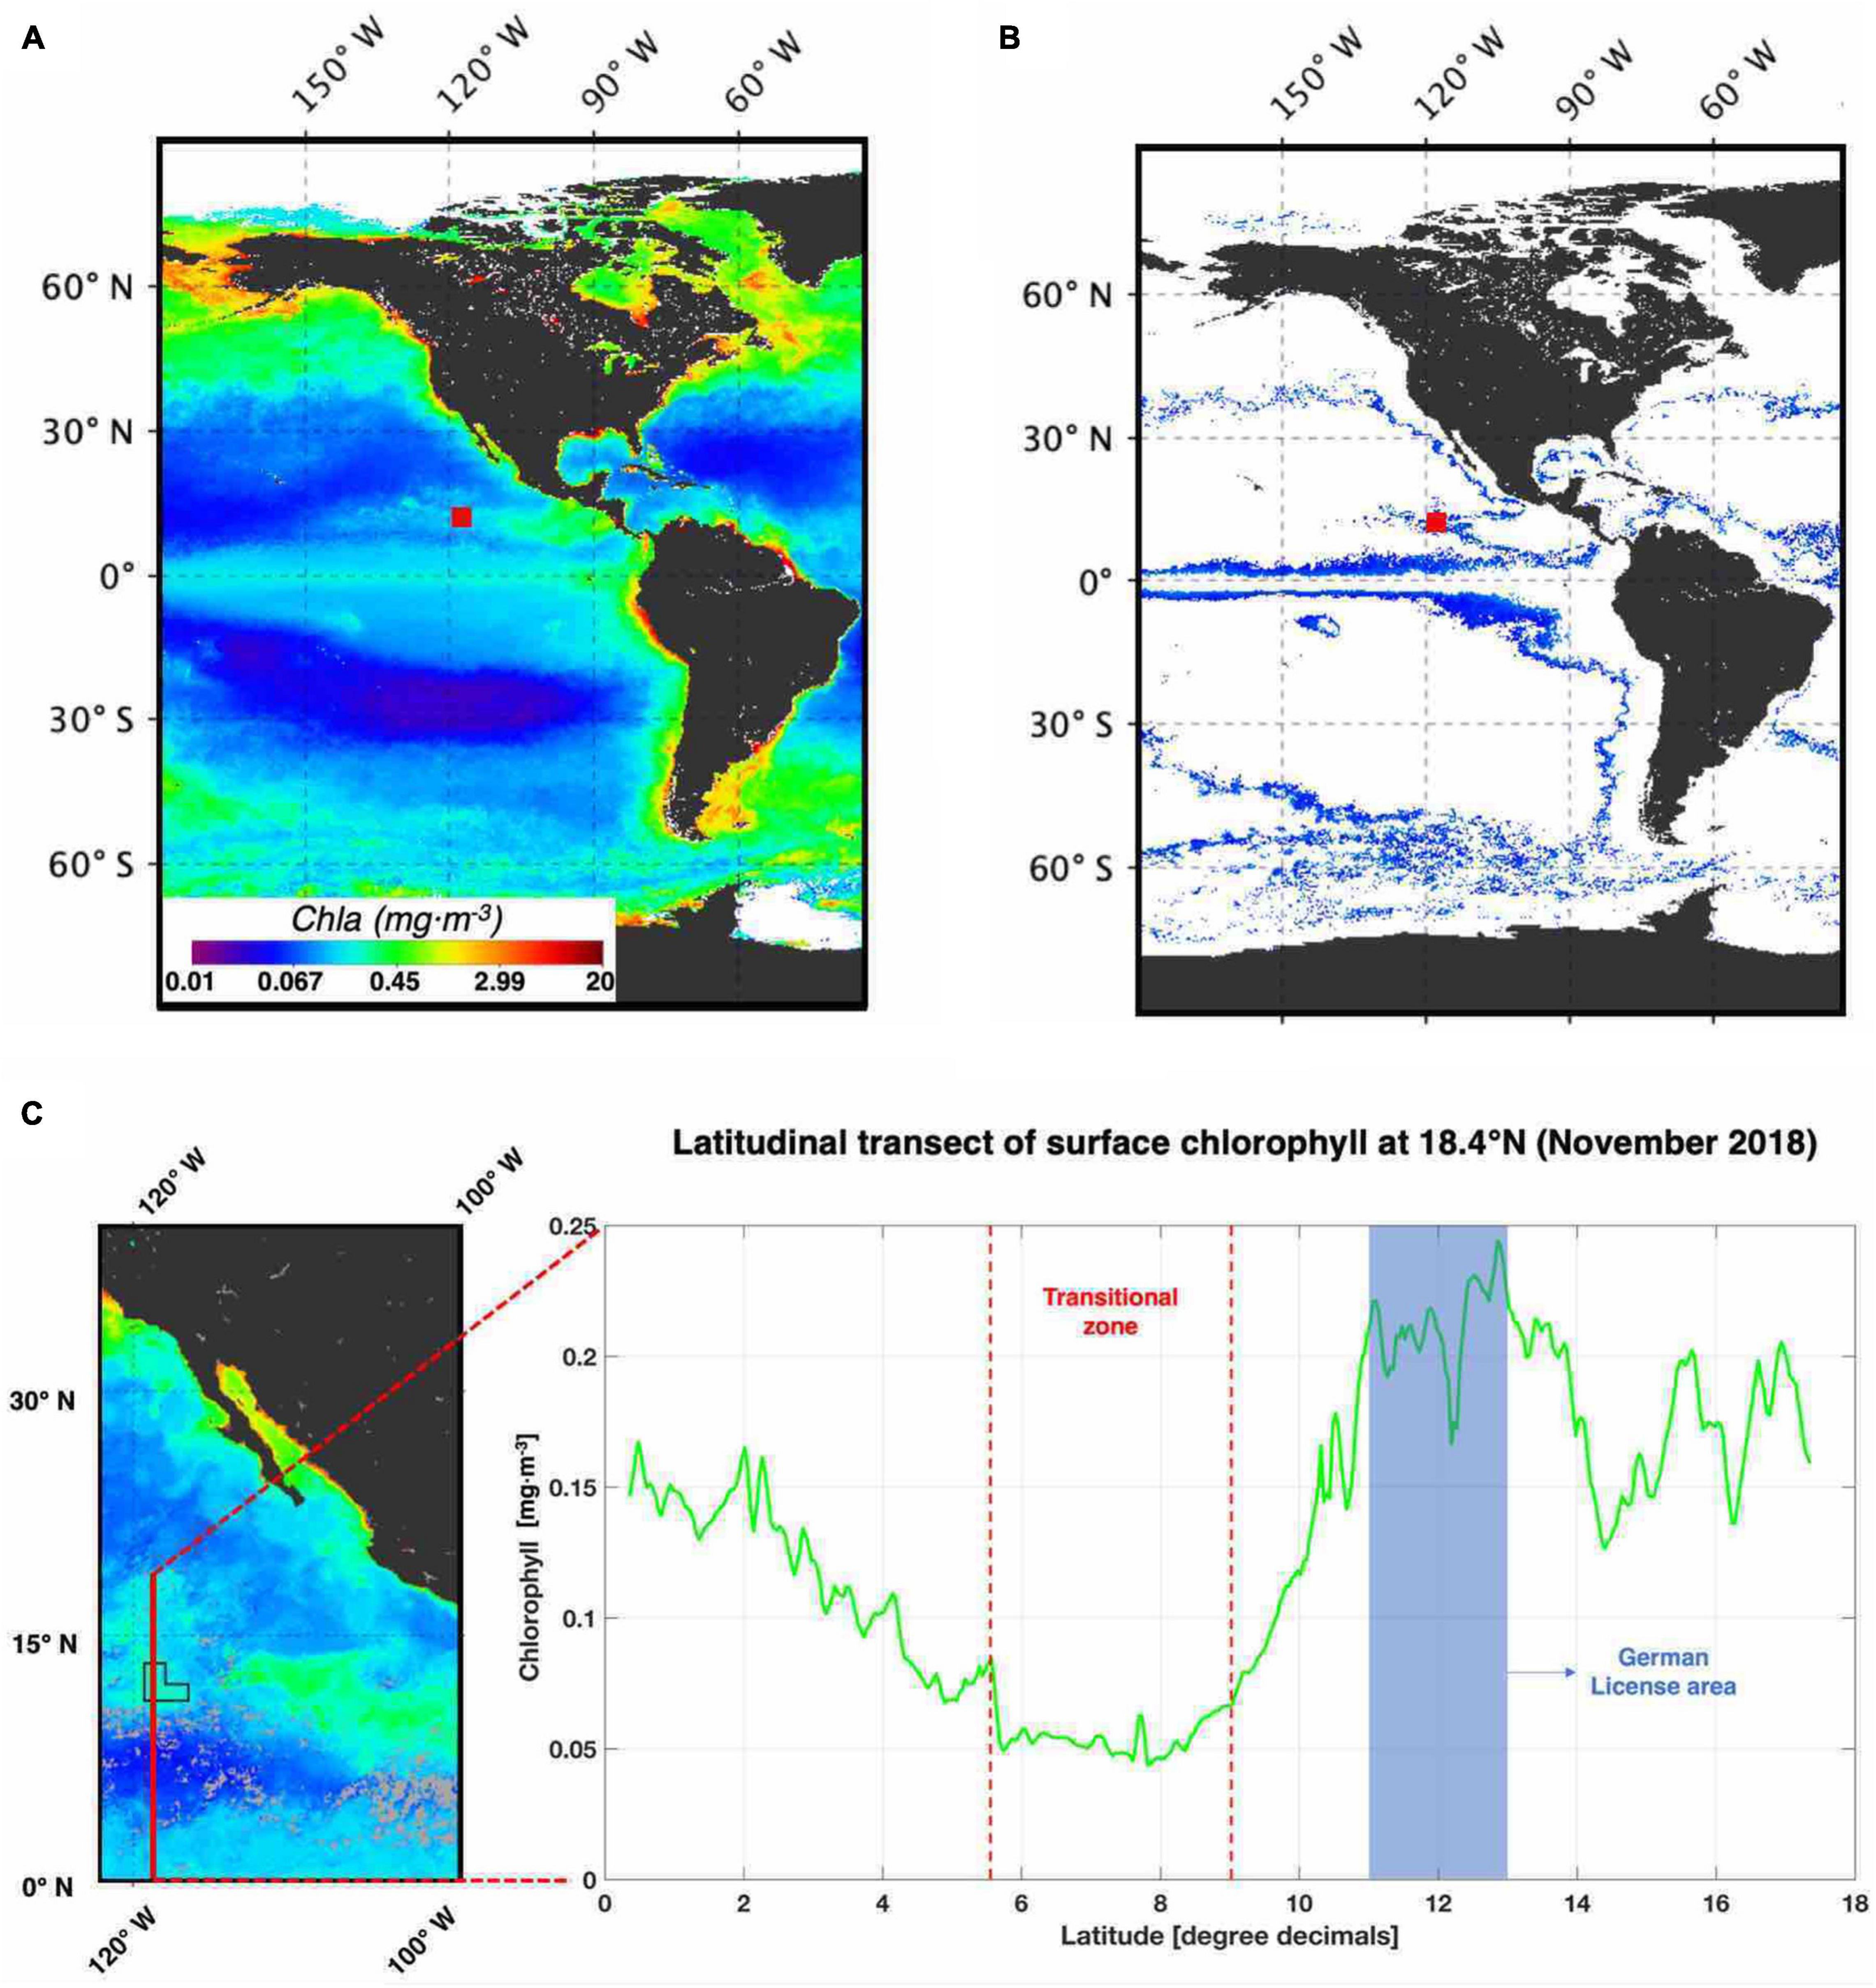
Figure 9. Worldwide 2018 chlorophyll-a distribution pattern. (A) 2018 annual Chla (mg⋅m–3) global distribution from SeaWiFS. The German license area is indicated by a red square. (B) Colored area showing distribution patterns where the annual Chla concentration is equal to the German license area. (C) Latitudinal transect of surface Chla at 18.4°N from November 2018 showing the transitional zone between the equator toward the German license area.
Particle Alteration in the Ocean Surface
The export efficiency of the biological carbon pump is mainly driven by the formation and settling of aggregates in the ocean, which rely on surface primary production (species composition, size structure, growth rate), trophic coupling (grazer dynamics) and the remineralization of exported material with depth (e.g., Guidi et al., 2009; Iversen et al., 2010; Henson et al., 2015; Mouw et al., 2016). Surface Chla measurements in the euphotic zone showed variations throughout the sampling period. There was a significant correlation between particle abundance and Chla concentrations for four of the seven stations analyzed for vertical particle abundance (Supplementary Table 3). The particle abundance was highest at depths corresponding to the maximum Chla concentration. This and a strong correlation between Chla and turbidity measurement indicated that both small and large particles and aggregates were formed from phytoplankton. The particle abundance decreased at increasing depths below the Chla maximum and until the upper layer of the OMZ. This might be explained by the remineralization of organic matter, a process that is typically at its highest in the surface water, where up to 50% can be remineralized (Martin et al., 1987). Higher remineralization rates in our studied area could only be explained by assuming a low settling velocity (3–5 m⋅day–1; Karakaş et al., 2009; Iversen et al., 2010), a higher water temperature (Marsay et al., 2015), increasing microbial degradation (Bendtsen et al., 2015) and close coupling between production and grazing (Jackson and Checkley, 2011). Similar trends have also been reported in the upwelling system off Cape Blanc (Nowald et al., 2006; Iversen et al., 2010). Furthermore, in low latitude regions where the seasonality signal is relatively weak compared to high latitudes, smaller cell sizes typically dominate the phytoplankton composition (Fryxell et al., 1979). Even if all particles that were captured in the smaller size-classes by the PartiCam could not be attributed to a phytoplanktonic cell, the observed particle composition indicated that smaller particles constituted up to 59%.
Based on the variation in particle size, abundance, and total volume of aggregates over depths, it is possible to infer physical and biological mechanisms that could have caused the vertical changes in particle size-distribution and abundance. Physical processes were directly inferred from our dataset and defined as:
1. Aggregation processes that may be related to variations over depth, corresponding to a loss in total abundance but not in the total volume of particles (Burd and Jackson, 2009).
2. Disaggregation processes related to an increase in total particle abundance without a change in overall volume (Jackson, 1995, 1998).
Following the same principle, but more subjectively as no in situ samples were collected, three biological interpretations were defined as:
3. A large decrease in total volume combined with a small decrease in total abundance suggests that larger particles were lost. This indicates feeding or filter-feeding by zooplankton that search for individual aggregates (Frost, 1972).
4. A loss in total volume without a loss in total particle abundance suggests microbial degradation, which decreases the size of each particle without obliterating the particles (Iversen and Ploug, 2010).
5. A loss in both total abundance and total volume across the whole size spectra either suggests a decrease in aggregate formation, or flux feeding from organisms waiting for particles to fall into their feeding structures, e.g., feeding nets or spines (Burd and Jackson, 2009) or a combination of these.
To avoid any misinterpretation due to the mixing of previous and recent particles settling at greater depth, only surface profiles (0–400 m) were considered and are summarized in Figure 10. Inside the thermocline layer, where particle abundance and Chla reached their maximum, flux feeding from organisms was suggested as the major degradation mechanism. These water masses have been reported to possess the highest biomass and abundance of zooplankton (Longhurst, 1985; Saltzman and Wishner, 1997). Contrasting trends appeared between daytime and night-time deployments. We observed an increase in aggregation/disaggregation processes taking place at night inside the OMZ, for all profiles. The size-spectrum analysis (Supplementary Figure 16) revealed the same day/night-time contrasts with overall decreasing particle concentrations and more pronounced aggregation/disaggregation processes toward larger particle sizes in the OMZ. The presence of a thick OMZ layer represents a key environmental feature affecting all trophic levels in the Pacific Ocean (Fernández-Álamo and Färber-Lorda, 2006; Seibel, 2010; Cavan et al., 2018). Night-time diel migration of zooplankton and nekton through more oxic layers in the OMZ has also been reported (Zhang and Dam, 1997; Kimmel et al., 2010; Wishner et al., 2013; Behrenfeld et al., 2019) and might explain the high particle turnover that we observed in the profiles made at night, compared to the daytime profiles.
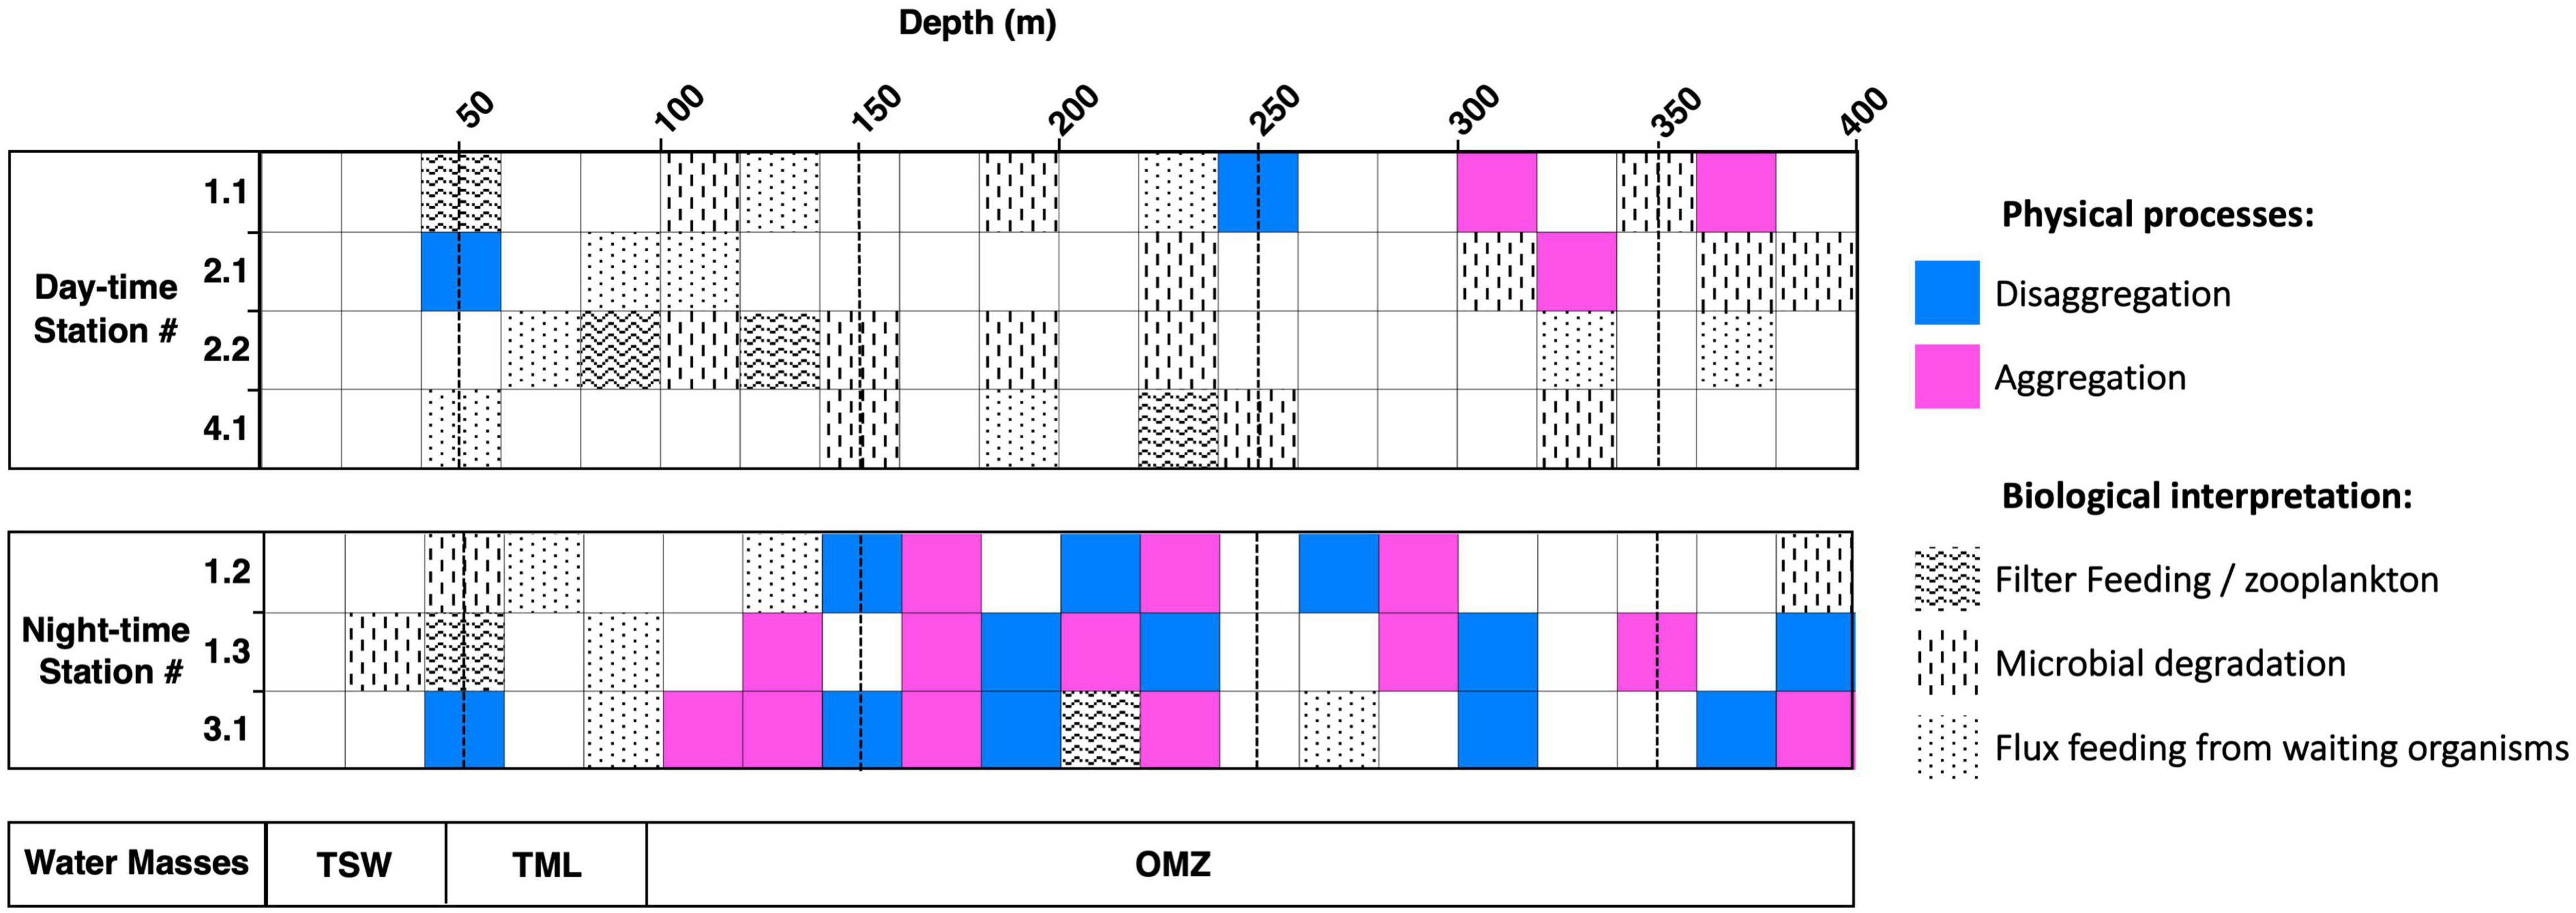
Figure 10. Particle alteration interpretation of the upper section of the water column from the surface down to 400 m depth. All profiling stations were split in a day and night period. The water masses distribution is showing on the bottom: tropical surface water (TSW), thermocline layer (TML), oxygen minimum zone (OMZ).
At depths below the thermocline and OMZ, a decrease in Chla concentration and increase in turbidity suggested the presence of small inorganic or biogenic particles. Since the aggregates within the thermocline layer and the OMZ were of biological origin, it seems likely that the deep particles were not directly related to the same surface layer. A similar observation has been reported in the north-eastern Pacific (Cavan et al., 2018) and during vertical profiling analysis in Cape Blanc, suggesting a lateral advection of marine particulate matter from the coastal areas to the study site, located several hundreds of kilometers offshore.
Export of Particulate Matter to the Seafloor
The mechanism for the formation of polymetallic nodules is still debated, but it occurs in all major oceans at a depth between 4,000 and 6,000 m (Hein and Koschinsky, 2013) where the sedimentation rate is extremely low (CCZ: 0.2–1.15 cm⋅kyr–1; Volz et al., 2018). Our study shows that the CCZ has a stable rate of photosynthetic carbon fixation in the surface ocean throughout all seasons and is defined as a productivity transition zone with relatively high export from the surface ocean, compared to other regions in the CCZ (Kim et al., 2012). The vertical size-distribution and abundance of particles and aggregates in this study suggested that there is low sedimentation on the seafloor despite the relatively high and constant surface ocean productivity. We found that the aggregate size spectra were mainly centered around smaller particles (≤ 77 μm) and that large aggregates (> 300 μm) were scarce. It was not possible to measure in situ settling velocities of the particles and aggregates during our study. However, based on previous size-specific sinking velocity measurements of similar aggregate types and sizes (Iversen and Ploug, 2010), we could assume settling velocities ranging from 3 to 15 m⋅day–1 for aggregates of sizes ranging from 30 to 70 μm. Such low sinking velocities result in long residence times of the aggregates in the water column before reaching the seafloor (from 277 to 1,380 days to reach a depth of 4,150 m). This allows a long time for microbial degradation, zooplankton grazing and lateral advection, resulting in a low export efficiency (Henson et al., 2012) and could explain why the German license area in the CCZ has such a low sedimentation rate. Finally, once an aggregate is deposited on the seafloor it might be easily resuspended by increased bottom current velocity (eddies) or even benthic storms (Thomsen and Gust, 2000; Aleynik et al., 2017). Furthermore, Becker et al. (2001) demonstrated that consolidation of surface sediments might take up to 20 years in the deep-sea environment.
Impact From Mining Activities on Particulate Matter Transport
The effect of industrial-scale mining sediment plume exposure on the benthic-pelagic environment needs to be considered, as records of offshore activity has proven that accidents and waste spill into the water column can occur (e.g., 2010 Deepwater Horizon oil spill). As primary sediment particles have a strong potential for aggregation at the study site (Gillard et al., 2019), far-field dispersion of a reinjected mining sediment plume in the upper water column will interfere with natural particle fluxes, potentially modifying the biological carbon pump (Weaver et al., 2018; Boyd et al., 2019; Drazen et al., 2019). Since our results, as well as studies from others (Henson et al., 2012), show that most organic particles at the study site are small and settle slowly, an injection of fine lithogenic sediment particles and nodule fines from mining vessels would probably enhance and disturb the benthic-pelagic coupling in the German license area. Muñoz-Royo et al. (2021) assessed the scale of discharged mining plumes in the water column and concluded that the plume is dominated by fine particles that are slowly concentrated in the water column. After years of mining operations, this background concentration of suspended fine particles could then start to interfere with the slow vertical flux of organic-rich aggregates. Aggregation with these particles in the vicinity of discharge points could lead to a faster fallout of the organic fraction (Hamm, 2002; Iversen and Robert, 2015), lowering the nutritional value of the aggregates due to subsequent changes in the mineral content, altering carbon stocks in sediments (Atwood et al., 2020). This ballasting effect causes an increase in size-specific settling velocity and has been described for the discharge of drill cuttings (Pabortsava et al., 2011). We predict that this effect will vary depending on the concentration of the sediment plume and the water depth at which it is released. It will be more pronounced in the euphotic layer, where sediment plume particles are incorporated during aggregate formation (Hamm, 2002; Iversen and Robert, 2015; van der Jagt et al., 2018) even if the benthic remineralization of POC is dominated by microbes that adapt rapidly to change in settling flux (Kanzog et al., 2008). It will however have consequences for both the midwater ecosystem (Drazen et al., 2020) and the benthic ecosystem (Vanreusel et al., 2016).
Conclusion
The eastern German license area was identified as a productive transitional zone toward a more depleted ocean gyre. Seven verticals in situ camera and CTD profiles indicated that despite constant primary productivity in the surface ocean, very little material reaches the seafloor due to a dominance of small, slow-sinking aggregates. We found that the combination of small aggregate size, bottom currents and slow seafloor consolidation explained the extremely low sedimentation rate in the CCZ. Future mining of the seafloor will impact not only the benthic ecosystem but also the pelagic environment. We believe that our findings will improve full water-depth modeling and help making more precise predictions regarding the potential impact of deep-sea mining activities. However, other scientific aspects and processes such as inorganic nutrients, trace elements, phytoplankton community structure, and zooplankton response to sediment plume exposure in the water column still require investigation.
Data Availability Statement
The original contributions presented in the study are included in the article/Supplementary Material, further inquiries can be directed to the corresponding author/s.
Author Contributions
BG contributed to the conception, collection, and data processing, performed the analysis, and wrote the manuscript. RH assisted with the data acquisition and substantially contributed to the writing of the manuscript. NN contributed to the design of the camera system and reviewed the manuscript, supplying changes and corrections. LT contributed to the conception of the experiment, camera system, and review of the data. MI contributed to the design and conception of the new camera system and experiment, data processing and analysis as well as supplying changes and corrections to the manuscript. All authors contributed to the article and approved the submitted version.
Funding
BG was supported by the Bundesministerium für Bildung und Forschung in the framework of the JPI Oceans project MiningImpact (Grant Nos. 03F0707A and 03F0707G). This publication was supported by the HGF Young Investigator Group SeaPump “Seasonal and regional food web interactions with the biological pump”: VH-NG-1000, by the OceanLab of Jacobs University and contracted by the BGR (The Federal Institute for Geosciences and Natural Resources, Germany). RH was funded by EC MERCES (grant agreement no. 689518I) and contracted by the BGR. MI was supported by the Helmholtz Association, the Alfred Wegener Institute Helmholtz Centre for Polar and Marine Research and the DFG-Research Center/Cluster of Excellence “The Ocean in the Earth System” EXC-2077-3907416 at MARUM.
Conflict of Interest
The authors declare that the research was conducted in the absence of any commercial or financial relationships that could be construed as a potential conflict of interest.
Publisher’s Note
All claims expressed in this article are solely those of the authors and do not necessarily represent those of their affiliated organizations, or those of the publisher, the editors and the reviewers. Any product that may be evaluated in this article, or claim that may be made by its manufacturer, is not guaranteed or endorsed by the publisher.
Acknowledgments
We thank BGR Hannover for the invitation to participate in the SO262 cruise. We also thank the shipboard team and scientist staff of the RV SONNE cruise 262. Two reviewers helped to improve the manuscript.
Supplementary Material
The Supplementary Material for this article can be found online at: https://www.frontiersin.org/articles/10.3389/fmars.2022.820947/full#supplementary-material
Footnotes
- ^ https://ecotaxa.obs-vlfr.fr
- ^ oceancolor.gsfc.nasa.gov
- ^ science.oregonstate.edu/ocean.productivity
References
Aleynik, D., Inall, M. E., Dale, A., and Vink, A. (2017). Impact of remotely generated eddies on plume dispersion at abyssal mining sites in the Pacific. Sci. Rep. 7, 1–14. doi: 10.1038/s41598-017-16912-2
Amador, J. A., Alfaro, E. J., Lizano, O. G., and Magaña, V. O. (2006). Atmospheric forcing of the eastern tropical Pacific: a review. Prog. Oceanogr. 69, 101–142. doi: 10.1016/j.pocean.2006.03.007
Asper, V. L. (1987). Measuring the flux and sinking speed of marine snow aggregates. Deep Sea Res. Part Oceanogr. Res. Pap. 34, 1–17. doi: 10.1016/0198-0149(87)90117-8
Atwood, T. B., Witt, A., Mayorga, J., Hammill, E., and Sala, E. (2020). Global patterns in marine sediment carbon stocks. Front. Mar. Sci. 7:165. doi: 10.3389/fmars.2020.00165
Ayers, J. M., and Lozier, M. S. (2010). Physical controls on the seasonal migration of the North Pacific transition zone chlorophyll front. J. Geophys. Res. Oceans 115, 1–11. doi: 10.1029/2009JC005596
Becker, H. J., Grupe, B., Oebius, H. U., and Liu, F. (2001). The behaviour of deep-sea sediments under the impact of nodule mining processes. Deep Sea Res. Part II Top. Stud. Oceanogr. 48, 3609–3627. doi: 10.1016/S0967-0645(01)00059-5
Behrenfeld, M. J., and Falkowski, P. G. (1997a). Photosynthetic rates derived from satellite-based chlorophyll concentration. Limnol. Oceanogr. 42, 1–20.
Behrenfeld, M. J., and Falkowski, P. G. (1997b). Behrenfeld a consumer’s guide to phyto primary productivity models. Limnol. Oceanogr. 42, 1479–1491
Behrenfeld, M. J., Gaube, P., Della Penna, A., Burt, W., Hu, Y., and Bontempi, P. (2019). Global satellite-observed daily vertical migrations of ocean animals. Nature 576, 257–261. doi: 10.1038/s41586-019-1796-9
Bendtsen, J., Hilligsøe, K. M., Hansen, J. L. S., and Richardson, K. (2015). Analysis of remineralisation, lability, temperature sensitivity and structural composition of organic matter from the upper ocean. Prog. Oceanogr. 130, 125–145. doi: 10.1016/j.pocean.2014.10.009
Boyd, P. W., Claustre, H., Levy, M., Siegel, D. A., and Weber, T. (2019). Multi-faceted particle pumps drive carbon sequestration in the ocean. Nature 568, 327–335. doi: 10.1038/s41586-019-1098-2
Burd, A. B., and Jackson, G. A. (2009). Particle aggregation. Annu. Rev. Mar. Sci. 1, 65–90. doi: 10.1146/annurev.marine.010908.163904
Cavan, E. L., Giering, S. L. C., Wolff, G. A., Trimmer, M., and Sanders, R. (2018). alternative particle formation pathways in the eastern tropical North Pacific’s biological carbon pump. J. Geophys. Res. Biogeosci. 123, 2198–2211. doi: 10.1029/2018JG004392
Chelton, D. B., Freilich, M. H., and Esbensen, S. K. (2002). Satellite observations of the wind jets off the pacific coast of central America. Part II: regional relationships and dynamical considerations. Mon. Weather Rev. 128, 2019–2043. doi: 10.1175/1520-04932000128<2019:sootwj<2.0.co;2
Christiansen, B., Denda, A., and Christiansen, S. (2020). Potential effects of deep seabed mining on pelagic and benthopelagic biota. Mar. Policy 114:103442. doi: 10.1016/j.marpol.2019.02.014
Drazen, J., Smith, C., Gjerde, K., Au, W., Black, J., and Carter, G. S. (2019). Report of the workshop Evaluating the nature of midwater mining plumes and their potential effects on midwater ecosystems. Res. Ideas Outcomes 5:e33527.
Drazen, J. C., Smith, C. R., Gjerde, K. M., Haddock, S. H. D., Carter, G. S., and Choy, C. A. (2020). Opinion: midwater ecosystems must be considered when evaluating environmental risks of deep-sea mining. Proc. Natl. Acad. Sci. U.S.A. 117, 17455–17460.
Elovaara, S., Degerlund, M., Franklin, D. J., Kaartokallio, H., and Tamelander, T. (2020). Seasonal variation in estuarine phytoplankton viability and its relationship with carbon dynamics in the Baltic Sea. Hydrobiologia 847, 2485–2501. doi: 10.1007/s10750-020-04267-1
Fernández-Álamo, M. A., and Färber-Lorda, J. (2006). Zooplankton and the oceanography of the eastern tropical Pacific: a review. Prog. Oceanogr. 69, 318–359. doi: 10.1016/j.pocean.2006.03.003
Fiedler, P. C., and Talley, L. D. (2006). Hydrography of the eastern tropical Pacific: a review. Prog. Oceanogr. 69, 143–180. doi: 10.1016/j.pocean.2006.03.008
Fowler, S. W., and Knauer, G. A. (1986). Role of large particles in the transport of elements and organic compounds through the oceanic water column. Prog. Oceanogr. 16, 147–194. doi: 10.1016/0079-6611(86)90032-7
Frost, B. W. (1972). Effects of size and concentration of food particles on the feeding behavior of the marine planktonic copepod calanus pacificus. Limnol. Oceanogr. 17, 805–815. doi: 10.4319/lo.1972.17.6.0805
Fryxell, G. A., Taguchi, S., and El-Sayed, S. Z. (1979). “Vertical distribution of diverse phytoplankton communities in the central Pacific,” in Marine geology and Oceanography of the Pacific Manganese Nodule Province, eds J. L. B. By and D. Z. Piper (New York, NY: Plenum Publishing Corporation), 203–239.
Giering, S. L. C., Cavan, E. L., Basedow, S. L., Briggs, N., Burd, A. B., Darroch, L. J., et al. (2020). Sinking organic particles in the Ocean—Flux estimates from in situ optical devices. Front. Mar. Sci. 6:834. doi: 10.3389/fmars.2019.00834
Gillard, B. (2019). Towards Deep Sea Mining – Impact of Mining Activities on Benthic Pelagic Coupling in the Clarion Clipperton Fracture Zone. Bremen: University of Bremen.
Gillard, B., Purkiani, K., Chatzievangelou, D., Vink, A., Iversen, M. H., and Thomsen, L. (2019). Physical and hydrodynamic properties of deep sea mining-generated, abyssal sediment plumes in the clarion clipperton fracture zone (eastern-central Pacific). Elem. Sci. Anthr. 7:5. doi: 10.1525/elementa.343
Gollner, S., Kaiser, S., Menzel, L., Jones, D. O. B., Brown, A., Mestre, N. C., et al. (2017). Resilience of benthic deep-sea fauna to mining activities. Mar. Environ. Res. 129, 76–101. doi: 10.1016/j.marenvres.2017.04.010
Gorsky, G., Picheral, M., and Stemmann, L. (2000). Use of the underwater video profiler for the study of aggregate dynamics in the North Mediterranean. Estuar. Coast. Shelf Sci. 50, 121–128. doi: 10.1006/ecss.1999.0539
Guidi, L., Jackson, G. A., Stemmann, L., Miquel, J. C., Picheral, M., and Gorsky, G. (2008). Relationship between particle size distribution and flux in the mesopelagic zone. Deep Sea Res. Part Oceanogr. Res. Pap. 55, 1364–1374. doi: 10.1016/j.dsr.2008.05.014
Guidi, L., Stemmann, L., Jackson, G. A., Ibanez, F., Claustre, H., Legendre, L., et al. (2009). Effects of phytoplankton community on production, size, and export of large aggregates: a world-ocean analysis. Limnol. Oceanogr. 54, 1951–1963. doi: 10.4319/lo.2009.54.6.1951
Hamm, C. E. (2002). Interactive aggregation and sedimentation of diatoms and clay-sized lithogenic material. Limnol. Oceanogr. 47, 1790–1795. doi: 10.4319/lo.2002.47.6.1790
Hein, J. R., and Koschinsky, A. (2013). “Deep-ocean ferromanganese crusts and nodules,” in Treatise on Geochemistry, 2nd Edn, eds K. K. Turekian and H. D. Holland (Amsterdam: Elsevier Inc), 273–291.
Henson, S. A., Sanders, R., and Madsen, E. (2012). Global patterns in efficiency of particulate organic carbon export and transfer to the deep ocean. Glob. Biogeochem. Cycles 26, 1–14. doi: 10.1029/2011GB004099
Henson, S. A., Yool, A., and Sanders, R. (2015). Unknown - unknown - 2014GB004965.pdf.pdf. Glob. Biogeochem. Cycles 29, 33–45. doi: 10.1002/2014GB004965
Honjo, S., Doherty, K. W., Agrawal, Y. C., and Asper, V. L. (1984). Direct optical assessment of large amorphous aggregates (marine snow) in the deep ocean. Deep Sea Res. Part Oceanogr. Res. Pap. 31, 67–76. doi: 10.1016/0198-0149(84)90073-6
Hyun, J.-H., Kim, K.-H., Jung, H.-S., and Lee, K.-Y. (1998). Potential environmental impact of deep seabed manganese nodule mining on the synechococcus (cyanobacteria) in the northeast equatorial pacific: effect of bottom water-sediment slurry. Mar. Georesources Geotechnol. 16, 133–143. doi: 10.1080/10641199809379963
ISA (2010). Development of Geological Models for the Clarion Clipperton Zone Polymetallic Nodule Deposits. Gurugram: ISA. ISA Tech. Stud. 6 Kingston Jam.
ISA (2019). Current Status of the Reserved Areas with the International Seabed Authority. Gurugram: ISA.
Iversen, M. H., Nowald, N., Ploug, H., Jackson, G. A., and Fischer, G. (2010). High resolution profiles of vertical particulate organic matter export off Cape Blanc, mauritania: degradation processes and ballasting effects. Deep Sea Res. Part Oceanogr. Res. Pap. 57, 771–784. doi: 10.1016/j.dsr.2010.03.007
Iversen, M. H., and Ploug, H. (2010). Ballast minerals and the sinking carbon flux in the ocean: carbon-specific respiration rates and sinking velocity of marine snow aggregates. Biogeosciences 7, 2613–2624. doi: 10.5194/bg-7-2613-2010
Iversen, M. H., and Robert, M. L. (2015). Ballasting effects of smectite on aggregate formation and export from a natural plankton community. Mar. Chem. 175, 18–27. doi: 10.1016/j.marchem.2015.04.009
Jackson, G. A. (1995). Comparing observed changes in particle size spectra with those predicted using coagulation theory. Deep-Sea Res. Part II 42, 159–184. doi: 10.1016/0967-0645(95)00010-N
Jackson, G. A. (1998). Using fractal scaling and two-dimensional particle size spectra to calculate coagulation rates for heterogeneous systems. J. Colloid Interface Sci. 202, 20–29. doi: 10.1006/jcis.1998.5435
Jackson, G. A., and Checkley, D. M. (2011). Particle size distributions in the upper 100m water column and their implications for animal feeding in the plankton. Deep Sea Res. Part Oceanogr. Res. Pap. 58, 283–297. doi: 10.1016/j.dsr.2010.12.008
Jones, D. O. B., Kaiser, S., Sweetman, A. K., Smith, C. R., Menot, L., Vink, A., et al. (2017). Biological responses to disturbance from simulated deep-sea polymetallic nodule mining. PLoS One 12:e0171750. doi: 10.1371/journal.pone.0171750
Kanzog, C., Ramette, A., Quéric, N. V., and Klages, M. (2008). Response of benthic microbial communities to chitin enrichment: an in situ study in the deep Arctic Ocean. Polar Biol. 32, 105–112. doi: 10.1007/s00300-008-0510-4
Karakaş, G., Nowald, N., Schäfer-Neth, C., Iversen, M., Barkmann, W., Fischer, G., et al. (2009). Impact of particle aggregation on vertical fluxes of organic matter. Prog. Oceanogr. 83, 331–341. doi: 10.1016/j.pocean.2009.07.047
Kessler, W. S. (2006). The circulation of the eastern tropical Pacific: a review. Prog. Oceanogr. 69, 181–217. doi: 10.1016/j.pocean.2006.03.009
Kiko, R., Biastoch, A., Brandt, P., Cravatte, C., Hauss, H., and Hummels, R. (2017). Biological and physical influences on marine snowfall at the equator. Nat. Geosci 10, 852–858. doi: 10.1038/ngeo3042
Kim, H. J., Hyeong, K., Yoo, C. M., Khim, B. K., Kim, B. K., and Son, J. W. (2012). Impact of strong El Niño events (1997/98 and 2009/10) on sinking particle fluxes in the 10°N thermocline ridge area of the northeastern equatorial Pacific. Deep Sea Res. Part Oceanogr. Res. Pap. 67, 111–120. doi: 10.1016/j.dsr.2012.05.008
Kimmel, D. G., Boicourt, W. C., Pierson, J. J., Roman, M. R., and Zhang, X. (2010). The vertical distribution and diel variability of mesozooplankton biomass, abundance and size in response to hypoxia in the northern Gulf of Mexico USA. J. Plankton Res. 32, 1185–1202. doi: 10.1093/plankt/fbp136
Longhurst, A. R. (1985). Relationship between diversity and the vertical structure of the upper ocean. Deep Sea Res. Part Oceanogr. Res. Pap. 32, 1535–1570. doi: 10.1016/0198-0149(85)90102-5
Lutz, M., Dunbar, R., and Caldeira, K. (2002). Regional variability in the vertical flux of particulate organic carbon in the ocean interior. Glob. Biogeochem. Cycles 16, 11-1–11-18. doi: 10.1029/2000gb001383
Markussen, T. N. (2016). Parchar – characterization of suspended particles through image processing in matlab. J. Open Res. Softw. 4, 1–7. doi: 10.5334/jors.114
Markussen, T. N., Konrad, C., Waldmann, C., Becker, M., Fischer, G., and Iversen, M. H. (2020). Tracks in the snow – advantage of combining optical methods to characterize marine particles and aggregates. Front. Mar. Sci. 7:476. doi: 10.3389/fmars.2020.00476
Marsay, C. M., Sanders, R. J., Henson, S. A., Pabortsava, K., Achterberg, E. P., and Lampitt, R. S. (2015). Attenuation of sinking particulate organic carbon flux through the mesopelagic ocean. Proc. Natl. Acad. Sci. U.S.A. 112, 1089–1094. doi: 10.1073/pnas.1415311112
Martin, J. H., Knauer, G. A., Karl, D. M., and Broenkow, W. W. (1987). VERTEX: carbon cycling in the northeast Pacific. Deep Sea Res. 34, 267–285. doi: 10.7591/9781501723667
Miller, K. A., Thompson, K. F., Johnston, P., and Santillo, D. (2018). An overview of seabed mining including the current state of development, environmental impacts, and knowledge gaps. Front. Mar. Sci. 4:418. doi: 10.3389/fmars.2017.00418
Mouw, C. B., Barnett, A., Mckinley, G. A., Gloege, L., and Pilcher, D. (2016). Unknown - Unknown - 2015GB005355.pdf.pdf. Glob. Biogeochem. Cycles 30, 1542–1562. doi: 10.1002/2015GB005355
Muñoz-Royo, C., Peacock, T., Alford, M. H., Smith, J., Le Boye, A., and Kulkarni, C. (2021). Extent of impact of deep-sea nodule mining midwater plumes is influenced by sediment loading, turbulence and thresholds. Commun. Earth Environ. 2, 1–16. doi: 10.1038/s43247-021-00213-8
Neumann, C. J. (1993). “A global tropical cyclone climatology,”in Global Guide to Tropical Cyclone Forecasting, ed G. J. Holland (Geneva: World Meteorological Organization).
Nowald, N., Iversen, M. H., Fischer, G., Ratmeyer, V., and Wefer, G. (2015). Time series of in-situ particle properties and sediment trap fluxes in the coastal upwelling filament off Cape Blanc. Mauritania. Prog. Oceanogr. 137, 1–11. doi: 10.1016/j.pocean.2014.12.015
Nowald, N., Karakas, G., Ratmeyer, V., Fischer, G., Schlitzer, R., Davenport, R. A., et al. (2006). Distribution and transport processes of marine particulate matter off Cape Blanc (NW-Africa): results from vertical camera profiles. Ocean Sci. Discuss. 3, 903–938. doi: 10.5194/osd-3-903-2006
O’Reilly, J. E., Maritorena, S., Mitchell, B. G., Siegel, D. A., Carder, K. L., Garver, S. A., et al. (1998). Ocean color chlorophyll algorithms for SeaWiFS. J. Geophys. Res. 103, 24937–24953.
Pabortsava, K., Purser, A., Wagner, H., and Thomsen, L. (2011). The influence of drill cuttings on physical characteristics of phytodetritus. Mar. Pollut. Bull. 62, 2170–2180. doi: 10.1016/j.marpolbul.2011.07.002
Passow, U., and De La Rocha, C. L. (2006). Accumulation of mineral ballast on organic aggregates. Glob. Biogeochem. Cycles 20, 1–7. doi: 10.1029/2005GB002579
Picheral, M., Guidi, L., Stemmann, L., Karl, D. M., Iddaoud, G., and Gorsky, G. (2010). The underwater vision profiler 5: an advanced instrument for high spatial resolution studies of particle size spectra and zooplankton. Limnol. Oceanogr. Methods 8, 462–473. doi: 10.4319/lom.2010.8.462
Ratmeyer, V., and Wefer, G. (1996). A high resolution camera system (ParCa) for imaging particles in the ocean: system design and results from profiles and a three month deployment. J. Mar. Res. 54, 589–603.
Saltzman, J., and Wishner, K. F. (1997). Zooplankton ecology in the eastern tropical pacific oxygen minimum zone above a seamount: 1. General trends. Deep Sea Res. Part Oceanogr. Res. Pap. 44, 907–930. doi: 10.1016/S0967-0637(97)00007-1
Schmid, M. S., Aubry, C., Grigor, J., and Fortier, L. (2016). The LOKI underwater imaging system and an automatic identification model for the detection of zooplankton taxa in the Arctic Ocean. Methods Oceanogr. 15–16, 129–160. doi: 10.1016/j.mio.2016.03.003
Seibel, B. A. (2010). Critical oxygen levels and metabolic suppression in oceanic oxygen minimum zones. J. Exp. Biol. 214, 326–336. doi: 10.1242/jeb.049171
Seifert, M., Hoppema, M., Burau, C., Elmer, C., Friedrichs, A., and Geuer, J. K. (2019). Influence of glacial meltwater on summer biogeochemical cycles in scoresby sund, East Greenland. Front. Mar. Sci 6:412. doi: 10.3389/fmars.2019.00412
Simon, M., Grossart, H.-P., Schweitzer, B., and Ploug, H. (2002). Microbial ecology of organic aggregates in aquatic ecosystems. Aquat. Microb. Ecol. 28, 175–211. doi: 10.3354/ame028175
Spilling, K., Kremp, A., and Tamelander, T. (2006). Vertical distribution and cyst production of Peridiniella catenata (Dinophyceae) during a spring bloom in the Baltic Sea. J. Plankton Res. 28, 659–665. doi: 10.1093/plankt/fbi149
Thomsen, L., and Gust, G. (2000). Sediment erosion thresholds and characteristics of resuspended aggregates on the western European continental margin. Deep Sea Res. Part Oceanogr. Res. Pap. 47, 1881–1897. doi: 10.1016/S0967-0637(00)00003-0
Turner, J. T. (2002). Zooplankton fecal pellets, marine snow and sinking phytoplankton blooms. Aquat. Microb. Ecol. 27, 57–102. doi: 10.3354/ame027057
Turner, J. T. (2015). Zooplankton fecal pellets, marine snow, phytodetritus and the ocean’s biological pump. Prog. Oceanogr. 130, 205–248. doi: 10.1016/j.pocean.2014.08.005
van der Jagt, H., Friese, C., Stuut, J. B. W., Fischer, G., and Iversen, M. H. (2018). The ballasting effect of Saharan dust deposition on aggregate dynamics and carbon export: aggregation, settling, and scavenging potential of marine snow. Limnol. Oceanogr. 63, 1386–1394. doi: 10.1002/lno.10779
Vanreusel, A., Hilario, A., Ribeiro, P. A., Menot, L., and Arbizu, P. M. (2016). Threatened by mining, polymetallic nodules are required to preserve abyssal epifauna. Sci. Rep. 6:26808. doi: 10.1038/srep26808
Volz, J. B., Mogollón, J. M., Geibert, W., Arbizu, P. M., Koschinsky, A., and Kasten, S. (2018). Natural spatial variability of depositional conditions, biogeochemical processes and element fluxes in sediments of the eastern Clarion-Clipperton Zone. Pacific Ocean. Deep Sea Res. Part Oceanogr. Res. Pap. 140, 159–172. doi: 10.1016/j.dsr.2018.08.006
Weaver, P. P. E., Billett, D. S. M., and Van Dover, C. L. (2018). “Environmental risks of deep-sea mining,” in Handbook on Marine Environment Protection: Science, Impacts and Sustainable Management, eds M. Salomon and T. Markus (Berlin: Springer International Publishing), 215–245.
Wegorzewski, A. V., and Kuhn, T. (2014). The influence of suboxic diagenesis on the formation of manganese nodules in the Clarion Clipperton nodule belt of the Pacific Ocean. Mar. Geol. 357, 123–138. doi: 10.1016/j.margeo.2014.07.004
Wiedicke-Hombach, M. Shipboard Scientific Party (2009). Cruise Report “Mangan 2008”, RV Kilo Moana, 13 October – 22 November 2008. Hannover:Bundesanstalt fur Geowissenschaften und Rohstoffe, 175.
Wijffels, S. E., Toole, J. M., Bryden, H. L., Fine, R. A., Jenkins, W. J., and Bullister, J. L. (1996). The water masses and circulation at 10°N in the Pacific. Deep Sea Res. Part I Oceanogr. Res. Pap. 43, 501–544. doi: 10.1016/0967-0637(96)00006-4
Willett, C. S., Leben, R. R., and Lavín, M. F. (2006). Eddies and Tropical Instability Waves in the eastern tropical Pacific: a review. Prog. Oceanogr. 69, 218–238. doi: 10.1016/j.pocean.2006.03.010
Wishner, K. F., Outram, D. M., Seibel, B. A., Daly, K. L., and Williams, R. L. (2013). Zooplankton in the eastern tropical north Pacific: boundary effects of oxygen minimum zone expansion. Deep Sea Res. Part Oceanogr. Res. Pap. 79, 122–140. doi: 10.1016/j.dsr.2013.05.012
Keywords: CCZ (Clarion-Clipperton Zone), optical system, camera, POC (particulate organic carbon), particle size, deep-sea, mining
Citation: Gillard B, Harbour RP, Nowald N, Thomsen L and Iversen MH (2022) Vertical Distribution of Particulate Matter in the Clarion Clipperton Zone (German Sector)—Potential Impacts From Deep-Sea Mining Discharge in the Water Column. Front. Mar. Sci. 9:820947. doi: 10.3389/fmars.2022.820947
Received: 23 November 2021; Accepted: 24 January 2022;
Published: 16 February 2022.
Edited by:
Cinzia Corinaldesi, Marche Polytechnic University, ItalyReviewed by:
Tobias Tamelander, University of Helsinki, FinlandGabriella Luongo, Marche Polytechnic University, Italy
Copyright © 2022 Gillard, Harbour, Nowald, Thomsen and Iversen. This is an open-access article distributed under the terms of the Creative Commons Attribution License (CC BY). The use, distribution or reproduction in other forums is permitted, provided the original author(s) and the copyright owner(s) are credited and that the original publication in this journal is cited, in accordance with accepted academic practice. No use, distribution or reproduction is permitted which does not comply with these terms.
*Correspondence: Benjamin Gillard, b.gillard@jacobs-university.de