Effects of a Submesoscale Oceanographic Filament on Zooplankton Dynamics in the Arctic Marginal Ice Zone
 Patricia Kaiser1*
  Wilhelm Hagen1
  Wilken-Jon von Appen2
  Barbara Niehoff2
  Nicole Hildebrandt2 Holger Auel1
- 1BreMarE – Bremen Marine Ecology, Marine Zoology, University of Bremen, Bremen, Germany
- 2Alfred Wegener Institute, Helmholtz Centre for Polar and Marine Research, Bremerhaven, Germany
Submesoscale structures, characterized by intense vertical and horizontal velocities, potentially play a crucial role in oceanographic dynamics and pelagic fluxes. Due to their small spatial scale and short temporal persistence, conditions for in situ measurements are challenging and thus the role of such structures for zooplankton distribution is still unclear. During RV Polarstern expedition PS107 to Arctic Fram Strait in July/August 2017, a submesoscale filament was detected, which initiated an ad hoc oceanographic and biological sampling campaign. To determine zooplankton taxonomic composition, horizontal and vertical distribution, abundance and biomass, vertical MultiNet hauls (depth intervals: 300–200–100–50–10–0 m) were taken at four stations across the filament. Zooplankton data were evaluated in context with the physical-oceanographic observations of the filament to assess submesoscale physical-biological interactions. Our data show that submesoscale features considerably impact zooplankton dynamics. While structuring the pelagial with distinct zooplankton communities in a vertical as well as horizontal dimension, they accumulate abundance and biomass of epipelagic species at the site of convergence. Further, high-velocity jets associated with such dynamics are possibly of major importance for species allocation and biological connectivity, accelerating for instance processes such as the ‘Atlantification’ of the Arctic. Thus, submesoscale features affect the surrounding ecosystem in multiple ways with consequences for higher trophic levels and biogeochemical cycles.
Introduction
Mesoscale dynamics (horizontal scale of 10–100 km), including fronts and eddies, have been studied extensively and, even though still not fully understood, significant knowledge about underlying oceanographic mechanisms as well as their influence on biological and biogeochemical processes has been gained (McWilliams, 2008; McGillicuddy, 2016). Impacts can vary widely, including the support of new production by inducing vertical mixing and thus modulating the supply of nutrients into the euphotic layer (e.g., Lee and Williams, 2000; Mahadevan and Archer, 2000; McGillicuddy et al., 2003). Numerical studies investigating the mesoscale injection of nutrients found that estimated primary production increased by up to 30%, better matching empirical observations (Lévy et al., 2001). Besides enhancing vertical velocities, mesoscale dynamics can also act as vectors of transport for organisms in a horizontal direction. Fronts have been shown to concentrate organisms at the site of convergence, creating foraging areas, which are actively sought by top predators such as tunas, birds and whales (Acha et al., 2015). Several studies further demonstrate that mesoscale eddies can serve as a vector of transport, dispersing zooplankton and larvae to oceanic regions (Mackas and Galbraith, 2002; Batten and Crawford, 2005), or as a retention mechanism, keeping offspring close to their spawning site (Singh et al., 2018). However, while mesoscale dynamics play a vital role for such processes, the resolution of empirical studies still seems to be too coarse.
Finer, so-called submesoscale, dynamics have thus recently gained increasing interest among physical and biological oceanographers (Lévy et al., 2018). In contrast to mesoscale fronts and dynamics, submesoscale structures are rapidly evolving features with horizontal scales of 0.1–10 km. They are defined by a high Rossby number ⪆1 (mesoscale: ≤0.1), resulting in ageostrophic circulation and associated significant vertical velocities (D’Asaro et al., 2018; Zhabin and Andreev, 2019; Rossby number: horizontal velocity gradients divided by Coriolis frequency). Thus, meso- and submesoscale dynamics are different regimes and cannot be summarized as one process.
Although the existence of submesoscale motions has been acknowledged since the 1980s (McWilliams, 1985), their impact was considered as weak, and computational abilities were too limited to include them in numerical simulations (Marsac et al., 2014). However, expanding computational capacities during the last decade allowed the modeling of oceanographic structures on a higher resolution. Such models highlighted the intense vertical and horizontal velocities within submesoscale dynamics and hence indicated their underestimated potential in affecting pelagic fluxes and processes (Klein et al., 2008; Klein and Lapeyre, 2009).
Submesoscale structures are ubiquitous throughout the oceans and often appear between mesoscale eddies (Lévy et al., 2001, 2018) or in the presence of strong horizontal gradients, for instance in the marginal ice zone (MIZ) (von Appen et al., 2018). Due to their small spatial (0.1–10 km) and short temporal (hours to weeks) scales, in situ measurements, especially the assessment of their impact on biological processes, are difficult. Recent studies utilizing satellite data to analyze the effect of submesoscale fronts on phytoplankton revealed increased chlorophyll concentrations in such regions (Shulman et al., 2015; Liu and Levine, 2016; Guo et al., 2019). The main underlying cause is presumably due to the intense vertical velocities associated with small-scale dynamics, which lead to an enhanced upward transport of nutrients (Mahadevan and Archer, 2000; Mahadevan, 2016). Although submesoscale processes are limited in space and time, this nutrient injection has major implications for phytoplankton productivity, as the relevant time scales are similar to those of phytoplankton growth (Mahadevan, 2016). These studies emphasize the impact of submesoscale structures on phytoplankton, yet little is known about interactions between such small-scale dynamics and zooplankton ecology. Zooplankton research is still largely dependent on point sampling by net hauls from research vessels, with the distance between stations usually too coarse to resolve submesoscale features. Few studies reported elevated mesozooplankton abundances at submesoscale fronts (Ohman et al., 2012; Powell and Ohman, 2015; Trudnowska et al., 2016), yet the biological and physical mechanisms supporting such accumulations are still far from understood.
During the expedition PS107 of the German research icebreaker RV Polarstern to the Arctic marginal ice zone in Fram Strait in July/August 2017, a submesoscale filament was detected by in situ observation and satellite imagery (Schewe, 2018). A high-resolution ad hoc sampling campaign was designed, combining physical oceanographic measurements (published by von Appen et al., 2018) with depth-stratified zooplankton sampling. The objective of the present study is to link community structure, vertical distribution and dynamics of zooplankton to physical oceanographic properties of the submesoscale filament. Specifically, we demonstrate that (1) despite the short temporal and small spatial scale of the submesoscale feature, the convergence of surface water results in the accumulation of epipelagic zooplankton close to the filament center; (2) distinct water masses at different depths and/or on different sides of the filament are characterized by different zooplankton communities despite the small vertical and horizontal distances; (3) mesopelagic species emerge and occur at shallower depths close to the filament center due to doming of the isopycnals in the mesopelagic layer; and (4) the along-frontal jets on both sides of the filament have the potential to act as high-speed vectors for the transport of zooplankton organisms.
Materials and Methods
Study Area and Physical Oceanographic Characterization of the Submesoscale Filament
Fram Strait, between Greenland and the Svalbard Archipelago, is the only deep-water connection between the North Atlantic and the Arctic Ocean. On the eastern side, the West Spitsbergen Current (WSC) transports warm, saline water masses from the Atlantic (‘Atlantic Water’ – AW) northwards (von Appen et al., 2016). On the western side, the East Greenland Current (EGC) exports cold and rather fresh Polar Surface Water (PSW) and sea ice from the Arctic Ocean into the Atlantic (de Steur et al., 2009). Part of the AW flows northward into the Arctic Ocean, while the rest turns westward to ‘recirculate’ and subduct below the PSW (Hattermann et al., 2016). The zone in between the WSC and EGC is thus characterized by a highly dynamic and turbulent regime of mesoscale features (Kawasaki and Hasumi, 2016; von Appen et al., 2018). This highly dynamic regime, together with the semi-permanent sea-ice edge (von Appen et al., 2016) and the large horizontal density gradients observed in the MIZ, may be beneficial for and contribute to the development of submesoscale features (von Appen et al., 2018).
During the expedition PS107 with the German research icebreaker RV Polarstern, a submesoscale filament was detected via satellite data (Figure 1A), due to the presence of a nearly straight sea ice streak of 500 m width and 50 km length extending in northeast-southwest direction in the MIZ of Fram Strait. Extensive in situ oceanographic as well as biological sampling of the filament was conducted in cross-frontal direction (Schewe, 2018; Figure 1A). The physical oceanographic structure of the filament was described in detail by von Appen et al. (2018). The observed ‘cyclonic filament’ is comparable to the theoretical description of a ‘dense filament’ by McWilliams et al. (2009). It can be regarded as two parallel fronts between light-dense and dense-light surface waters. The flow field is characterized by geostrophically balanced cyclonic along-frontal jets and an ageostrophic secondary circulation in cross-frontal direction. Specifically, cold polar water (≤0°C) prevailed at the surface at distances of 6–8 km on both sides of the filament, while in between warmer Atlantic water (≥1°C) dominated the uppermost layer (Figure 1B present study; Figures 2A, 3B in von Appen et al., 2018). The ageostrophic circulation resulted in convergence toward the center of the filament, accumulating and stabilizing the narrow streak of sea ice (Figures 1A,C). The convergence led to downwelling, subducting dense water which was evident in a depression of the 27 isopycnal at the center of the filament (Figure 1C). Vice versa, below 100 m depth, a doming, i.e., an upward deflection, of isopycnals was apparent, resulting in a characteristic hourglass shape of isopycnals at the filament center (with depressed isopycnals at the surface and doming ones below 100 m). Associated with this structure, strong geostrophic along-frontal jets with a maximum speed of >0.5 m s–1 in 50–100 m depth at around 3 km distance from the center occurred on both sides of the filament (Figures 1B,C). On the eastern side, the along-filament flow was directed northward, whereas the jet on the western side flowed southward. The temporal persistence and frequency of such filaments in the MIZ is unknown. Our best guess for the time period over which the sampled submesoscale filament persisted is one to a few weeks.
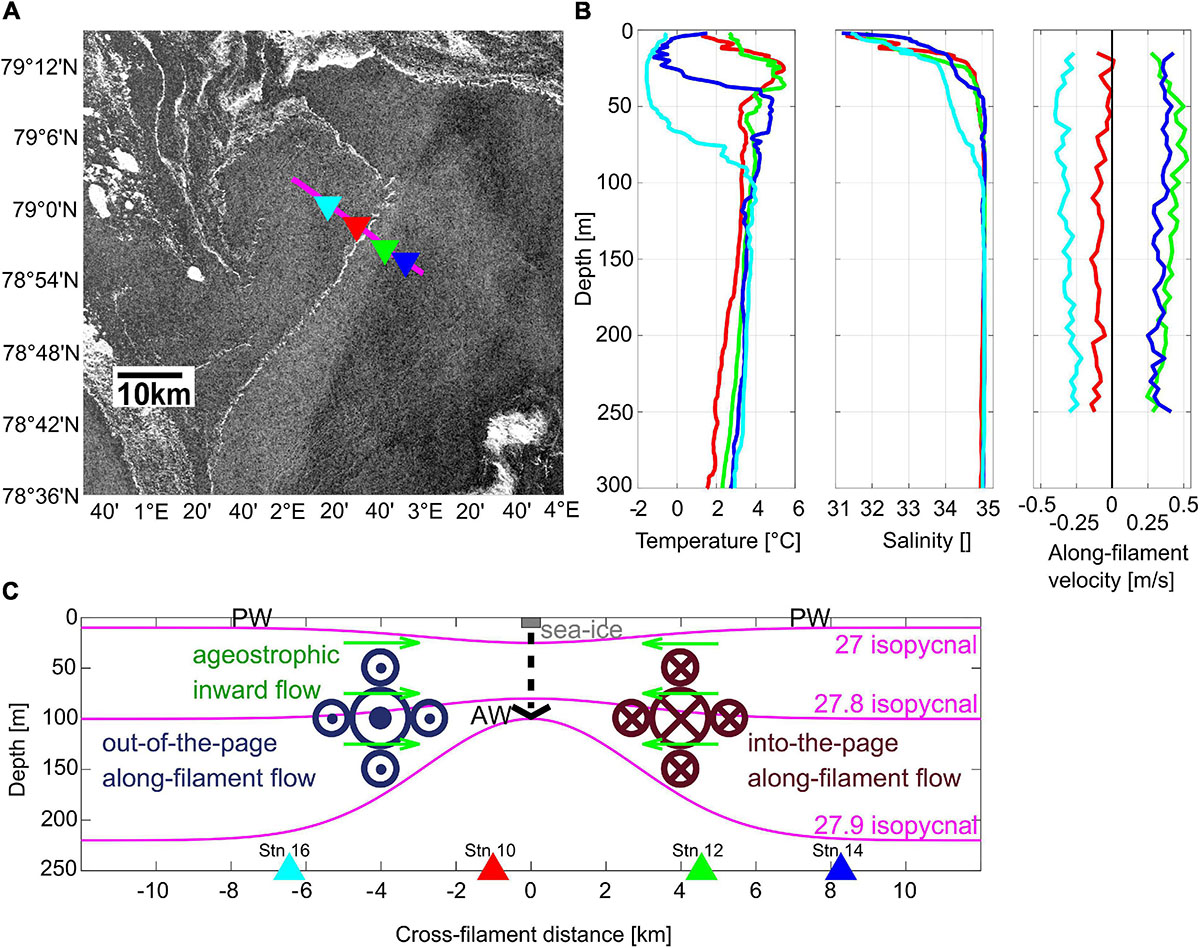
Figure 1. (A) Sentinel 1A (©European Space Agency) radar reflectivity on July 26, 2017 including the position of the cross frontal transect with the four MultiNet stations. (B) CTD profiles of temperature and salinity as well as along-filament velocities at the four MultiNet stations. (C) Schematic illustration of the submesoscale filament in the Arctic marginal ice zone in cross-frontal direction (modified after von Appen et al., 2018). PW, polar water. Colored triangles indicate locations of MultiNet stations.
Zooplankton Sampling, Abundance, and Biomass Analysis
Four stations (stns) across the submesoscale filament were analyzed for zooplankton abundance, biomass and taxonomic composition. Stns 10 and 12 were located near the center, stns 14 and 16 further away from the center (Figure 1A). Two stations were situated on either side of the central convergence zone, i.e., stns 16 and 10 on the western side and stns 12 and 14 on the eastern side (Table 1 and Figures 1A,C). Sampling was conducted within 30 h (Table 1) with a multiple opening and closing net equipped with five nets for stratified vertical hauls (Hydrobios MultiNet Midi, mouth opening 0.25 m2, mesh size 150 μm, sampling speed 0.5 m s–1). Oceanographic observations indicated an extent of the filament to >250 m depth, thus, zooplankton sampling depths were adjusted accordingly, with five vertical sampling intervals covering 300–200–100–50–10–0 m. Immediately after the haul the samples were preserved in a 4% borax-buffered formaldehyde seawater solution. Prior to each MultiNet station, oceanographic data were obtained by a CTD attached to a rosette water sampler at the same stations.
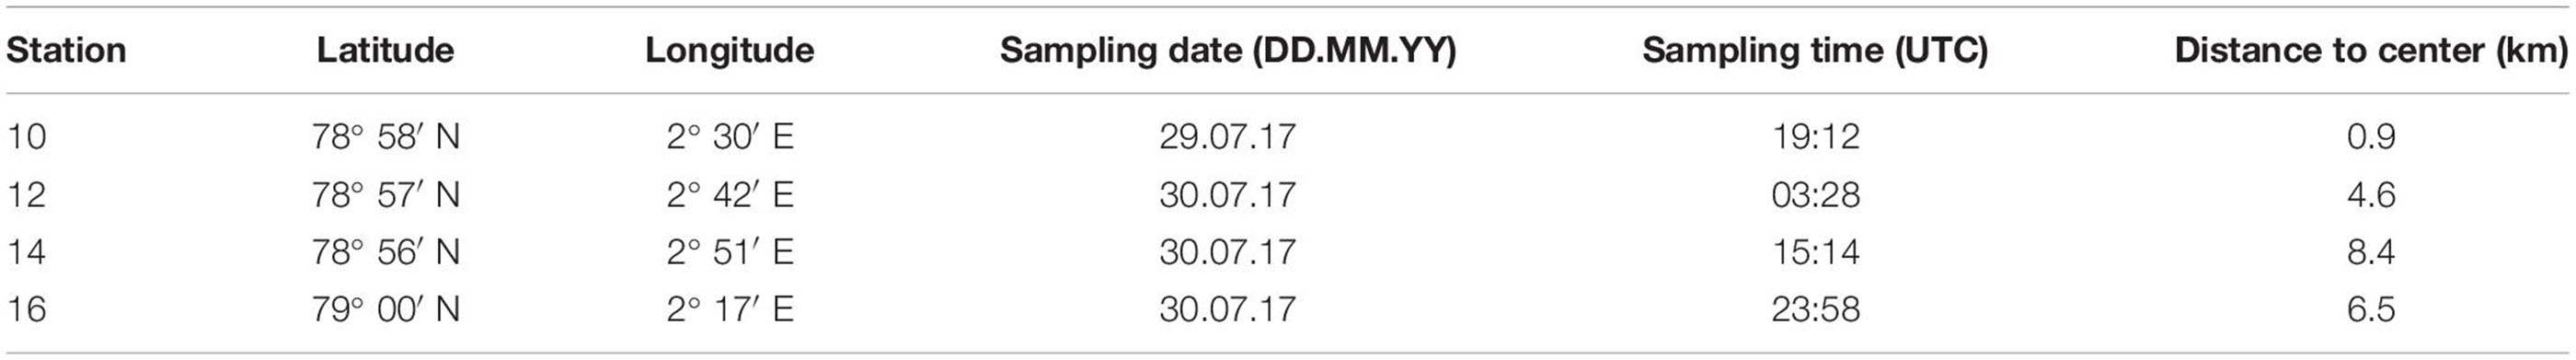
Table 1. Geographic position, sampling date and time as well as the distance to the center of the filament of the four MultiNet Stations sampled across a submesoscale filament in Fram Strait.
For the microscopic analysis, zooplankton samples were split into subsamples (1/2 to 1/128, depending on the total abundance of the sample) using a Motoda plankton splitter (Motoda, 1959). Identification was performed to the lowest possible taxonomic level using a dissecting microscope Leica MZ12.5. Copepoda (calanoid, cyclopoid, and harpacticoid), Amphipoda, Euphausiacea, and Pteropoda were generally identified to genus or, if possible, to species level, including developmental stages for Copepoda. Individuals were counted until at least 80 specimens were reached within a complete subsample. Biomass values were calculated for abundant species by multiplying the abundance data with published individual dry mass values for the Greenland Sea (Richter, 1994 and references therein).
In the Arctic, three Calanus species co-occur and usually dominate zooplankton communities in terms of biomass and ecological importance (Mumm et al., 1998; Auel and Hagen, 2002; Kosobokova and Hirche, 2009). While Calanus hyperboreus is easily identified based on morphological characteristics and its larger body size, Calanus finmarchicus and Calanus glacialis are two sister species, which are morphologically not distinguishable. A differentiation between both species based on prosome length has been proposed and widely used, considering copepodite stages CV larger than 2.9–3.0 mm and adult females larger than 3.2 mm to be C. glacialis, whereas smaller individuals are assigned to C. finmarchicus (e.g., Unstad and Tande, 1991; Kwaśniewski et al., 2003). However, several recent studies question the applicability of prosome length as a valid characteristic for Calanus species identification, as the size ranges of both species can considerably overlap (e.g., Nielsen et al., 2014; Choquet et al., 2017, 2018). Thus, fixed size thresholds are not applicable for species identification. In this study, we measured the prosome lengths of all 2,661 C. finmarchicus and C. glacialis specimens to check the applicability of length-frequency distributions for species identification. Depth-specific size distributions generally revealed distinct, non-overlapping bimodal size distributions, based on which adult females and copepodids CV of these two species were distinguished from each other. Calanus copepodids CI–III were pooled as Calanus spp. CI–III. Calanus copepodids CIV were separated between C. hyperboreus CIV and C. finmarchicus/glacialis CIV.
Community Analysis and Impact of Environmental Factors
Statistical analyses were conducted with PRIMER6 (version 6.1.6; Clarke and Gorley, 2006) and R (version 3.5.3, R Core Team, 2019). To investigate if and how the stations differed in terms of species composition, averaged Bray–Curtis dissimilarities were calculated based on log(x + 1) transformed total abundances of all species and on depth-specific abundances at each station. A non-metric multidimensional scaling (nMDS) plot and dendrogram were generated with PRIMER6 to visualize the differences, respectively.
To further evaluate how environmental factors affected the distribution of zooplankton species across the filament, we applied canonical correspondence analysis (CCA) using the vegan package in R (version 2.5–6, Oksanen et al., 2019). CCA is a multivariate method to help explain the relationships between species assemblages and their environment (ter Braak and Verdonschot, 1995; Greenacre and Primicerio, 2013) and has found widespread use in aquatic science (e.g., Herman and Dahms, 1992; Pinto-Coelho et al., 2005; Sell and Kröncke, 2013). For the analysis, species abundances (ind. m–3) for each of the five depth intervals were used with the mean depth and mean temperature of the respective depth interval as well as the distance of the four stns to the filament center as the abiotic factors. Distance was used as positive values. Thus, the analysis does not differentiate between east and west of the filament center, but rather indicates the distribution of species close to and far away from the center of the filament. Permutation tests were further performed in R with the vegan package using the anova.cca function (version 2.5–6, Oksanen et al., 2019).
Results
Zooplankton Abundance and Biomass
Total zooplankton abundance was by far the highest in the upper 50 m of stn 10 (0–10 m: 18,257 ind. m–3, 10–50 m: 10,912 ind. m–3), close to the center of the filament (Figure 2). Below 50 m numbers dropped to 1,152 ind. m–3 (50–100 m) and less than 250 ind. m–3 (100–300 m). Surface abundance at stn 12 was also high but approximately half the values of stn 10. The elevated numbers at both stns were largely due to Oithona spp. and copepod nauplii. Stns 14 and 16 had lowest total abundances in surface waters (<1,800 ind. m–3), values in the upper 50 m comprised less than 16% of the numbers at stn 10. Between 100 and 300 m Microcalanus spp., Metridia spp., and Oncaea spp. became important components in terms of contribution to abundance. Total abundance below 100 m was similar at all stns.
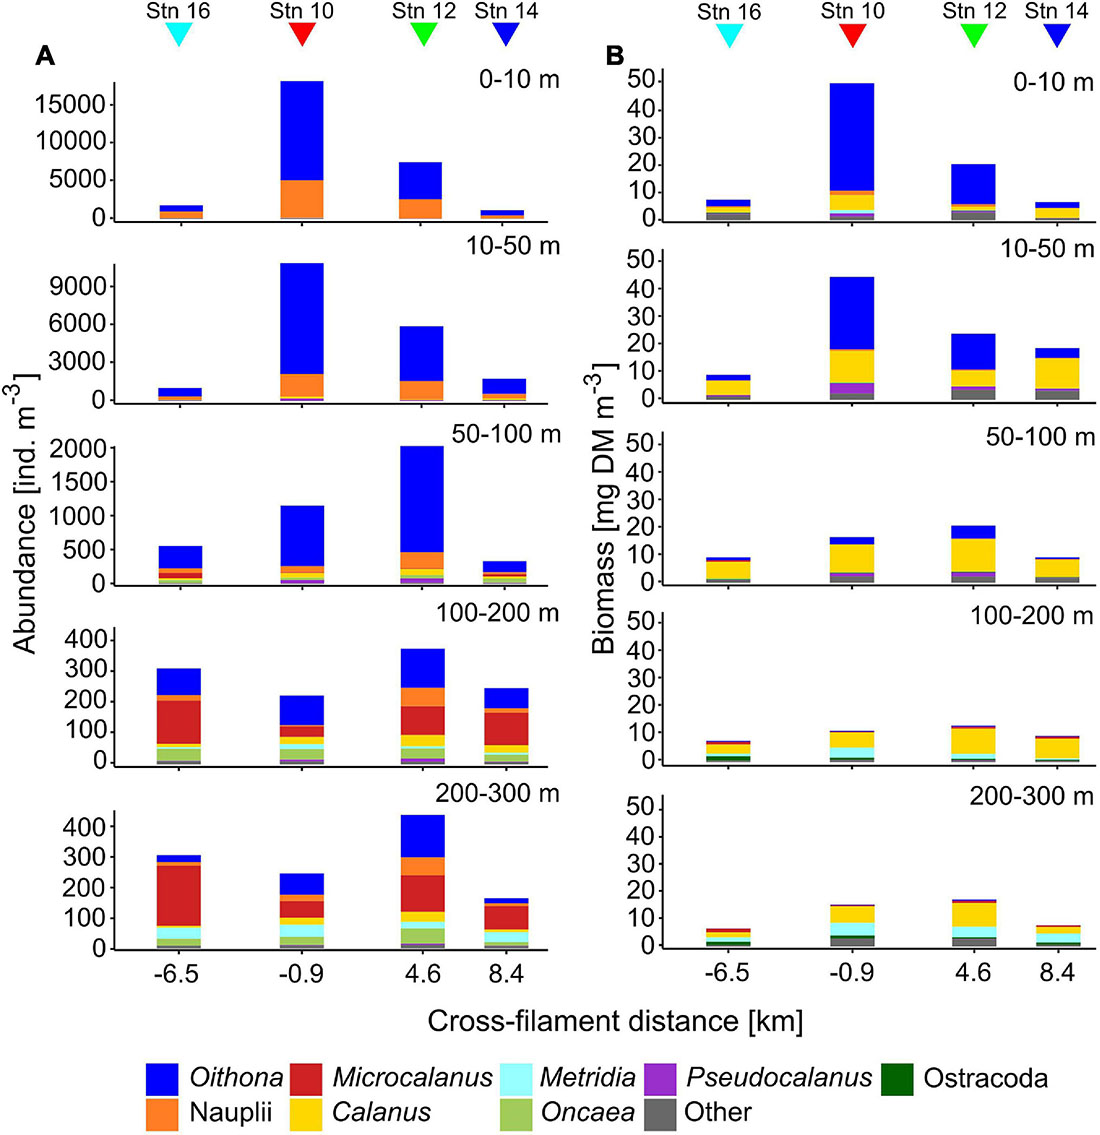
Figure 2. Vertical distribution of total zooplankton abundance (ind. m–3, A) and biomass (mg dry mass m–3, B) across the submesoscale filament. Colors indicate the contributions of different taxa. Colored triangles indicate the location of the four stations (16, 10, 12, and 14) across the filament.
Similar to abundance, total biomass was highest in surface waters at the center of the filament (stn 10), followed by stn 12 (Figure 2). At the outer stations, biomass in the upper 50 m was 27% (stn 14) or even below 20% (stn 16) of the value at stn 10. This difference was again mainly due to the dominance of Oithona spp. at stns 10 and 12, but higher numbers of copepod nauplii, Pseudocalanus spp., Calanus CI–III, C. finmarchicus/glacialis CIV also contributed to the increased biomass. Due to their small size, Oithona spp. are usually not the main contributors to biomass. However, at stn 10, and partly also at stn 12, Oithona spp. appeared in such high densities (13,126 ind. m–3 at stn 10), that it comprised up to 78% of total biomass in the upper 10 m, compared to only 30% at stns 14 and 16. Calanus spp. were main contributors to total biomass throughout the sampled water column, while Metridia longa contributed significantly below 100 m. Similar to abundance, the variability of total biomass between the stns decreased with depth.
In total, 35 different taxonomic categories were identified at the four stns (Table 2). With at least 27 species, copepods were the most diverse and abundant taxon, comprising about 80% of total abundance at all stns. While Calanoida were the most species-rich order, Cyclopoida (mainly Oithona spp.) dominated in terms of abundance with 59–93% of all copepods at all stns.
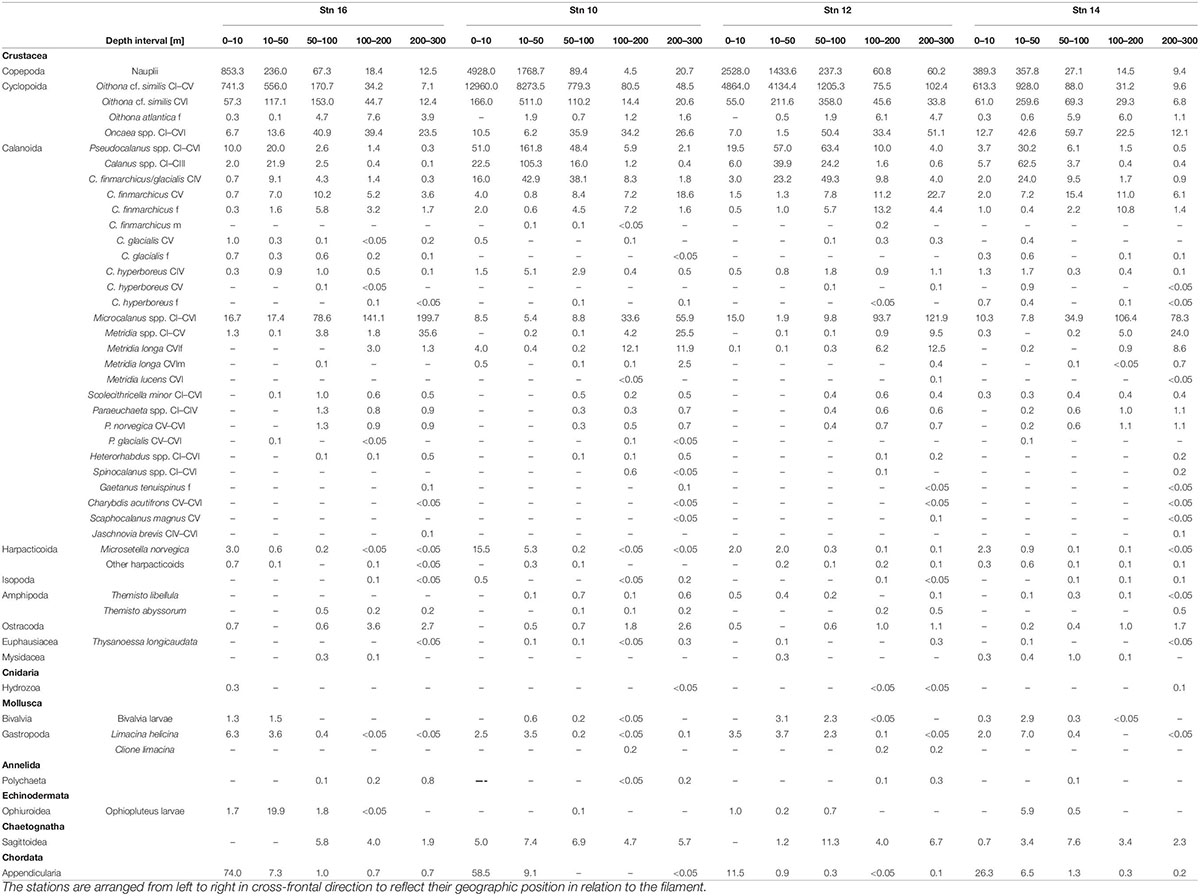
Table 2. Abundance (ind. m–3) of zooplankton taxa at the four stations across the submesoscale filament in Fram Strait, July/August 2017.
Zooplankton Distribution Across the Filament
Visualization of Bray–Curtis dissimilarities between the four stations as a nMDS plot indicates that stns 14 and 16, even though they were the furthest apart from each other, were the most similar with regard to species composition (Figure 3A). Stn 10 deviated most from the other stations. Stn 12 was somewhere in between the central stn 10 and the outer stns 14 and 16. The hierarchical cluster analysis of depth-specific species composition at each station revealed that depth had a strong influence on differences between and within stations (Figure 3B). Two main clusters were formed, with surface waters (0–100 m, D1–3) in one and lower epipelagic to mesopelagic depths in the other cluster (100–300 m, D4–5), except for 50–100 m (D3) of stn 10 and 12 which was included in the cluster of surface samples. Similar to the nMDS plot, the hierarchical cluster analysis also indicated that stns 14 and 16 were more similar, as the individual depth intervals of both stns clustered together. Stns 10 and 12 also had lower distances to each other, except 0–10 m (D1) at stn 12, which grouped to stns 14 and 16.
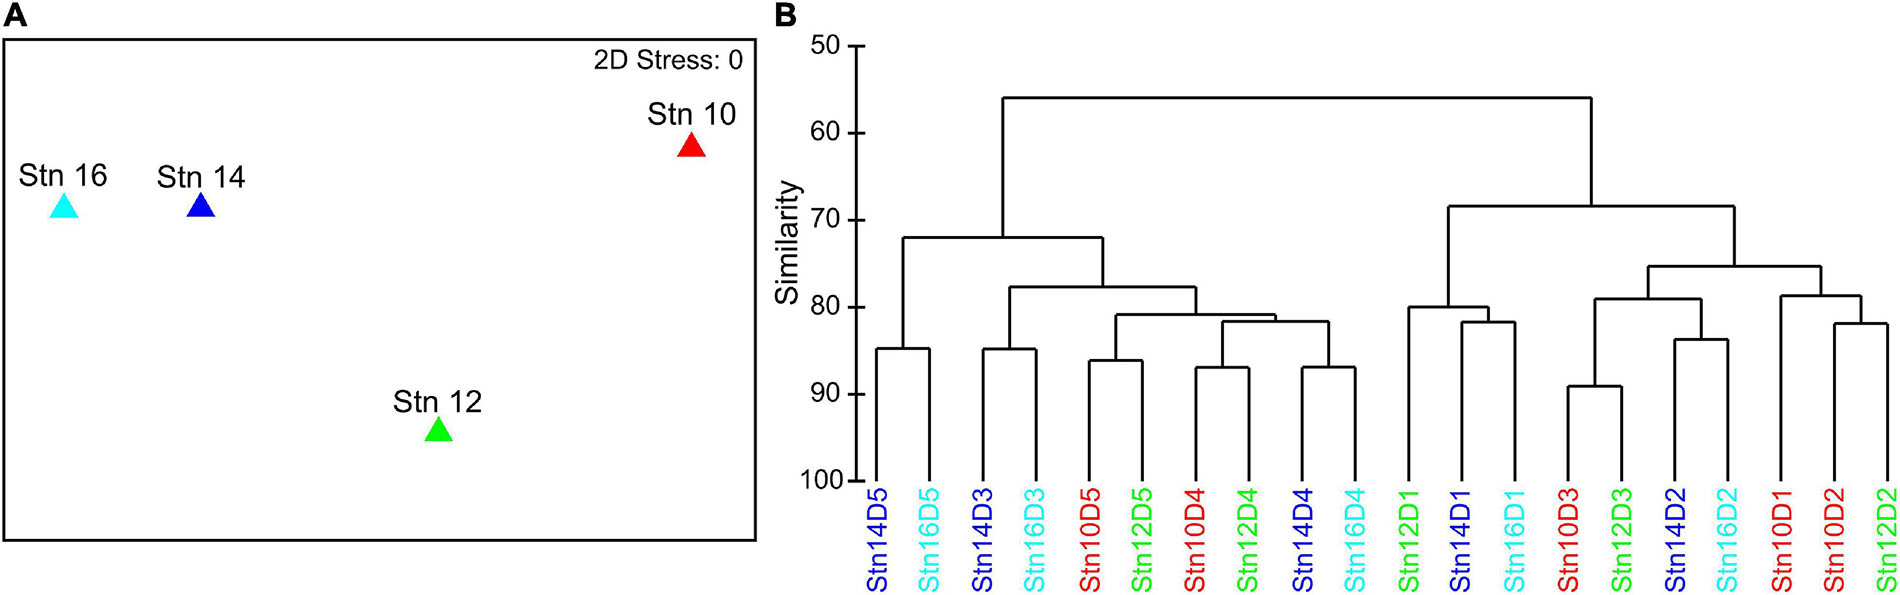
Figure 3. (A) Non-metric multidimensional scaling (nMDS) plot of the four stations across the filament based on a Bray–Curtis dissimilarity matrix of log(x + 1) transformed total abundances of all species at each station. (B) Hierarchical cluster analysis based on a Bray–Curtis dissimilarity matrix of log(x + 1) transformed depth-specific species abundances at each station. D1: 0–10 m, D2: 10–50 m, D3: 50–100 m, D4: 100–200 m, D5: 200–300 m.
To evaluate distribution patterns across the filament, a canonical correspondence analysis (CCA) was performed, using depth, temperature and the absolute distance to the filament center as environmental variables. The two axes with highest explanatory factors were used to generate the ordination plot (Figure 4). The first axis explained 60% of total variance, the second axis added another 4%. Thus, 64% of total variance was explained. Depth was mainly correlated to CCA1, i.e., increasing toward the right. Temperature and distance to the filament center were associated with the second axis, but in opposite directions, i.e., lower temperatures with increasing distance to the center.
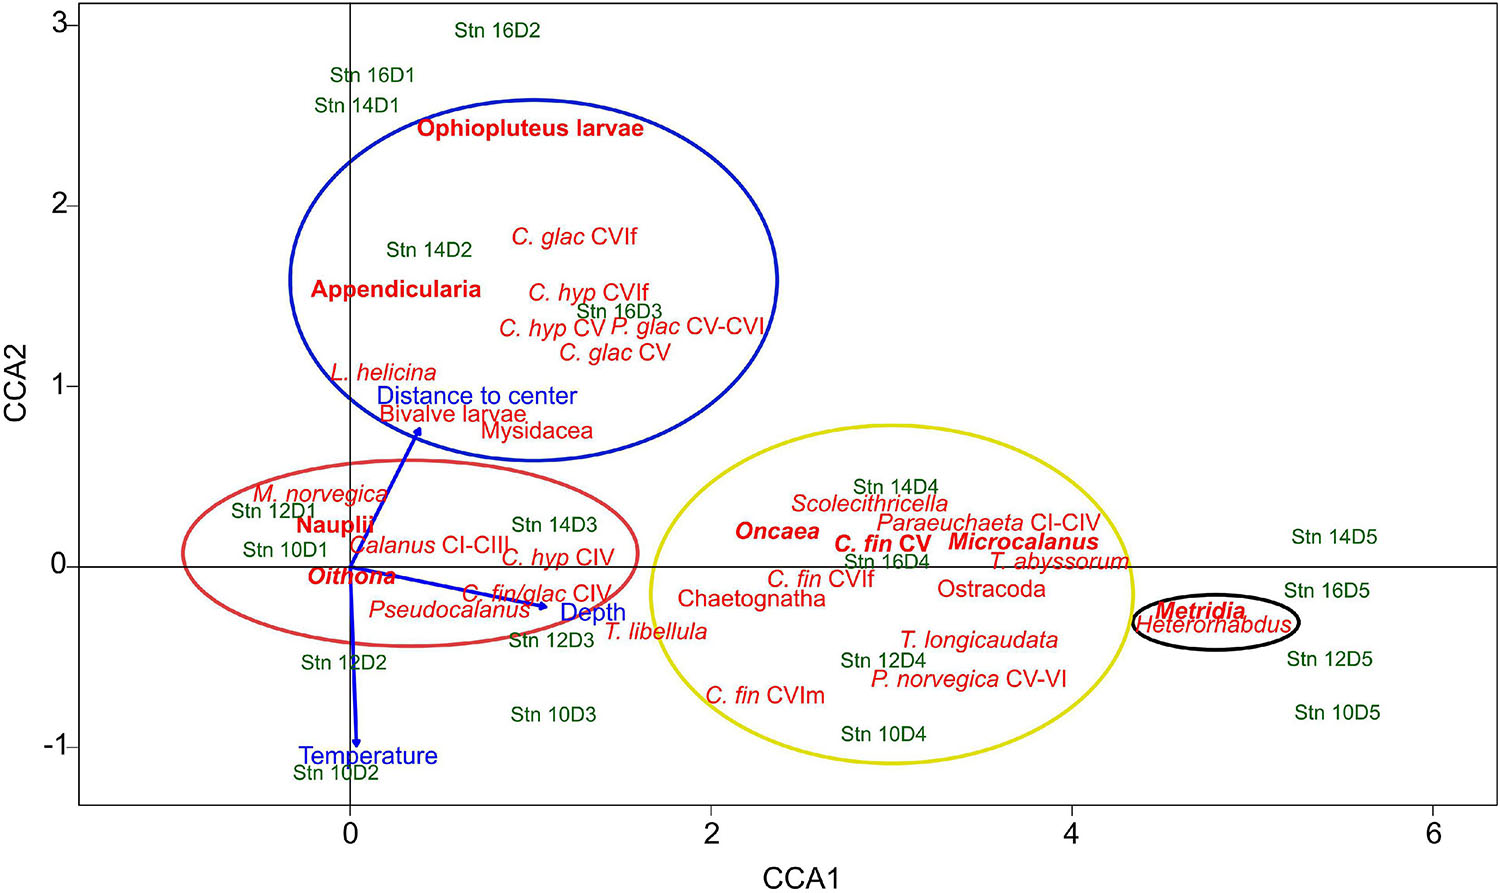
Figure 4. Canonical correspondence analysis (CCA) triplot of the most common zooplankton taxa, environmental variables (depth, temperature, and distance to the filament center) and individual depth-stratified samples across the submesoscale filament. Stn: Station. D1–D5 indicate depth intervals, D1: 0–10 m, D2: 10–50 m, D3: 50–100 m, D4: 100–200 m, D5: 200–300 m. The first axis (CCA1) explains 60%, the second axis (CCA2) explains 4% of the total variance. Colored circles indicate the association of taxa with the four distribution types, red: convergence and concentration of surface inhabitants close to the filament center, blue: polar taxa at outer stations, black: emergence of mesopelagic taxa beneath the filament, yellow: mesopelagic taxa, including travelers with along-frontal jets. Indicated in bold are the main contributors of respective distribution types. Species abbreviations: C. glac, Calanus glacialis; C. hyp, Calanus hyperboreus; C. fin, Calanus finmarchicus; P. glac, Paraeuchaeta glacialis; P. norvegica, Paraeuchaeta norvegica; M. norvegica, Microsetella norvegica; T. libellula, Themisto libellula; T. abyssorum, Themisto abyssorum; T. longicaudata, Thysanoessa longicaudata; L. helicina, Limacina helicina. CI to CVI, copepodite stage; f, female; m, male.
Based on the arrangement of the taxa in the CCA triplot, the following four distinct distribution patterns across the filament were identified:
Convergence and Concentration of Surface Inhabitants Close to the Filament Center
Taxa of this group showed an accumulation in the surface layer (upper 50 m) close to the center of the filament, while occurring at much lower concentrations at the outer stations. This group includes Oithona spp., copepod nauplii, Pseudocalanus spp., Calanus copepodids CI-III, C. finmarchicus/glacialis CIV, Microsetella norvegica and C. hyperboreus CIV (Figure 4, red circle). The distributions of the two most abundant representatives of this group (Oithona and nauplii) are visualized in Figure 5, Group A.
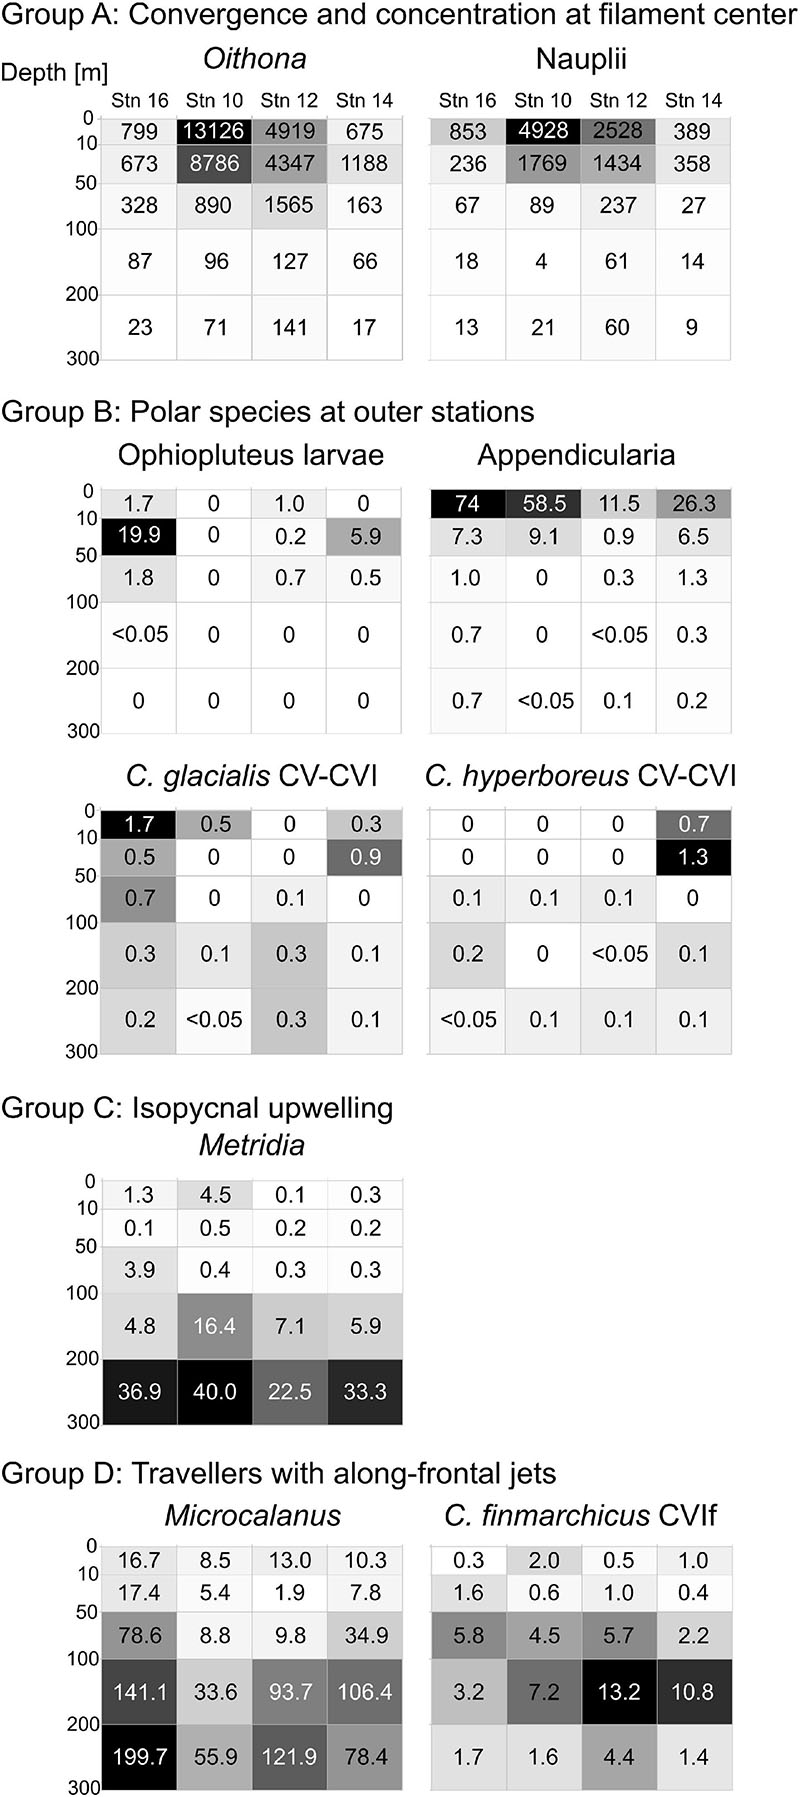
Figure 5. Distribution heatmaps of most abundant and/or ecologically important zooplankton taxa sorted according to the four distribution types (Groups A–D) across the submesoscale filament. Numbers inside the heatmaps show abundances (ind. m–3). Darker shading indicates higher abundances.
Polar Taxa at the Outer Stations
In contrast to taxa of Group A with high abundances in surface waters close to the filament center, C. glacialis CV and adult females, C. hyperboreus CV and adult females, Paraeuchaeta glacialis CV–CVI, ophiopluteus larvae, the pteropod Limacina helicina, Bivalvia larvae, Mysidacea and Appendicularia were generally more abundant in the polar surface waters of the outer stns 14 and 16 (Figure 4, blue circle).
This distribution pattern was most prominent for ophiopluteus larvae (Figure 5, Group B), which were completely absent at stn 10 and only appeared in low numbers in the upper 100 m at stn 12 (51 ind m–2), while exhibiting much higher densities at stn 14 (261 ind m–2) and stn 16 (903 ind m–2). Appendicularians were the most abundant representative of Group B (Figure 5), with high numbers in the upper 100 m at the outer stns (631 ind. m–2 at stn 14; 1,222 ind. m–2 at stn 16), but also exhibiting high abundances at stn 10 (952 ind m–2). C. glacialis and C. hyperboreus copepodids CV and adults were most abundant in the Polar Surface Water at the outer stns (Figure 5, Group B). While C. glacialis occurred at both sides of the filament, C. hyperboreus was only present on the eastern side.
Emergence of Mesopelagic Taxa Beneath the Filament/Isopycnal Upwelling
Occurrences of Metridia spp., comprising mainly M. longa and only few Metridia lucens, and Heterorhabdus spp. (mainly Heterorhabdus norvegicus) were both highly correlated with depth (Figure 4, black circle). In contrast to the surface-inhabiting taxa of Groups A and B, their distribution was less influenced by the distance to the filament center.
The distribution pattern is depicted for Metridia spp. in Figure 5, Group C. Metridia was rare in the epipelagic at all stns and showed highest abundances below 200 m. At stn 10, Metridia spp. showed an elevated abundance between 100 and 200 m compared to the other stns, linked to the characteristic doming of the isopycnals at that depth close to the center of the filament.
Travelers With the Along-Frontal Jets
Group D includes Microcalanus spp., C. finmarchicus adult females (presented in Figure 5) and Ostracoda. While these taxa were rather abundant throughout the sampled water column below 50 m, patches of higher concentrations occurred at the shoulders of the filament in the areas of the frontal jets. This pattern was most distinct for Microcalanus spp. (Figure 5, Group D), with minimum abundances at stn 10, but maxima between 100 and 300 m at stns 12, 14, and 16. Adult females of C. finmarchicus showed a similar pattern, but in contrast to Microcalanus spp., they were more abundant on the eastern side of the filament at stns 12 and 14 between 50 and 200 m (Figure 5, Group D). In contrast, ostracods were most abundant on the western side of the filament at stn 16 between 100 and 300 m (Table 2).
Calanus finmarchicus copepodids CV occurred in the lower epipelagic to mesopelagic layers, but without emergence at the filament center. Similar to females, they were also found in the northward flowing along-front jet on the eastern side. Highest densities were determined between 200 and 300 m at stns 10 and 12 and between 50 and 200 m at stn 16 (Table 2).
Permutation tests to analyze the importance of the environmental variables revealed that depth was highly significant in explaining the variance of zooplankton distribution across the filament (p = 0.001), whereas temperature (p = 0.112) and distance to the filament center (p = 0.449) were not significant. However, when only surface species (red and blue clusters; Groups A and B) were included in the analysis, temperature became a significant variable (p = 0.031), i.e., temperature significantly impacted epipelagic zooplankton distribution. The p-value of distance to the filament center also improved, but remained non-significant (p = 0.082).
Depth-Dependent Size-Frequency Distributions of C. finmarchicus and C. glacialis
Prosome lengths of C. finmarchicus and C. glacialis copepodids CV and adult females increased with depth at all stns (Figure 6). This trend was most pronounced in copepodids CV (Figure 6A), but was also observed in adult females (Figure 6B). Thus, fixed size thresholds are not applicable for the discrimination of the two co-occurring Calanus species. As individual size increases with depth, the threshold to differentiate between C. finmarchicus and C. glacialis has to increase as well, otherwise deeper occurring larger specimens of C. finmarchicus would be incorrectly identified as C. glacialis.
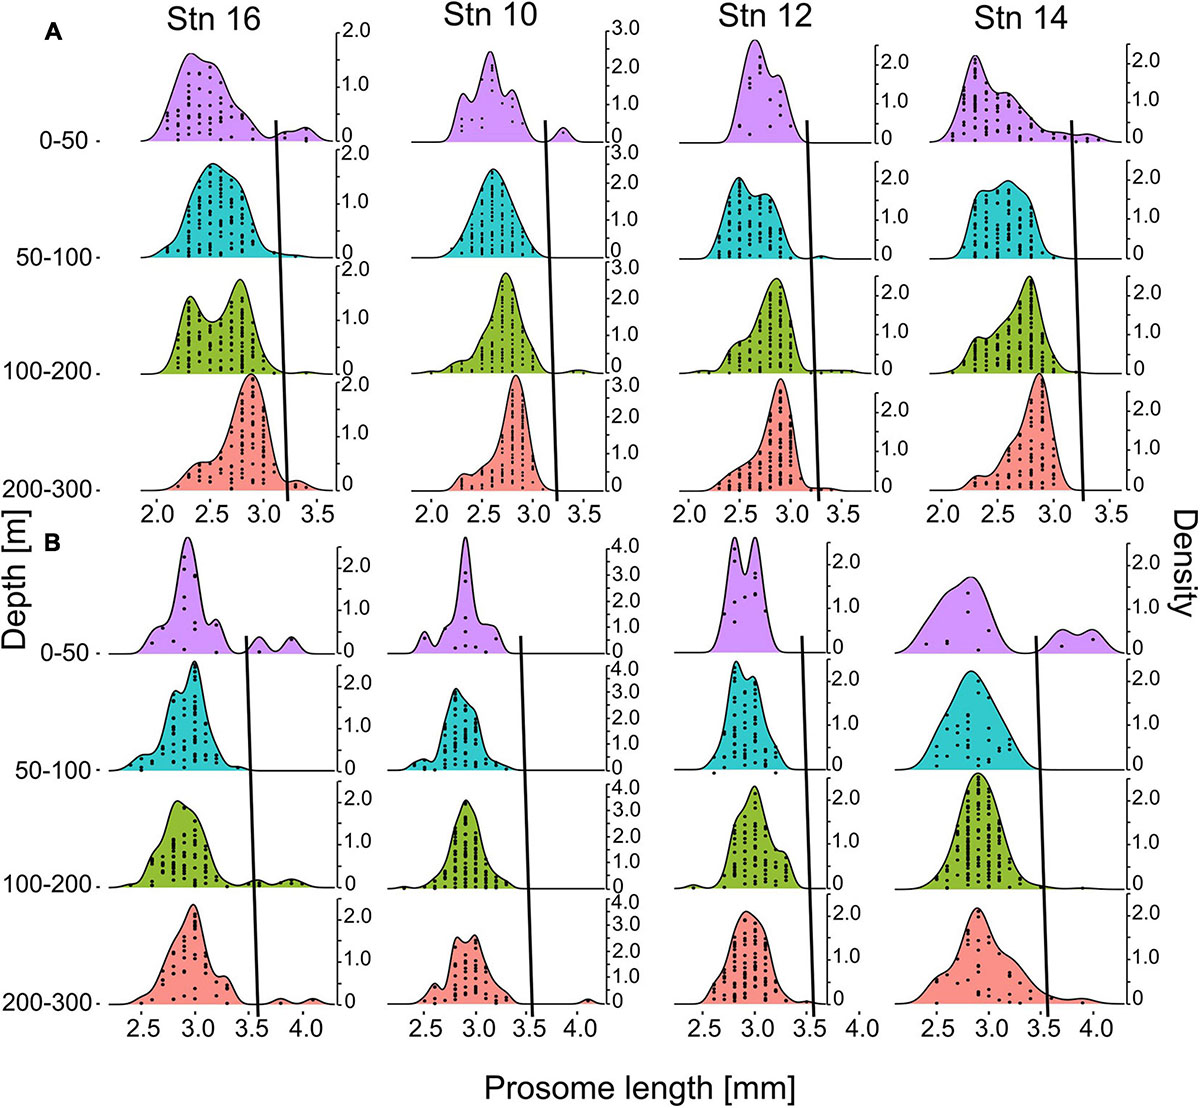
Figure 6. Density plot of size distributions of C. finmarchicus/glacialis CV (A) and adult females (B) prosome lengths for four distinct depth intervals at stations 10, 12, 14, and 16. Sampling intervals 0–10 m and 10–50 m were pooled due to low numbers of individuals. Second y-axes indicate kernel density estimations. Stations are arranged in cross-frontal direction. Each dot within the size-frequency distribution indicates one individual per respective size. Black lines show the thresholds for species separation of C. finmarchicus and C. glacialis, i.e., smaller individuals to the left of the respective line were identified as C. finmarchicus, larger specimens to the right as C. glacialis.
Several samples, in particular those from the outer stns dominated by Polar Surface Water, showed bimodal length-frequency distributions of Calanus with smaller secondary maxima at 3.2–3.5 mm in copepodids CV and >3.5 mm in adult females, respectively (Figure 6). For the present study, individuals from those secondary peaks were considered C. glacialis with a depth-dependent increase in the length threshold for species identification (black lines in Figures 6A,B).
Discussion
Calanus Depth-Dependent Size Distribution
Body size of C. finmarchicus and C. glacialis copepodids CV and adult females increased with increasing depth even on the relatively small vertical scale from 0 to 300 m (epipelagic to upper mesopelagic). Such a body size-dependent habitat partitioning within developmental stages of Calanus has to our knowledge not been published before. Calanus species are capable of diel vertical migrations (DVM), seeking shelter from predators in deeper layers during day and migrating to the surface to feed under the cover of darkness at night. However, several studies demonstrate that in polar regions DVM is only weakly pronounced during periods of midnight sun due to only little fluctuations in the light regime (Blachowiak-Samolyk et al., 2006; Cottier et al., 2006). The sampling campaign of the submesoscale filament was within the timespan of constant daylight. Further, local time of samplings varied over the day between the stations (9 pm, 5:30 am, 5 pm, and 2 am). Although sampling times differed, the size-depth distribution pattern stayed the same at the four stations. Hence, it is highly unlikely that DVM was responsible for the size-depth distribution of Calanus. Among other explanations of depth-dependent increases in body size or vertical segregation by size in zooplankton are predator avoidance with size-specific differences in predation risk (Hunt and Harrison, 1990; De Robertis et al., 2000) and niche selection (e.g., Laakmann et al., 2009, for vertical partitioning to avoid inter-specific competition; Kaiser et al., 2018, for cryptic species). In addition, variations in lipid content may affect buoyancy and the start of the ontogenetic descent to overwintering depths (Hirche, 1997; Melle et al., 2014). However, those mechanisms usually act on larger scales and between ontogenetic stages. Vertical sampling with high spatial resolution by optical methods (e.g., LOKI, Hirche et al., 2014) will be required to elucidate the reasons for the fine-scale vertical zonation by body size within ontogenetic stages of Calanus.
Ecological Roles of Submesoscale Filaments
The present study reveals several key effects of submesoscale structures on zooplankton distribution, ecology and dynamics.
Accumulation of Zooplankton Biomass
Convergence of surface water has the potential to increase abundance and biomass of planktonic organisms in frontal zones (Epstein and Beardsley, 2001; Strass et al., 2002; Ohman et al., 2012). Empirical studies often focus on phytoplankton, as the applicability of methods like remote sensing allows an investigation of the influence of small-scale structures in much easier and feasible ways compared to zooplankton research. With the aid of satellite data those studies identified increased chlorophyll concentrations associated with submesoscale fronts (Shulman et al., 2015; Liu and Levine, 2016; Guo et al., 2019).
Across the filament, extreme differences in densities of epipelagic zooplankton species were observed, with maximum abundance and biomass values in the upper 50 m at the stns closest to the center of the filament (stns 10 and 12). The concentration of epipelagic zooplankton in the center of the filament is likely the result of physical-biological interactions (Folt and Burns, 1999). Physically, the convergence of surface water associated with the submesoscale filament, which also led to the accumulation of sea ice (von Appen et al., 2018), concentrates epipelagic organisms at the site of downwelling. Among the zooplankton taxa which occurred across the filament, different swimming capabilities are found. Euphausiid species and the hyperiid amphipod Themisto are usually considered good and active swimmers (Kraft et al., 2012; Richerson et al., 2015) and thus may resist accumulation processes. Generally, however, planktonic organisms passively drift with horizontal ocean currents, but they can, to some extent, swim against vertical velocities (Genin et al., 2005). Several studies demonstrated a strong fidelity of zooplankton species to particular depth layers and associated environmental conditions (Ashjian and Wishner, 1993; Ashjian et al., 1994).
Active vertical counter-swimming leads to zooplankton accumulation at downwelling sites (Olson et al., 1994). In our case, an over 10- and 16-fold increase in abundance of epipelagic zooplankton close to the center of the filament in comparison to the outer stations supports our first statement.
Ohman et al. (2012) detected elevated mesozooplankton abundances at a submesoscale front in the California Current, including local maxima of calanoid copepods and Oithona. A higher ratio of nauplii to copepodids at the front suggested enhanced secondary production. In our study, the nauplii to copepodids ratio remained constant across the filament. However, the presence of Calanus males and eggs at stn 10 and 12 (Table 2, H. Auel, pers. obs.) indicated reproductive activities. The generation times of zooplankton usually exceed the persistence of small-scale dynamics. Nevertheless, the enhanced availability of phytoplankton at convergence zones creates beneficial feeding conditions and may stimulate secondary production. In turn, elevated concentrations of zooplankton at small-scale frontal zones represent foraging hotspots for top predators, as indicated by increased foraging success or time spend at such fronts for tunas (Snyder et al., 2017), seabirds (Hyrenbach et al., 2006; De Monte et al., 2012), elephant seals (Rivière et al., 2019; Siegelman et al., 2019) and whales (Davis et al., 2002).
Structuring the Pelagic Realm
Depth is usually the main factor structuring zooplankton communities, as demonstrated for the Arctic by Auel and Hagen (2002) and Kosobokova et al. (2010). However, the present study shows that submesoscale filaments can alter the vertical distribution of certain zooplankton species on very small horizontal and vertical scales. The doming of isopycnals in the upper mesopelagic at the filament center leads to an emergence of the mesopelagic copepods Metridia spp. and Heterorhabdus spp. Most likely, they passively followed the upwelling of the surrounding water body in order to stay in their preferred environmental conditions in terms of temperature and salinity (Ashjian and Wishner, 1993; Ashjian et al., 1994). In addition, enhanced food availability (phytoplankton and small copepods) caused by the accumulation through convergence in the center of the filament could have attracted these omnivorous copepods closer to the surface.
The center and intermediate depths of the filament were characterized by Atlantic Water and its associated species, such as C. finmarchicus and P. norvegica, but also carried more widespread taxa such as Microcalanus. In contrast, surface waters at the outer stns 14 and 16 were of polar origin and contained clearly different communities. Polar species, such as the copepods C. glacialis, C. hyperboreus, and P. glacialis, the pteropod L. helicina and ophiopluteus larvae, were considerably more abundant in those waters. The high spatial heterogeneity of zooplankton communities on small spatial scales matches physical oceanographic observations, which show that distinct unmixed water masses can occur close to each other in submesoscale filaments (von Appen et al., 2018).
The results support our second and third statements: different water masses associated with the filament are characterized by distinct zooplankton communities even on short spatial scales and the doming isopycnals at the filament center cause the emergence of mesopelagic species.
Vector for Biological Connectivity
Associated with the submesoscale filament, along-frontal jets with enhanced velocities at intermediate depths on both sides of the convergence zone were observed. Hancke et al. (2014) suggested that such fast-flowing along-frontal currents could act as vectors of biological connectivity. They demonstrated that drifters traveling within frontal jets crossed the Mozambique Channel significantly faster compared to drifters trapped in much slower propagating eddies. The transport in those jets represents a suitable time frame for the survival of planktonic larvae and thus may explain the biological connectivity between regions across the Mozambique Channel (Hancke et al., 2014; Marsac et al., 2014).
In the current study, patches of higher abundances of certain species were detected within the along-frontal jets. It is important to note that abundances of those species were different on both sides of the filament. Thus, the northward and southward jets should not be seen as compensating each other with zero net transport. For instance, abundance of C. finmarchicus was higher in the northward jet, indicating a northward net transport. The along-frontal jets exhibited a maximum speed exceeding 0.5 m s–1 (von Appen et al., 2018), which is equivalent to 43 km per day. In comparison, the mean current velocity of the core of the West Spitsbergen Current is around 0.15 m s–1 with a maximum of >0.2 m s–1. Velocities of the offshore West Spitsbergen Current branch range between 0 and 0.15 m s–1 (Beszczynska-Möller et al., 2012). Similar and even higher values for along-frontal jets, up to 1 m s–1, were reported by Hernández-Hernández et al. (2020) for a submesoscale frontal zone south of the Canary Islands. A drifting sediment trap, which was deployed during our filament survey close to the northward frontal jet, traversed 26 km in 21 h, further emphasizing the impact of such filament-associated flows (von Appen et al., 2018).
The length of the sea-ice streak suggests a horizontal extension of the filament of at least 50 km. Thus, zooplankton traveling within the fast-flowing jets may only have a short residence time of one to a few days in the filament. However, Hancke et al. (2014) demonstrated the connectivity between fronts by drifters moving from one frontal zone to another, enabling the coverage of large distances in a short time. Especially in highly dynamic systems like the MIZ, submesoscale dynamics may be omnipresent and could thus (involuntarily) be utilized by zooplankton as ‘transportation highways’. Hence, submesoscale dynamics could not only play a role in plankton patchiness and structuring the pelagic realm, but the associated along-frontal jets may also be relevant for biological connectivity and species distribution, supporting our fourth statement.
The elevated abundance of CV and females of C. finmarchicus, an expatriate species from the boreal-Atlantic, in the northward flowing eastern jet could particularly be of importance for the Arctic marine ecosystem. Due to ongoing climate change and associated rising temperatures in the Arctic, shifts in the biogeographical distribution of pelagic species can be observed, with Atlantic species extending their ranges northward (Beaugrand et al., 2009). Further, due to rising temperatures, the width of the MIZ is constantly increasing during summer (Strong and Rigor, 2013), possibly providing an extending area for submesoscale dynamics and associated fast-flowing jets, which may accelerate ‘Atlantification’ processes in the Arctic, although further supportive evidence is needed.
Atlantic zooplankton species tend to be smaller, less lipid-rich, i.e., less nutritious, and have different life-cycle strategies than their Arctic counterparts (Hagen, 1999; Scott et al., 2000; Auel et al., 2009). Shifts in species distribution can have major implications for polar ecosystems (Węsławski et al., 2009). For instance, several studies demonstrate the strong dependency of the Arctic planktivorous little auk (Alle alle) on the larger Arctic Calanus species (Kwaśniewski et al., 2010). The advection of different water masses can rapidly change the composition of zooplankton communities in Arctic fjords (Willis et al., 2006). When Atlantic water carrying C. finmarchicus intrudes, little auks accept longer foraging trips in order to find Arctic water masses with their preferred prey (Karnovsky et al., 2010; Kwaśniewski et al., 2010).
Figure 7 summarizes the different effects of the submesoscale filament on zooplankton dynamics, integrating underlying oceanographic mechanisms with biological implications: (A) convergence and associated accumulation of epipelagic zooplankton at the filament center; (B) distinct water masses in close proximity leading to changes in zooplankton community structure over short distances; (C) emergence of mesopelagic species at the filament center coinciding with the doming of isopycnals below 100 m depth; (D) along-frontal jets as high-speed transport vectors for certain zooplankton species.
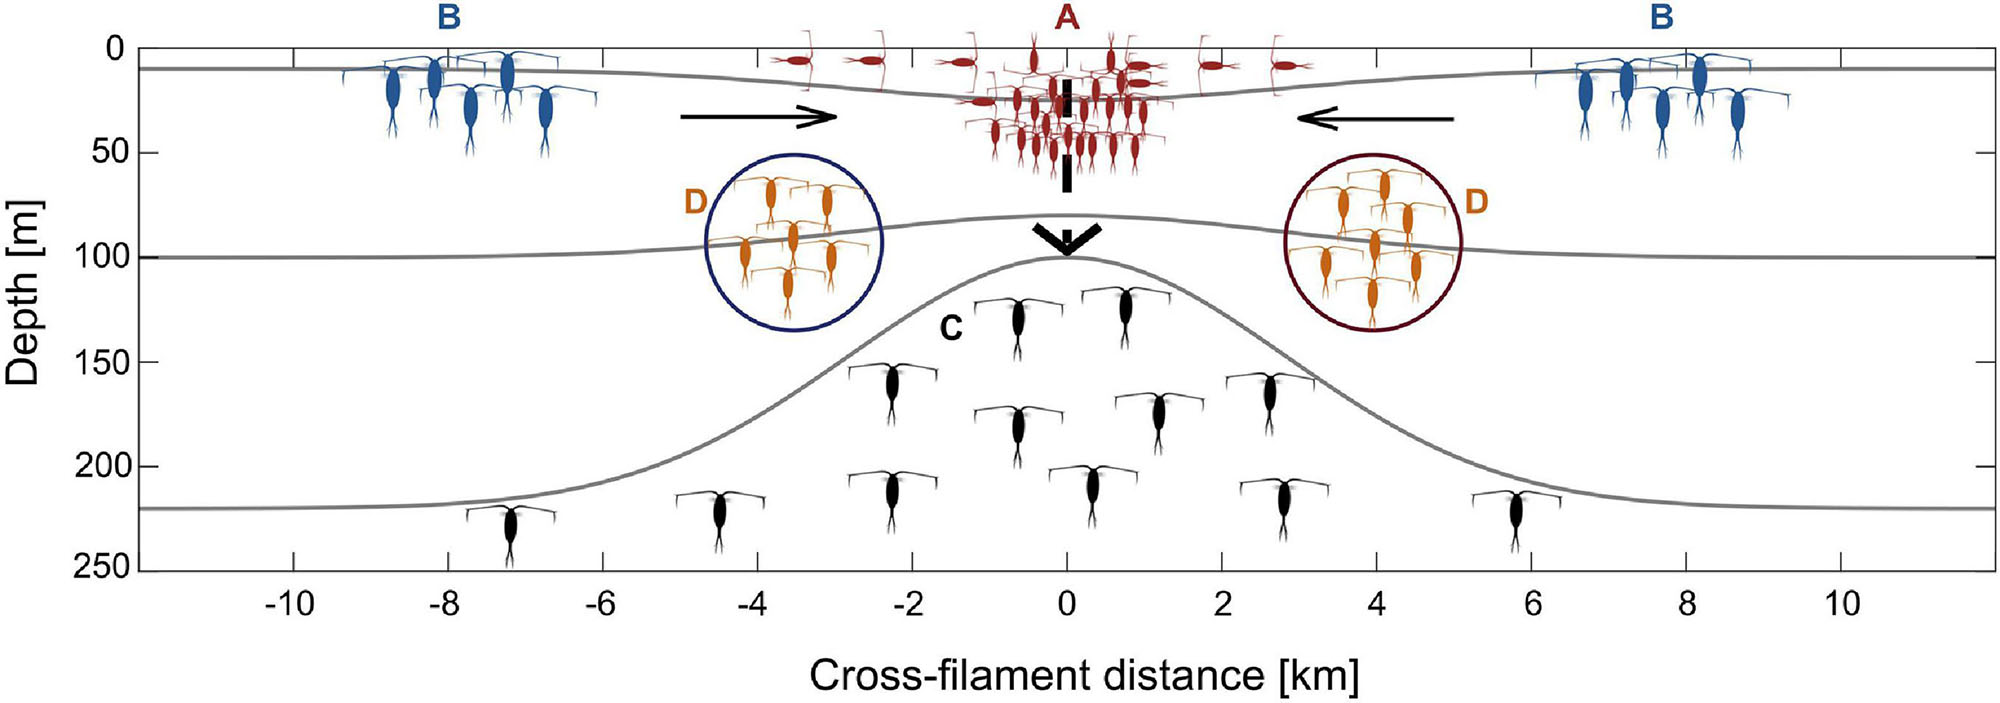
Figure 7. Schematic illustration of the effects of a submesoscale filament on zooplankton dynamics in the Arctic marginal ice zone. Colors of copepods represent different distribution patterns, i.e., red: convergence of surface species at the filament center (Group A), blue: concentration of Arctic species in Polar Surface Water at the outer stations (Group B), black: emergence of mesopelagic species by isopycnal doming/upwelling (Group C), orange: species in along-frontal jets (Group D).
Data Availability Statement
The original contributions generated for this study are included in the article, further inquiries can be directed to the corresponding author.
Author Contributions
HA, WJvA, BN, and NH conducted the fieldwork. PK analyzed the samples, conducted the data analyses, and drafted the manuscript. PK, WH, WJvA, BN, NH, and HA significantly contributed to improving the final manuscript. All authors approved the submitted version.
Funding
Ship time was provided under grant AWI_PS107_10. NH was supported by the Russian–German Research Cooperation QUARCCS funded by the German Ministry for Education and Research (BMBF) under grant 03F0777A.
Conflict of Interest
The authors declare that the research was conducted in the absence of any commercial or financial relationships that could be construed as a potential conflict of interest.
Acknowledgments
We would like to thank the captain and crew of RV Polarstern during PS107 for their skillful support during the cruise.
References
Acha, M., Piola, A., Iribarne, O., and Mianzan, H. (2015). “Ecological processes at marine fronts: Oases in the Ocean,” in SpringerBriefs in Environmental Science. (Berlin: Springer), 68. doi: 10.1007/978-3-319-15479-4
Ashjian, C. J., Smith, S. L., Flagg, C. N., Mariano, A. J., Behrens, W. J., and Lane, P. V. Z. (1994). The influence of Gulf Stream meander on the distribution of zooplankton biomass in the slope water, the Gulf Stream, and the Sargasso Sea, described using shipboard acoustic Doppler current profiler. Deep-Sea Res. I 41, 23–50. doi: 10.1016/0967-0637(94)90025-6
Ashjian, C. J., and Wishner, K. F. (1993). Temporal persistence of copepod species groups in the Gulf Stream. Deep-Sea Res. I 40, 483–516. doi: 10.1016/0967-0637(93)90143-q
Auel, H., and Hagen, W. (2002). Mesozooplankton community structure, abundance and biomass in the central Arctic Ocean. Mar. Biol. 140, 1013–1021. doi: 10.1007/s00227-001-0775-4
Auel, H., Hagen, W., and Schiel, S. (2009). “Size does matter – In the sea of giants and dwarfs,” in Biological Studies in Polar Oceans: Exploration of Life in Icy Waters, eds I. Hempel and G. Hempel (Wirtschaftsvlg: Nordwest), 93–98.
Batten, S. D., and Crawford, W. R. (2005). The influence of coastal origin eddies on oceanic plankton distribution in the eastern Gulf of Alaska. Deep-Sea Res. II 52, 991–1009. doi: 10.1016/j.dsr2.2005.02.009
Beaugrand, G., Luczak, C., and Edwards, M. (2009). Rapid biogeographical plankton shifts in the North Atlantic Ocean. Glob. Change Biol. 15, 1790–1803. doi: 10.1111/j.1365-2486.2009.01848.x
Beszczynska-Möller, A., Fahrbach, E., Schauer, U., and Hansen, E. (2012). Variability in Atlantic water temperature and transport at the entrance to the Arctic Ocean, 1997-2010. ICES J. Mar. Sci. 69, 852–863. doi: 10.1093/icesjms/fss056
Blachowiak-Samolyk, K., Kwaśniewski, S., Richardson, K., Dmoch, K., Hansen, E., Hop, H., et al. (2006). Arctic zooplankton do not perform diel vertical migration (DVM) during periods of midnight sun. Mar. Ecol. Prog. Ser. 308, 101–116. doi: 10.3354/meps308101
Choquet, M., Hatlebakk, M., Dhanasiri, A. K. S., Kosobokova, K., Smolina, I., Søreide, J. E., et al. (2017). Genetics redraws pelagic biogeography of Calanus. Biol. Lett. 13:20170588. doi: 10.1098/rsbl.2017.0588
Choquet, M., Kosobokova, K., Kwaśniewski, S., Hatlebakk, M., Dhanasiri, A. K. S., Melle, W., et al. (2018). Can morphology reliably distinguish between the copepods Calanus finmarchicus and C. glacialis, or is DNA the only way? Limnol. Oceanogr. Methods 16, 237–252. doi: 10.1002/lom3.10240
Clarke, K. R., and Gorley, R. N. (2006). PRIMER v6: User Manual/Tutorial (Plymouth Routines in Multivariate Ecological Research). PRIMER-E, Plymouth.
Cottier, F. R., Tarling, G. A., Wold, A., and Falk-Petersen, S. (2006). Unsynchronised and synchronised vertical migration of zooplankton in a high Arctic fjord. Limnol. Oceanogr. 51, 2586–2599. doi: 10.4319/lo.2006.51.6.2586
D’Asaro, E. A., Shcherbina, A. Y., Klymak, J. M., Molemaker, J., Novelli, G., Guigand, C. M., et al. (2018). Ocean convergence and the dispersion of flotsam. Proc. Natl. Acad. Sci. U.S.A. 115, 1162–1167. doi: 10.1073/pnas.1718453115
Davis, R. W., Ortega-Ortiz, J. G., Ribic, C. A., Evans, W. E., Biggs, D. C., Ressler, P. H., et al. (2002). Cetacean habitat in the northern oceanic Gulf of Mexico. Deep-Sea Res. I 49, 121–142. doi: 10.1016/S0967-0637(01)00035-8
De Monte, S., Cotté, C., d’Ovidio, F., Lévy, M., Le Corre, M., and Weimerskirch, H. (2012). Frigatebird behaviour at the ocean-atmosphere interface: integrating animal behaviour with multi-satellite data. J. R. Soc. Interface 9, 3351–3358. doi: 10.1098/rsif.2012.0509
De Robertis, A., Jaffe, J. S., and Ohman, M. D. (2000). Size-dependent visual predation risk and the timing of vertical migration in zooplankton. Limnol. Oceanogr. 45, 1838–1844. doi: 10.4319/lo.2000.45.8.1838
de Steur, L., Hansen, E., Gerdes, R., Karcher, M., Fahrbach, E., and Holfort, J. (2009). Freshwater fluxes in the East Greenland Current: a decade of observations. Geophys. Res. Lett. 36:L23611. doi: 10.1029/2009GL041278
Epstein, A. W., and Beardsley, R. C. (2001). Flow-induced aggregation of plankton at a front: a 2-D Eulerian model study. Deep-Sea Res. II 48, 395–418. doi: 10.1016/S0967-0645(00)00086-2
Folt, C. L., and Burns, C. W. (1999). Biological drivers of zooplankton patchiness. Trends Ecol. Evol. 14, 300–305. doi: 10.1016/S0169-5347(99)01616-X
Genin, A., Jaffe, J. S., Reef, R., Richter, C., and Franks, P. J. S. (2005). Swimming against the flow: a mechanism of zooplankton aggregation. Science 308, 860–862. doi: 10.1126/science.1107834
Greenacre, M., and Primicerio, R. (2013). Multivariate Analysis of Ecological Data. Bilboa: Fundación BBVA.
Guo, M., Xiu, P., Chai, F., and Xue, H. (2019). Mesoscale and submesoscale contributions to high sea surface chlorophyll in subtropical gyres. Geophys. Res. Lett. 46, 13217–13226. doi: 10.1029/2019GL085278
Hagen, W. (1999). Reproductive strategies and energetic adaptations of polar zooplankton. Invertebr. Repr. Dev. 36, 25–34. doi: 10.1080/07924259.1999.9652674
Hancke, L., Roberts, M. J., and Ternon, J. F. (2014). Surface drifter trajectories highlight flow pathways in the Mozambique Channel. Deep-Sea Res. II 100, 27–37. doi: 10.1016/j.dsr2.2013.10.014
Hattermann, T., Isachsen, P. E., von Appen, W. J., Albretsen, J., and Sundfjord, A. (2016). Eddy-driven recirculation of Atlantic Water in Fram Strait. Geophys. Res. Lett. 43, 3406–3414. doi: 10.1002/2016GL068323
Herman, R. L., and Dahms, H. U. (1992). Meiofauna communities along a depth transect off Halley Bay (Weddell Sea-Antarctica). Polar Biol. 12, 313–320. doi: 10.1007/978-3-642-77595-6_36
Hernández-Hernández, N., Arístegui, J., Montero, M. F., Velasco-Senovilla, E., Blatbar, F., and Marrero-Díaz, Á, et al. (2020). Drivers of plankton distribution across mesoscale eddies at submesoscale range. Front. Mar. Sci. 7:667. doi: 10.3389/fmars.2020.00667
Hirche, H. J. (1997). Life cycle of the copepod Calanus hyperboreus in the Greenland Sea. Mar. Biol. 128, 607–618. doi: 10.1007/s002270050127
Hirche, H. J., Barz, K., Ayon, P., and Schulz, J. (2014). High resolution vertical distribution of the copepod Calanus chilensis in relation to the shallow oxygen minimum zone off northern Peru using LOKI, a new plankton imaging system. Deep-Sea Res. I 88, 63–73. doi: 10.1016/j.dsr.2014.03.001
Hunt, G. L. Jr., and Harrison, N. M. (1990). Foraging habitat and prey taken by least auklets at King Island, Alaska. Mar. Ecol. Prog. Ser. 65, 141–150. doi: 10.3354/meps065141
Hyrenbach, K. D., Veit, R. R., Weimerskirch, H., and Hunt, G. L. Jr. (2006). Seabird associations with mesoscale eddies: the subtropical Indian Ocean. Mar. Ecol. Prog. Ser. 324, 271–279. doi: 10.3354/meps324271
Kaiser, P., Bode, M., Cornils, A., Hagen, W., Arbizu, P. M., Auel, H., et al. (2018). High-resolution community analysis of deep-sea copepods using MALDI-TOF protein fingerprinting. Deep-Sea Res. I 138, 122–130. doi: 10.1016/j.dsr.2018.06.005
Karnovsky, N., Harding, A., Walkusz, W., Kwaśniewski, S., Goszczko, I., Wiktor, J., et al. (2010). Foraging distributions of little auks Alle alle across the Greenland Sea: implications of present and future Arctic climate change. Mar. Ecol. Prog. Ser. 415, 283–293. doi: 10.3354/meps08749
Kawasaki, T., and Hasumi, H. (2016). The inflow of Atlantic water at the Fram Strait and its interannual variability. J. Geophys. Res. Oceans 121, 502–519. doi: 10.1002/2015JC011375
Klein, P., Hua, B. L., Lapeyre, G., Capet, X., Le Gentil, S., and Sasaki, H. (2008). Upper ocean turbulence from high-resolution 3D simulations. J. Phys. Oceanogr. 38, 1748–1763. doi: 10.1175/2007JPO3773.1
Klein, P., and Lapeyre, G. (2009). The oceanic vertical pump induced by mesoscale and submesoscale turbulence. Annu. Rev. Mar. Sci. 1, 351–375. doi: 10.1146/annurev.marine.010908.163704
Kosobokova, K. N., and Hirche, H. J. (2009). Biomass of zooplankton in the eastern Arctic Ocean – a base line study. Prog. Oceanogr. 82, 265–280. doi: 10.1016/j.pocean.2009.07.006
Kosobokova, K. N., Hopcroft, R. R., and Hirche, H. J. (2010). Patterns of zooplankton diversity through the depths of the Arctic’s central basin. Mar. Biodiv. 41, 29–50. doi: 10.1007/s12526-010-0057-9
Kraft, A., Bauerfeind, E., Nöting, E. A., and Bathmann, U. V. (2012). Size structure and life cycle patterns of dominant pelagic amphipods collected as swimmers in sediment traps in the eastern Fram Strait. J. Mar. Syst. 95, 1–15. doi: 10.1016/j.jmarsys.2011.12.006
Kwaśniewski, S., Gluchowska, M., Jakubas, D., Wojczulanis-Jakubas, K., Walkusz, W., Karnovsky, N., et al. (2010). The impact of different hydrographic conditions and zooplankton communities on provisioning little auks along the West coast of Spitsbergen. Prog. Oceanogr. 87, 72–82. doi: 10.1016/j.pocean.2010.06.004
Kwaśniewski, S., Hop, H., Falk-Petersen, S., and Pedersen, G. (2003). Distribution of Calanus species in Kongsfjorden, a glacial fjord in Svalbard. J. Plankton Res. 25, 1–20. doi: 10.1093/plankt/25.1.1
Laakmann, S., Kochzius, M., and Auel, H. (2009). Ecological niches of Arctic deep-sea copepods: Vertical partitioning, dietary preferences and different trophic levels minimize inter-specific competition. Deep-Sea Res. I 56, 741–756. doi: 10.1016/j.dsr.2008.12.017
Lee, M. M., and Williams, R. G. (2000). The role of eddies in the isopycnic transfer of nutrients and their impact on biological production. J. Mar. Res. 58, 895–917. doi: 10.1357/002224000763485746
Lévy, M., Franks, P. J. S., and Shafer Smith, K. (2018). The role of submesoscale currents in structuring marine ecosystems. Nat. Commun. 9:4758. doi: 10.1038/s41467-018-07059-3
Lévy, M., Klein, P., and Treguier, A. M. (2001). Impact of sub-mesoscale physics on production and subduction of phytoplankton in an oligotrophic regime. J. Mar. Res. 59, 535–565. doi: 10.1357/002224001762842181
Liu, X., and Levine, N. M. (2016). Enhancement of phytoplankton chlorophyll by submesoscale frontal dynamics in the North Pacific Subtropical Gyre. Geophys. Res. Lett. 43, 1651–1659. doi: 10.1002/2015GL066996
Mackas, D. L., and Galbraith, M. D. (2002). Zooplankton distribution and dynamics in a North Pacific eddy of coastal origin: I. Transport and loss of continental margin species. J. Oceanogr. 58, 725–738. doi: 10.1023/A:1022802625242
Mahadevan, A. (2016). The impact of submesoscale physics on primary productivity of plankton. Annu. Rev. Mar. Sci. 8, 17.1–17.24. doi: 10.1146/annurev-marine-010814-015912
Mahadevan, A., and Archer, D. (2000). Modeling the impact of fronts and mesoscale circulation on the nutrient supply and biogeochemistry of the upper ocean. J. Geophys. Res. 105, 1209–1225. doi: 10.1029/1999JC900216
Marsac, F., Barlow, R., Ternon, J. F., Ménard, F., and Roberts, M. (2014). Ecosystem functioning in the Mozambique channel: synthesis and future research. Deep-Sea Res. II 100, 212–220. doi: 10.1016/j.dsr2.2013.10.028
McGillicuddy, D. J. Jr. (2016). Mechanisms of physical-biological-biogeochemical interaction at the oceanic mesoscale. Annu. Rev. Mar. Sci. 8, 125–159. doi: 10.1146/annurev-marine-010814-015606
McGillicuddy, D. J. Jr., Anderson, L. A., Doney, S. C., and Maltrud, M. E. (2003). Eddy-driven sources and sinks of nutrients in the upper ocean: results from a 0.1° resolution model of the North Atlantic. Global Biogeochem. Cycles 17:1035. doi: 10.1029/2002GB001987
McWilliams, J. C. (1985). Submesoscale, coherent vortices in the ocean. Rev. Geophys. 23, 165–182. doi: 10.1029/RG023i002p00165
McWilliams, J. C. (2008). “The nature and consequences of oceanic eddies,” in Ocean Modeling in an Eddying Regime, Geophys. Monogr. Ser. Vol. 177, eds M. W. Hecht and H. Hasumi (Hoboken, NJ: Wiley) 5–15. doi: 10.1029/177gm03
McWilliams, J. C., Colas, F., and Molemaker, M. (2009). Cold filamentary intensification and oceanic surface convergence lines. Geophys. Res. Lett. 36:L18602. doi: 10.1029/2009GL039402
Melle, W., Runge, J., Head, E., Plourde, S., Castellani, C., Licandro, P., et al. (2014). The North Atlantic Ocean as habitat for Calanus finmarchicus: environmental factors and life history traits. Prog. Oceanogr. 129, 244–284. doi: 10.1016/j.pocean.2014.04.026
Mumm, N., Auel, H., Hanssen, H., Hagen, W., Richter, C., and Hirche, H. J. (1998). Breaking the ice: large-scale distribution of mesozooplankton after a decade of Arctic and transpolar cruises. Polar Biol. 20, 189–197. doi: 10.1007/s003000050295
Nielsen, T. G., Kjellerup, S., Smolina, I., Hoarau, G., and Lindeque, P. (2014). Live discrimination of Calanus glacialis and C. finmarchicus: can we trust phenological differences? Mar. Biol. 161, 1299–1306. doi: 10.1007/s00227-014-2419-5
Ohman, M. D., Powell, J. R., Picheral, M., and Jensen, D. W. (2012). Mesozooplankton and particulate matter response to a deep-water frontal system in the southern California Current System. J. Plankton Res. 34, 815–827. doi: 10.1093/plankt/fbs028
Oksanen, J., Guillaume Blanchet, F., Friendly, M., Kindt, R., Legendre, P., McGlinn, D., et al. (2019). vegan: Community Ecology Package. R package version 2.5-6. Avalaible online at: http://CRAN.R-project.org/package=vegan (accessed November 2, 2020).
Olson, D. B., Hitchcock, G. L., Mariano, A. J., Ashjian, C. J., Peng, G., Nero, R. W., et al. (1994). Life on the edge: marine life and fronts. Oceanography 7, 52–60. doi: 10.5670/oceanog.1994.03
Pinto-Coelho, R., Pinel-Alloul, B., Méthot, G., and Havens, K. E. (2005). Crustacean zooplankton in lakes and reservoirs of temperate and tropical regions: variation with trophic status. Can. J. Fish Aquat. Sci. 62, 348–361. doi: 10.1139/f04-178
Powell, J. R., and Ohman, M. D. (2015). Covariability of zooplankton gradients with glider-detected density fronts in the Southern California Current System. Deep-Sea Res. II 112, 79–90. doi: 10.1016/j.dsr2.2014.04.002
R Core Team (2019). R: A Language and Environment for Statistical Computing. Vienna: R Foundation for Statistical Computing.
Richerson, K., Watters, G. M., Santora, J. A., Schroeder, I. D., and Mangel, M. (2015). More than passive drifters: a stochastic dynamic model for the movement of Antarctic krill. Mar. Ecol. Prog. Ser. 529, 35–48. doi: 10.3354/meps11324
Richter, C. (1994). Regional and seasonal variability in the vertical distribution of mesozooplankton in the Greenland Sea. Rep. Polar Res. 154, 1–96.
Rivière, P., Jaud, T., Siegelman, L., Klein, P., Cotté, C., Le Sommer, J., et al. (2019). Sub-mesoscale fronts modify elephant seals foraging behavior. Limnol. Oceanogr. Lett. 4, 193–204. doi: 10.1002/lol2.10121
Schewe, I. (2018). The expedition PS107 of the research vessel POLARSTERN to the Fram Strait and the AWI-HAUSGARTEN in 2017. Rep. Polar Mar. Res. 717:120.
Scott, C. L., Kwaśniewski, S., Falk-Petersen, S., and Sargent, J. R. (2000). Lipids and life strategies of Calanus finmarchicus, Calanus glacialis and Calanus hyperboreus in late autumn, Kongsfjorden, Svalbard. Polar Biol. 23, 510–516. doi: 10.1007/s003000000114
Sell, A. F., and Kröncke, I. (2013). Correlations between benthic habitats and demersal fish assemblages – a case study on the Dogger Bank (North Sea). J. Sea Res. 80, 12–24. doi: 10.1016/j.seares.2013.01.007
Shulman, I., Penta, B., Richman, J., Jacobs, G., Anderson, S., and Sakalaukus, P. (2015). Impact of submesoscale processes on dynamics of phytoplankton filaments. J. Geophys. Res. Oceans 120, 2050–2062. doi: 10.1002/2014JC010326
Siegelman, L., O’Toole, M., Flexas, M., Rivière, P., and Klein, P. (2019). Submesoscale ocean fronts act as biological hotspots for southern elephant seal. Sci. Rep. 9:5588. doi: 10.1038/s41598-019-42117-w
Singh, S. P., Groeneveld, J. C., Hart-Davis, M. G., Backeberg, B. C., and Willows-Munro, S. (2018). Seascape genetics of the spiny lobster Panulirus homarus in the Western Indian Ocean: understanding how oceanographic features shape the genetic structure of species with high larval dispersal potential. Ecol. Evol. 8, 12221–12237. doi: 10.1002/ece3.4684
Snyder, S., Franks, P. J. S., Talley, L. D., Xu, Y., and Kohin, S. (2017). Crossing the line: Tunas actively exploit submesoscale fronts to enhance foraging success. Limnol. Oceanogr. Lett. 2, 187–194. doi: 10.1002/lol2.10049
Strass, V. H., Naveira Garabato, A. C., Pollard, R. T., Fischer, H. I., Hense, I., Allen, J. T., et al. (2002). Mesoscale frontal dynamics: shaping the environment of primary production in the Antarctic Circumpolar Current. Deep-Sea Res. II 49, 3735–3769. doi: 10.1016/S0967-0645(02)00109-1
Strong, C., and Rigor, I. G. (2013). Arctic marginal ice zone wider in summer and narrower in winter. Geophys. Res. Lett. 40, 4864–4868. doi: 10.1002/grl.50928
ter Braak, C. J. F., and Verdonschot, P. F. M. (1995). Canonical correspondence analysis and relative multivariate methods in aquatic ecology. Aquat. Sci. 57, 255–289. doi: 10.1007/BF00877430
Trudnowska, E., Gluchowska, M., Beszczynska-Möller, A., Blachowiak-Samolyk, K., and Kwaśniewski, S. (2016). Plankton patchiness in the Polar Front region of the West Spitsbergen shelf. Mar. Ecol. Prog. Ser. 560, 1–18. doi: 10.3354/meps11925
Unstad, K. H., and Tande, K. S. (1991). Depth distribution of Calanus finmarchicus and C. glacialis in relation to environment conditions in the Barents Sea. Polar Res. 10, 409–420. doi: 10.3402/polar.v10i2.6755
von Appen, W. J., Schauer, U., Hattermann, T., and Beszczynska-Möller, A. (2016). Seasonal cycle of mesoscale instability of the West Spitsbergen Current. J. Phys. Oceanogr. 46, 1231–1254. doi: 10.1175/JPO-D-15-0184.1
von Appen, W. J., Wekerle, C., Hehemann, L., Schourup-Kristensen, V., Konrad, C., and Iversen, M. H. (2018). Observations of a submesoscale cyclonic filament in the Marginal Ice Zone. Geophys. Res. Lett. 45, 6141–6149. doi: 10.1029/2018GL077897
Węsławski, J. M., Kwaśniewski, S., and Stempniewicz, L. (2009). Warming in the Arctic may result in the negative effects of increased biodiversity. Polarforsch. 78, 105–108.
Willis, K., Cottier, F., Kwaśniewski, S., Wold, A., and Falk-Petersen, S. (2006). The influence of advection on zooplankton community composition in an Arctic fjord (Kongsfjorden, Svalbard). J. Marine Syst. 61, 39–54. doi: 10.1016/j.jmarsys.2005.11.013
Keywords: Plankton patchiness, climate change, biodiversity, Calanus, convergence, biomass, accumulation, Atlantification
Citation: Kaiser P, Hagen W, von Appen W-J, Niehoff B, Hildebrandt N and Auel H (2021) Effects of a Submesoscale Oceanographic Filament on Zooplankton Dynamics in the Arctic Marginal Ice Zone. Front. Mar. Sci. 8:625395. doi: 10.3389/fmars.2021.625395
Received: 02 November 2020; Accepted: 11 June 2021;
Published: 01 July 2021.
Edited by:
Alberto Basset, University of Salento, ItalyReviewed by:
Jan Marcin Weslawski, Institute of Oceanology, Polish Academy of Sciences, PolandStefano Aliani, National Research Council (CNR), Italy
Copyright © 2021 Kaiser, Hagen, von Appen, Niehoff, Hildebrandt and Auel. This is an open-access article distributed under the terms of the Creative Commons Attribution License (CC BY). The use, distribution or reproduction in other forums is permitted, provided the original author(s) and the copyright owner(s) are credited and that the original publication in this journal is cited, in accordance with accepted academic practice. No use, distribution or reproduction is permitted which does not comply with these terms.
*Correspondence: Patricia Kaiser, patricia.kaiser@uni-bremen.de