Optical Properties and Photochemical Transformation of the Dissolved Organic Matter Released by Sargassum
 Leanne C. Powers1*
  Rossana Del Vecchio2
  Neil V. Blough3
  Natasha McDonald4,5
  Philippe Schmitt-Kopplin1,6,7
  Michael Gonsior1
- 1Chesapeake Biological Laboratory, University of Maryland Center for Environmental Science, Solomons, MD, United States
- 2Earth System Science Interdisciplinary Center, University of Maryland, College Park, MD, United States
- 3Department of Chemistry and Biochemistry, University of Maryland, College Park, MD, United States
- 4Bermuda Institute of Ocean Sciences, St. George’s, Bermuda
- 5GEOMAR Helmholtz Centre for Ocean Research, Kiel, Germany
- 6Helmholtz Zentrum München – German Research Center for Environmental Health, Research Unit Analytical BioGeoChemistry, Munich, Germany
- 7Chair of Analytical Food Chemistry, Technische Universität München, Munich, Germany
Chromophoric dissolved organic matter (CDOM) is the dominant absorber of ultraviolet radiation in the ocean, but its sources within the ocean, as well as its chemical composition, remain uncertain. One source of marine CDOM is Sargassum, an epipelagic marine macro brown alga common to the Gulf of Mexico, Caribbean, and Western North Atlantic. Furthermore, Sargassum contains phlorotannins, a class of polyphenols that may have similar optical properties to terrestrial polyphenols. Here, we analyze Sargassum CDOM optical properties, acquired from absorption and fluorescence spectra of filtered samples collected during Sargassum exudation experiments in seawater tanks. To further evaluate the structural basis of Sargassum CDOM optical properties, Sargassum CDOM was collected by solid phase extraction (SPE) and its chemical composition was tested by pH titration and sodium borohydride reduction. These chemical tests revealed that Sargassum CDOM absorption spectra respond similarly to pH titration and borohydride reduction when compared to terrestrially-derived materials, but Sargassum CDOM has unique absorbance peaks in difference spectra that have not been observed in terrestrially-derived CDOM. These absorbance features are consistent with the deprotonation of modified Sargassum phlorotannins, which are likely highly related phenolic acids and polyphenols. Sargassum CDOM was also more rapidly photodegraded when compared to terrestrial CDOM such as Suwannee River Natural Organic Matter. Similar to terrestrial DOM, ultrahigh resolution mass spectrometry revealed that sunlight decreases relative abundances of m/z ions and molecular formulas with an average O/C ratio of 0.6 and an average H/C ratio of 0.9, suggesting preferential photodegradation and/or phototransformation of hydrogen-deficient and oxygenated compounds, such as Sargassum phlorotannins. Assuming a large fraction of Sargassum CDOM is quickly mineralized to CO2 during its rapid photodegradation, Sargassum could play a major role in marine photochemical carbon mineralization during its annual growth cycle.
Introduction
Over the last thirty years, a multitude of studies have demonstrated that chromophoric dissolved organic matter (CDOM) plays numerous important roles within the aquatic environment (Blough and Zepp, 1995; Blough, 1997; Moran and Zepp, 1997; Blough and Del Vecchio, 2002; Mopper and Kieber, 2002, 2000; Nelson and Siegel, 2002, 2013; Del Castillo, 2005; Coble, 2007; Zepp et al., 2007; Sulzberger and Durisch-Kaiser, 2009). These include, but are not limited to, (1) substantially influencing the aquatic light field, (2) the photochemical production of reactive oxygen species (ROS) such as singlet oxygen (1O2), hydroxyl radical (⋅OH), superoxide (O2–) and hydrogen peroxide (H2O2) that can alter the speciation and biological availability of key trace metals, (3) the photo-oxidative degradation of dissolved organic matter (DOM) and photochemical loss of CDOM absorption (photobleaching), and (4) the photochemical production of trace gases such as CO2, CO, and COS. Because CDOM and its defining optical properties exist in all surface waters, chlorophyll estimates made from satellite ocean color measurements, and therefore estimates of marine primary production, can vary over 30% depending whether or not CDOM is included (Siegel et al., 2005). Over the last decade, algorithms that derive ultraviolet-visible (UV-Vis) CDOM absorption coefficients from remotely sensed ocean color data have improved (Swan et al., 2013; Cao and Miller, 2015) and allowed for examination of its distribution and dynamics over broad spatial and temporal scales. These estimates therefore provide information relevant to carbon cycling, the mixing of surface water masses and basin-scale biogeochemical processes (Mopper and Kieber, 2002; Nelson and Siegel, 2013).
Despite its importance, the sources and structural basis of the optical properties of CDOM within the oceans remain uncertain, particularly for the so-called and perhaps misleading “humic-like” components of fluorescent DOM (FDOM) that absorb in the ultraviolet (UV) and visible and fluoresce in the visible light spectrum (Andrew et al., 2013). The unusual optical properties of CDOM originating from terrestrial sources have been proposed to result from intramolecular electronic interactions between chromophores within CDOM (Del Vecchio and Blough, 2004; Boyle et al., 2009; Kujawinski et al., 2009; Sharpless et al., 2014). In particular, the electronic interaction model proposes that short-range, charge transfer (CT) interactions between electron-rich donors and electron-deficient acceptors, formed through partial oxidation of lignin or other polyphenolic precursors, can produce new, lower energy, optical CT transitions (Del Vecchio and Blough, 2004; Sharpless et al., 2014; McKay, 2020). These transitions can arise from short-range contacts between hydroxy/methoxy-aromatic electron donors and carbonyl-containing electron acceptors formed by partial oxidation, which can explain long-wavelength CDOM absorbance and fluorescence properties (Sharpless and Blough, 2014). For fresh waters, estuarine waters, and coastal waters that are strongly influenced by riverine input, it is generally accepted that CDOM originates primarily from the degradation products of lignin (Hernes, 2003; Stenson et al., 2003; Hernes et al., 2008; Boyle et al., 2009; Spencer et al., 2009, 2008; Stubbins et al., 2010) and tannins (Maie et al., 2008; Sleighter and Hatcher, 2008). However, it is far less certain what the sources and structures of CDOM and the humic-like components are in the open and deep ocean away from river-dominated margins.
The optical properties of waters from the central Equatorial Atlantic (Andrew et al., 2013) and North Pacific (Cartisano et al., 2018) exhibited similar characteristics to coastal and estuarine waters, arguing against a major in situ source of a humic-like component of CDOM in these regions. These results suggest that humic-like absorbance and fluorescence is a remnant of the terrestrial material, which has been diluted and potentially modified during transit to and within the oceans (Murphy et al., 2008; Andrew et al., 2013). However, previous work has also suggested that these humic-like components are produced within the oceans through microbial transformation of particulate (Nelson et al., 1998, 2007; Nelson and Siegel, 2013) or dissolved (Yamashita et al., 2007; Yamashita and Tanoue, 2008) marine source materials originating from phytoplankton. Another explanation might be that marine organisms release or transform DOM that create CDOM which appears highly similar to terrestrially-derived CDOM. For instance, while CRAM (carboxyl-rich alicyclic molecules) does not absorb and fluoresce, these compounds have been attributed to refractory components of marine DOM and recent evidence suggests that archaea and bacterioplankton readily produce CRAM (Bayer et al., 2019). CDOM generated in situ as a result of marine phytoplankton production would not be anticipated to exhibit the same optical properties as the terrestrial materials, because they are derived from very different source materials. However, one study provided evidence that picocyanobacteria-derived CDOM shows some similarities to the humic-like fluorescence of terrestrial origin (Zhao et al., 2017) and another recent study suggested that peroxidase-mediated dimerization of tyrosine could possibly generate humic-like CDOM (Paerl et al., 2020). Hence, defining and quantifying the sources of marine CDOM remains a challenge.
Some studies have focused on CDOM produced by macroalgae (Wada et al., 2007; Hulatt et al., 2009; Shank et al., 2010a; Perry et al., 2018), and in general brown algae (Phaeophyceae) release more CDOM than green or red algae (Hulatt et al., 2009). Sargassum natans and Sargassum fluitans (referred to as Sargassum hereafter) are two brown algae species that are particularly interesting because they are free-floating and typically live in the epipelagic zone of the Gulf of Mexico, Caribbean, Western Atlantic and Sargasso Sea. Sargassum can form extensive mats that are large enough to be observed by satellite (Gower and King, 2011; Wang and Hu, 2016) and satellite data has revealed an increasing trend in Sargassum over the last 20 years (Wang and Hu, 2016). Previous work has demonstrated that Sargassum can release significant quantities of CDOM to the oligotrophic ocean (Shank et al., 2010a; Perry et al., 2018), and possibly releasing twice as much CDOM as seagrass wracks (Perry et al., 2018). However, the molecular complexity of Sargassum DOM has only been recently investigated (Powers et al., 2019), and the structural basis of its optical properties has not been investigated in detail.
Brown algae also contain a class of polyphenols known as phlorotannins, which are unique in that they are formed exclusively by the polymerization of phloroglucinol (1,3,5-trihydroxybenze). These phlorotannins could have optical properties that are similar to those of terrestrial materials as they absorb light strongly in the UVB (280–320 nm) and UVA (320–400 nm) (Pavia et al., 1997). Following aging and partial oxidation, phlorotannins may increase their molecular weight (Arnold and Targett, 1998) and form electron accepting moieties such as aromatic ketone/aldehydes and quinones (Tuor et al., 1992; Pourcel et al., 2007; Li et al., 2008) that could also produce longer wavelength absorption and emission through CT interactions (Sharpless and Blough, 2014; McKay, 2020). CDOM released by Sargassum has been previously measured (Shank et al., 2010a) and varied significantly at 305 nm from 0.040 to 0.515 m–1 g–1 L h–1, but did increase under UV radiation versus in the dark. Therefore, the production and release of polyphenols from Sargassum could be a defense mechanism to provide protection from UV exposure (Pavia et al., 1997; Powers et al., 2019).
Because of the wide range of Sargassum CDOM release rates reported previously (Shank et al., 2010a; Perry et al., 2018), we monitored CDOM absorbance and fluorescence increases during exudation experiments of healthy and mid-senescent Sargassum natans under solar irradiation outdoors and under artificial (visible) irradiation in the laboratory. At the end of all incubation experiments, Sargassum DOM was concentrated and desalted by solid phase extraction (SPE) to better understand the contribution of Sargassum phlorotannins to the CDOM pool. In general, SPE-DOM optical properties are very similar to those prior to extraction, and reversed-phase SPE is especially good at recovering long wavelength absorbance and humic-like fluorescence (Röttgers and Koch, 2012; Andrew et al., 2016; Powers et al., 2020). Therefore, the same optical property analyses were repeated for Sargassum SPE-DOM and its chemical composition (e.g., carboxyl and phenolic content) was further tested by pH titrations and borohydride reduction, which selectively reduces carbonyl-containing compounds and hence interrupts CT interactions. To investigate the potential photochemical fate of this material in the environment, Sargassum DOM was irradiated in the laboratory using a custom-built flow-through irradiation system equipped with a solar simulating light source, temperature and pH control for both whole water and SPE-DOM samples, and analyzed using the same methods listed above. Select time points from the SPE-DOM irradiation experiment were diluted with methanol and analyzed using Fourier transform ion cyclotron resonance mass spectrometry (FT-ICR MS) to further understand the changes in Sargassum DOM molecular composition due to time-dependent photochemistry.
Materials and Methods
Sargassum Exudation Experiments
Sargassum was collected during two sampling events in July and in late September/early October 2016, described in a complimentary study (Powers et al., 2019) and discussed in detail in Supplementary Material. Briefly, Sargassum samples were collected in July 2016 aboard the R/V Hugh R. Sharp in the Sargasso Sea and were transported to the Chesapeake Biological Laboratory (CBL) for exudation experiments. These experiments are referred to as indoor exudation experiments and include both non-stress and mid-senescent experiments. Sargassum was also collected in early fall 2016 aboard the R/V Henry Stommel 9 km off the coast of Bermuda and was transferred to the Bermuda Institute of Ocean Sciences (BIOS) within 2 h of collection. To assess the impact of high energy UV (primarily UVB) light on DOM exudation, these Sargassum samples were either placed in tanks left uncovered and exposed to full sunlight or in tanks covered with Plexiglas (irradiation cut off at 345 nm and 65% UVA transmission). These experiments are referred to as outdoor exudation experiments and include non-stress with UV/no cover and non-stress no UV/Plexiglas cover experiments. It should be noted while the DOM analyzed during exudation experiments is referred to as “Sargassum DOM,” this material potentially includes exudates and transformation products from Sargassum-colonizing epiphytes and other microorganisms.
During all leaching experiments, ∼50 mL subsamples of tank water were 0.2 μm syringe-filtered (Whatman 25 mm GD/X syringe filters) into clean combusted (500°C) 40 mL amber glass vials at various discrete time points. Optical properties of samples were either analyzed immediately or stored at 4°C until analysis (within 1–10 days of collection). At the same time points, additional samples were analyzed for dissolved organic carbon (DOC) concentrations, which has been reported elsewhere (Powers et al., 2019). After 24–48 h of exudation, remaining tank water (1–6 L) housing Sargassum was filtered through pre-combusted Whatman 0.7 μm GF/F glass fiber filters and solid-phase extracted using an established procedure (Dittmar et al., 2008) using 5 g Agilent Bond Elut PPL cartridges, as described in detail previously (Powers et al., 2019). Although samples for SPE were filtered through 0.7 μm filters and samples for optical property analyses were filtered through 0.2 μm filters, combusting glass fiber filters at 500°C likely reduced the pore size of the “0.7 μm” filters so that the pore sizes of both filters are comparable (Nayar and Chou, 2003). The optical properties of Sargassum DOM recovered by solid-phase extraction (SPE-DOM) was also analyzed and used for additional chemical tests. Typically, 1 mL of methanolic extract was completely dried under a stream of N2 gas and re-dissolved in 50 mL of ultrapure Milli-Q water (Barnstead). These SPE-DOM samples were used for pH titrations, sodium borohydride (NaB4) reductions, and irradiation experiments, all described in detail below.
Optical Property Analysis
For all time points collected during exudation experiments, raw absorbance spectra [A(λ)] were collected in a 1 cm quartz fluorescence cuvette using a Horiba Aqualog at 3 nm intervals between 240 and 600 nm. For SPE-DOM samples used in pH titration and borohydride reduction experiments, A(λ) was collected in a 1 cm quartz fluorescence cuvette using a Shimadzu UV-Vis system at 1 nm intervals between 190 and 820 nm. For all A(λ) measurements regardless of instrument, ultrapure Milli-Q water served as the absorbance blank. A(λ) collected using the Shimadzu UV-Vis system was corrected for any offsets or instrument drift by subtracting all spectra by their absorbance at 720 nm. A(λ) collected using the Aqualog was not corrected, however no significant differences were observed between absorption spectra or spectral slopes for the same samples analyzed on both instruments. A(λ) were then converted Naperian absorption coefficient spectra [a(λ)] using the equation
where L (m) is the pathlength of the spectrophotometer cell (0.01 m). To determine CDOM release rates (Ra(λ)), all a(λ) were normalized to the “concentration” of Sargassum (g wet weight L–1) [anorm(λ)]. Ra(λ) was then calculated by a linear regression of anorm(λ) versus time (t) in h using the following equation
where anorm(λ)t and anorm(λ)0 are anorm(λ) values at time t and time 0, respectively. Pooled Ra(λ) were also determined by a linear regression of all exudation data of a particular type (no UV, with UV, mid-senescent) versus time. These pooled Ra(λ) were compared by analysis of covariance (ANCOVA). Spectral slope coefficients from 300 to 500 nm (S300–500, nm–1) were determined by fitting a(λ) spectra to the equation.
using a non-linear curve fitting routine in MATLAB 2015a. S300–500 values were compared between experimental conditions using one-way analysis of variance (ANOVA).
Spectra of excitation-emission matrix (EEM) fluorescence were acquired using a Horiba Aqualog. Emission (em) was recorded between 250 and 600 nm at fixed intervals (∼3.3 nm) for excitation (ex) wavelengths ranging from 240 to 550 nm at 3 intervals. Pure water served as the fluorescence blank and the resulting spectra were corrected for Raleigh scattering using methods described previously (Zepp et al., 2004) and inner filter effects using the Aqualog software. The water Raman peak was measured daily to account and correct for possible instrument shifts. The Raman peak area was also used to normalize EEM spectra so that fluorescence intensities reported here are expressed in Water Raman Units (RU). Fluorescence peak intensities were determined as in Timko et al. (2015) by finding the maxima within pre-defined peak boundaries for the conventional “humic-like” A peak (ex/em < 260/400–460 nm) and C peak (ex/em 320–360/420–460 nm) as well as the “protein-like” T peak (ex/em < 260/320–350 nm) (Coble, 1996), which are peaks that had high fluorescence intensities in many samples. To determine FDOM release rates (RF), fluorescence peak intensities (F) were again normalized by Sargassum biomass per liter (g wet weight L–1). RF was then determined as a linear regression of normalized F data versus time (h) using the equation below.
where Ft and F0 are the normalized fluorescence intensities at time t and time 0, respectively. Pooled RF values were determined in the same way as pooled Ra(λ) values and also compared by ANCOVA.
Differences between incubation conditions were also tested by calculating relative fluorescence apparent quantum yield [AQY, Φ(λ)] spectra (Heller et al., 1974; Green and Blough, 1994; Velapoldi and Tønnesen, 2004; Brouwer, 2011; Wünsch et al., 2016). To do this, fluorescence emission intensities [F(λ)] for each sample were integrated for every excitation wavelength [∫F(λ)] and divided by A(λ). These values were normalized to Φ(350), A(350) and ∫F(350) of quinine sulfate (QS) in 0.05 N H2SO4 using the following equation.
where Φ(350)QS = 0.51 ± 0.02 at λ = 350 nm (Velapoldi and Tønnesen, 2004; Brouwer, 2011).
Titrations and Reductions of Sargassum SPE-DOM
Titrations of Sargassum SPE-DOM samples were performed using an Orion 8220 BNWP microelectrode connected to an Orion 4 Star pH ISE meter. The electrode was calibrated daily using pH 1.68, 4.01, 7.00, 10.01, and 12.46 NBS buffers. SPE-DOM samples acidified to pH 2–3 using concentrated HCl (Sigma Aldrich puriss, p.a. 32%) were placed in a 1.0 cm quartz spectrophotometer cell. Samples were then titrated to pH 10–11 using μL additions of 0.1–1 N NaOH and at every pH change of ∼0.5 units, an absorbance spectrum was recorded using the Shimadzu UV-Vis system, as described above. Samples were also titrated from high pH (10–11) to pH 3 using μL additions of 0.1–1 N HCl or HClO4. All optical properties were corrected for dilution due to the additions of acid or base. Because these samples underwent no further treatment, they are referred to here as untreated SPE-DOM samples.
The effects of pH titration on both sodium borohydride (NaBH4) reduced samples and irradiated samples were tested. Additional SPE-DOM samples were adjusted to pH 10 and reacted under air for up to 48 h to determine if oxidation takes place. No changes in optical properties were observed, suggesting that our Sargassum SPE-DOM samples could not undergo further oxidation. Reduction of Sargassum SPE-DOM samples was performed using NaBH4 following methods and recommendations reported previously (Schendorf et al., 2016). Briefly, SPE-DOM samples were adjusted to pH 10–11 and were reduced using a 25 times mass excess (based on the DOC concentration of the SPE-DOM sample) aliquot of NaBH4. Samples were reacted under air in the dark for 24 h. After 24 h, the reduced samples were titrated and optical properties were measured as described above. These samples are referred to as reduced SPE-DOM samples hereafter. Some Sargassum SPE-DOM samples were irradiated until a 40–50% reduction in CDOM absorption spectra was observed between 300 and 400 nm (described in section “Irradiation Experiments” below). Irradiated samples underwent the same optical property analyses during titrations and are referred to as irradiated samples.
Irradiation Experiments
At the conclusion of our final outdoor exudation experiment (Supplementary Table S1), approximately 100 mL of the filtered Sargassum tank water was reserved in combusted amber glass vials and stored at 4°C, while the remainder of the sample was isolated via our SPE technique. Both the whole water sample as well as its corresponding SPE-DOM sample were then used in irradiation experiments. This exudation experiment was selected for photochemical experiments in order to minimize storage time of the filtered (whole) water sample between the end of the exudation experiment at BIOS and start of the irradiation experiment at CBL (sample stored approximately 1 week). The irradiation system used in this study has been described in detail elsewhere (Timko et al., 2015). Briefly, a sample was continuously pumped at ∼1 mL/min from a 10 mL round bottom flask to a custom-built spiral SCHOTT Borofloat spiral flow cell (Hellma Analytics) that was situated beneath an Oriel Sol2A Class ABA solar simulator (Newport Corporation, Irvine, CA). This flow cell allows 70–85% transmission between 300 and 350 nm and 85% transmission at wavelengths > 350 nm and has a 2 mm wide by 1 mm deep flow path. The 1 mm pathlength ensured that samples were optically thin during irradiation even at relatively high CDOM values (Timko et al., 2015). The broadband UVA photon dose for this system was determined using nitrite actinometry, which has a response bandwidth of 330–380 nm (Jankowski et al., 1999, 2000). Based on modeled solar irradiance from 330 to 380 nm from the System for Transfer of Atmospheric Radiation model (Ruggaber et al., 1994) calculated just below the sea surface (Fichot and Miller, 2010) and ignoring mixing of the water column, a 24 h irradiation in this system is equivalent to 1.1 days of integrated exposure at 30°N in mid-July where 1 day is ∼14 h.
From the spiral flow cell under the solar simulator, the sample was then pumped to a 10 × 4 mm spectrophotometer flow cell housed in the Horiba Aqualog spectrofluorometer and then returned to the round bottom flask to mix and prevent oxygen loss during irradiation. The flask was also temperature controlled to 25°C with a recirculating water bath. EEM and absorption spectra were simultaneously recorded in the 10 × 4 mm flow cell using the Horiba Aqualog every 20 min for up to 48 h of irradiation time. The pH of the solution was monitored in the round bottom flask with a Thermo Orion 8220BNWP microelectrode calibrated with pH 4.0 and 10 NBS buffers and adjusted to pH 8. Ideally, seawater pH is calibrated with Tris buffers at seawater ionic strength (Marion et al., 2011), but the goal here was to maintain the sample at a pH value of approximately 8 for the entire irradiation experiment. Thus, a J-Kem Infinity II reaction controller coupled to a dual syringe pump delivered μL additions of 0.1 M HCl or 0.1 M NaOH as needed to maintain a stable pH during the irradiation experiment.
Absorbance loss at every wavelength over time was approximated using a first-order decay equation for the first 20 h of irradiation, or until ∼50% visible absorbance loss (Del Vecchio and Blough, 2002).
At and A0 are absorbance at a given time and that at time zero, respectively; ka is the first-order decay constant (h–1) and t is time in hours. Fluorescence loss at every ex/em pair was modeled using a double exponential equation, describing fluorescence decay by two pools, F1 and F2, so that F1 + F2 ≈ 1 (Del Vecchio and Blough, 2002).
Ft and F0 are fluorescence at a given time and that at time zero, respectively, and k1 and k2 are the decay constants (h–1) of F1 and F2, respectively. All decay fits were made using a non-linear curve fitting routine in MATLAB 2015a.
Ultrahigh Resolution Mass Spectrometry
We used ultrahigh resolution mass spectrometry to characterize the changes in the molecular composition of Sargassum SPE-DOM during the irradiation experiment using a Bruker Solarix 12 Tesla Fourier transform (FT) ion cyclotron resonance (ICR) mass spectrometer located at the Helmholtz Zentrum, Munich, Germany. Because the pH electrode was found to contaminate the sample over time for mass spectrometry, no pH control was used in this experiment. Additionally, the sample volume was doubled to minimize volume changes when subsampling at time points of 2, 4, 6, 22, and 46 h. The absorbed photon dose was also decreased due to the larger volume, so that the 46 h time point was equivalent to the ∼20 h exposure in the previous irradiation experiments discussed above. At each time point, 0.2 mL was sampled from the reactor and was added to 0.8 mL of methanol to ensure ionization. Ionization was achieved using negative ion mode electrospray ionization (ESI) with an electrospray voltage of–3.6 kV. Samples were infused at a flow rate of 120 μL h–1, and 500 transient spectra were averaged. The resolution (> 500,000 at m/z 400) and the mass error (<0.2 ppm) were sufficiently precise to compute exact molecular formulas based on the following atomic numbers: 12C1–8, 1H1–8, 16O0–30, 14N0–3 and 32S0–2, and 79Br0–3, as well as the 13C and 81Br isotopologs (Koch et al., 2007; Herzsprung et al., 2014), although only formula assignments containing carbon, hydrogen, and oxygen (CHO) are discussed here. CHO formulas are described here because they were most abundant using negative ESI mode in the Sargassum SPE-DOM analyzed previously (Powers et al., 2019) and would likely include the majority of phlorotannins and polyphenols. A more detailed characterization of Sargassum DOM, including assignments with heteroatoms and bromine, can be found elsewhere (Powers et al., 2019).
Van Krevelen or elemental diagrams were used to visualize the chemical space of FT-ICR MS data by plotting assigned molecular formulas according to their hydrogen to carbon (H/C) and oxygen to carbon (O/C) ratios (van Krevelen, 1950). A number of parameters were calculated to gain information based on assigned molecular formulas. For instance, double bond equivalents (DBE), or the number of unsaturations plus rings in a molecule, were determined for assigned molecular formulas according to the equation below (Koch and Dittmar, 2006).
Where Nx is the number of atoms of element x and Vx is the valence of element x. An additional parameter, the modified aromaticity index (AImod), was used as an indicator of aromatic structures in DOM when AImod is greater than 0.5, according to the following equation (Koch and Dittmar, 2006, 2016):
For compounds containing only carbon, hydrogen, and oxygen (CHO), the average carbon oxidation state (COS) was approximated by
where a formula with a COS less than or equal to 0 is reduced and that greater than 0 is oxidized (Kroll et al., 2011). To compare samples between time points and remove biases between samples toward individual m/z ions, all intensities for m/z ions in a sample were normalized to the summed intensity of the sample. These normalized intensities were then compared for all assigned molecular formulas between time points and used to calculate intensity-weighted (wt) average parameters for the parameters discussed above (Eqs 8–10). Average molecular characteristics (described below) were within one standard deviation between time points, so normalized intensities were instead compared for formulas that had either relatively increasing intensities or relatively decreasing intensities between time points.
Results and Discussion
Changes in Absorbance Properties During Exudation Experiments
Over the course of controlled exudation experiments, CDOM absorption spectra [a(λ)] increased continually in tanks containing Sargassum (Figure 1, Supplementary Table S1, and Supplementary Figure S1). The pooled CDOM release rate (Ra) for mid-senescent samples was significantly higher at all wavelengths than both controlled experiments with and without full solar exposure (Figure 1A and Supplementary Table S1). Under non-stress conditions, Ra values in the UV region were similar between indoor and outdoor experiments, but CDOM release rates in the visible region were higher in tanks exposed to sunlight (Figures 1B,C). For instance, Ra(305) = 0.047 ± 0.004 m–1 L mg–1 indoors and Ra(305) = 0.063 ± 0.005 m–1 L mg–1 outdoors (ANCOVA p-value = 0.17, Supplementary Table S1). On the other hand, Ra(412) = 0.008 ± 0.001 m–1 L g–1 h–1 in tanks without UV exposure and Ra(412) = 0.012 ± 0.001 m–1 L g–1 h–1 in tanks exposed to natural sunlight (ANCOVA p-value = 0.011, Supplementary Table S1).
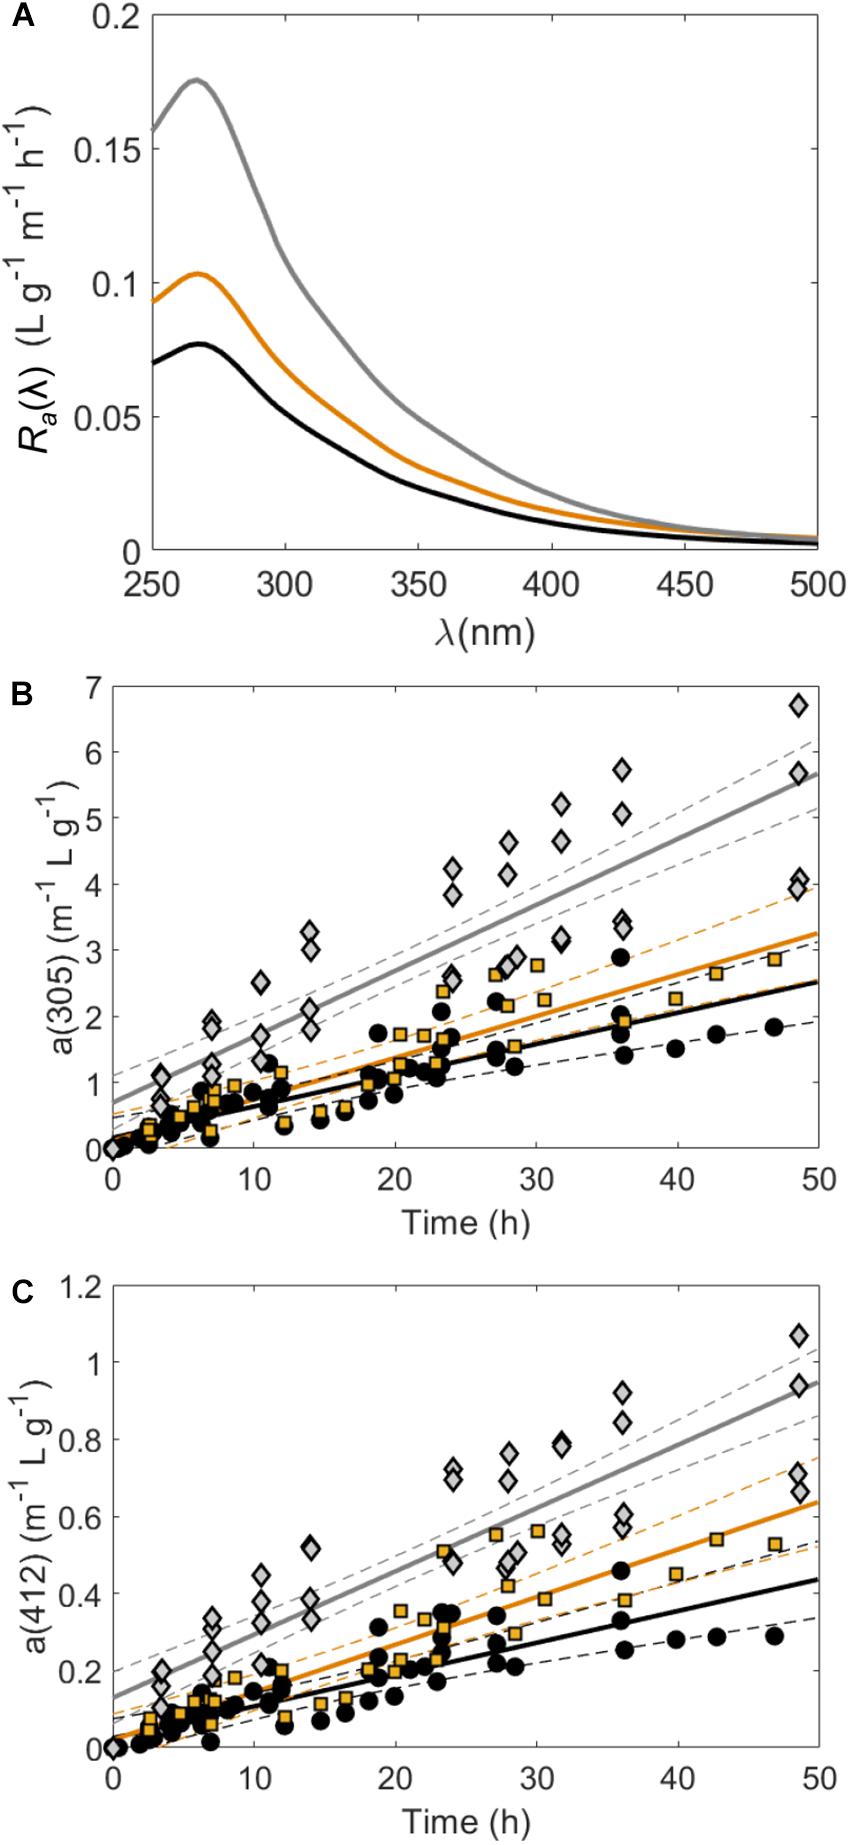
Figure 1. (A) Pooled CDOM absorption coefficient release rates [Ra(λ), anorm(λ) h–1, Eq. 2] for incubation experiments at each wavelength where the black line corresponds to samples under LED lights or sunlight with a Plexiglas cover (no UV exposure), the orange line corresponds to samples under natural sunlight (with UV exposure) and the gray line corresponds to samples that had no UV exposure but were in mid-senescent conditions. (B,C) show CDOM absorption coefficients normalized to Sargassum mass in wet weight (g) per liter [anorm(λ), m–1 g–1 L)] at 305 and 412 nm, respectively, in tanks housing Sargassum over time. Pooled linear regressions (solid lines) with 95% confidence intervals (dashed lines) are shown to highlight the determination of Ra values shown in (A). In (B,C) black circles were under LED lights or sunlight with a Plexiglas cover (no UV exposure), orange squares were under natural sunlight (with UV exposure) and gray diamonds were in mid-senescent conditions.
Largely, these results indicate that CDOM release is higher during senescent conditions than at earlier life stages, and is likely more important than light conditions. Mid-senescent Sargassum also released significantly more CDOM than all other treatments in a previous study (Shank et al., 2010a). Similarly, detrital seagrass (Thalassia testudinum) released significantly more CDOM than living seagrass in a previous study (Stabenau et al., 2004). This result may be explained by cell wall degradation and increased permeability during senescence and the concomitant loss of cellular material (Myklestad, 2005). However, some light exposure may be important in CDOM release from Sargassum because a previous study that monitored CDOM release from Sargassum over an 11 day dark mesocosm experiment determined an Ra(412) of only 0.001 m–1 L g–1 h–1 (Perry et al., 2018), well below the Ra(412) of 0.008–0.012 m–1 L g–1 h–1 measured in our visible light and sunlight exposed tanks.
Despite the differences Ra(λ) between experiments, a(λ) spectral shape was similar for all leaching conditions (Supplementary Figure S1). Notably, CDOM released by Sargassum exhibited a peak maximum in a(λ) between 265 and 270 nm (Figure 2A). Likewise, CDOM released from several brown algae species including Fucus sp., Laminaria digitata, Chorda filum, and Ascophyllum nodosum, also exhibited similar absorbance peaks in the 265–285 nm range, which the authors attributed to phenolic species (Hulatt et al., 2009). While this feature has also been previously associated with protein-like absorbance primarily due to the amino acids tyrosine (a phenol) and tryptophan (Noble and Bailey, 2009; Porterfield and Zlotnick, 2010), one studied confirmed that bromophenols released by the brown algae Eisenia bicyclis and Ecklonia kurome corresponded to absorbing material with maxima from 265 to 270 nm (Shibata et al., 2006). However, attributing this peak to phenolic species and phlorotannins is somewhat speculative without further tests. Therefore, to better understand the contribution of phenolic species to Sargassum a(λ) spectra, optical changes during pH titration of Sargassum SPE-DOM were also determined (see section “pH Dependence of Solid-Phase Extracted (SPE)-DOM Optical Properties”).
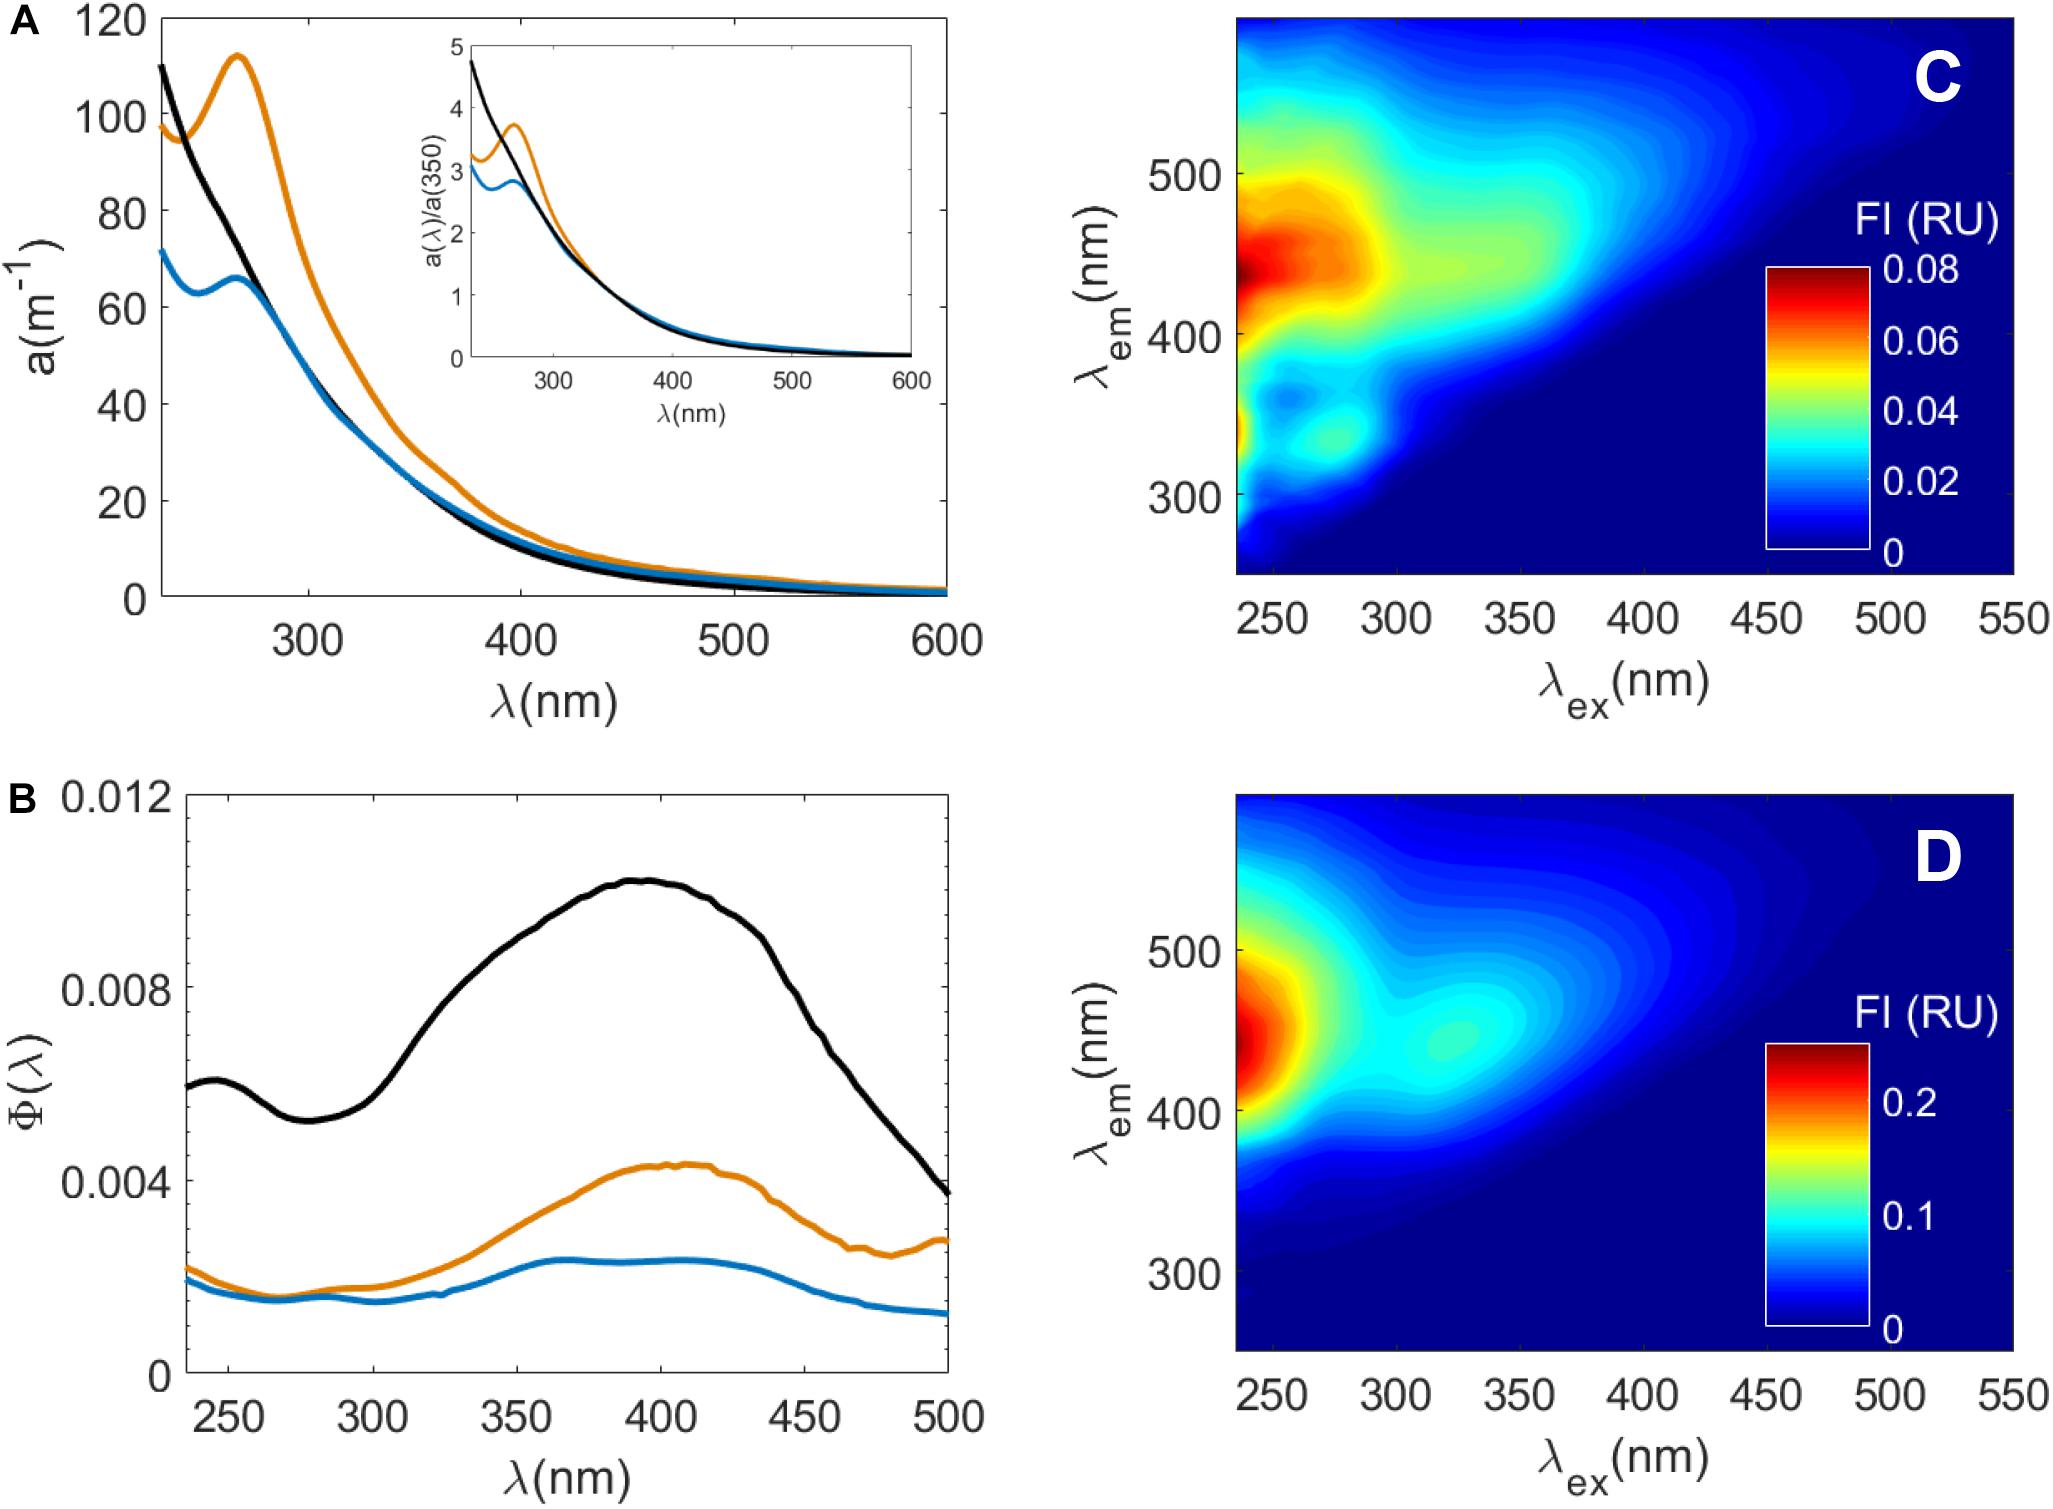
Figure 2. Optical properties of samples used in photochemical irradiation experiments at pH 8: Suwannee River Natural Organic Matter (SRNOM), Sargassum DOM in filtered seawater, and Sargassum SPE-DOM in ultrapure water. (A) a(λ) spectra of SRNOM (black line), Sargassum DOM in seawater (orange line), and Sargassum SPE-DOM in ultrapure water (blue line). The inset in (A) are the same a(λ) spectra normalized to a(λ) at 350 nm [a(λ)/a(350)] to highlight the differences in spectral shape between these samples. (B) Fluorescence apparent quantum yield spectra Φ(λ) of Sargassum DOM, Sargassum SPE-DOM and SRNOM where same colors in (A) apply. Excitation-emission matrix spectra of Sargassum SPE-DOM in ultrapure water (C) and SRNOM (D). Note the difference in scale between the two EEM spectra.
Average S300–500 values of Sargassum DOM fell in a somewhat narrow range from 0.013 to 0.017 nm–1 (Supplementary Table S1). These S300–500 values were in line with the S290–500 values of 0.012–0.015 nm–1 found for Sargassum CDOM (Shank et al., 2010a) and the S270–400 values of 0.011–0.014 nm–1 found for CDOM released from the brown alga Ecklonia cava (Wada et al., 2007). However, S300–500 was significantly lower in sunlight exposed tanks (0.014 ± 0.001 nm–1) compared to those without UV exposure (0.016 ± 0.001 nm–1), which reflects the larger increases in CDOM absorption spectra in the visible region for sunlight exposed tanks (Figure 1C). Given this result, UV exposure appears to be important in increasing long-wavelength absorbance in Sargassum CDOM. Because solar exposure typically increases CDOM spectral slope (Helms et al., 2008; Sharpless and Blough, 2014), one might expect higher S300–500 values and lower rates of CDOM release in the visible in sunlight-exposed tanks compared to non-UV tanks. However, these results suggest that the possible fast aging and oxidation of freshly produced Sargassum CDOM may increase long-wavelength absorbance into the visible region of the spectrum for samples that were exposed to full solar radiation.
Changes in Fluorescence During Exudation Experiments
While conventional “humic-like” fluorescence peaks A and C have been associated with terrestrial materials (Coble, 1996), Sargassum released FDOM with intense A and C peaks under all experimental conditions (Figure 2, Supplementary Figure S3, and Supplementary Table S2). Similar FDOM EEM spectra were observed from Sargassum leaching experiments in a previous work (Shank et al., 2010a). RF for these humic-like peaks was about two times higher for Sargassum under mid-senescent conditions than for non-stress conditions (Supplementary Table S2) although increases in FDOM intensities for all experiments were more variable than increases in a(λ). Thus, when Sargassum was healthy, RF for peak A and C were not significantly different between tanks with and without UV exposure (Supplementary Figure S2 and Supplementary Table S2). RF for peak T was variable and there were no clear trends between different experimental conditions (Supplementary Table S2). FDOM from the brown alga Ecklonia cava had a large range in C peak intensity at different times of year, and a very high T peak in June (Wada et al., 2007), indicating that the quality of FDOM released from brown algae depends on several factors including potential modifications due to microbial processing (Rochelle-Newall and Fisher, 2002).
Fluorescence apparent quantum yield spectra [Φ(λ)] overlapped (± 1 SD) for all conditions (Supplementary Figure S3) and average maximum apparent quantum yield [Φ(λex–max)] values ranged from ∼0.002 to 0.004 and λex–max values varied between ∼370 and 410 nm (Supplementary Table S2). For experiments using healthy Sargassum, Φ(λ) also appeared to decrease over time. Because FDOM release rates were variable, perhaps these decreases reflect decreasing rates of FDOM release over time, compared to the more linear rates of CDOM release (Supplementary Tables S1, S2). However, there were some notable differences in Φ(λ) values for different experimental conditions. For indoor tanks, there appeared to be a shift in Φ(λ) shape over time to lower λex–max and lower Φ(λex–max), from Φ(380) = 0.0039 for samples collected before 18 h to Φ(372) = 0.0034 for samples collected after 18 h (Supplementary Table S2). For outdoor tanks, λex–max did not change (λex–max = 387) but Φ(387) decreased from 0.0035 for samples collected before 18 h to 0.0023 for samples collected after 18 h (Supplementary Table S2). While Φ(λ) reported for riverine and marine waters are typically higher than the Sargassum Φ(λ) found in this study (Green and Blough, 1994; Wünsch et al., 2016), Sargassum Φ(λ) show some similarities to fluorescence Φ(λ) determined for terrestrial standard reference materials from the International Humic Substances Society (IHSS) (Ma et al., 2010; McKay et al., 2016; Wünsch et al., 2016; Schendorf et al., 2019). For instance, humic acids have similar Φ(400) values of ∼0.003 but λex–max is typically at longer wavelengths between 440 and 460 nm (Ma et al., 2010; Schendorf et al., 2019), well above the λex–max values for Sargassum DOM. On the other hand, Suwannee River Fulvic Acid (SRFA) had similar λex–max values of ∼380–390 nm, but greater Φ(λex–max) values of ∼0.0085–0.015 (Ma et al., 2010; McKay et al., 2016; Wünsch et al., 2016; Schendorf et al., 2019).
Because Sargassum exudates are in seawater and IHSS materials are isolated from soils, peat and water, exudates and reference materials may not be directly comparable. Therefore, as an additional test, we compared Sargassum exudate and SPE-DOM optical properties to those of Suwannee River Natural Organic Matter (SRNOM, IHSS) at pH 8 (Figure 2). In general, Sargassum SPE-DOM had higher mass normalized absorbance values and lower spectral slope values than samples before SPE at pH 8 (Supplementary Table S3), suggesting that our SPE technique preferentially retained long-wavelength absorbing material relative to bulk DOM, which was expected. Similar reversed-phase SPE methods have also observed preferential recovery of long-wavelength absorbance and fluorescence (Green and Blough, 1994; Röttgers and Koch, 2012; Andrew et al., 2016; Powers et al., 2020). This Sargassum SPE-DOM sample had similar absorbance values to those of SRNOM (Figure 2A), however, SRNOM had much larger fluorescence intensities compared to Sargassum SPE-DOM (Figures 2C,D). Thus SRNOM Φ(λ) was well above those for Sargassum DOM, averaging 0.011 ± 0.008 at a somewhat higher λex–max of 396 nm (Figure 2B). Despite the differences in Sargassum Φ(λ) versus those for terrestrial materials (McKay et al., 2016; Wünsch et al., 2016; Schendorf et al., 2019), Sargassum appears to produce FDOM with similar Φ(λ) to terrestrial humic acids but with λex–max for Φ(λ) similar to SRFA and SRNOM. Thus, for the oligotrophic waters of the Gulf of Mexico and the Sargasso Sea, Sargassum mats could be an important seasonal in situ source of “humic-like” FDOM, with the caveats of its relatively fast photochemical transformation (see section “Photodegradation of Sargassum DOM Optical Properties” below).
pH Dependence of Solid-Phase Extracted (SPE)-DOM Optical Properties
Because of the wide range of pKa values for carboxyl and phenolic groups in complex mixtures such as aquatic DOM, empirical rules or models have been used to estimate the concentrations of carboxyl and phenolic groups using pH titrations of DOM (Ritchie and Perdue, 2003). For instance, it is often assumed that all carboxyl groups are titrated to a pH of 7 or 8, and half of the phenolic groups are titrated between pH 8 and 10 (Ritchie and Perdue, 2003; Dryer et al., 2008; Janot et al., 2010). With these assumptions in mind, we selected a variety of sample types from our exudation experiments to test the pH dependence of Sargassum SPE-DOM and to further understand the involvement of these functional groups in Sargassum a(λ) (Figures 3A–F and Supplementary Table S3). For untreated Sargassum SPE-DOM, absorption spectra increased with increasing pH, with the largest increases in the visible region between pH 3 and 10 (Supplementary Table S3 and Figures 3A,D), which corresponded to decreases in S300–500 values averaging −11 ± 3%. Consistent with previous work, terrestrial reference materials also exhibited a higher a(λ) pH dependence for longer wavelengths in the visible region than for UV wavelengths (Schendorf et al., 2019). As noted previously, these changes are suspected to be due to the deprotonation of chromophores, enhancement of CT interactions, and possibly conformational changes in the DOM pool (Dryer et al., 2008). In order to obtain more detailed information, mass-normalized difference absorbance spectra were also calculated using the following equation (Dryer et al., 2008; Schendorf et al., 2019)
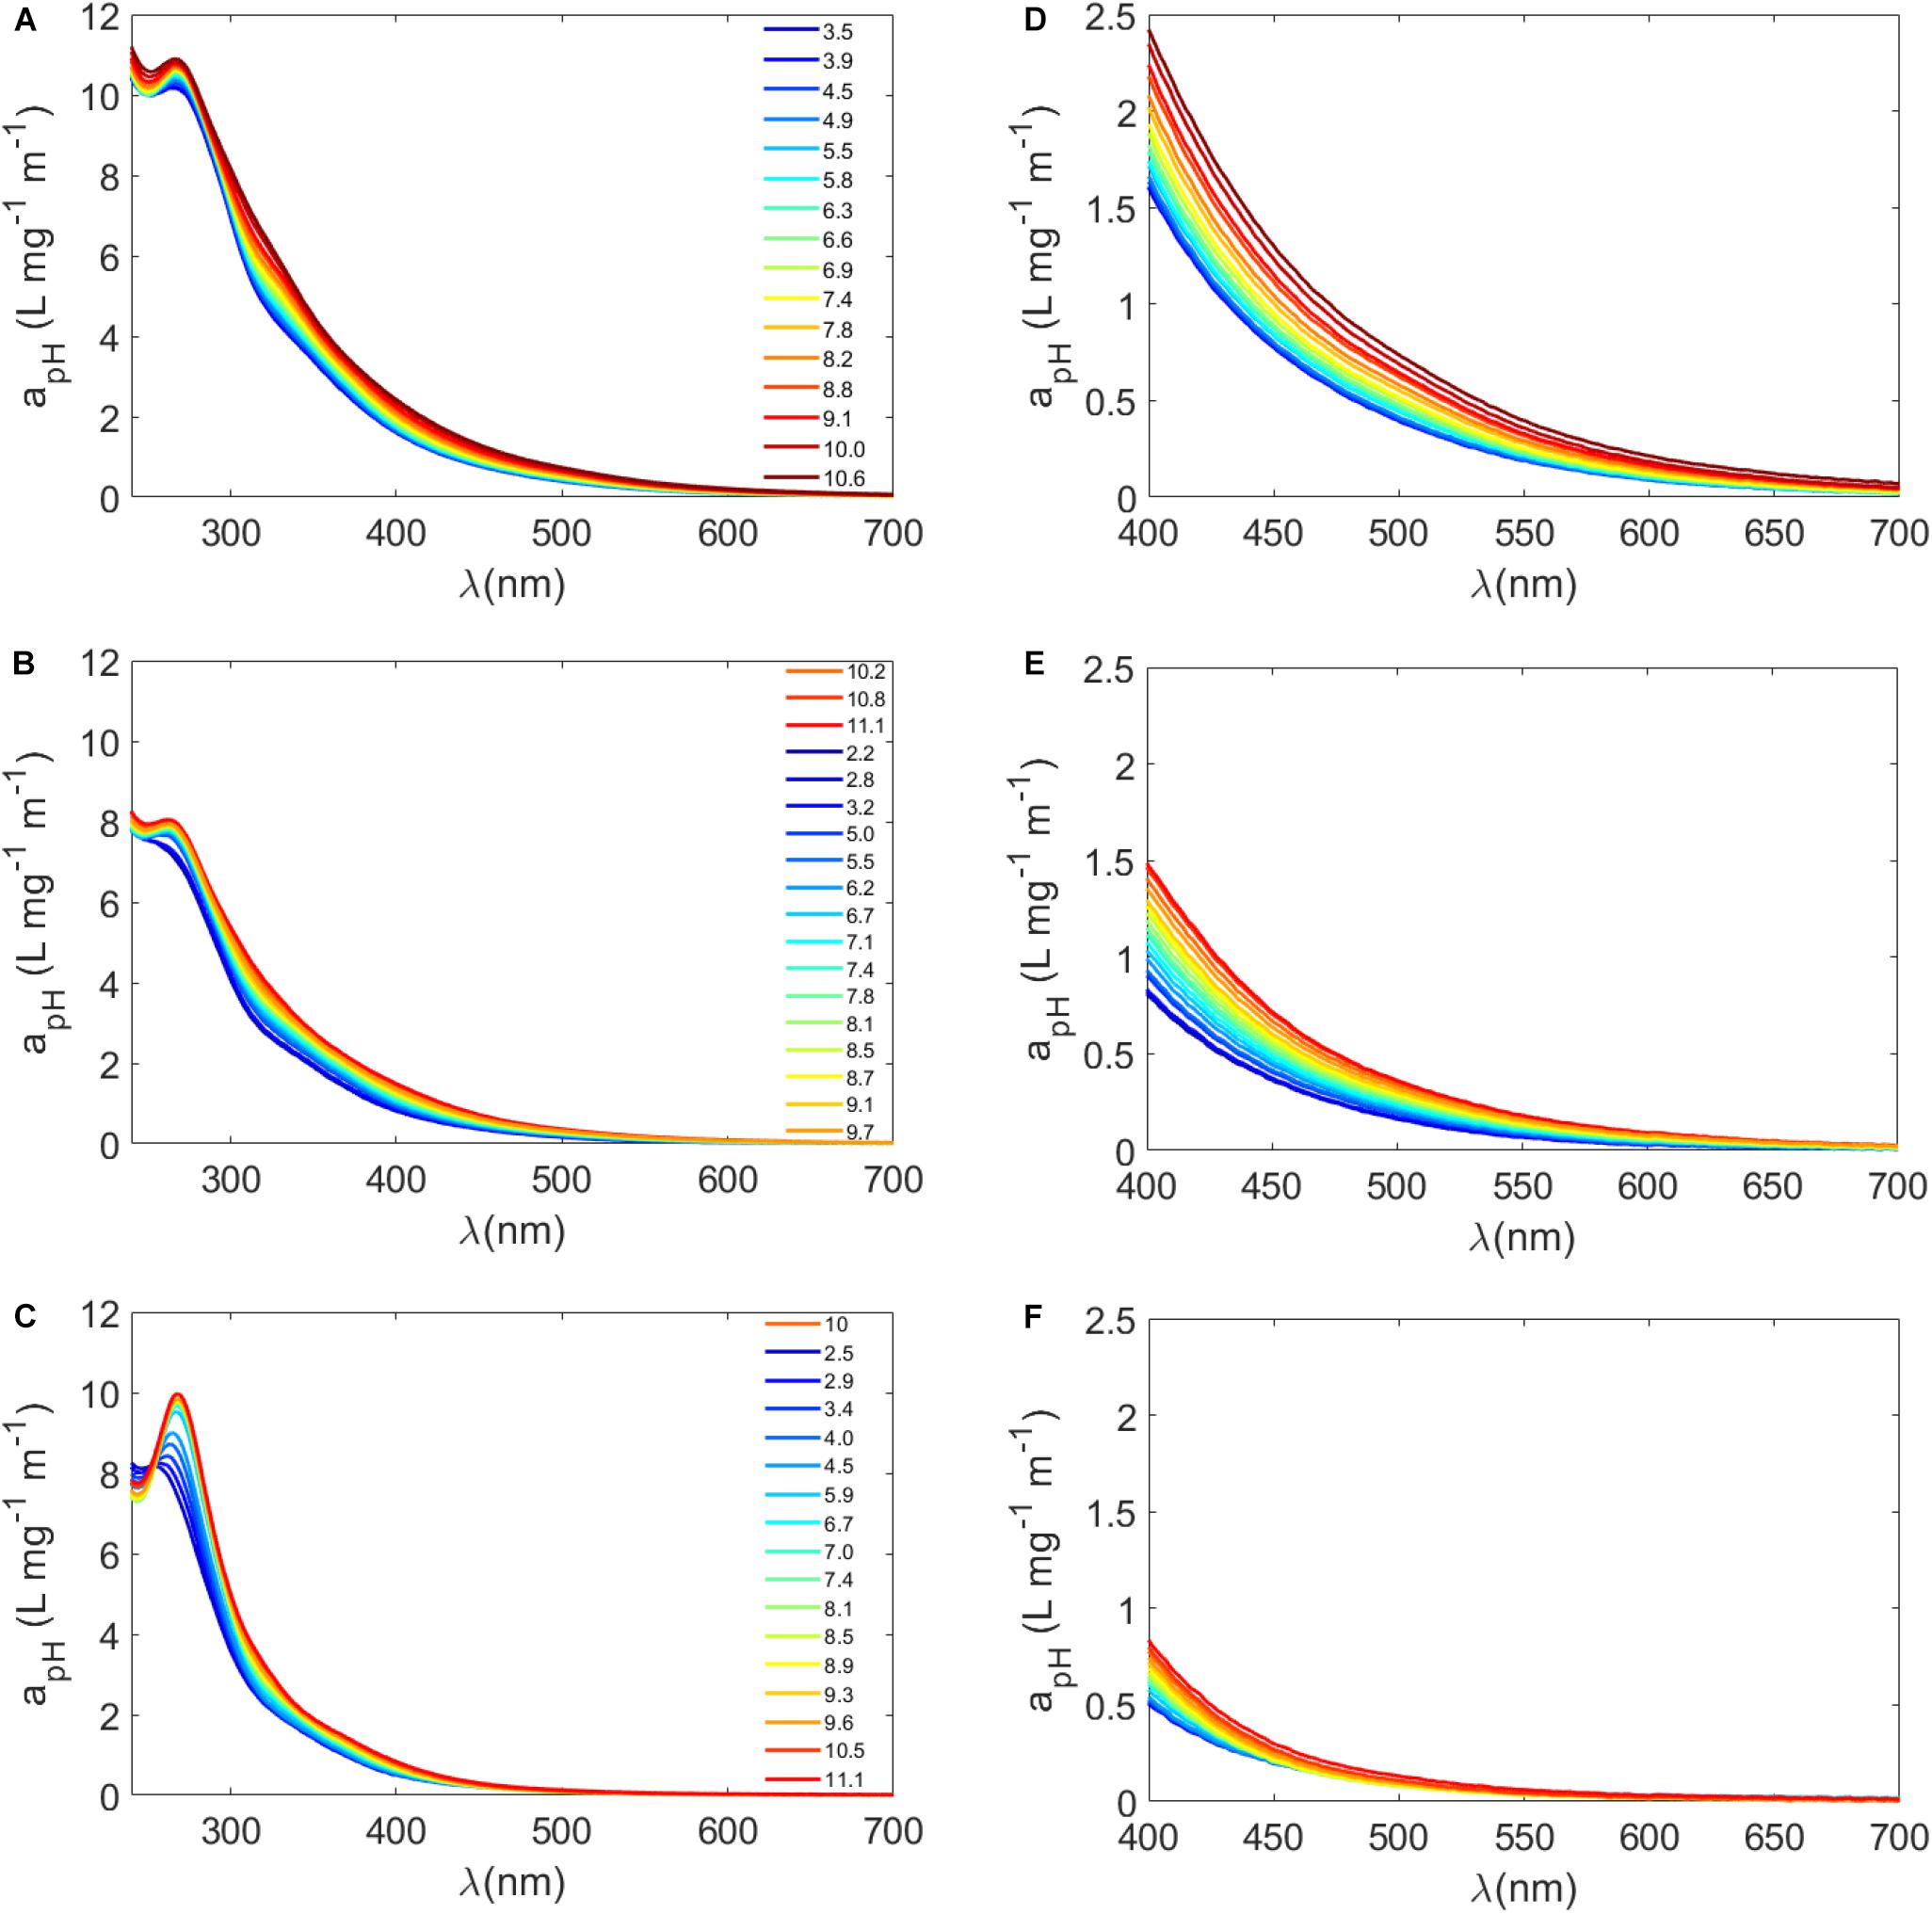
Figure 3. (A–C) Mass-normalized absorption spectra (apH = a(λ)/DOC, L mg–1 m–1) plotted from 240 to 700 nm for a Sargassum SPE-DOM sample that underwent various treatments followed by pH titration: (A) no treatment (“untreated”), (B) photodegraded (“irradiated”), and (C) reduced with NaBH4 (“reduced”). Colors from blue to red represent different pH values from low pH (blue) to high pH (red), with select pH values listed from ∼3 to 11. (D–F) the same mass normalized apH(λ) spectra plotted in the visible from 400 to 700 nm where (D) is untreated, (E) is irradiated, and (F) is reduced.
where a(λ)pHx and a(λ)pHref are a(λ) values at pH x and a reference pH, respectively (Figures 4A–C). For example, Δa(λ) were calculated relative to pH 3 for carboxyl groups (Figures 4A–C) and relative to pH 7 for phenolic groups (Figures 4D–F). It was therefore assumed that changes in Δa(λ) over these respective pH ranges (i.e., pH 3 to 7 for carboxyl groups and pH 8 and above for phenolic groups) were due to these respective functional groups (Dryer et al., 2008; Janot et al., 2010; Schendorf et al., 2019). Two distinct peaks were observed in Δa(λ) plots relative to pH 3 of untreated samples around 270 nm and 325 nm (Figure 4A). Peaks in the carboxylic range have been observed previously in the low UV (<280 nm) range (Dryer et al., 2008; Janot et al., 2010; Schendorf et al., 2019), but the peak at 325 nm appears to be unique to Sargassum. Above 350 nm, there were two broad bands to in untreated Δa(λ) plots relative to pH 3 (Figure 4A). Broad peaks have also been observed for IHSS reference humic and fulvic acids over the carboxylic acid pH range (Dryer et al., 2008; Schendorf et al., 2019). Δa(λ) plots relative to pH 7 revealed distinct peaks at ∼250 nm and at ∼315 nm and a broad band > 400 nm (Figure 4D). On the other hand, terrestrial reference materials generally have one broad band that extends from the UV into the visible region in the phenolic range (Schendorf et al., 2019). While peaks < 250 nm have been observed in the phenolic range previously (Dryer et al., 2008), it is likely that the enhancement in Δa(λ) plots ∼315 nm is due to the deprotonation of phenols that are unique to Sargassum or more generally, unique to DOM from brown algae. Unfortunately, the pH dependence of a(λ) spectra and difference absorbance spectra have only rarely been tested (Dryer et al., 2008; Janot et al., 2010; Schendorf et al., 2019), so comparisons to other algal sources cannot be made at this time.
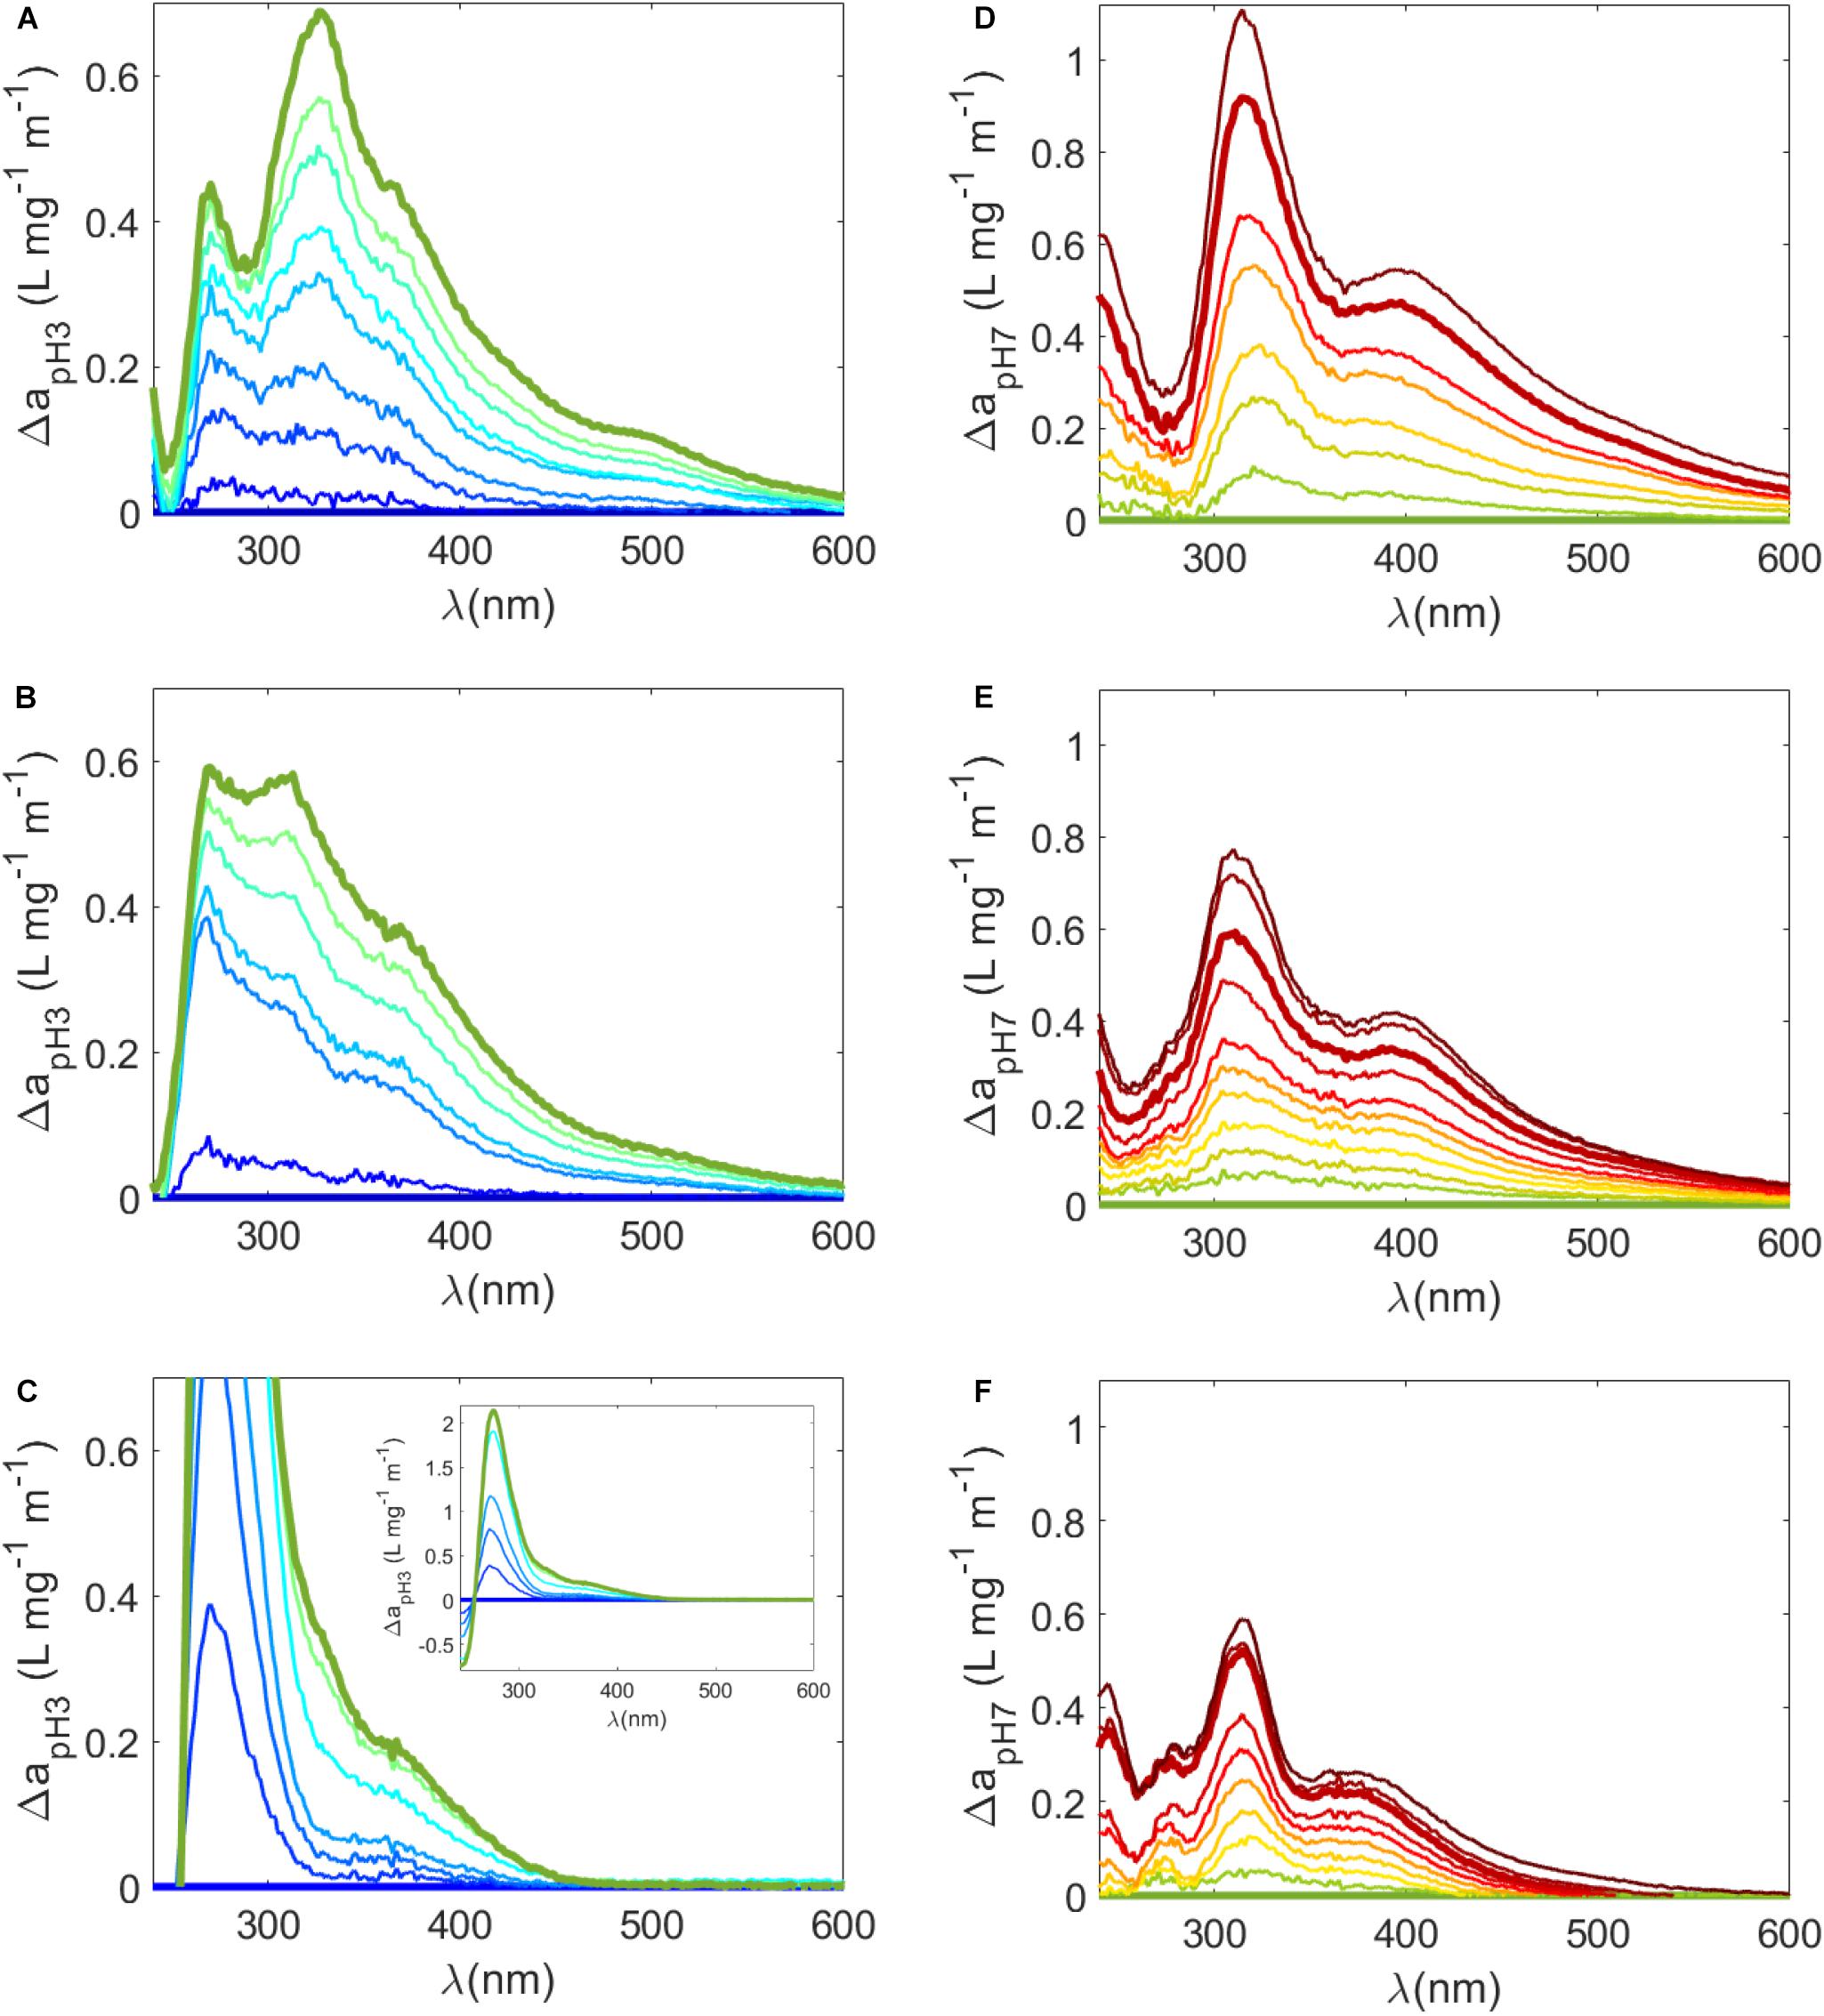
Figure 4. (A–C) Δa(λ) (Eq 11) from pH 3 (i.e., change in mass normalized a(λ) determined by [a(λ)pH – a(λ)pH3]/DOC) where (A) is the untreated sample, (B) is the irradiated sample, and (C) is the reduced sample. Bold lines represent Δa(λ) at pH 3 (flat blue line) and pH 7 (light green line), meant to highlight the change in the carboxylic acid pKa range. (A–C) Are plotted on the same scale but the inset in (C) shows the entire Δa(λ) plot for the reduced sample. (D–F) Δa(λ) from pH 7 where (D) is untreated, (E) is irradiated, and (F) is reduced. Bold lines represent Δa(λ) at pH 7 (flat light green line) to pH 10 (bold red line) to highlight the change in the phenolic pKa range.
Both borohydride reduction and photodegradation resulted in considerable losses in Sargassum SPE-DOM absorption spectra (Figures 3B,C,E,F and Supplementary Table S3). It has been well established that sodium borohydride (NaBH4) produces a substantial absorbance loss, especially in the visible region, and blue-shifted fluorescence increases, due to the reduction of carbonyl containing molecules, such as aromatic ketones, and the loss of charge transfer interactions between suspected phenolic electron donors and carbonyl-containing acceptors (Ma et al., 2010; Sharpless and Blough, 2014; Del Vecchio et al., 2017; Schendorf et al., 2019). Photo-oxidation of DOM generally decreases its absorbance and fluorescence; however, it is expected to decrease DOM electron-donating capacity but have little impact on electron-accepting capacity (Sharpless et al., 2014). Although our results are highly dependent on irradiation time, the loss of visible absorption was more substantial for reduced samples than irradiated samples, resulting in higher S300–500 values in reduced samples compared to irradiated samples (Supplementary Table S3). The pH dependence of a(λ) in the visible was more diminished in reduced samples relative to untreated SPE-DOM. For instance, between pH 3 and 10 a(412) increased by 56 ± 9% in untreated samples (n = 6) and by 36 ± 5% in irradiated samples (n = 2) but only by 16 ± 1% in reduced samples (n = 2) (Supplementary Table S3).
Substantial changes were also observed following reduction and irradiation in Δa(λ) spectra (Figures 4B,C,E,F). For reduced samples in the carboxylic acid pH range, the 270 nm peak in difference a(λ) relative to pH 3 was much sharper and higher relative to the untreated sample (inset in Figure 4C). The 325 nm peak and the broad peaks observed in the untreated sample were removed or greatly diminished (Figure 4C). A similarly intense peak at 280 nm was also observed in Δa(λ) plots of reduced terrestrial samples, which was attributed to the deprotonation of a highly related pool of aromatic carboxylic acids (Schendorf et al., 2019). After irradiation of Sargassum SPE-DOM, broad peaks were still evident in Δa(λ) plots relative pH 3 (Figure 4B), but the peaks at 270 and 325 nm were less discrete perhaps due to the loss of carboxyl groups during photodegradation (Xie et al., 2004). However, over the phenolic range, while pH dependence was smaller in reduced and irradiated samples, the peaks observed in untreated samples at ∼315 nm and > 400 nm were retained in Δa(λ) plots (Figures 4E,F). These results suggest that polyphenols unique to Sargassum (i.e., phlorotannins) are a dominant contributor to its optical properties. Because increases in Δa(λ) from pH 7 were retained in irradiated samples, significant phenolic content must have been present after this irradiation time, which could possibly be smaller molecular weight remnants of Sargassum phlorotannins.
Previous work demonstrated that Sargassum DOM has a high phenolic content, ranging from ∼5 to 20% of the DOC concentration (Powers et al., 2019). However, NMR spectra showed that Sargassum DOM is comprised of a diverse array of molecular classes and in particular a high abundance of oxygenated phlorotannins and general aromatic molecules (Powers et al., 2019). Thus, as is evident with the substantial changes in Δa(λ) over the low carboxylic acid pH range, Sargassum DOM optical properties are not due to phenolic groups alone. Because carboxylation and hydroxylation reactions of phlorotannins are possible under the natural sunlight and aerated conditions of many experiments (Schmitt-Kopplin et al., 1998; Zhang and Blough, 2016), future work could isolate phlorotannins from bulk Sargassum DOM to better understand the optical properties of phlorotannins alone. Regardless, while there are several differences between Sargassum DOM and terrestrial DOM discussed above, pH titrations also revealed several similarities to the optical properties of terrestrial materials (Dryer et al., 2008; Schendorf et al., 2019). Thus, pH titrations further support the idea that Sargassum may be an important source of CDOM with similar optical properties to terrestrial DOM in the open ocean.
Photodegradation of Sargassum DOM Optical Properties
During Sargassum DOM photodegradation experiments, the maximum decrease in a(λ) occurred at ∼285 nm, whereas the percent a(λ) loss was greatest in the visible region (Supplementary Figure S7). First order rate constants (ka, Eq 6) for a(305) loss ranged from 0.015 to 0.022 h–1 resulting in 26–37% loss after 20 h whereas rate constants for a(412) loss ranged from 0.020 to 0.035 h–1 resulting in 34–53% loss after 20 h (Supplementary Table S4 and Supplementary Figure S4). These ka values are slightly lower but in good agreement with those found for a(305) of whole water Sargassum exudates of 0.024–0.027 h–1 (Shank et al., 2010b), although it should be noted that irradiation conditions were not the same between studies. In fact, a variety of light sources, sample containers, and experimental configurations have been used to evaluate CDOM photochemistry, and when photon doses are not reported, comparisons are difficult. Thus, while we only compare Sargassum DOM photodegradation to SRNOM photodegradation using our irradiation system, future work should evaluate photochemical changes in DOM and exudates from a variety of sources (e.g., other marine plants and algae).
When normalized to the initial a(λ), whole water Sargassum DOM absorption spectra exhibited the fastest degradation, followed by SPE-DOM dissolved in low DOM seawater, while SPE-DOM dissolved in pure water exhibited the slowest degradation (Supplementary Table S4 and Supplementary Figure S5). It is not unexpected that a(λ) photodegradation is faster in seawater compared to freshwater, given that chloride and bromide at seawater concentrations increased the photochemical loss of SRFA up to 40% when compared to SRFA at the same ionic strength with no halides (Grebel et al., 2009). Albeit for one example, a(λ) loss was greater for whole water Sargassum DOM than for SPE-DOM dissolved in seawater, especially at visible wavelengths (Supplementary Figure S5), suggesting that SPE does impact photodegradation rates. However, regardless of sample matrix, when compared to all Sargassum DOM samples, a(λ) loss for SRNOM was much slower, with a ka for a(305) of 0.007 h–1 and a ka at a(412) of 0.013 h–1 (Supplementary Table S4 and Supplementary Figure S5).
Fluorescence loss behaved differently from absorbance loss for Sargassum DOM. Rapid fluorescence loss was observed in early stages of irradiation and over half of the fluorescence lost over 20 h occurred in the first 2 h (Supplementary Figure S6). After 2 h, FDOM decay was much slower and a pseudo-first order decay resulted in poor fits for fluorescence loss. Thus, fluorescence decay was described by a biexponential function (Eq. 7), which modeled fluorescence loss as the sum of two exponential equations or two “pools”, F1 and F2. Fluorescence decay constants for F1 and F2, k1 and k2, respectively, were highest for excitation in the UVA-visible and emission in the visible spectrum (k1 > 1 h–1, k2 > 0.02 h–1, Supplementary Figure S7 and Supplementary Table S4). Interestingly, while a(λ) loss was much slower for SRNOM, SRNOM fluorescence decay showed some similarities to Sargassum DOM fluorescence decay (Supplementary Table S4), despite SRNOM having a much higher overall fluorescence (Figure 2D). In line with these observations, changes in fluorescence apparent quantum yield spectra showed key differences between Sargassum DOM and SRNOM. The Sargassum DOM sample before SPE used in irradiation experiments had a broad Φ(λex–max) of 0.0043 between 390 and 410 nm before irradiation and after 20 h had a Φ(λex–max) of 0.0022 but at a similar λex–max (Figure 2B and Supplementary Figure S8). On the other hand, SRNOM Φ(λ) decayed continually with irradiation time and exhibited a large blue-shift in Φ(λex–max) from 0.011 at 396 nm to 0.0048 at 327 nm, and substantial losses in visible Φ(λ) values (Supplementary Figure S8).
Photochemical decay of Sargassum DOM fluorescence has not been reported previously, but it has been observed in DOM from other brown macroalgae (Wada et al., 2015). Wada et al. (2015) observed fluorescence increases of an excitation/emission peak at 290/445 nm, which the authors attributed to the photodegradation of polyphenols into simpler and smaller molecules having fluorescence in this region. While fluorescence increases were not observed here, fluorescence changes were greatly reduced after 2 h irradiation so it is possible that simultaneous production and decay of fluorophores was co-occurring or that the loss of fluorophores and fluorescence quenchers was co-occurring. Because Sargassum DOM fluorescence was relatively stable after 2 h irradiation, perhaps Sargassum DOM could evolve into a relatively stable component of the marine FDOM pool, especially if any of this material is transported to the deep ocean. Open ocean SPE-DOM also exhibited minimal changes in fluorescence during prolonged irradiation (Gonsior et al., 2014), supporting the idea that photo-stabile fluorophores contribute to the marine DOM pool. As mentioned previously, Sargassum DOM in this study includes exudates and transformation products from Sargassum, epiphytes, and microorganisms. Significant changes must occur by the time samples are collected, and the lability of Sargassum exudates still needs to be evaluated. Hence, these statements regarding the ultimate fate of Sargassum FDOM are highly speculative.
Changes in the Molecular Composition of Sargassum DOM During Irradiation Experiments
Similar to the rapid decreases in Sargassum FDOM observed early in irradiation experiments, changes in the molecular composition of Sargassum SPE-DOM were observed even at early time points (i.e., 2–6 h) (Supplementary Figure S9). During the first 6 h, m/z ion abundances with assigned relatively O-rich (O/Cwt ∼0.6) and H-deficient (H/Cwt ∼1.1) formulas increased and abundances of m/z ions with relatively O-deficient (O/Cwt ∼0.4) and H-rich (H/Cwt ∼1.3) formulas increased (Supplementary Table S5). For all intervals, both average AImod and COS were variable and overlapped between relatively increasing and relatively decreasing values. The largest changes in Sargassum SPE-DOM occurred between 0 and 46 h and 22 and 46 h (Figure 5 and Supplementary Figure S9). For both of these intervals, O/Cwt ratios that relatively increased (O/C ∼0.4) or relatively decreased (O/C ∼0.6) remained the same as in previous intervals, and were not significantly different (Supplementary Table S5). However, m/z ions with very low H/Cwt ratios (0.8–0.9) relatively decreased and m/z ions with H-rich aliphatic formulas and very high H/Cwt ratios (1.5–1.6) became more prominent (Supplementary Table S5).
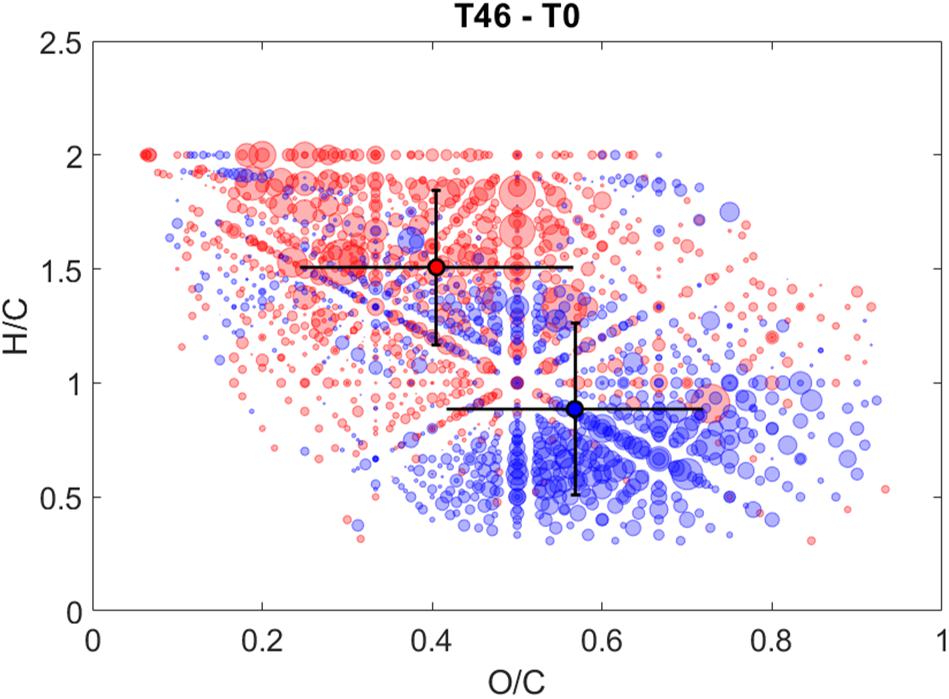
Figure 5. Hydrogen to carbon (H/C) ratios versus oxygen to carbon (O/C) ratios of CHO formulas that either relatively increased in intensity (red circles) or relatively decreased in intensity (blue circles) after 46 h of irradiation. Total photon dose after 46 h during this experiment was comparable to a photon dose of ∼20 h for the experiments discussed in section “Photodegradation of Sargassum DOM Optical Properties.” Bubble size corresponds to peak intensity and dark circles with error bars are the intensity-weighted average H/C and O/C ratios of relatively increasing (red circle) and relatively decreasing (blue circle) formulas.
The van Krevelen diagram highlighting changes between 0 and 46 h (Figure 5) showed significant changes in the molecular composition of Sargassum SPE-DOM that were similar to changes in the molecular composition of irradiated deep and surface ocean SPE-DOM reported previously (Gonsior et al., 2014; Medeiros et al., 2015). However, photo-labile compounds in surface ocean SPE-DOM were centered at an H/C ratio of 1.3 (Gonsior et al., 2014), instead of 0.8, as observed in this study. The high O/Cwt ratio and low H/Cwt ratio of decreasing m/z ions in Sargassum DOM are indicative of the photodegradation of hydrogen-deficient and oxygenated compounds, which has been associated with an uncharacterized pool of polyphenols (Gonsior et al., 2016; Powers et al., 2019). The photodegradation and/or transformation of polyphenols is also supported by the relative decrease of compounds with a relatively high DBEwt of 10 after 46 h of irradiation (Supplementary Table S5). Previous work has also observed decreases in unsaturated aromatic formulas and increases in more saturated and aliphatic formulas during irradiations of riverine DOM (Gonsior et al., 2009; Stubbins et al., 2010). The reader is reminded that titrations revealed a large contribution to Sargassum optical properties in carboxylic acid pH range and NMR spectroscopy revealed that carboxyl groups are abundant in Sargassum DOM (Powers et al., 2019). Previous work demonstrated that the photochemical production of CO2 from terrestrial DOM was much larger than its carboxyl content, meaning that either carboxyl groups are regenerated during irradiation or that the major pathway for photochemical CO2 production does not involve photodecarboxylation (Xie et al., 2004). Perhaps the former is more likely because the formation of carboxyl groups was confirmed during irradiations of soil humic substances (Schmitt-Kopplin et al., 1998). Given the suspected high carboxyl content of Sargassum DOM, some of the observed changes in Sargassum DOM during irradiation could be due to photodecarboxylation reactions. An enormous rate of CO2 photoproduction was measured from Sargassum DOM previously (Shank et al., 2010b), suggesting that when present, photo-mineralization of Sargassum-derived DOM could be a significant source of CO2 to the surface ocean.
The question remains as to the fate of Sargassum DOM in the marine environment. DOC was measured after 20 h irradiation for one SPE-DOM sample in pure water, and a loss of 10% of the initial DOC concentration was observed. However, additional experiments are needed to properly evaluate carbon loss from Sargassum DOM. In a previous study, significant DOC loss and DOM mineralization (to dissolved inorganic carbon, DIC) was observed from Sargassum DOM during irradiation, amounting to 2,600–2,800 nM m h–1 [normalized to a(350)] (Shank et al., 2010b). This DIC photoproduction rate is far more rapid than the rate of 270–630 nM m h–1 [normalized to a(350)] determined for Suwannee River water (Miller and Zepp, 1995). The Sargassum DIC photoproduction rate applied to our whole water sample would amount to a DIC production rate of ∼100 μM h–1. For context, open ocean seawater samples only produce DIC at a rate of ∼20–40 nM h–1 (Wang et al., 2009; Powers et al., 2017). Photon doses and experimental set-ups used in experiments are different for all comparisons made here, but the very large differences in DIC photoproduction rates between Sargassum DOM and both terrestrial and marine waters suggest that Sargassum DOM contains a very photo-labile pool that readily produces DIC. Most of the Sargassum DOC loss occurred during the first 12 h of irradiation (Shank et al., 2010b), implying that DIC produced photochemically from Sargassum DOM could be an important yet unconsidered source of CO2 in the open ocean when Sargassum is present. Moreover, microbial CO2 production from the release of labile DOM by Sargassum and the photochemical formation of biologically labile products also needs to be considered.
Conclusion
Optical property analyses revealed the substantial release of both CDOM and FDOM from Sargassum under a variety of experimental conditions. Mid-senescent Sargassum had significantly higher CDOM and FDOM release rates when compared to non-stress experiments, a result that has been observed in previous work (Shank et al., 2010b). Under non-stress conditions, increases in UV CDOM absorption spectra and EEM spectra were similar for Sargassum in indoor tanks under artificial visible light and for Sargassum in uncovered outdoor tanks. However, CDOM increases at longer wavelengths into the visible region of the spectrum were greater for tanks exposed to sunlight, possibly due to sunlight-induced oxidation of released phlorotannins. Because Sargassum absorption spectra decreased quickly compared to SRNOM under simulated sunlight, photochemistry likely contributed to Sargassum DOM transformations in the outdoor experiments. Because CDOM release rates were similar in the UV region and higher in the visible region during experiments under sunlight versus those indoors, Sargassum may release more CDOM when exposed to sunlight to cope with UV stress. The UV-sunscreen and antioxidant properties of brown algae phlorotannins have been documented (Le Lann et al., 2016) and previous work demonstrated that Sargassum releases more DOC with a high phenolic content when exposed to UV radiation (Powers et al., 2019). Phlorotannin content in brown algae tissue is typically higher when it is exposed to UV radiation when compared to visible light or dark conditions (Pavia and Brock, 2000; Swanson and Druehl, 2002). Similar to our results, one study reported that along with a high phlorotannin content in tissues exposed to UV radiation, CDOM increased significantly in the water in contact with kelp under UVA radiation but this CDOM was likely degraded when exposed to UVB radiation (Swanson and Druehl, 2002).
In all experiments, Sargassum produced fluorescence signals that have typically been attributed to “humic-like” materials and fluorescence apparent quantum yield spectra showed similarities to those for terrestrial organic matter (Ma et al., 2010; McKay et al., 2016; Schendorf et al., 2019). This result highlights that conventional terms such as peak A and C used to describe fluorescence properties should not be only attributed to one source in the ocean. Absorbance spectra from terrestrial materials have larger increases with pH (Schendorf et al., 2019) when compared to Sargassum DOM, but Sargassum DOM showed a similar a(λ) pH dependence. For instance, Sargassum DOM exhibited broad peaks in mass-normalized difference a(λ) that are similar to the broad peaks observed for IHSS reference humic and fulvic acids (Dryer et al., 2008; Schendorf et al., 2019). However, Sargassum DOM exhibited distinct peaks in mass-normalized difference a(λ) in the carboxylic acid pH range and the phenolic pH range, suggesting that Sargassum DOM contains groups of highly related and possibly unique aromatic carboxylic acids (e.g., polyphenolic acids) and polyphenolic molecules when compared to terrestrial materials.
Recently, an average Sargassum biomass of 4.4 million tons was estimated for July 2015 in the Caribbean and Central Western Atlantic (Wang et al., 2018) and a “Sargassum belt” that covered > 8,850 km from Western Africa to the Gulf of Mexico and the Caribbean had a massive estimated biomass of 20 million tons (Wang et al., 2019). Inundation events in the Caribbean are becoming more frequent and Sargassum biomass has been increasing annually over the last ∼20 years (Wang and Hu, 2016). Coupling field data with remote sensing data shows promise in improving annual estimates of Sargassum biomass and density, and has revealed that Sargassum can account for ∼18% of the particulate organic carbon in the Caribbean and Central Western Atlantic during blooms (Wang et al., 2018). Given this large impact on the environment, work is still needed to quantify the efficiency of CO2 photoproduction from Sargassum DOM to estimate its contribution to the marine carbon cycle, especially during blooms and coastal inundation events.
Data Availability Statement
The datasets for this study can be found in the Supplementary Material and at the NSF BCO-DMO data repository (https://www.bco-dmo.org/project/814753). Additional inquiries can be addressed to the corresponding author.
Author Contributions
MG, RD, and NB conceived the study. MG, LP, NM, RD, and NB planned sampling efforts, and exudation experiments. LP performed the exudation/photochemical experiments, optical property analyses, FT-ICR-MS data analysis, and wrote the manuscript with feedback from all authors. MG and PS-K performed ultrahigh resolution mass spectrometry analysis. All authors contributed to the article and approved the submitted version.
Funding
This work was supported by the National Science Foundation Chemical Oceanography awards OCE-1536888 and OCE-1536927.
Conflict of Interest
The authors declare that the research was conducted in the absence of any commercial or financial relationships that could be construed as a potential conflict of interest.
Acknowledgments
We thank the captain and crew of the R/V Hugh R. Sharp and R/V Henry Stommel for assistance in collecting Sargassum off Cape Hatteras and Bermuda, respectively. We also thank two reviewers their careful evaluation of this work and improving this manuscript. This is contribution no. 5925 and ref. no. [UMCES] CBL 2021-030 of the University of Maryland Center for Environmental Science, Chesapeake Biological Laboratory.
Dedication
This article is dedicated to the memory of Rossana Del Vecchio, a fine scientist, colleague, wife, and mother.
Supplementary Material
The Supplementary Material for this article can be found online at: https://www.frontiersin.org/articles/10.3389/fmars.2020.588287/full#supplementary-material
References
Andrew, A. A., Del Vecchio, R., Subramaniam, A., and Blough, N. V. (2013). Chromophoric dissolved organic matter (CDOM) in the equatorial atlantic ocean: optical properties and their relation to CDOM structure and source. Mar. Chem. 148, 33–43. doi: 10.1016/j.marchem.2012.11.001
Andrew, A. A., Del Vecchio, R., Zhang, Y., Subramaniam, A., and Blough, N. V. (2016). Are extracted materials truly representative of original samples? impact of C18 Extraction on CDOM optical and chemical properties. Front. Chem. 4:4. doi: 10.3389/fchem.2016.00004
Arnold, T. M., and Targett, N. M. (1998). Quantifying in Situ Rates of Phlorotannin Synthesis and Polymerization in Marine Brown Algae. J. Chem. Ecol. 24, 577–595. doi: 10.1023/A:1022373121596
Bayer, B., Hansman, R. L., Bittner, M. J., Noriega-Ortega, B. E., Niggemann, J., Dittmar, T., et al. (2019). Ammonia-oxidizing archaea release a suite of organic compounds potentially fueling prokaryotic heterotrophy in the ocean. Environ. Microbiol. 21, 4062-4075. doi: 10.1111/1462-2920.14755
Blough, N. V. (1997). “Photochemistry in the sea-surface microlayer,” in The Sea Surface and Global Change, eds P. S. Liss and R. A. Duce (Cambridge: Cambridge University Press), 383–424. doi: 10.1017/CBO9780511525025.014
Blough, N. V., and Del Vecchio, R. (2002). Chromophoric DOM in the Coastal Environment, in: Biogeochemistry of Marine Dissolved Organic Matter. Amsterdam: Elsevier, 509–546. doi: 10.1016/B978-012323841-2/50012-9
Blough, N. V., and Zepp, R. G. (1995). “Reactive Oxygen Species in Natural Waters,” in Active Oxygen in Chemistry, eds C. S. Foote, J. S. Valentine, A. Greenberg, and J. Liebman (New York, NY: Champman and Hall), 280–333. doi: 10.1007/978-94-007-0874-7
Boyle, E. S., Guerriero, N., Thiallet, A., Del Vecchio, R., and Blough, N. V. (2009). Optical properties of humic substances and CDOM: relation to structure. Environ. Sci. Technol. 43, 2262–2268. doi: 10.1021/es803264g
Brouwer, A. M. (2011). Standards for photoluminescence quantum yield measurements in solution (IUPAC Technical Report). Pure Appl. Chem. 83, 2213–2228. doi: 10.1351/PAC-REP-10-09-31
Cao, F., and Miller, W. L. (2015). A new algorithm to retrieve chromophoric dissolved organic matter (CDOM) absorption spectra in the UV from ocean color. J. Geophys. Res. Ocean. 120, 496–516. doi: 10.1002/jgrc.20224
Cartisano, C. M., Del Vecchio, R., Bianca, M. R., and Blough, N. V. (2018). Investigating the sources and structure of chromophoric dissolved organic matter (CDOM) in the North Pacific Ocean (NPO) utilizing optical spectroscopy combined with solid phase extraction and borohydride reduction. Mar. Chem. 204, 20-35. doi: 10.1016/j.marchem.2018.05.005
Coble, P. G. (1996). Characterization of marine and terrestrial DOM in seawater using excitation-emission matrix spectroscopy. Mar. Chem. 51, 325–346. doi: 10.1016/0304-4203(95)00062-3
Coble, P. G. (2007). Marine optical biogeochemistry: the chemistry of ocean color. Chem. Rev. 38, 402-418. doi: 10.1021/cr050350
Del Castillo, C. E. (2005). “Remote Sensing of Organic Matter in Coastal Waters, in: Remote Sensing of Coastal Aquatic Environments,” in Technologies, Techniques and Applications, eds R. L. Miller, C. E. Del Castillo, and B. A. McKee (Netherlands: Springer), 157–180.
Del Vecchio, R., and Blough, N. V. (2002). Photobleaching of chromophoric dissolved organic matter in natural waters: kinetics and modeling. Mar. Chem. 78, 231–253. doi: 10.1016/S0304-4203(02)00036-1
Del Vecchio, R., and Blough, N. V. (2004). Spatial and seasonal distribution of chromophoric dissolved organic matter and dissolved organic carbon in the Middle Atlantic Bight. Mar. Chem. 89, 169–187. doi: 10.1016/j.marchem.2004.02.027
Del Vecchio, R., Schendorf, T. M., and Blough, N. V. (2017). Contribution of Quinones and Ketones/Aldehydes to the Optical Properties of Humic Substances (HS) and Chromophoric Dissolved Organic Matter (CDOM). Environ. Sci. Technol. 51, 13624–13632. doi: 10.1021/acs.est.7b04172
Dittmar, T., Koch, B., Hertkorn, N., and Kattner, G. (2008). A simple and efficient method for the solid-phase extraction of dissolved organic matter (SPE-DOM) from seawater. Limnol. Oceanogr. Methods 6, 230–235. doi: 10.4319/lom.2008.6.230
Dryer, D. J., Korshin, G. V., and Fabbricino, M. (2008). In situ examination of the protonation behavior of fulvic acids using differential absorbance spectroscopy. Environ. Sci. Technol. 42, 6644–6649. doi: 10.1021/es800741u
Fichot, C. G., and Miller, W. L. (2010). An approach to quantify depth-resolved marine photochemical fluxes using remote sensing: application to carbon monoxide (CO) photoproduction. Remote Sens. Environ. 114, 1363–1377. doi: 10.1016/j.rse.2010.01.019
Gonsior, M., Hertkorn, N., Conte, M. H., Cooper, W. J., Bastviken, D., Druffel, E., et al. (2014). Photochemical production of polyols arising from significant photo-transformation of dissolved organic matter in the oligotrophic surface ocean. Mar. Chem. 163, 10–18. doi: 10.1016/j.marchem.2014.04.002
Gonsior, M., Peake, B. M., Cooper, W. T., Podgorski, D., Andrilli, J. D., and Cooper, W. J. (2009). Photochemically induced changes in dissolved organic matter identified by ultrahigh resolution fourier transform ion cyclotron resonance mass spectrometry. Environ. Sci. Technol. 43, 698–703. doi: 10.1021/es8022804
Gonsior, M., Valle, J., Schmitt-Kopplin, P., Hertkorn, N., Bastviken, D., Luek, J., et al. (2016). Chemodiversity of dissolved organic matter in the Amazon Basin. Biogeosciences 13, 4279–4290. doi: 10.5194/bg-13-4279-2016
Gower, J. F. R., and King, S. A. (2011). Distribution of floating Sargassum in the Gulf of Mexico and the Atlantic Ocean mapped using MERIS. Int. J. Remote Sens. 32, 1917–1929. doi: 10.1080/01431161003639660
Grebel, J. E., Pignatello, J. J., Song, W., Cooper, W. J., and Mitch, W. A. (2009). Impact of halides on the photobleaching of dissolved organic matter. Mar. Chem. 115, 134–144. doi: 10.1016/j.marchem.2009.07.009
Green, S. A., and Blough, N. V. (1994). Optical absorption and fluorescence properties of chromophoric dissolved organic matter in natural waters. Limnol. Oceanogr. 39, 1903–1916. doi: 10.4319/lo.1994.39.8.1903
Heller, C. A., Henry, R. A., McLaughlin, B. A., and Bliss, D. E. (1974). Fluorescence Spectra and Quantum yields: quinine. Uranine, 9,10-Diphenylanthracene, and 9,10-Bis(phenylethynyl)anthracenes. J. Chem. Eng. Data 19, 214–219. doi: 10.1021/je60062a002
Helms, J. R., Stubbins, A., Ritchie, J. D., Minor, E. C., Kieber, D. J., and Mopper, K. (2008). Absorption spectral slopes and slope ratios as indicators of molecular weight, source, and photobleaching of chromophoric dissolved organic matter. Limnol. Oceanogr. 53, 955–969. doi: 10.4319/lo.2008.53.3.0955
Hernes, P. J. (2003). Photochemical and microbial degradation of dissolved lignin phenols: implications for the fate of terrigenous dissolved organic matter in marine environments. J. Geophys. Res. 108:3291. doi: 10.1029/2002JC001421
Hernes, P. J., Spencer, R. G. M., Dyda, R. Y., Pellerin, B. A., Bachand, P. A. M., and Bergamaschi, B. A. (2008). The role of hydrologic regimes on dissolved organic carbon composition in an agricultural watershed. Geochim. Cosmochim. Acta 72, 5266–5277. doi: 10.1016/j.gca.2008.07.031
Herzsprung, P., Hertkorn, N., von Tümpling, W., Harir, M., Friese, K., and Schmitt-Kopplin, P. (2014). Understanding molecular formula assignment of Fourier transform ion cyclotron resonance mass spectrometry data of natural organic matter from a chemical point of view. Anal. Bioanal. Chem. 406, 7977–7987. doi: 10.1007/s00216-014-8249-y
Hulatt, C. J., Thomas, D. N., Bowers, D. G., Norman, L., and Zhang, C. (2009). Exudation and decomposition of chromophoric dissolved organic matter (CDOM) from some temperate macroalgae. Estuar. Coast. Shelf Sci. 84, 147–153. doi: 10.1016/j.ecss.2009.06.014
Jankowski, J., Kieber, D., Mopper, K., and Neale, P. (2000). Development and intercalibration of ultraviolet solar actinometers. Photochem. Photobiol. 71, 431–440. doi: 10.1562/0031-865520000710431DAIOUS2.0.CO2
Jankowski, J. J., Kieber, D. J., and Mopper, K. (1999). Nitrate and nitrite Ultraviolet Actinometers. Photochem. Photobiol. 70, 319–328.
Janot, N., Reiller, P. E., Korshin, G. V., and Benedetti, M. F. (2010). Using spectrophotometric titrations to characterize humic acid reactivity at environmental concentrations. Environ. Sci. Technol. 44, 6782–6788. doi: 10.1021/es1012142
Koch, B. P., and Dittmar, T. (2006). From mass to structure: an aromaticity index for high-resolution mass data of natural organic matter. Rapid Commun. Mass Spectrom. 20, 926–932. doi: 10.1002/rcm.2386
Koch, B. P., and Dittmar, T. (2016). Erratum: from mass to structure: an aromaticity index for high-resolution mass data of natural organic matter (Rapid Communications in Mass Spectrometry (2006) 20 (926-932) Rapid Commun. Mass Spectrom. 30:250. doi: 10.1002/rcm.7433
Koch, B. P., Dittmar, T., Witt, M., and Kattner, G. (2007). Fundamentals of molecular formula assignment to ultrahigh resolution mass data of natural organic matter. Anal. Chem. 79, 1758–1763. doi: 10.1021/AC061949S
Kroll, J. H., Donahue, N. M., Jimenez, J. L., Kessler, S. H., Canagaratna, M. R., Wilson, K. R., et al. (2011). Carbon oxidation state as a metric for describing the chemistry of atmospheric organic aerosol. Nat. Chem. 3, 133–139. doi: 10.1038/nchem.948
Kujawinski, E. B., Longnecker, K., Blough, N. V., Del Vecchio, R., Finlay, L., Kitner, J. B., et al. (2009). Identification of possible source markers in marine dissolved organic matter using ultrahigh resolution mass spectrometry. Geochim. Cosmochim. Acta 73, 4384–4399. doi: 10.1016/j.gca.2009.04.033
Le Lann, K., Surget, G., Couteau, C., Coiffard, L., Cérantola, S., Gaillard, F., et al. (2016). Sunscreen, antioxidant, and bactericide capacities of phlorotannins from the brown macroalga Halidrys siliquosa. J. Appl. Phycol. 28, 3547–3559. doi: 10.1007/s10811-016-0853-0
Li, H., Guo, A., and Wang, H. (2008). Mechanisms of oxidative browning of wine. Food Chem. 108, 1–13. doi: 10.1016/j.foodchem.2007.10.065
Ma, J., Del Vecchio, R., Golanoski, K. S., Boyle, E. S., and Blough, N. V. (2010). Optical properties of humic substances and CDOM: effects of borohydride reduction. Environ. Sci. Technol. 44, 5395–5402. doi: 10.1021/es100880q
Maie, N., Pisani, O., and Jaffé, R. (2008). Mangrove tannins in aquatic ecosystems: their fate and possible influence on dissolved organic carbon and nitrogen cycling. Limnol. Ocean. 53:160. doi: 10.2307/40006158
Marion, G. M., Millero, F. J., Camões, M. F., Spitzer, P., Feistel, R., and Chen, C.-T. A. (2011). pH of seawater. Mar. Chem 126, 89–96. doi: 10.1016/j.marchem.2011.04.002
McKay, G. (2020). Emerging investigator series: critical review of photophysical models for the optical and photochemical properties of dissolved organic matter. Environ. Sci. Process. Impacts 22, 1139–1165. doi: 10.1039/d0em00056f
McKay, G., Couch, K. D., Mezyk, S. P., and Rosario-Ortiz, F. L. (2016). Investigation of the coupled effects of molecular weight and charge-transfer interactions on the optical and photochemical properties of dissolved organic matter. Environ. Sci. Technol. 50, 8093–8102. doi: 10.1021/acs.est.6b02109
Medeiros, P. M., Seidel, M., Powers, L. C., Dittmar, T., Hansell, D. A., and Miller, W. L. (2015). Dissolved organic matter composition and photochemical transformations in the northern North Pacific Ocean. Geophys. Res. Lett. 42, 863-870. doi: 10.1002/2014GL062663
Miller, W. L., and Zepp, R. G. (1995). Photochemical production of dissolved inorganic carbon from terrestrial organic matter: significance to the oceanic organic carbon cycle. Geophys. Res. Lett. 22, 417–420. doi: 10.1029/94GL03344
Mopper, K., and Kieber, D. J. (2000). Marine Photochemistry and Its Impact on Carbon Cycling. Cambridge: Cambridge University Press.
Mopper, K., and Kieber, D. J. (2002). “Photochemistry and the Cycling of Carbon, Sulfur, Nitrogen and Phosphorus,” in Biogeochemistry of Marine Dissolved Organic Matter, eds D. A. Hansell and C. A. Carlson (Cambridge, MA: Academic Press), 455–507.
Moran, M. A., and Zepp, R. G. (1997). Role of photoreactions in the formation of biologically compounds from dissolved organic matter. Limnol. Oceanogr. 42, 1307–1316.
Murphy, K. R., Stedmon, C. A., Waite, T. D., and Ruiz, G. M. (2008). Distinguishing between terrestrial and autochthonous organic matter sources in marine environments using fluorescence spectroscopy. Mar. Chem 108, 40–58. doi: 10.1016/j.marchem.2007.10.003
Myklestad, S. M. (2005). “Dissolved organic carbon from phytoplankton,” in The Handbook of Environmental Chemsitry Vol. 5 Part D Marine Chemistry, ed. P. Wangersky, 111–148. doi: 10.1007/10683826_5
Nayar, S., and Chou, L. M. (2003). Relative efficiencies of different filters in retaining phytoplankton for pigment and productivity studies. Estuar. Coast. Shelf Sci. 58, 241–248. doi: 10.1016/S0272-7714(03)00075-1
Nelson, N. B., and Siegel, D. A. (2002). Chromophoric DOM in the Open Ocean, Biogeochemistry of Marine Dissolved Organic Matter. Boston, MA: Academic Press, Inc,Google Scholar
Nelson, N. B., and Siegel, D. A. (2013). The global distribution and dynamics of chromophoric dissolved organic matter. Ann. Rev. Mar. Sci. 5, 447–476. doi: 10.1146/annurev-marine-120710-100751
Nelson, N. B., Siegel, D. A., Carlson, C. A., Swan, C., Smethie, W. M., and Khatiwala, S. (2007). Hydrography of chromophoric dissolved organic matter in the North Atlantic. Deep Sea Res. Part I Oceanogr. Res. Pap. 54, 710–731. doi: 10.1016/j.dsr.2007.02.006
Nelson, N. B., Siegel, D. A., and Michaels, A. F. (1998). Seasonal dynamics of colored dissolved material in the Sargasso Sea. Deep. Res. Part I Oceanogr. Res. Pap. 45, 931–957. doi: 10.1016/S0967-0637(97)00106-4
Noble, J. E., and Bailey, M. J. A. (2009). Quantitation of Protein. Methods Enzymol. 463, 73-95. doi: 10.1016/S0076-6879(09)63008-1
Paerl, R. W., Claudio, I. M., Shields, M. R., Bianchi, T. S., and Osburn, C. L. (2020). Dityrosine formation via reactive oxygen consumption yields increasingly recalcitrant humic-like fluorescent organic matter in the ocean. Limnol. Oceanogr. Lett. 5, 337-345. doi: 10.1002/lol2.10154
Pavia, H., and Brock, E. (2000). Extrinsic factors influencing phlorotannin production in the brown alga. Mar. Ecol. Prog. Ser. 193, 285–294. doi: 10.3354/meps193285
Pavia, H., Cervin, G., Lindgren, A., and Åberg, P. (1997). Effects of UV-B radiation and simulated herbivory on phlorotannins in the brown alga Ascophyllum nodosum. Mar. Ecol. Prog. Ser. 157, 139–146. doi: 10.3354/meps157139
Perry, R. A., Vaudrey, J. M. P., and Dierssen, H. M. (2018). Long range transport and carbon and nitrogen dynamics of floating seagrass wracks in Greater Florida Bay. Estuar. Coast. Shelf Sci. 209, 7–17. doi: 10.1016/j.ecss.2018.05.006
Porterfield, J. Z., and Zlotnick, A. (2010). A simple and general method for determining the protein and nucleic acid content of viruses by UV absorbance. Virology 407, 281–288. doi: 10.1016/j.virol.2010.08.015
Pourcel, L., Routaboul, J. M., Cheynier, V., Lepiniec, L., and Debeaujon, I. (2007). Flavonoid oxidation in plants: from biochemical properties to physiological functions. Trends Plant Sci. 12, 29–36. doi: 10.1016/j.tplants.2006.11.006
Powers, L. C., Brandes, J. A., Stubbins, A., and Miller, W. L. (2017). MoDIE: moderate dissolved inorganic carbon (DI13C) isotope enrichment for improved evaluation of DIC photochemical production in natural waters. Mar. Chem. 194, 1-9. doi: 10.1016/j.marchem.2017.03.007
Powers, L. C., Hertkorn, N., Mcdonald, N., Schmitt-Kopplin, P., Del Vecchio, R., Blough, N. V., et al. (2019). Sargassum sp. act as a large regional source of marine dissolved organic carbon and polyphenols. Global Biogeochem. Cycles 33, 1423-1439. doi: 10.1029/2019GB006225
Powers, L. C., Conway, A., Mitchelmore, C. L., Fleischacker, S. J., Harir, M., Westerman, D. C., et al. (2020). Tracking the formation of new disinfection by-products during the seawater desalination process. Environ. Sci. Water Res. Technol. 4. doi: 10.1039/d0ew00426j
Ritchie, J. D., and Perdue, E. M. (2003). Proton-binding study of standard and reference fulvic acids, humic acids, and natural organic matter. Geochim. Cosmochim. Acta 67, 85–93. doi: 10.1016/S0016-7037(02)01044-X
Rochelle-Newall, E. J., and Fisher, T. R. (2002). Production of chromophoric dissolved organic matter f luorescence in marine and estuarine environments?: an investigation into the role of phytoplankton. Mar. Chem. 77, 7–21. doi: 10.1016/S0304-4203(01)00072-X
Röttgers, R., and Koch, B. P. (2012). Spectroscopic detection of a ubiquitous dissolved pigment degradation product in subsurface waters of the global ocean. Biogeosciences 9, 2585–2596. doi: 10.5194/bg-9-2585-2012
Ruggaber, A., Dlugi, R., and Nakajima, T. (1994). Modeling Radiation Quantities and Photolysis Frequencies in the Troposphere. J. Atmos. Chem. 18, 171–210.
Schendorf, T. M., Del Vecchio, R., Bianca, M., and Blough, N. V. (2019). Combined effects of pH and borohydride reduction on optical properties of Humic Substances (HS): a comparison of optical models. Environ. Sci. Technol. 53, 6310–6319. doi: 10.1021/acs.est.9b01516
Schendorf, T. M., Del Vecchio, R., Koech, K., and Blough, N. V. (2016). A standard protocol for NaBH4 reduction of CDOM and HS. Limnol. Oceanogr. Methods 14, 414–423. doi: 10.1002/lom3.100
Schmitt-Kopplin, P., Hertkorn, N., Schulten, H. R., and Kettrup, A. (1998). Structural changes in a dissolved soil humic acid during photochemical degradation processes under O2 and N2 atmosphere. Environ. Sci. Technol. 32, 2531–2541. doi: 10.1021/es970636z
Shank, G. C., Lee, R., Vähätalo, A., Zepp, R. G., and Bartels, E. (2010a). Production of chromophoric dissolved organic matter from mangrove leaf litter and floating Sargassum colonies. Mar. Chem. 119, 172–181. doi: 10.1016/j.marchem.2010.02.002
Shank, G. C., Zepp, R. G., Vähätalo, A., Lee, R., and Bartels, E. (2010b). Photobleaching kinetics of chromophoric dissolved organic matter derived from mangrove leaf litter and floating Sargassum colonies. Mar. Chem. 119, 162–171. doi: 10.1016/j.marchem.2010.01.003
Sharpless, C. M., Aeschbacher, M., Page, S. E., Wenk, J., Sander, M., and McNeill, K. (2014). Photooxidation-induced changes in optical, electrochemical, and photochemical properties of humic substances. Environ. Sci. Technol. 48, 2688–2696. doi: 10.1021/es403925g
Sharpless, C. M., and Blough, N. V. (2014). The importance of charge-transfer interactions in determining chromophoric dissolved organic matter (CDOM) optical and photochemical properties. Environ. Sci. Process. Impacts 16, 654–671. doi: 10.1039/c3em00573a
Shibata, T., Hama, Y., Miyasaki, T., Ito, M., and Nakamura, T. (2006). Extracellular secretion of phenolic substances from living brown algae. J. Appl. Phycol. 18, 787–794. doi: 10.1007/s10811-006-9094-y
Siegel, D. A., Maritorena, S., Nelson, N. B., Behrenfeld, M. J., and McClain, C. R. (2005). Colored dissolved organic matter and its influence on the satellite-based characterization of the ocean biosphere. Geophys. Res. Lett. 32, 1–4. doi: 10.1029/2005GL024310
Sleighter, R. L., and Hatcher, P. G. (2008). Molecular characterization of dissolved organic matter (DOM) along a river to ocean transect of the lower Chesapeake Bay by ultrahigh resolution electrospray ionization Fourier transform ion cyclotron resonance mass spectrometry. Mar. Chem. 110, 140–152. doi: 10.1016/j.marchem.2008.04.008
Spencer, R. G. M., Aiken, G. R., Wickland, K. P., Striegl, R. G., and Hernes, P. J. (2008). Seasonal and spatial variability in dissolved organic matter quantity and composition from the Yukon River basin, Alaska. Global Biogeochem. Cycles 22:GB4002. doi: 10.1029/2008GB003231
Spencer, R. G. M., Stubbins, A., Hernes, P. J., Baker, A., Mopper, K., Aufdenkampe, A. K., et al. (2009). Photochemical degradation of dissolved organic matter and dissolved lignin phenols from the Congo River. J. Geophys. Res. 114:G03010. doi: 10.1029/2009JG000968
Stabenau, E. R., Zepp, R. G., Bartels, E., and Zika, R. G. (2004). Role of the seagrass Thalassia testudinum as a source of chromophoric dissolved organic matter in coastal south Florida. Mar. Ecol. Prog. Ser. 282, 59–72. doi: 10.3354/meps282059
Stenson, A. C., Marshall, A. G., and Cooper, W. T. (2003). Exact masses and chemical formulas of individual suwannee river fulvic acids from ultrahigh resolution electrospray ionization fourier transform ion cyclotron resonance mass spectrometry. Anal. Chem. 75, 1275–1284. doi: 10.1021/ac026106p
Stubbins, A., Spencer, R. G. M., Chen, H., Hatcher, P. G., Mopper, K., Hernes, P. J., et al. (2010). Illuminated darkness: molecular signatures of Congo River dissolved organic matter and its photochemical alteration as revealed by ultrahigh precision mass spectrometry. Limnol. Oceanogr. 55, 1467–1477. doi: 10.4319/lo.2010.55.4.1467
Sulzberger, B., and Durisch-Kaiser, E. (2009). Chemical characterization of dissolved organic matter (DOM): a prerequisite for understanding UV-induced changes of DOM absorption properties and bioavailability. Aquat. Sci. 71, 104-126. doi: 10.1007/s00027-008-8082-5
Swan, C. M., Nelson, N. B., Siegel, D. A., and Fields, E. A. (2013). A model for remote estimation of ultraviolet absorption by chromophoric dissolved organic matter based on the global distribution of spectral slope. Remote Sens. Environ. 136, 277–285. doi: 10.1016/j.rse.2013.05.009
Swanson, A. K., and Druehl, L. D. (2002). Induction, exudation and the UV protective role of kelp phlorotannins. Aquat. Bot. 73, 241–253. doi: 10.1016/S0304-3770(02)00035-9
Timko, S. A., Gonsior, M., and Cooper, W. J. (2015). Influence of pH on fluorescent dissolved organic matter photo-degradation. Water Res. 85, 266–274. doi: 10.1016/j.watres.2015.08.047
Tuor, U., Wariishi, H., Gold, M. H., and Schoemaker, H. E. (1992). Oxidation of phenolic arylglycerol β-Aryl ether lignin model compounds by manganese peroxidase from phanerochaete chrysosporium?: oxidative cleavage of an β-Carbonyl model compound. Biochemistry 31, 4986–4995. doi: 10.1021/bi00136a011
van Krevelen, D. W. (1950). Graphical-statistical method for the study of structure and reaction processes of coal. Fuel 29, 269–284. doi: 10.1520/D0850-11.1
Velapoldi, R. A., and Tønnesen, H. H. (2004). Corrected emission spectra and quantum yields for a series of fluorescent compounds in the visible spectral region. J. Fluoresc. 14, 465–472. doi: 10.1023/B:JOFL.0000031828.96368.c1
Wada, S., Aoki, M. N., Tsuchiya, Y., Sato, T., Shinagawa, H., and Hama, T. (2007). Quantitative and qualitative analyses of dissolved organic matter released from Ecklonia cava Kjellman, in Oura Bay, Shimoda, Izu Peninsula, Japan. J. Exp. Mar. Bio. Ecol. 349, 344–358. doi: 10.1016/j.jembe.2007.05.024
Wada, S., Omori, Y., Kayamyo, Y., Tashiro, Y., and Hama, T. (2015). Photoreactivity of dissolved organic matter from macroalgae. Reg. Stud. Mar. Sci. 2, 12–18. doi: 10.1016/j.rsma.2015.08.018
Wang, M., and Hu, C. (2016). Mapping and quantifying Sargassum distribution and coverage in the Central West Atlantic using MODIS observations. Remote Sens. Environ. 183, 350–367. doi: 10.1016/j.rse.2016.04.019
Wang, M., Hu, C., Barnes, B. B., Mitchum, G., Lapointe, B., and Montoya, J. P. (2019). The great Atlantic Sargassum belt. Science 364, 83–87. doi: 10.1126/science.aaw7912
Wang, M., Hu, C., Cannizzaro, J., English, D., Han, X., Naar, D., et al. (2018). Remote Sensing of Sargassum Biomass. Nutrients, and Pigments. Geophys. Res. Lett. 45 12:367. doi: 10.1029/2018GL078858
Wang, W., Johnson, C. G., Takeda, K., and Zafiriou, O. C. (2009). Measuring the photochemical production of carbon dioxide from marine dissolved organic matter by pool isotope exchange. Environ. Sci. Technol. 43, 8604–8609. doi: 10.1021/es901543e
Wünsch, U. J., Murphy, K. R., and Stedmon, C. A. (2016). Fluorescence quantum yields of natural organic matter and organic compounds: implications for the fluorescence-based interpretation of organic matter Composition. Front. Mar. Sci. 3:9. doi: 10.3389/fmars.2016.00009
Xie, H., Zafiriou, O. C., Cai, W.-J., Zepp, R. G., and Wang, Y. (2004). Photooxidation and its effects on the carboxyl content of dissolved organic matter in two coastal rivers in the southeastern United States. Environ. Sci. Technol. 38, 4113–4119. doi: 10.1021/es035407t
Yamashita, Y., and Tanoue, E. (2008). Production of bio-refractory fluorescent dissolved organic matter in the ocean interior. Nat. Geosci. 1, 579–582. doi: 10.1038/ngeo279
Yamashita, Y., Tsukasaki, A., Nishida, T., and Tanoue, E. (2007). Vertical and horizontal distribution of fluorescent dissolved organic matter in the Southern Ocean. Mar. Chem. 106, 498–509. doi: 10.1016/j.marchem.2007.05.004
Zepp, R. G., Erickson, D. J., Paul, N. D., and Sulzberger, B. (2007). Interactive effects of solar UV radiation and climate change on biogeochemical cycling. Photochem. Photobiol. Sci. 6, 286–300. doi: 10.1039/b700021a
Zepp, R. G., Sheldon, W. M., and Moran, M. A. (2004). Dissolved organic fluorophores in southeastern US coastal waters: correction method for eliminating Rayleigh and Raman scattering peaks in excitation–emission matrices. Mar. Chem. 89, 15–36. doi: 10.1016/j.marchem.2004.02.006
Zhang, Y., and Blough, N. V. (2016). Photoproduction of One-Electron Reducing Intermediates by Chromophoric Dissolved Organic Matter (CDOM): relation to O2- and H2O2 Photoproduction and CDOM Photooxidation. Environ. Sci. Technol. 50, 11008–11015. doi: 10.1021/acs.est.6b02919
Keywords: Sargassum, CDOM, optical properties, photochemistry, FT-ICR MS, pH titration, marine DOM
Citation: Powers LC, Del Vecchio R, Blough NV, McDonald N, Schmitt-Kopplin P and Gonsior M (2020) Optical Properties and Photochemical Transformation of the Dissolved Organic Matter Released by Sargassum. Front. Mar. Sci. 7:588287. doi: 10.3389/fmars.2020.588287
Received: 28 July 2020; Accepted: 19 October 2020;
Published: 12 November 2020.
Edited by:
Mario Uchimiya, University of Georgia, United StatesReviewed by:
Meilian Chen, Guangdong Technion-Israel Institute of Technology (GTIIT), ChinaCatherine Clark, Western Washington University, United States
Copyright © 2020 Powers, Del Vecchio, Blough, McDonald, Schmitt-Kopplin and Gonsior. This is an open-access article distributed under the terms of the Creative Commons Attribution License (CC BY). The use, distribution or reproduction in other forums is permitted, provided the original author(s) and the copyright owner(s) are credited and that the original publication in this journal is cited, in accordance with accepted academic practice. No use, distribution or reproduction is permitted which does not comply with these terms.
*Correspondence: Leanne C. Powers, lpowers@umces.edu; leanne.powers@gmail.com