Recent Changes in Deep Ventilation of the Mediterranean Sea; Evidence From Long-Term Transient Tracer Observations
 Pingyang Li
 Toste Tanhua
- Marine Biogeochemistry, GEOMAR Helmholtz Centre for Ocean Research Kiel, Kiel, Germany
The Mediterranean Sea is a small region of the global ocean but with a very active overturning circulation that allows surface perturbations to be transported to the interior ocean. Understanding of ventilation is important for understanding and predicting climate change and its impact on ocean ecosystems. To quantify changes of deep ventilation, we investigated the spatiotemporal variability of transient tracers (i.e., CFC-12 and SF6) observations combined with temporal evolution of hydrographic and oxygen observations in the Mediterranean Sea from 13 cruises conducted during 1987–2018, with emphasize on the update from 2011 to 2018. Spatially, both the Eastern and Western Mediterranean Deep Water (EMDW and WMDW) show a general west-to-east gradient of increasing salinity and potential temperature but decreasing oxygen and transient tracer concentrations. Temporally, stagnant and weak ventilation is found in most areas of the EMDW during the last decade despite the prevailing ventilation in the Adriatic Deep Water between 2011 and 2016, which could be a result of the weakened Adriatic source intensity. The EMDW has been a mixture of the older Southern Aegean Sea dense waters formed during the Eastern Mediterranean Transient (EMT) event, and the more recent ventilated deep-water of the Adriatic origin. In the western Mediterranean basin, we found uplifting of old WMDW being replaced by the new deep-water from the Western Mediterranean Transition (WMT) event and uplifting of the new WMDW toward the Alboran Sea. The temporal variability revealed enhanced ventilation after the WMT event but slightly weakened ventilation after 2016, which could be a result of combined influences from the eastern (for the weakened Adriatic source intensity) and western (for the weakened influence from the WMT event) Mediterranean Sea. Additionally, the Mediterranean Sea is characterized by a Tracer Minimum Zone (TMZ) at mid-depth of the water column attributed to the rapid deep ventilation so that the TMZ is the slowest ventilated layer. This zone of weak ventilation stretches across the whole Mediterranean Sea from the Levantine basin into the western basin.
Introduction
Ocean ventilation is an important process in the Earth system that transports ocean surface properties, such as salinity, heat, CO2 and dissolved gases to the interior ocean (Luyten et al., 1983; Khatiwala et al., 2012). Knowledge of the temporal and spatial variability of ocean ventilation is essential for understanding and predicting the response of the Earth system to global climate change. As a microcosm of the global ocean where climate change can be observed on a shorter time-scale (Schroeder et al., 2016), the Mediterranean Sea (Figure 1a) is well ventilated but with highly variable ventilation patterns in both time and space. Such ventilation patterns can directly be illustrated by, for instance, long-term observations of transient tracers. Transient tracers are taken up by the ocean at the air-sea interface and transferred into the deep ocean by the Deep/Dense Water Formation (DWF) through convection or subduction processes. There are four main DWF areas in the Mediterranean Sea: the Adriatic Sea, Southern Aegean Sea (Cretan Sea) and the Rhodes Gyre in the eastern Mediterranean basin (EMed), and the Gulf of Lions in the western Mediterranean basin (WMed). The deep water exchanges between the two basins are limited by the Strait of Sicily, which leads to a relative independent deep water circulation in each basin.
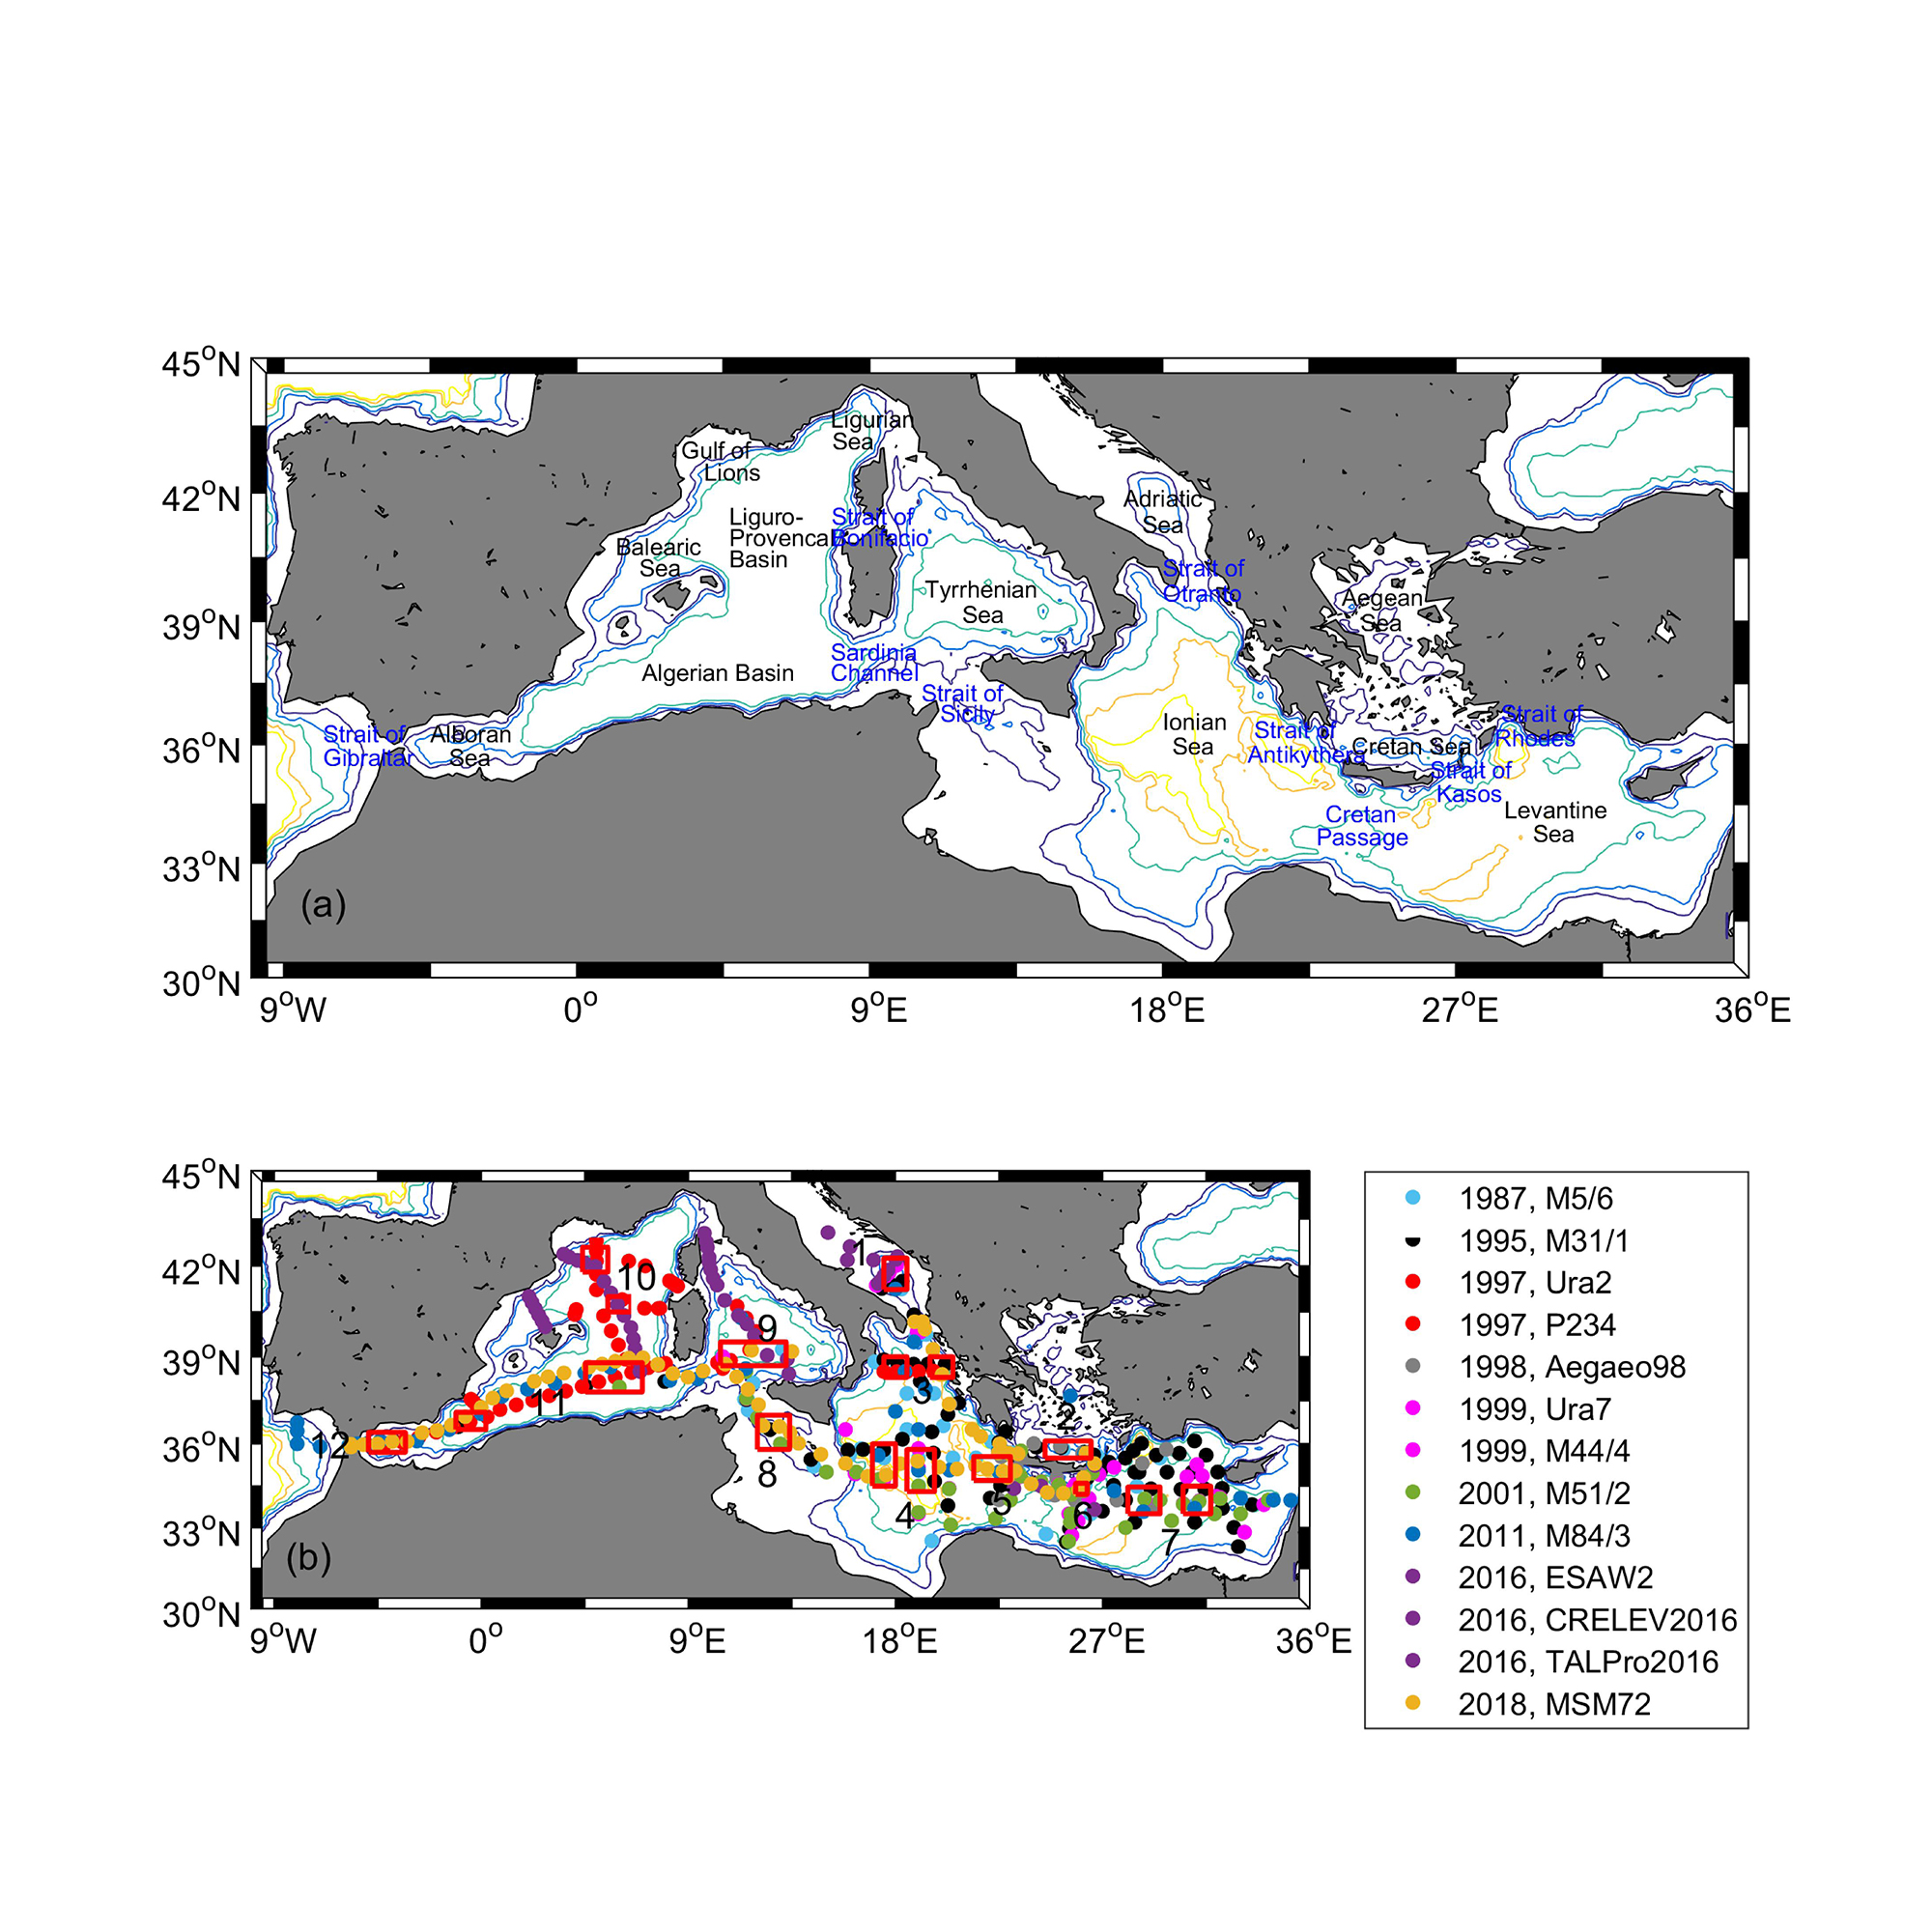
Figure 1. (a) Map of the Mediterranean Sea. (b) Sampling sites of CFC-12 and SF6 measurements from historical cruises listed in Table 1 in the Mediterranean Sea; samples from a certain year (rather than cruise) have the same color, which is also used in the figures below. The small red boxes are the areas selected for assessing the temporal variability of ventilation. The areas are located in the (1) Southern Adriatic Sea, (2) Cretan Sea, (3) Northern Ionian Sea, (4) Western and Central Ionian Sea, (5) Eastern Ionian Sea, (6) Northern Cretan Passage, (7) Western and Central Levantine basins, (8) Strait of Sicily, (9) Tyrrhenian Sea, (10) Gulf of Lions and Liguro-Provençal basin, (11) Central and Western Algerian basin and (12) Alboran Sea. The depth contours are 500, 1000, 2000, 3000, and 3500 m.
In the EMed, the Adriatic Sea used to be the main DWF region prior to the late 1980s (Roether et al., 1996). Interactions between Levantine Intermediate Water (LIW) and water masses from the Northern Adriatic Sea preconditioned the ocean to vertical mixing under the action of winter heat loss and wind stress (Artegiani et al., 1996a, b), creating high salinity dense waters by winter cooling, and leading to the formation of the Adriatic Deep Water (AdDW). After deep convection, the AdDW flowed over the Strait of Otranto sill into the Ionian Sea and then spreads southward and eastward to form the Eastern Mediterranean Deep Water (EMDW). However, the formation of the AdDW was in the “stagnation phase” from 1987 to 1999 (Manca et al., 2002; Roether et al., 2007). In the early 1990s, the Eastern Mediterranean Transient (EMT) event took place. The event marked a shift in dominant deep water source from the Adriatic Sea to the Aegean Sea characterized by massive DWF (Roether et al., 1996; Klein et al., 1999) triggered by the heat loss from the extremely cold winter in 1992–1993 (Roether et al., 2007) and high salinity (Velaoras et al., 2017). The estimated DWF rate in the Aegean Sea for the period 1989–1995 was three times higher than that of the Adriatic Sea (Lascaratos et al., 1999). Very dense water from the Aegean Sea filled the EMed and blocked the intrusion of the Adriatic-originated water into the Levantine basin (Akpinar et al., 2016). The Aegean-originated water dominated in the Levantine Sea in the 1990s also by shading the DWF in the Rhodes Cyclonic Gyre area (Malanotte-Rizzoli and Hecht, 1988). However, in 1999, the water from the Aegean source was not dense enough to reach the bottom of the adjacent Ionian and Levantine basins but was ventilating the 1500–2500 m layer (Theocharis et al., 2002). In the 2000s, the Aegean source was still characterized by dense water outflow but weakening (Velaoras et al., 2014). A reversal of the dominant source for the DWF in the EMed took place between 1999 and 2002 when the Adriatic deep water formation restarted, and the Adriatic Sea returned to be again the major source region in the EMed (Klein et al., 2000; Hainbucher et al., 2006; Rubino and Hainbucher, 2007; Cardin et al., 2015). In 2012, the extremely cold winter triggered another strong deep water formation in the Adriatic Sea (Gačić et al., 2014).
In the WMed, the Western Mediterranean Deep Water (WMDW) forms in the northwestern Mediterranean, mainly in the Gulf of Lions. Open-ocean deep convection, combined with occasional dense shelf water cascading, is the major contributor to the thermohaline circulation and ventilation in the source regions (Durrieu de Madron et al., 2013; Houpert et al., 2016; Testor et al., 2018). In addition, the EMT event has influenced the DWF processes in the Gulf of Lions in winter (Schroeder et al., 2006). Extensive DWF started from 2004 to 2006 and is known as the Western Mediterranean Transition (WMT) event (Schroeder et al., 2008, 2010). The event is thought to be triggered mainly by the atmospheric forcing in the WMed and the lateral advection of anomalously salty and warm LIW because of increased heating and evaporation in the EMed (Marshall and Schott, 1999; Schroeder et al., 2010, 2016). The WMT event caused the structure of intermediate and deep layers to abruptly change in the WMed and a near-complete renewal of WMDW (Schneider et al., 2014). Since then, the deep convection intensity in the source region decreased based on long-term surveys in the Gulf of Lions (Houpert et al., 2016).
In the Tyrrhenian Sea, the situation is a little bit different. Beneath the LIW, the transitional EMDW (tEMDW, a mixture of LIW and EMDW from the EMed) mixes with the water in the Tyrrhenian Sea and settles between 600 and 1500 m (Sparnocchia et al., 1999). Below the tEMDW, WMDW enters the Tyrrhenian Sea (Schroeder et al., 2016). The mixture of tEMDW and WMDW forms the Tyrrhenian Deep Water (TDW) with a core depth deeper than 1500 m (Astraldi et al., 2002; Buffett et al., 2017).
As the area separating the EMed and WMed, the Strait of Sicily is composed of the surface Modified Atlantic Water (MAW) flowing eastward, the lower LIW and bottom tEMDW flowing westward (Astraldi et al., 1996, 2002; Sparnocchia et al., 1999).
Transient tracers have been used to understand ventilation and circulation processes, and determine water mass characteristics in the Mediterranean Sea in multiple studies. For example, the vertical and spatial distributions of transient tracers have been described in the EMed by Roether et al. (1996) and in the WMed by Rhein et al. (1999) to quantify ventilation timescales. They have also been used to identify the water mass structure and distribution by combined analysis of hydrographic properties such as salinity and temperature (Theocharis et al., 2002; Cardin et al., 2015), as well as some biogeochemical properties such as dissolved oxygen, silicate and nitrate (Klein et al., 1999, 2000). In addition, transient tracers have been used to estimate the anthropogenic carbon content of the water (Schneider et al., 2010) by applying the Transit Time Distribution (TTD) concept (Waugh et al., 2003; Stöven and Tanhua, 2014). Therefore, a combination of transient tracers (CFC-12, SF6, etc.), hydrographic properties (salinity, temperature, density, etc.) and oxygen can characterize ventilation processes on the basis of the water mass distributions. Previously, Schneider et al. (2014) discussed the temporal variability of ventilation in the Mediterranean Sea for the timeframe 1987–2011. The authors studied well-defined boxes in each basin and discussed the averaged vertical profiles of salinity, temperature, oxygen, CFC-12 concentration, CFC-12 tracer age, CFC-12 mean age, tritium/helium age and tritium mean age. In the study by Schneider et al. (2014), they carried out a comparison of averaged profiles from different years within relatively large boxes, whereas, in this study, we compare profiles in specific sampling stations in overlaid or close vicinity to each other (in small boxes). For this approach, there is a risk that small-scale variability, such as eddies, will bias the comparison, whereas for large boxes real variability within the box can bias the comparison.
The primary goal of this study is to investigate the temporal and spatial variability (with an emphasis on the recent changes) in deep and intermediate ventilation of the Mediterranean Sea based on transient tracer (CFC-12 and SF6) observations. To the end, we address the spatiotemporal distributions of transient tracer (CFC-12 and SF6) concentrations as well as the temporal evolution of potential temperature-salinity (Θ–S) diagrams and depth-profiles of CFC-12 and SF6 concentrations, salinity, potential temperature, potential density and apparent oxygen utilization in pressure (CFC-12/SF6/S/Θ/σΘ/AOU vs. P) between 1987 and 2018.
Observations and Methods
Observations From Cruises
Table 1 lists the cruises used in this work from which we have transient tracer observations. Most of the recent cruises were conducted in the framework of the Med-SHIP program (Schroeder et al., 2015). Sampling sites for each cruise are shown in Figure 1b. Seawater samples for CFC-12 and SF6 were measured either on board from syringe sampling or ashore from flame-sealed glass ampoules. For cruises in 1987–2001, CFC-12 and CFC-11 were observed, although we focus on the CFC-12 observations due to no recent CFC-11 observations, whereas for cruises in 2011–2018 both CFC-12 and SF6 data are considered. For cruise P234 in 1997, analytical issues for CFC-12 were reported by the authors (Rhein et al., 1999), in particular for the later part of the cruise (station number larger than 766), although such CFC-12 data were flagged as good (i.e., “2” or “6”) from the database. Therefore, we reported the CFC-11 data in addition to the CFC-12 observations (except for the Tyrrhenian Sea where we can only use the CFC-11 values). To make the CFC-11 data comparable, we multiplied the CFC-11 partial pressures with 2.03, which is the ratio of CFC-12 and CFC-11 atmospheric mole fraction in 1997. Since the atmospheric temporal evolutions of the two tracers are similar up to about 1990, this is a reasonable proxy for estimating trends in ventilation, as can be seen from figures for the WMed in section “Temporal Variability of Properties in the WMed,” although not perfect. More details on measurement methods, precisions and accuracies for the observations can be found from the correspondence references and/or cruise reports (Table 1). The observations of CFC-12 and SF6 from four cruises during the years 2016–2018 are reported here for the first time. The measurement methods can refer to the corresponding cruise reports and/or Stöven and Tanhua (2014).
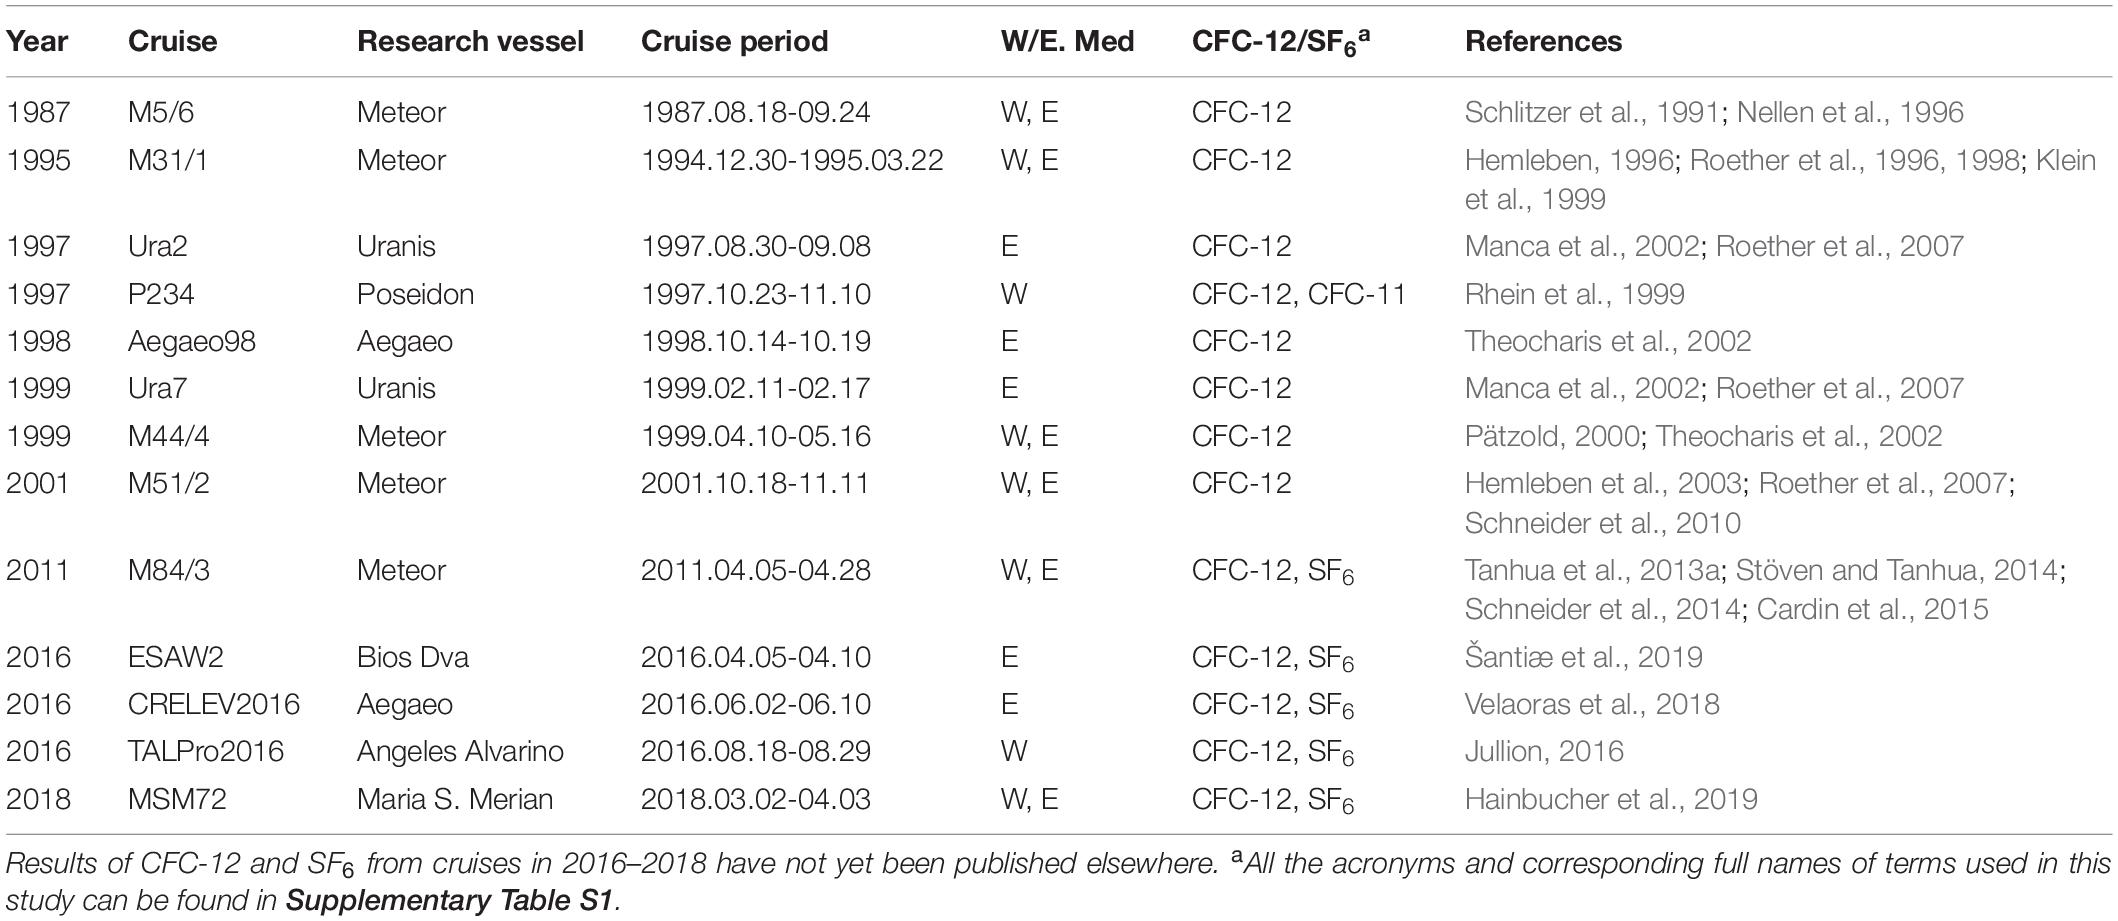
Table 1. Key meta-data for the Mediterranean Sea cruises used in this study.
Methods for Assessing Spatiotemporal Variability
The Transit Time Distribution (TTD) model describes the propagation of tracer boundary conditions from the ocean surface into the interior based on the Green’s function (Hall and Plumb, 1994) and is often used to assess ventilation time-scales. However, the ventilation of the Mediterranean Sea is time-variant, making it difficult to apply the TTD concept. Therefore, in this study, we used (CFC-12 and SF6) concentrations (in ppt, part per trillions) to assess the historical evolution of ventilation and involved hydrography data to support conclusions of variability in ventilation patterns. The equilibrium concentrations (in ppt rather than in pmol kg−1) of the transient trace gases into the seawater are chosen so that their dependence on the salinity and temperature are removed.
We are also using Apparent Oxygen Utilization (AOU) as a measure of ventilation. We use AOU rather than oxygen since the dependencies of S and Θ on oxygen saturation is already factored into the concept, which is similar to the case for concentrations of CFC-12 and SF6 in ppt rather than in pmol kg−1. The AOU is different from the transient tracers in that the input function is constant so that a change in AOU can be directly related to a change in ventilation, or oxygen consumption rate.
We start by discussing the spatiotemporal distribution of ventilation in the Mediterranean Sea by analyzing CFC-12 and SF6 concentration sections at roughly the same locations in the EMed and WMed separately. As a second step, we consider the temporal variability of ventilation by comparing the structures of potential temperature and salinity (Θ–S diagrams), as well as depth-profiles of transient tracer concentrations (CFC-12 and SF6), salinity (S), potential temperature (Θ in°C), potential density (σΘ in kg m–3 referenced to 0 dbar pressure) and apparent oxygen utilization (AOU in μmol kg–1) for stations within each box in Figure 1b.
Tracer Age Difference
The age of a water parcel is defined as the time elapsed since it left the mixed layer where it was in contact with the atmosphere before transported into the ocean interior. The concept of tracer age does not consider turbulent mixing in the ocean interior, which is unrealistic but it provides a framework to compare the ventilation time-scale at one location over time. The atmospheric temporal evolutions of CFC-12 and SF6 overlay when the atmospheric records of SF6 are shifted back by 14 years (Tanhua et al., 2013b). Therefore, the tracer age estimated by SF6 should equal to that by CFC-12 based on measurements of CFC-12 taken 14 years earlier in the same region in a steady-state situation, independent of mixing patterns. Inspired by this, Schneider et al. (2014) compared the tracer ages estimated by SF6 in 2011 and CFC-12 in 1997/98. However, as seen from the vertical dash line in Supplementary Figure S1, the (shifted) atmospheric records of CFC-12 and SF6 started to diverge after 2005, which means that the time shift of 14 years doesn’t work well for the two tracers after this time. In other words, comparison of tracer age between SF6 and CFC-12 with a time gap of 14 years still works for deep and intermediate waters outside of convective areas, but not so well for more recently ventilated waters.
For this study, we were able to find locations where CFC-12 and SF6 were measured in 2001 and 2016, respectively, in the northern Cretan Passage and the Tyrrhenian Sea. The averaged tracer ages were calculated by first interpolating the individual profiles to standard depths and then by taking the arithmetic mean of the interpolated profiles (Tanhua et al., 2010). The bias created by the changing growth rate of SF6 from 2015 (time shift of 14 years) and 2016 is expected to be small (the standard deviation is 0.35%) based on the linear increasing atmospheric mole fraction of SF6 (Supplementary Figure S1).
Results
Spatial Distributions of CFC-12 and SF6 in the EMed
We show vertical sections of CFC-12 concentrations for 1987, 1995, 1999, 2001, 2011, and 2018, and SF6 concentrations for 2011 and 2018 to illustrate the spatial evolution of tracer distributions during the last ∼30 years in the Eastern Mediterranean Sea (Figure 2). For more detailed discussions on individual datasets, we refer the reader to previous studies shown in Table 1. In the following, we describe the observations in relation to the temporal evolution.
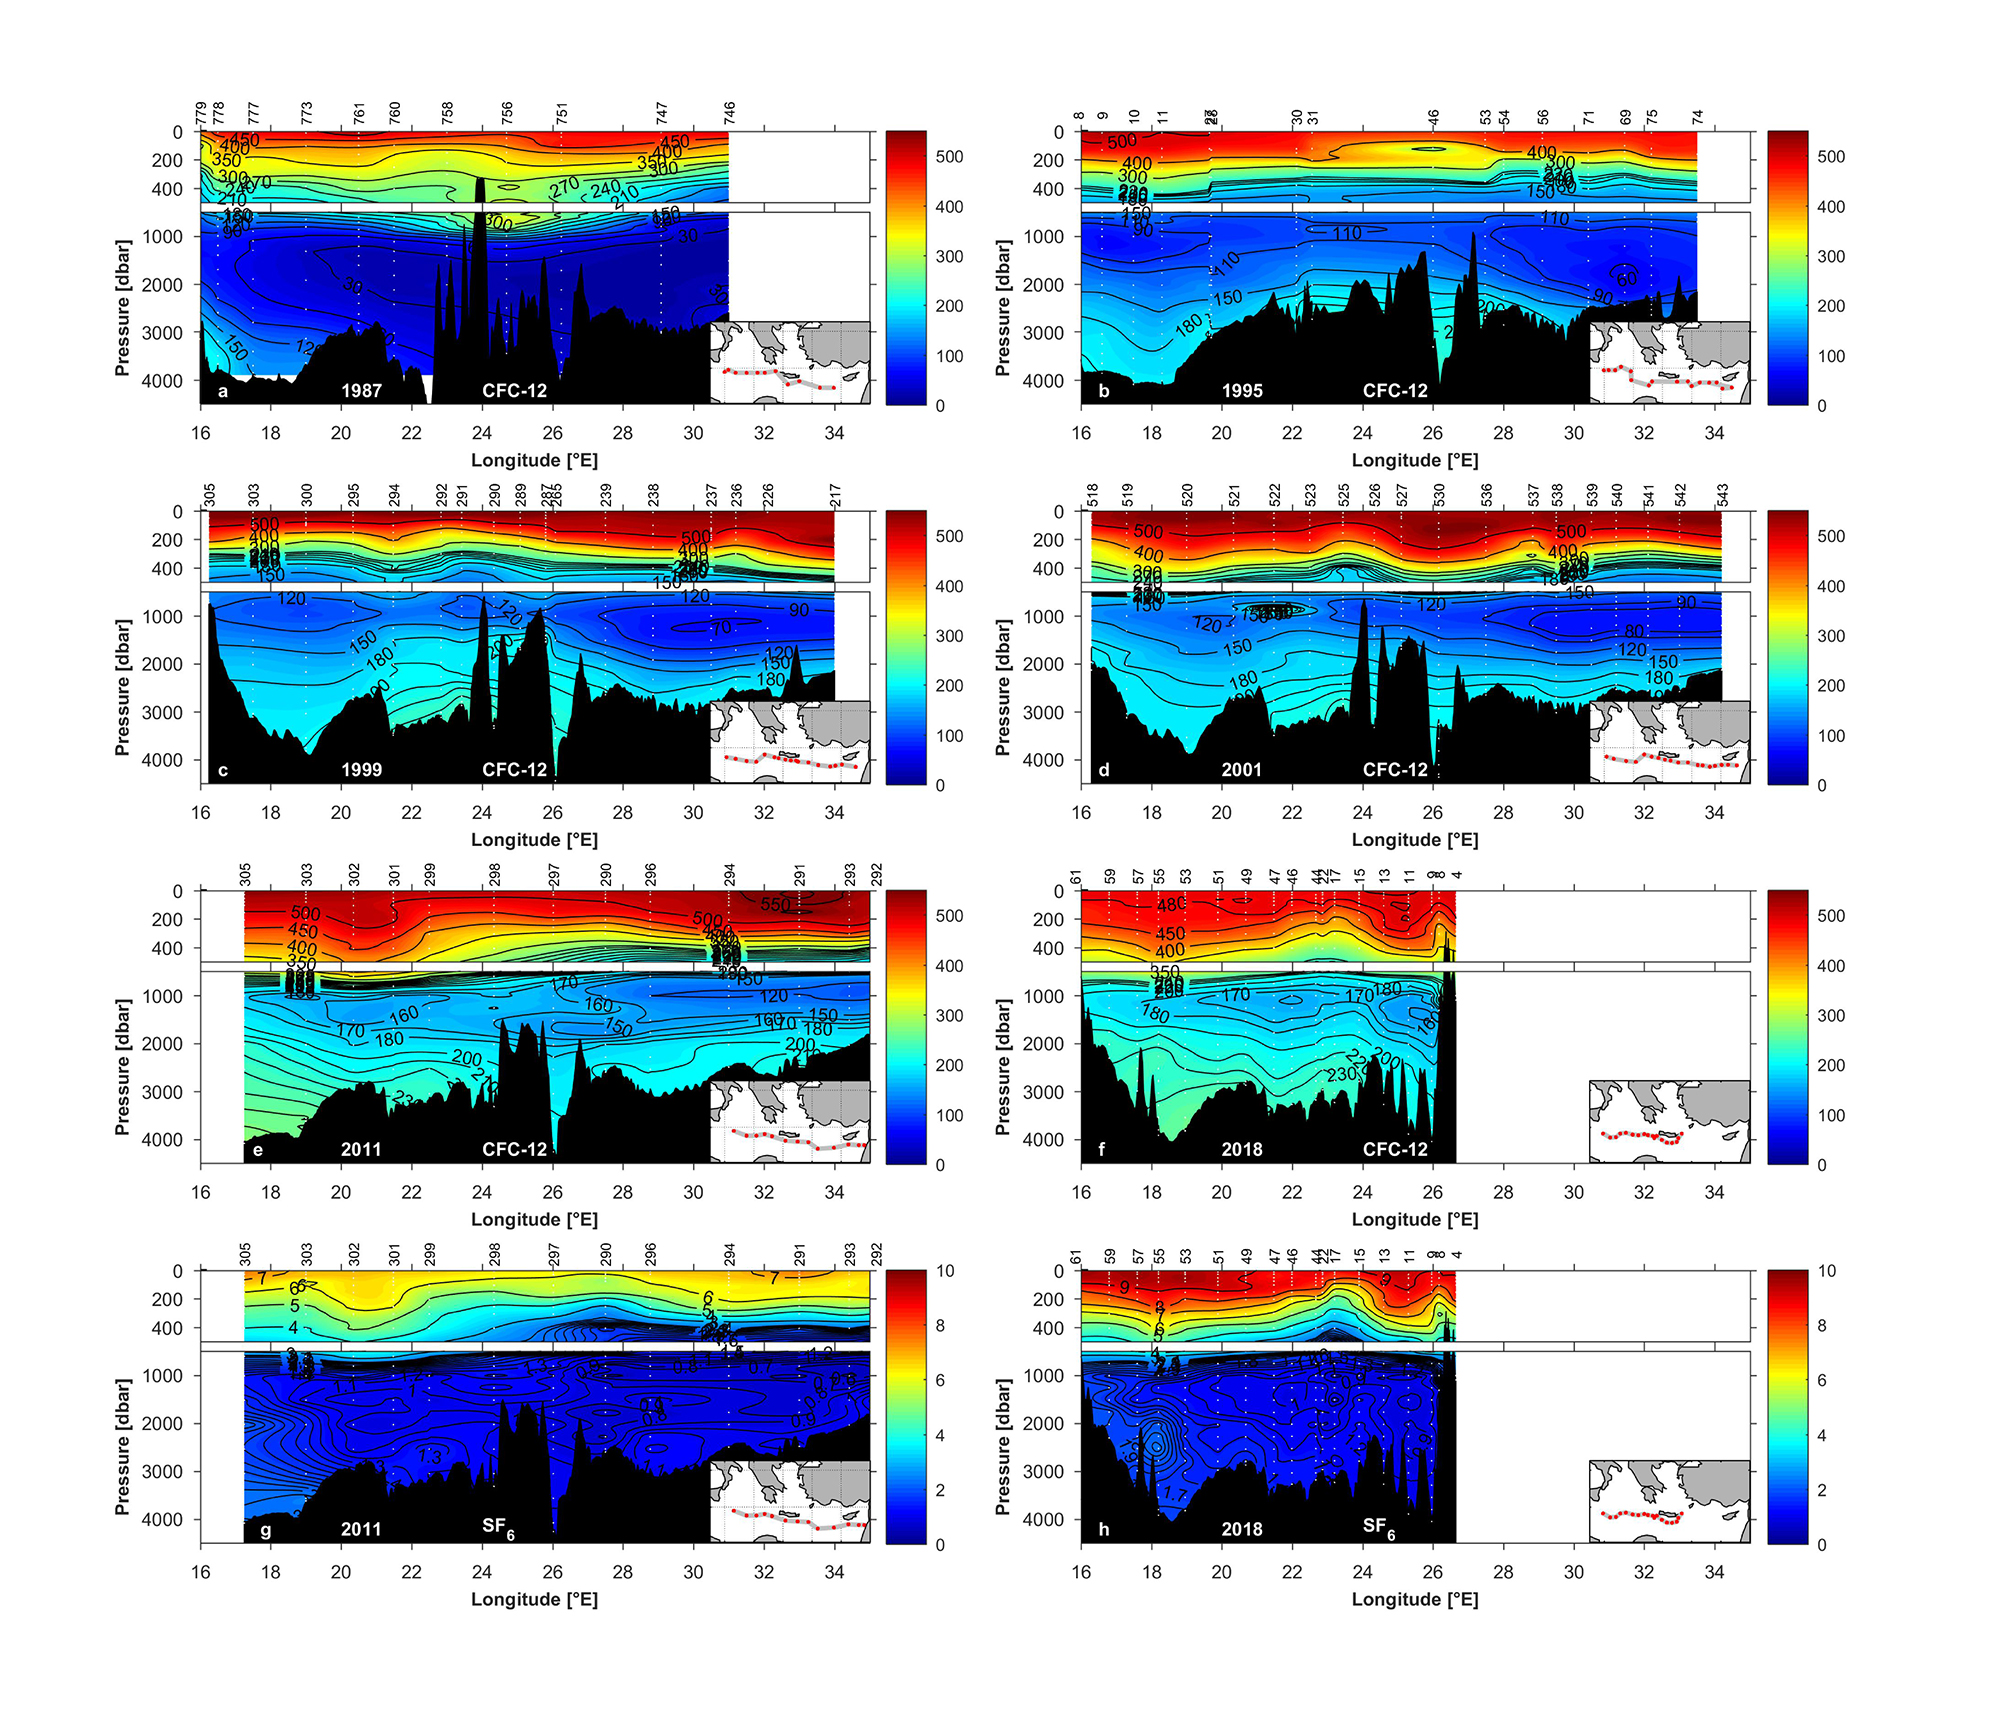
Figure 2. Vertical sections of CFC-12 concentration (in ppt) in the Eastern Mediterranean Sea (see inset map for station locations) in (a) 1987 (Meteor M5/6), (b) 1995 (Meteor M31/1), (c) 1999 (Meteor M44/4), (d) 2001 (Meteor M51/2), (e) 2011 (Meteor M84/3), and (f) 2018 (Maria S. Merian MSM72) and vertical sections of SF6 concentration (in ppt) in the EMed in (g) 2011 (Meteor M84/3) and (h) 2018 (Maria S. Merian MSM72). The same scales of longitude and pressure are used for all figures, while the same color bars are separately used for CFC-12 and SF6 sections. The upper panels highlight the top 500 m. The markers on the top x-axis stand for the station number.
1987
This data set represents the only pre-EMT transient tracer observation for the Mediterranean Sea (Figure 2a). The high CFC-12 concentration of EMDW in the western Ionian Sea is a signal of recently formed deep water from the Adriatic Sea, with gradually decreasing CFC-12 concentrations eastward in the EMDW. The layer with the oldest water and CFC-12 concentrations less than ∼30 ppt marks the Tracer Minimum Zone (TMZ) at the depth of 1200–2800 m. This zone stretches from the Ionian Sea to the central Levantine basin where it reached close to the bottom. The low CFC-12 concentrations indicate an absence of direct ventilation for the depth ranges of the deep and intermediate layers in the east. An area of elevated CFC-12 concentration water was centered at ∼700 m depth in the northern Cretan Passage originated from the Aegean Sea, which implies that newly ventilated Cretan Intermediate Water (CIW) spread into the water below the LIW in the western Levantine basin and the Ionian Sea (Schlitzer et al., 1991). Thus, the EMDW below 1200 m depth was mainly fed by the Adriatic-originated water and the intermediate layer between 200 and 1200 m fed by CIW and LIW in 1987.
1995
The Meteor cruise in 1995 presents the first comprehensive transient tracer observations after the EMT event (Figure 2b) conducted in the framework of the POEM (Physical Oceanography in the Eastern Mediterranean) project (Malanotte-Rizzoli and Robinson, 1988). The CFC-12 concentrations in 1995 are dramatically different from those in 1987. The youngest water below ∼500 m was found in the northern Cretan Passage bottom water with a CFC-12 concentration of ∼220 ppt, a signal of very strong ventilation since 1987. The EMDW related to the Adriatic-derived water was still found in the western part of the section, with a CFC-12 concentration of ∼200 ppt, higher than that in 1987. The CFC-12 concentration in the oldest water (the TMZ) became younger and the TMZ split into two main cores: the western and eastern cores with CFC-12 concentrations of ∼90 and 60 ppt, respectively. The CFC-12 concentration in the TMZ thus increased significantly from 1987 to 1995. The TMZ in 1995 had a narrower depth range and was centered at a shallower depth, which has been interpreted as uplifted bottom waters by intruding Cretan Deep Water (CDW) (Roether et al., 1996). Noting that the oldest water in 1987 was replaced with the younger water, which indicates the strong renewal of water in the EMed in the early 1990s, as reported in previous studies (Roether et al., 1996; Theocharis et al., 2002; Roether et al., 2007).
1999 and 2001
The double core TMZs still existed at the time, but with some changes. In the Ionian Sea, the CFC-12 concentration increased from ∼90 ppt in 1995 to ∼120 ppt in 1999/2001 (Figures 2c,d). There is also a tendency for the TMZ to displace from the western to the eastern Ionian Sea. In the Levantine basin, the CFC-12 concentrations in the TMZ increased to ∼70/80 ppt in 1999/2001 and shoaled from ∼2000 to ∼1000 m. This was accompanied by a diminished thickness of the TMZ in 1999/2001 as the recently formed EMDW from the EMT event advected eastwards along with the deeper layers of the Levantine basin. On the other hand, there is a more obvious signal of high transient tracer concentration on the western slope in 2001 than in 1999, which may suggest an Adriatic source of deep water.
2011
The spatial distribution of CFC-12 concentrations in 2011 (Figure 2e) was quite different from the one in 2001. The new Adriatic-derived water is observed in the bottom water of the western Ionian Sea in 2011 with a CFC-12 concentration of ∼270 ppt and an SF6 concentration of ∼2.4 ppt (Figure 2g). The TMZs still existed at roughly the same depth (∼1000 m) as in 2001, but with significantly higher CFC-12 concentrations: ∼160 ppt in the eastern Ionian Sea and ∼120 ppt in the Levantine basin. However, the TMZ as defined by the SF6 concentrations is better defined with ∼0.6 ppt in the Levantine basin at slightly larger depth, reflecting the different input functions of the two tracers; SF6 being more sensitive to more recent changes in ventilation.
2018
Although the 2018 cruise was unable to sample the Levantine basin, there is evidence that the extent of the Adriatic-derived water in the EMDW in the western Ionian Sea expanded eastward and upward from 2011 to 2018 (Figure 2f). The spatial distribution of SF6 concentrations in 2018 was generally similar to that of CFC-12 above 500 m, but with significant differences below this depth (Figure 2h). Focusing on the Ionian Sea and the northern Cretan Passage, the CFC-12 concentrations of the two cores of the TMZ in 2018 are ∼150 ppt in the northern Cretan Passage and ∼170 ppt in the eastern Ionian Sea, slightly higher than those in 2011. But for SF6, two cores are found with ∼0.9 ppt in the north-western and north-eastern Cretan Passage, which are slightly lower than those in 2011. The double-core TMZ was more clearly observed in 2018 compared to 2011; possibly associated with well-ventilated flow through the Antikythera strait as the transient tracer profiles just west of the strait (in 2018) show enhanced concentrations at intermediate levels down to 1200 m depth. The oldest water was found at ∼1500 m and 1000–3000 m in the northern Cretan Passage defined by CFC-12 and SF6, respectively in both 2011 and 2018. The transient tracer concentrations in the deep western Ionian Sea decreased from ∼270 to 240 ppt for CFC-12 and from ∼2.4 to 1.9 ppt for SF6 from 2011 to 2018, implying the weakening influence from the Adriatic Sea. The relative higher SF6 concentrations shown in the deep layer but not in the bottom layer suggest that the water from the Adriatic source was no longer dense enough between 2011 and 2018 to reach the bottom of the Ionian Sea but ventilated the 2000–3000 m depth layer. A larger difference in the spatial distribution of CFC-12 and SF6 concentrations took place in 2018 compared to 2011. This resulted from the weakened ability of CFC-12 in interpreting ventilation in the Mediterranean Sea considering its decreasing atmospheric history.
Temporal Variability of Properties in the EMed
Adriatic Sea
We have a time-series of properties from 1987 to 2016 in the Adriatic Sea (Figure 3 and Supplementary Figure S2). The time-series show nearly identical CFC-12 concentrations in the deep-water layer (below 600 m) dominated by AdDW from 1987 to 1999, while there is a sharp increase in the CFC-12 concentration of ∼140 ppt from 1999 to 2011 and another increase of ∼100 ppt from 2011 and 2016. A similar increase during 2011–2016 is also found for the SF6 concentration in the magnitude of ∼2 ppt. For other properties in the deep layer, the salinity (S) and potential temperature (Θ) slightly decreased from 1987 to 1995, and then increased up to 2016, with a rapid increase in salinity of ∼0.1 and Θ of ∼0.3°C between 1999 and 2011. The high near-bottom salinities in 2011 are seen through the whole deep layer in 2016. The potential density (σΘ) generally decreased from 1987 to 1999 and increased to 2011 followed by a decrease to 2016 in the near-bottom layer, following mainly compensating trends in S and Θ. There is a weak and variable trend for apparent oxygen utilization (AOU) to increase between 1987 and 2016. Compared to the largely increased salinity and Θ (∼0.15 and ∼0.5°C) from 1995 to 2011/16, similar AOU values are found in 1995, 2011, and 2016 in the near-bottom layer. All these changes support strong ventilation in the Adriatic Sea during the last 15–20 years (1999–2016) with the formation of new AdDW with higher S and Θ.
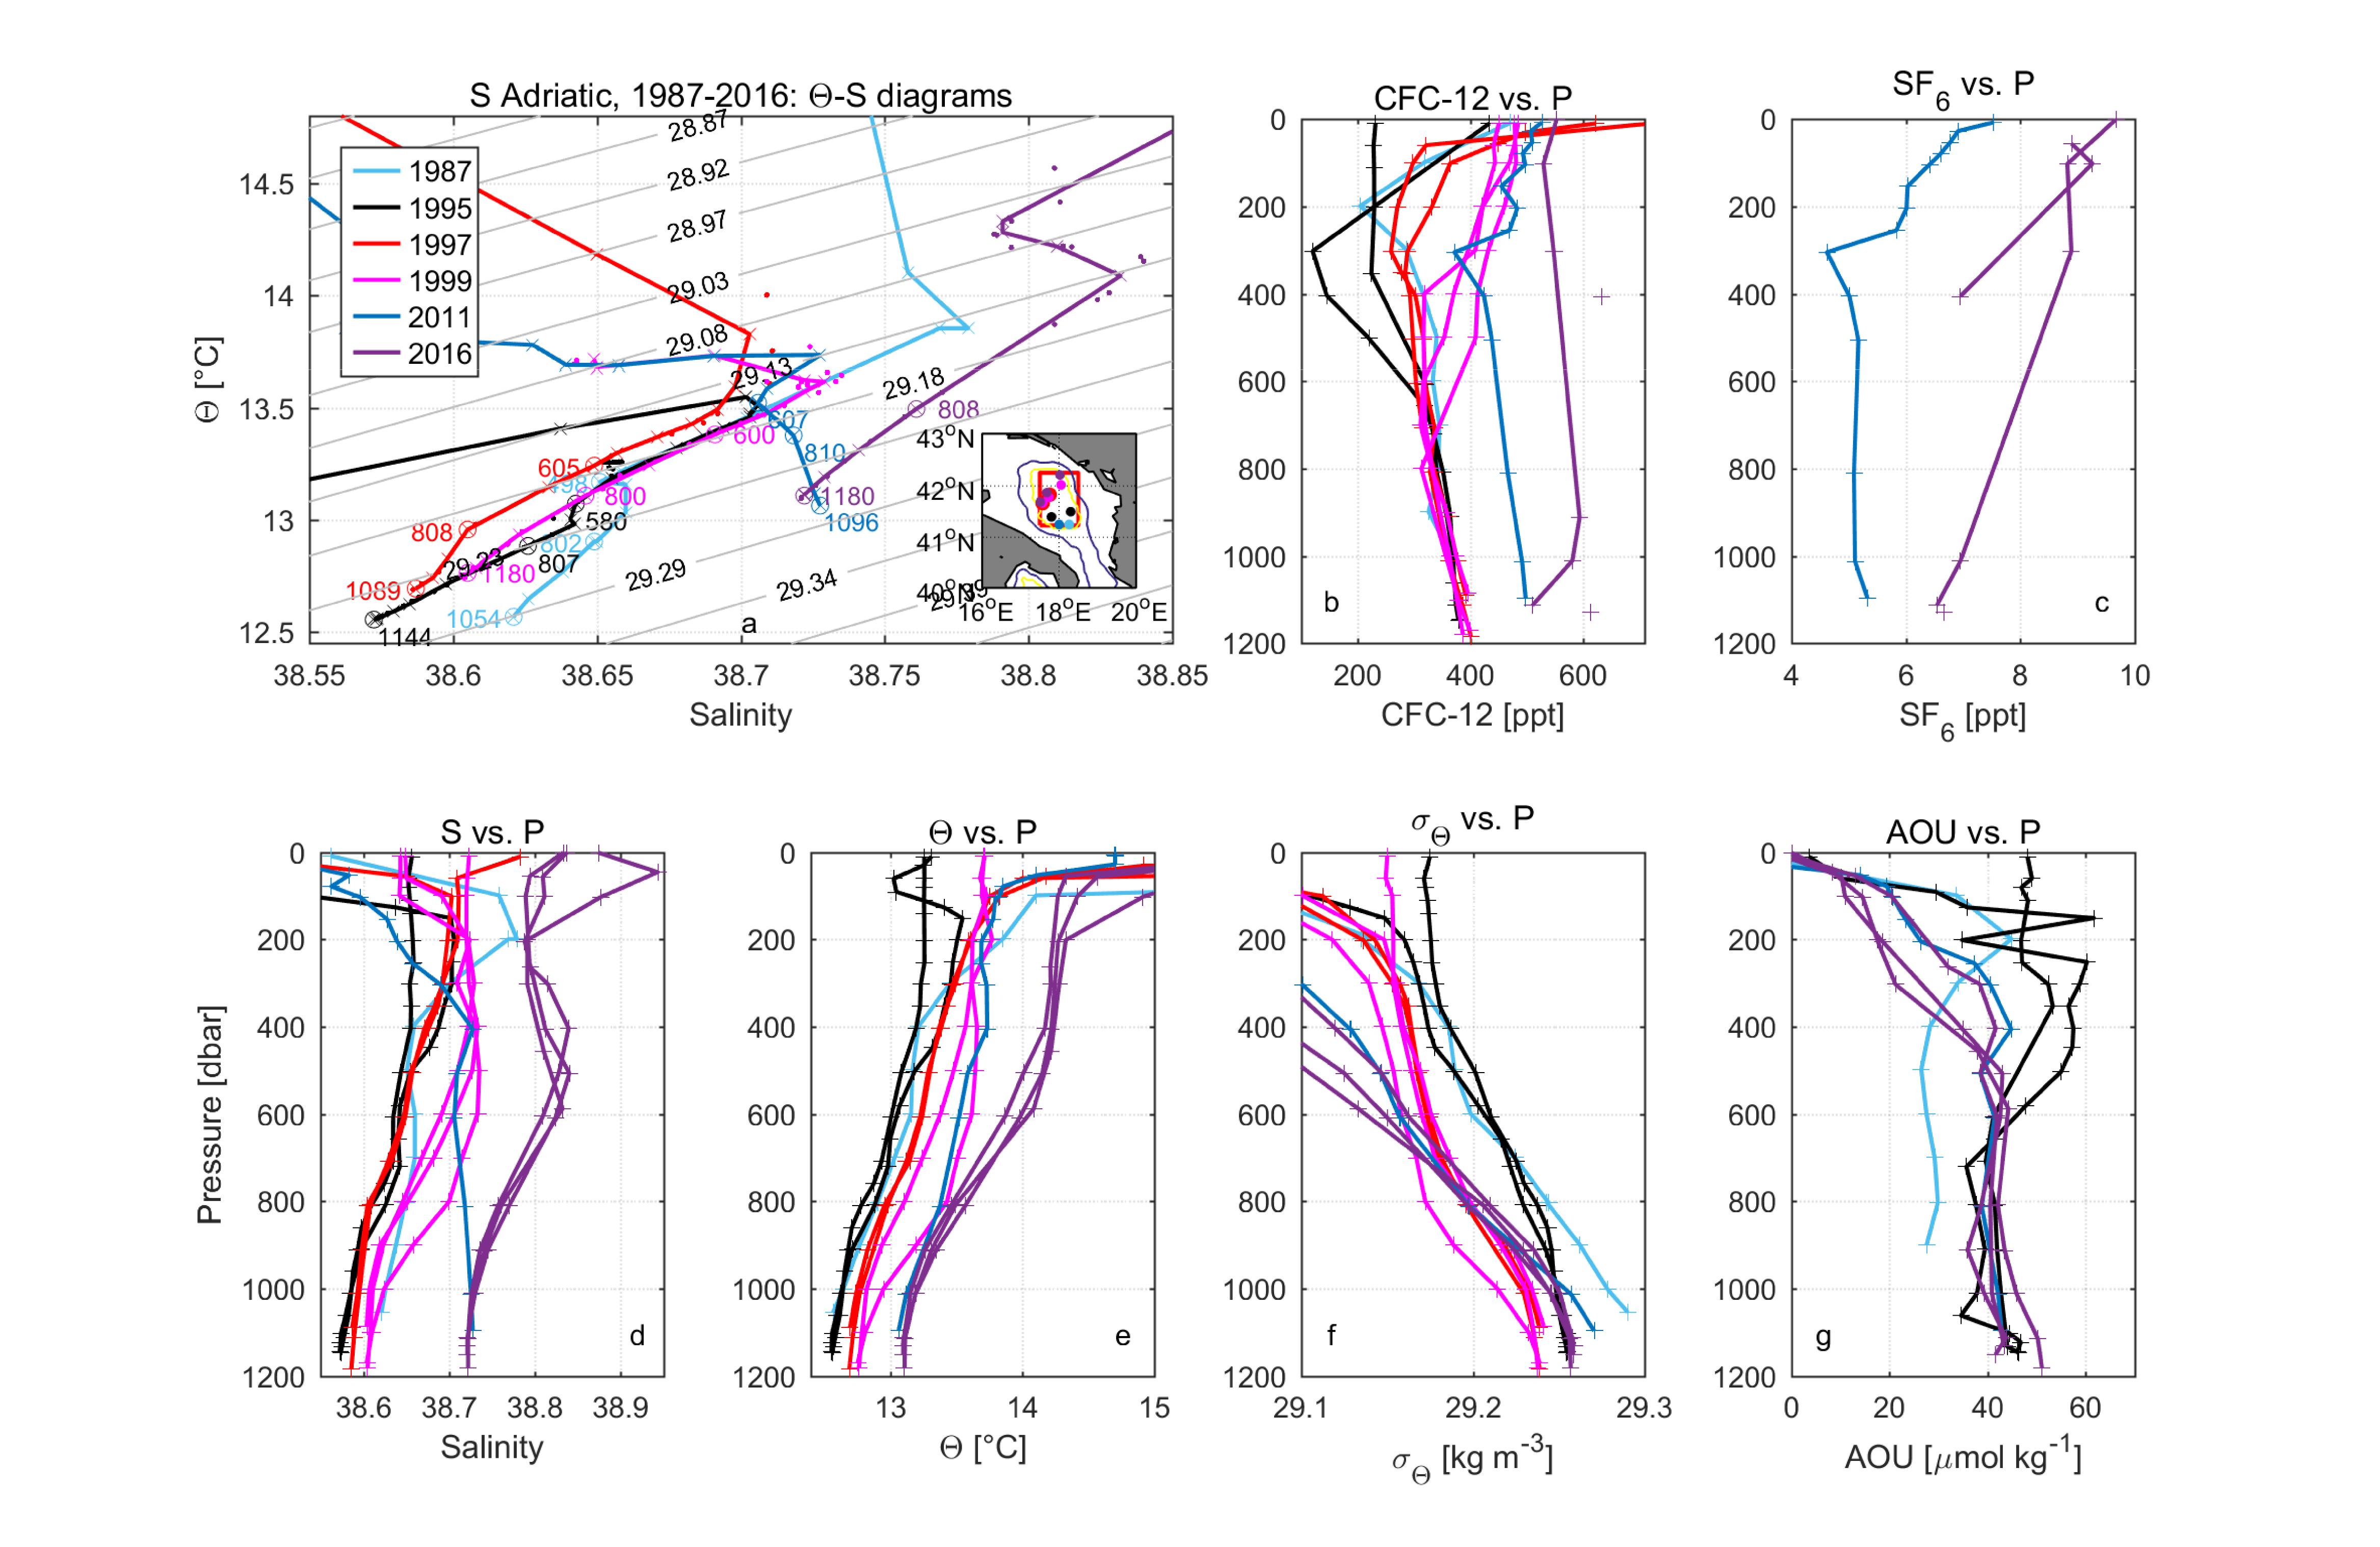
Figure 3. Temporal variability of the Southern Adriatic Sea illustrated with (a) Θ–S diagrams with σΘ isolines, (b) CFC-12 concentration vs. pressure, (c) SF6 concentration vs. pressure, (d) salinity vs. pressure, (e) potential temperature (Θ) vs. pressure, (f) potential density (σΘ) vs. pressure and (g) apparent oxygen utilization (AOU) vs. pressure. For sampling year see the legend and for site positions see inset map (isolines are 500, 1000, 2000, 3000, and 3500 m). The stations shown are (in the sequence of the legend) M5/6 766, M31/1 16 and 17, Ura2 18 and 11, Ura7 8, 7 and 5, M84/3 313 and ESAW2 29, 8 and 7. Bottle data is indicated by crosses (for the first station from each cruise) and dots (for the rest stations from each cruise) in Θ–S diagrams and pluses in other plots (for all stations from each cruise).
The Adriatic intermediate water (Supplementary Figure S2) showed decreased CFC-12 concentrations and increased AOU from 1987 to 1995, which highlights slow ventilation of the less saline and colder water in 1995. Opposite to this period, the increase in CFC-12 concentrations and decrease in AOU after 1995 indicate enhanced ventilation of the generally more saline and warmer water, except for the decreased salinity from 1999 to 2011.
Cretan Sea
Figure 4 and Supplementary Figure S3 shows that CFC-12 concentrations, salinity, Θ and σΘ in the Cretan Sea are relatively higher than those in other areas in the Mediterranean Sea. In the deep-water layer (below ∼1300 m), largely increased salinity, σΘ and CFC-12 concentrations (∼60 ppt) between 1987 and 1995 are in agreement with the period of enhanced ventilation related to the EMT event, when compared with the nearly unchanged CFC-12 concentrations in the AdDW (Figure 3) for the same period. From 1995, the Aegean deep-water source was getting weaker as indicated by the gradually decreased salinity, σΘ and oxygen (increased AOU) in the Cretan Deep Water (CDW) from 1995 to 2018 (Figure 4). Although with weakened Aegean source intensity, the CDW was still ventilated until 2011 as indicated by the increased CFC-12 concentrations from 1998 (Figure 4b). The weakened ventilation after 2011 can be seen by the increased AOU and the fact that CFC-12 concentrations in 2018 are slightly lower than those in 2011, although SF6 concentrations show the opposite change, related to decreasing CFC-12 and increasing SF6 atmospheric mole fractions.
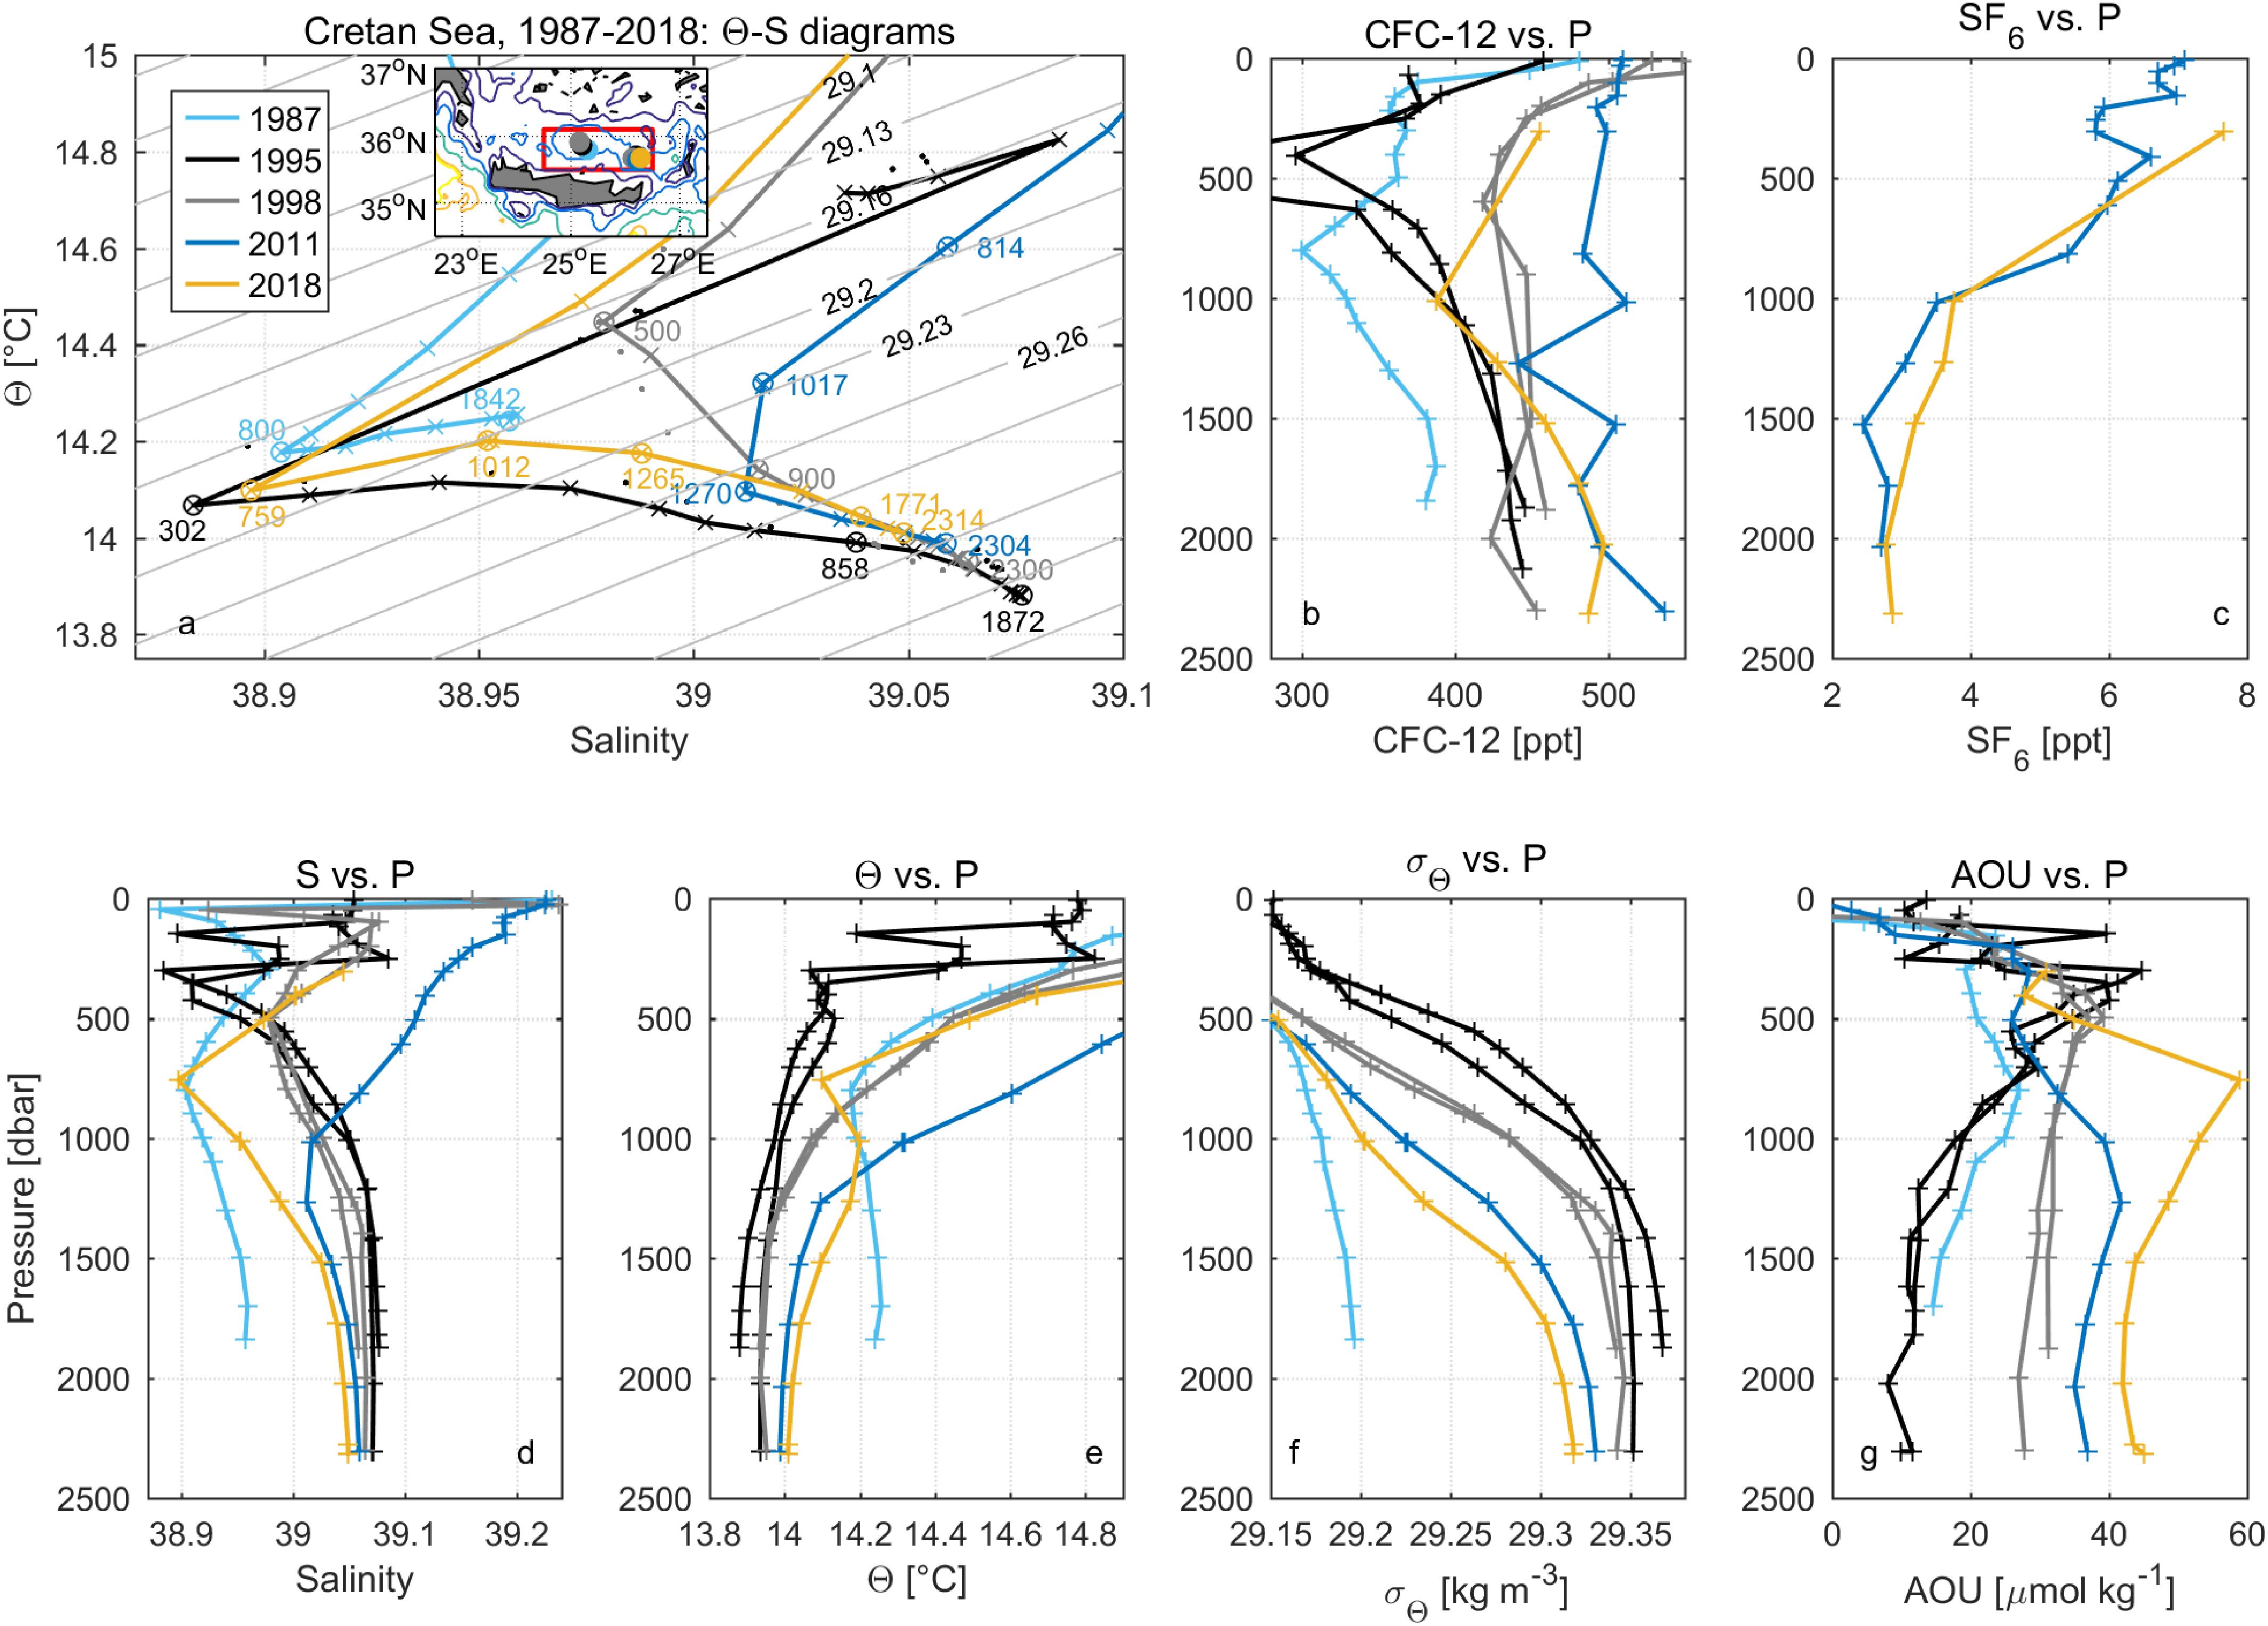
Figure 4. Similar to Figure 3 but in the Cretan Sea. The stations shown are M5/6 753, M31/1 41 and 42, Aegaeo98 10 and 13, M84/3 288, and MSM72 2.
Above the CDW, a characteristic Θ–S inversion at 300–1300 m depth (Figure 4) is thought to be the core depths of the Transitional Mediterranean Water (TMW). The depth of the inversion is also the depth of “local CFC-12/salinity/Θ/oxygen minimum,” indicating infrequent (weak) ventilation (renewal). In this layer (Supplementary Figure S3), slightly decreased CFC-12 concentrations and increased AOU from 1987 to 1995 suggest weak ventilation, but the constant AOU between 1995 and 2018 indicates constant ventilation.
Ionian Sea
Northern Ionian Sea
In this area, we examined clusters of stations from the western and eastern parts of the basin south of Otranto Strait. For the deep layer (below ∼1200 m) in the north-western Ionian Sea (Figure 5 and Supplementary Figure S4), CFC-12 concentrations, as well as salinity and Θ, increased from 1987 to 2011 but with a small decrease below ∼2000 m from 1997 to 2011 for the latter two properties, while AOU decreased from 1987 to 1995 then increased to 2011. In the deep layer of the north-eastern Ionian Sea, CFC-12 concentrations increased from 1987 to 1997 but with a small decrease to 2018, while salinity and Θ increased from 1987 to 1995 but decreased to 2018 in the near-bottom layer, and AOU showed the opposite change. The dramatic increase in salinity and Θ found between 1987 and 1995 for the north-eastern Ionian Sea, but between 1995 and 1997 for the north-western Ionian Sea could be related to the spreading deep water of Aegean source. There was a large difference of CFC-12 concentrations between the north-western and north-eastern Ionian deep waters in 1987, indicating a larger Adriatic outflow that tends to follow the western slope. However, similar CFC-12 concentrations are found between the two deep waters in 1995/97, implying different sources.
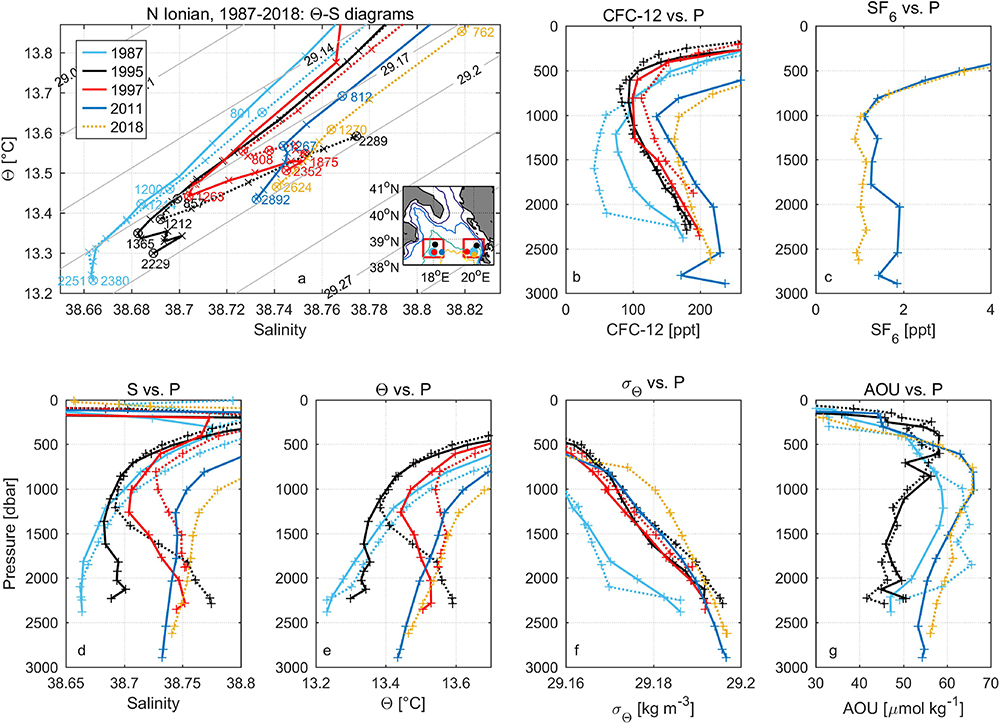
Figure 5. Similar to Figure 3 but in the northern Ionian Sea. The stations shown in the north-western Ionian Sea are M5/6 770, M31/1 13, Ura2 21, and M84/3 314 (continuous lines). The stations shown in the north-eastern Ionian Sea are M5/6 764, M31/1 23, Ura2 46, and MSM72 34 (dotted lines).
For the intermediate layer (Supplementary Figure S4), the slightly decreased CFC-12 concentrations and increased AOU from 1987 to 1995 indicate slow ventilation in the north-western Ionian Sea. After 1995, CFC-12, salinity, Θ and AOU increased in the north-western and north-eastern Ionian intermediate waters.
Western and central Ionian Sea
In the western and central Ionian Sea (Figure 6 and Supplementary Figure S5), CFC-12 concentrations increased significantly from 1987 to 1995 (90–120 ppt), gradually increased up to 2001 and another “jump” in concentrations to 2011, that slightly decreased or remained essentially constant to 2018, although the SF6 concentrations slightly decreased from 2011 to 2018 in the layer below ∼3000 m. Similar to the transient tracers, the Θ/S evolution in the central Ionian is also characterized by a large increase (∼0.2°C/0.1) from 1987 to 1995, the year with the highest Θ/S of the time-series. In 1999, the Θ/S decreased significantly but did not reach the pre-EMT levels, and then gradually increased through the time-series up to 2011/18. The AOU story is again slightly different. The AOU decreased from 1987 to 1995, dramatically increased to 1999, decreased to 2001 and then slightly increased to 2018 below 1400 m. The stepwise increase and the occasional decrease in CFC-12 concentration and the dramatic change of AOU indicate variable ventilation. For instance, the increased CFC-12 concentrations and decreased AOU after 1987 and 1999 indicate enhanced ventilation during the 1987–1995 and 1999–2001 time-periods, nearly stagnated ventilation during 1995–1999 and 2011–2018 for the central Ionian and possibly slightly weakened ventilation from 2011 to 2018 for the western Ionian Sea. Such ventilation status during 2011–2018 is also supported by observations of SF6. Note the dramatic increase in AOU from 1995 to 1999 also noticed by Klein et al. (2000) that speculate on increased oxygen consumption due to increased input of labile Dissolved Organic Carbon (DOC) with the new deep water. The dramatically Θ–S inversion and increased salinity and Θ in 1995 found in the central Ionian Sea but not in the western Ionian Sea are related to the EMT event. The difference of properties in the deep layer between the western and central Ionian Sea in 1995 are ∼30 ppt for CFC-12 concentrations, ∼0.1 for salinity, ∼0.3°C for Θ and ∼5 μmol kg–1 for AOU.
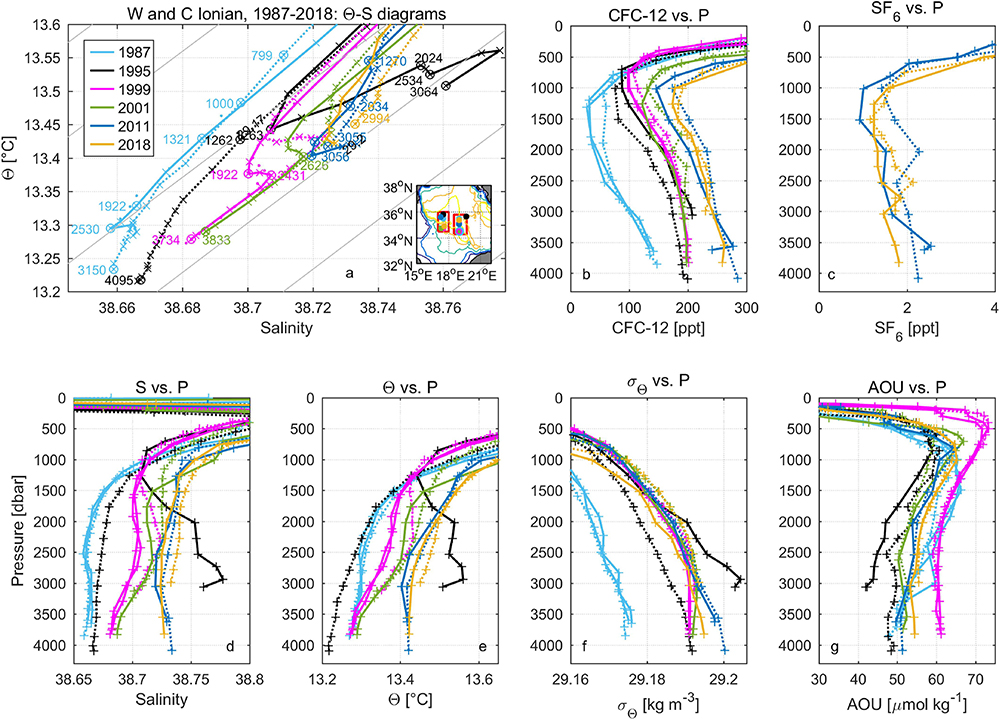
Figure 6. Similar to Figure 3 but in the western and central Ionian Sea. The stations shown in the western Ionian Sea are M5/6 777, M31/1 10, M44/4 303, M51/2 519, M84/3 305 and MSM72 57 (dotted lines). The stations in the central Ionian Sea are M5/6 773 and 774, M31/1 27, M44/4 301 and 300, M51/2 520, M84/3 303 and MSM72 53 (continuous lines).
In the western Ionian intermediate water (Supplementary Figure S5), CFC-12 concentrations and salinity gradually increased from 1987 to 2018, but Θ and AOU decreased to 1999 and then increased to 2018, which depicts relatively strong ventilation between 1987 and 1999 but weak ventilation after 2001. In the central Ionian intermediate water, increasing CFC-12 concentrations and decreasing AOU from 1987 to 1995 indicate intensified ventilation of the less saline, colder and higher density water, following with relatively weak ventilation to 1999 and nearly stagnant ventilation during the 2000s and 2010s.
Eastern Ionian Sea
We have a time-series of 6 occupations from 1987 to 2018 in the eastern Ionian Sea (Figure 7 and Supplementary Figure S6). The time-series show CFC-12 concentrations with little differences (∼30 ppt) from 1995 to 2018 compared to its dramatic increase (∼170 ppt) from 1987 to 1995 related to the EMT event in the deep layer. A similar increase took place for other properties, such as salinity, Θ and σΘ from 1987 to 1995, but this was followed by a relaxation toward pre-EMT conditions, although this condition is not reached. From 2001 to 2011, salinity and Θ decreased but CFC-12 concentrations, σΘ, and AOU increased. As to the time range 2011–2018, properties in the two years showed similar values in general. In summary, dramatically enhanced ventilation is observed from 1987 to 1995 followed by nearly stagnated ventilation up to 2018 in the eastern Ionian Sea.
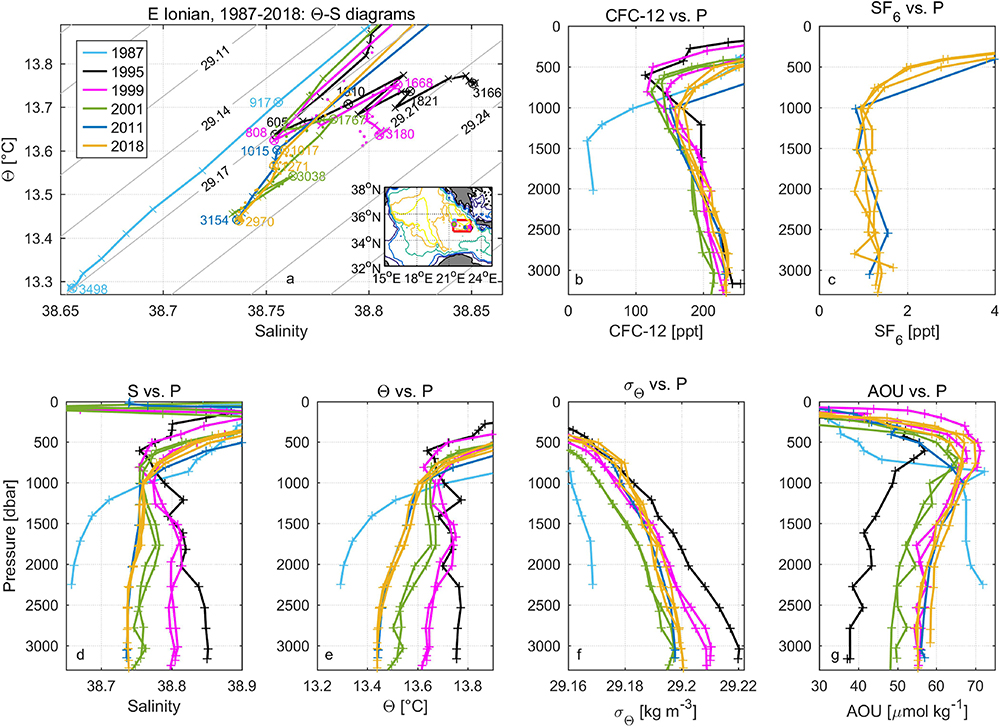
Figure 7. Similar to Figure 3 but in the eastern Ionian Sea. The stations shown are M5/6 760, M31/1 32, M44/4 292 and 294, M51/2 522 and 523, M84/3 299 and MSM72 22, 44, 46 and 47.
Weak ventilation was found in the eastern Ionian intermediate water from 1987 to 1995 as seen by the decreasing CFC-12 concentrations and slightly increasing AOU (Supplementary Figure S6). Afterward, increased CFC-12 concentrations and decreased AOU between 1999 and 2011 support strong ventilation of the more saline and warmer water. From 2011 to 2018, weak ventilation was found again with decreasing transient tracer concentrations and increasing AOU.
Northern Cretan Passage
We have a time-series of 8 occupations from 1987 to 2018 in the northern Cretan Passage (Figure 8 and Supplementary Figure S7). Similar to that in the eastern Ionian Sea, the time-series show CFC-12 concentrations with little differences (∼25 ppt) from 1995 to 2018 in the layer below ∼2500 m compared to its dramatic increase (∼190 ppt) from 1987 to 1995 related to the EMT event and strong ventilation. A dramatic increase also took place for other properties, such as salinity (∼0.2), Θ (∼0.53°C) and σΘ (∼0.05 kg m–3) but decrease for AOU (∼26 μmol kg–1) from 1987 to 1995. Salinity, Θ and σΘ then generally decreased but AOU increased from 1995 to 2011. The small decrease in CFC-12 concentrations from the 1990s to 2011 indicates nearly stagnant ventilation after 1995. The decreased amplitude of Θ–S inversions between the EMDW of old Adriatic origin and that of Aegean origin from 1995 to 2018 illustrates the weakened Aegean source intensity after 1995 and the erosion of the EMT deep water. Although there is a gradual change in Θ/S after 1995 toward pre-EMT conditions, there is nearly no change in CFC-12 indicating that the water that mixes with the EMT induced deep water is ventilated at a similar time scale. For the time range 2011–2018, properties showed various and small changes that can be attributed to local variability. Significantly, AOU increased from 2011 to 2018 supporting slow ventilation. Note the large increase (∼54 ppt) of CFC-12 concentrations between 2001 and 2011 at 1000–1500 m depth (Figure 8a), indicating that the water from the Aegean source was no longer dense enough to reach the deep layer of the northern Cretan Passage but ventilated the intermediate layer.
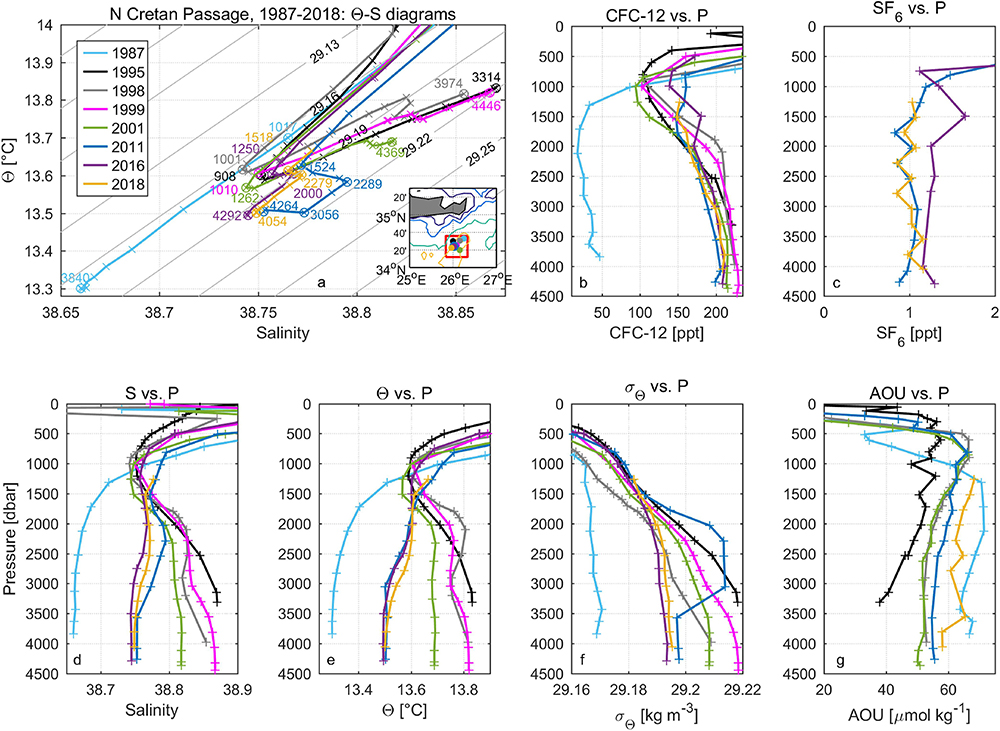
Figure 8. Similar to Figure 3 but in the northern Cretan Passage. The stations shown are M5/6 751, M31/1 46, Aegaeo98 40, M44/4 265, M51/2 530, M84/3 297, CRELEV2016 18 and MSM72 9. The structures of Θ–S diagrams in the northern Cretan Passage can be generally separated as three patterns: the one in 1987 with low salinity and Θ (38.66, 13.3) in the deepwater (EMDW of old Adriatic origin); the one in 1995–2001 with an inversion at 900–1300 m core depth (EMDW of old Adriatic origin) and the near-bottom water (EMDW of Aegean origin) with high salinity and Θ (38.87, 13.8); the one in 2011–2018 with an inversion at 1250–1500 m core depth (EMDW of old Adriatic origin) followed by another inversion at 2000–2300 m (EMDW of Aegean origin) and the near-bottom water (EMDW of new Adriatic origin) with medium salinity and Θ (38.75, 13.5).
From the perspective of the tracer age difference (Supplementary Figure S8a), the 2001 profile in the northern Cretan Passage represents the post-EMT situation, while the 2016 one represents the combined influence of remnant Aegean and new Adriatic sources. Tracer ages estimated from CFC-12 in 2001 are lower than those estimated from SF6 in 2016 in the deep layer, supporting the stagnant ventilation in this area during that ∼15 years.
Levantine Basin
Here we present two areas in the Levantine basin, east of Crete and west of Cyprus (Figure 9), where two Θ–S inversions have developed since 1987. The first inversion appeared in the mid-depth (1000–1800 m) in the 1995–2011 time-periods. The second inversion was found near the bottom in 2011, indicating that the influence of the new Adriatic-originated water has been spread to the Levantine basin in 2011.
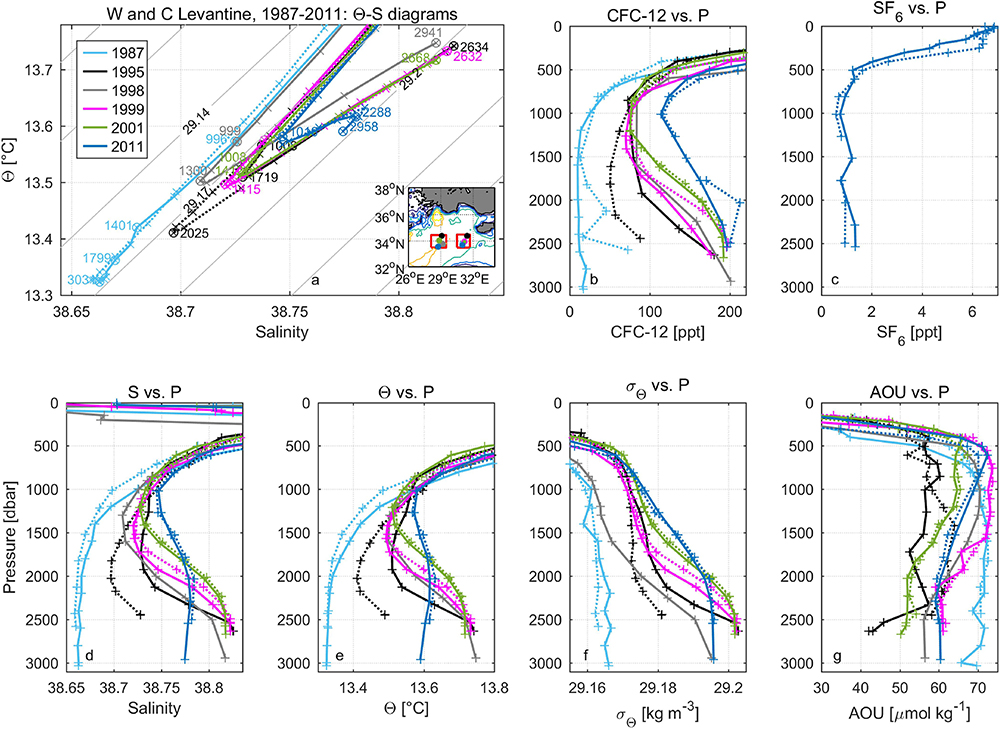
Figure 9. Similar to Figure 3 but in the western and central Levantine basin. The stations shown in the western Levantine basin are M5/6 747, M31/1 56, Aegaeo98 441, M44/4 238, M51/2 537 and M84/3 296 (continuous lines). The stations shown in the central Levantine basin are M5/6 746, M31/1 69, M44/4 236, M51/2 540 and M84/3 294 (dotted lines).
Increasing CFC-12 concentrations in the EMDW in the Levantine basin below ∼1800 m from 1987 to 2011 indicates strong ventilation between 1987 and 1999 and relatively slow ventilation after that (Figure 9 and Supplementary Figure S9). The dramatic change of properties took place between 1987 and 1995 for the western Levantine basin but up to 1999 for the central Levantine basin, consistent with the spreading of the Aegean source. A similar delay of influence took place in the following years. For example, larger differences of CFC-12 concentrations were observed between 1999 and 2001 in the western Levantine but between 2001 and 2011 in the central Levantine. For other properties below ∼1800 m, salinity, Θ and σΘ also showed increasing trends from 1987 to 1999 with the exception in 1998. After 1999, the trend continued in the deep layer, but with a slight reversal in the near-bottom layer from 2001. As a consequence of the influence of the EMT event, AOU decreased from 1987 to 1995 but increased to 1999, then decreased to 2001 and increased up to 2011 below ∼500 m.
The Levantine (especially the central Levantine) intermediate water (Supplementary Figure S9) was characterized by strong ventilation from 1987 to 1995 indicated by increasing CFC-12 concentrations and decreasing AOU, which was different from the intermediate layers of other basins in the EMed. After 1995, CFC-12 concentrations, salinity, Θ and AOU slightly increased to 1999 and decreased to 2001, and then increased again to 2011 for the western Levantine intermediate water.
Temporal Variability of Properties in the Strait of Sicily
The Strait of Sicily is the relatively shallow area connecting the western and eastern Mediterranean basins. In the deep-water layer (below ∼600 m), the concentration of CFC-12 shows a generally increasing trend after a small decrease between 1987 and 1995 (Figure 10 and Supplementary Figure S10), as can be expected from the transient of CFC-12 in the atmosphere. The salinity and Θ also decreased slightly from 1987 to 1995 and then steadily increased to 2001. Afterward, there is a significant increase in salinity and Θ during the rather long time-period up to 2018. The simultaneous changes in both Θ and salinity tend to compensate each other in density space, but the overall effect is an increase in density from 1987 to 1995, steady density to 2001 and then decreased density in 2018, which is approaching the lower density found in 1987. The AOU shows a different pattern, with slightly increased concentrations from 1987 to 1995, significantly higher values in 1999 and then lower AOU to 2001/2018. There are large differences for all properties in the intermediate and deep layers in 1999. It is the anomalous year of 1999 with strong ventilation in the intermediate layer and slow ventilation in the deep layer. The changes of CFC-12 concentration and AOU reveal strong ventilation from 1995 to 1999 and from 2001 to 2018 for the intermediate layer (LIW), as well as strong ventilation during 1999–2001 and nearly constant ventilation during 2001–2018 for the deep water (tEMDW) in the Strait of Sicily.
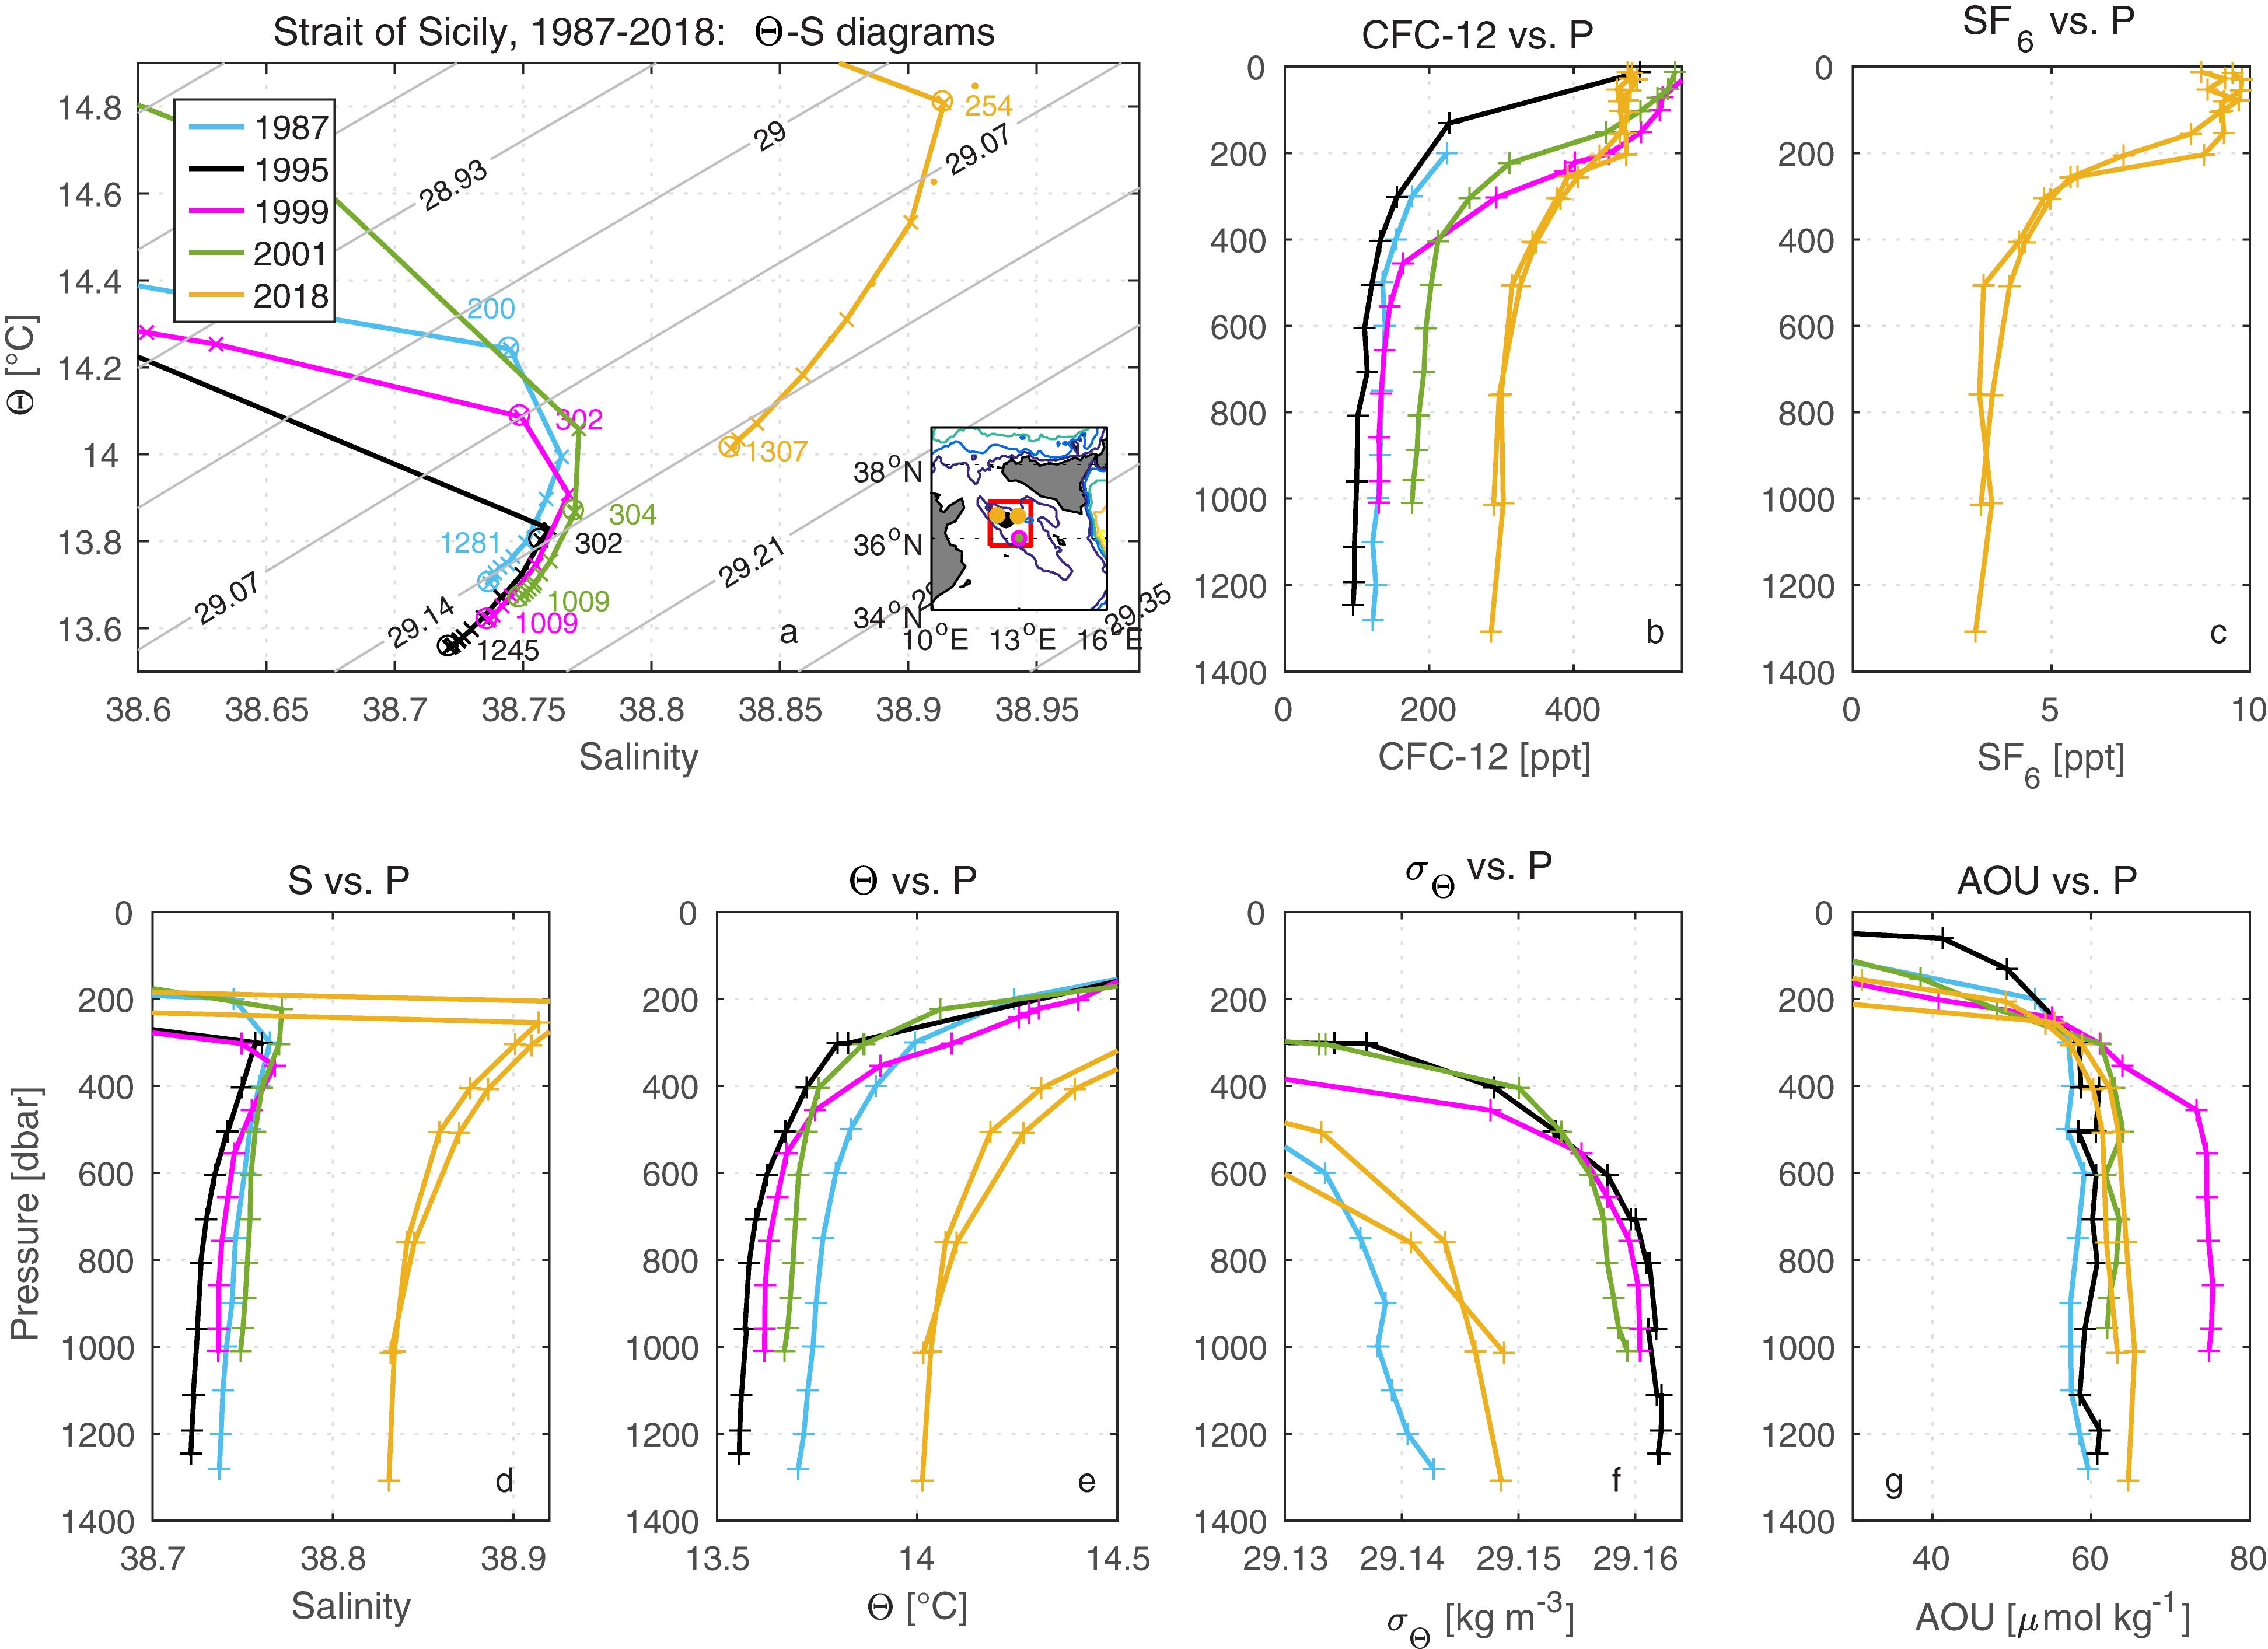
Figure 10. Similar to Figure 3 but in the Strait of Sicily. The stations shown are M5/6 781, M31/1 6, M44/4 307, M51/2 516 and MSM72 72 and 70.
Spatial Distribution of CFC-12 and SF6 in the WMed
Sections of the vertical distribution of CFC-12 concentrations in the WMed for 1995, 1997, 2001, 2011, and 2018, and SF6 concentrations for 2018 are presented in Figure 11. Similar to the EMed, the main feature of the transient tracer concentration is a TMZ centered at ∼1000 m depth. In the deeper layer, high concentrations of CFC-12 found in the bottom waters near the Sardinia Channel in 1995 is maybe not that significant considering the limited number of observations, which is supported by the CFC-11 concentrations in 1997 (Rhein et al., 1999). In 2001, the bottom tracer concentrations near the Sardinia Channel have slightly increased to ∼200 ppt, but the limited horizontal extent of that section limits the interpretation to the eastern part. Thus, the CFC-12 concentrations in the deep water changed slowly in the second half of the 1990s and the early 2000s attributed to the weak local source, as can be expected from a transient tracer in a steady-state ventilation scenario. Subsequently, due to the influence of the WMT event that started in winter 2004/05, the situations in 2011 and 2018 are different with significantly higher CFC-12 concentrations (260–290 ppt) that tend to be higher in the western part of the WMed, as opposed to the higher concentrations in the eastern part in the decade prior to 2001. The elevated CFC-12 concentrations observed in the western WMed bottom water in both 2011 and 2018 revealed the intrusion of the new WMDW toward the Alboran Sea. However, the slightly increased CFC-12 concentrations from 2011 to 2018 in the WMed, especially in the bottom water, are probably a result of the weakened influence of the WMT event during this period. The spatial distributions of CFC-12 and SF6 concentrations in the WMed deep layer in 2018 (Figures 11e,f) are generally similar to three cores of higher concentrations in the WMed bottom waters.
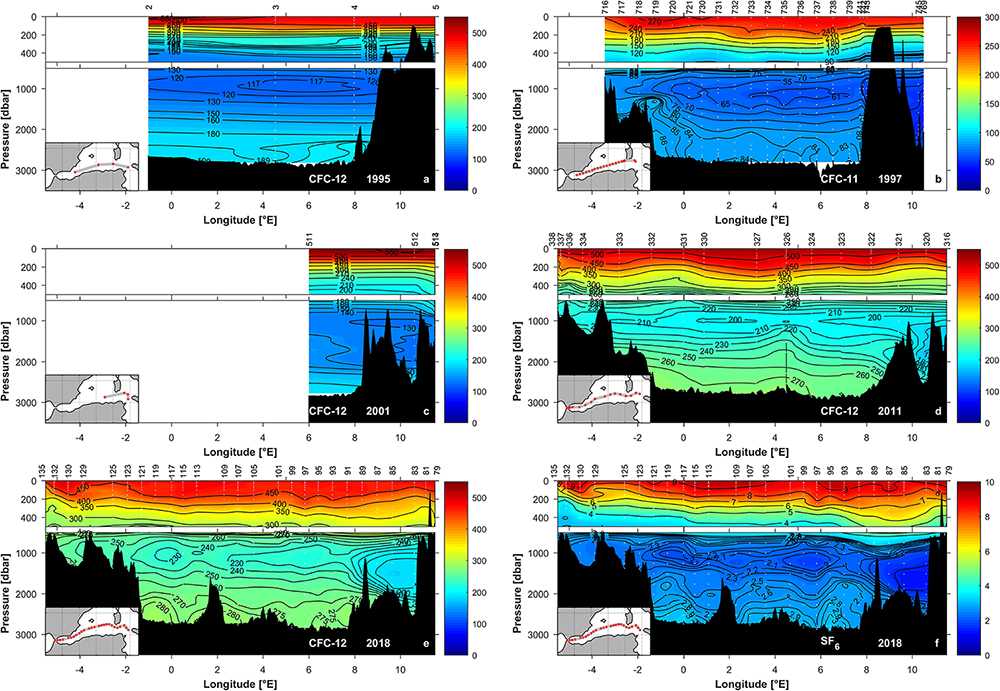
Figure 11. Vertical sections of CFC-12/CFC-11 concentration (in ppt) in the Western Mediterranean Sea (see inset maps for station locations) in (a) 1995 (Meteor M31/1), (b) 1997 (Poseidon 234), (c) 2001 (Meteor M51/2), (d) 2011 (Meteor M84/3), and (e) 2018 (Maria S. Merian MSM72) and vertical section of SF6 concentrations (in ppt) in the WMed in (f) 2018 (Maria S. Merian MSM72). The vertical section of CFC-12 concentrations in 1997 is replaced by that of CFC-11 concentration due to the higher quality of CFC-11 data (Rhein et al., 1999). The same scales of longitude and pressure are used for all figures, while the same color bars are separately used for CFC-12, CFC-11 and SF6 sections. The upper panels highlight the top 500 m. The markers on the top x-axis stand for the station number.
Temporal Variability of Properties in the WMed
Tyrrhenian Sea
Although the Tyrrhenian Sea is influenced by both the EMed and WMed, no Θ–S inversions are observed in the Tyrrhenian Deep Water (TDW) during the last three decades (Figure 12a), which is significantly different from the cases in the two main basins (EMed and WMed). The small change in the Θ–S diagrams from 1997 to 2018 indicates the apparent synchronous change of salinity and Θ, and the influence of water masses from EMed and WMed to the Tyrrhenian Sea is not strong enough to lead to the inversions. This may be because the Tyrrhenian Sea is not closely connected to the convection areas of either the eastern or western Mediterranean Sea. The transit times allow for internal mixing and topographical obstacles to prevent the inversion signals to reach this area.
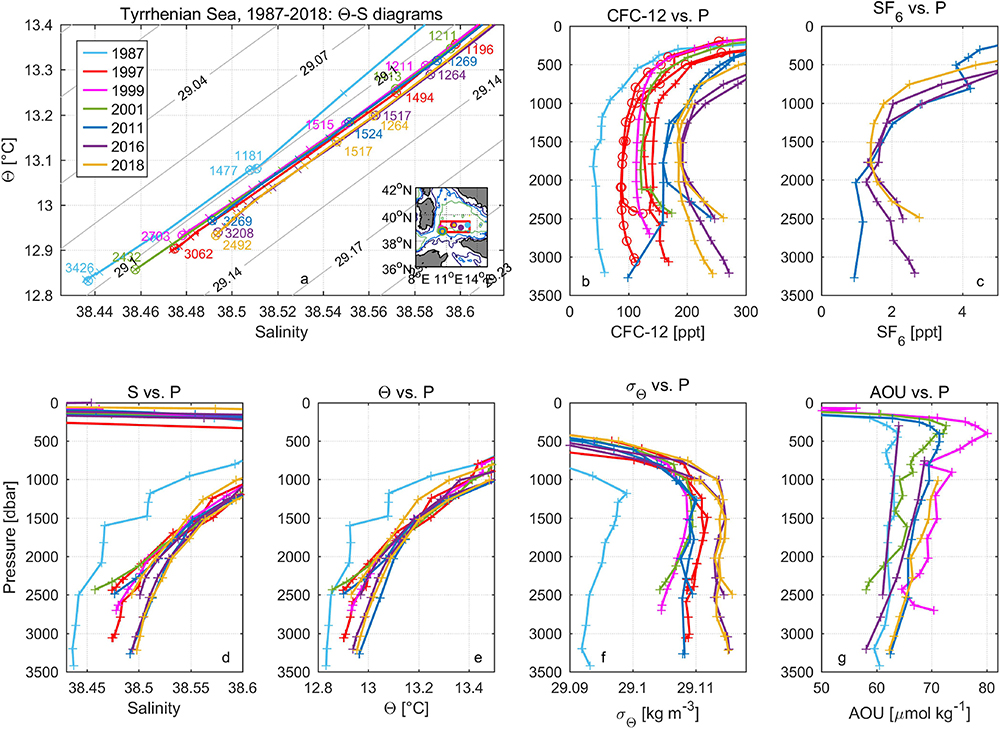
Figure 12. Similar to Figure 3 but in the Tyrrhenian Sea. The stations shown are M5/6 786, P234 767 and 768, M44/4 310, M51/2 512, M84/3 317 and 320, TALPro2016 6 and 5, and MSM72 83 and 77. In (b), the 1997 data from cruise P234 with “o” symbols were calculated from CFC-11.
The CFC-12 concentrations increased between 1987 and 1997 in the deep-water layer (below ∼1500 m) in the Tyrrhenian Sea (Figure 12 and Supplementary Figure S11). This was followed by slightly increased concentrations between 1999 and 2001. It is an indication of slightly enhanced ventilation combined with the decreased AOU during the same period. In 2011, the increased transient tracer (CFC-12 and SF6) concentrations in the TDW showed enhanced ventilation attributed to the combined influences from the LIW, EMDW, and WMDW, especially the WMT event started from 2004 to 2006. In the 2010s, the salinity and Θ in the TDW were similar in 2011, 2016, and 2018, but with increased CFC-12 concentrations and σΘ from 2011 to 2016/18. Although the increase in SF6 concentrations in the TDW below 2000 m from 2011 to 2016/18 is consistent with the increased atmospheric SF6 concentrations, the decreased AOU and the smaller increase in CFC-12 concentrations can be explained by intense ventilation of the TDW driven by the WMT event considering the decreasing CFC-12 concentrations in the atmosphere. From 2016 to 2018, the increased AOU in the TDW suggests a slowdown of the ventilation. Salinity, Θ, and σΘ in the TDW largely increased from 1987 to 1997. Subsequently, σΘ decreased slightly to 1999 and 2001, and then increased somewhat to 2011 and significantly to 2016/18. This increase in density is mainly driven by increased salinity, and somewhat compensated by increasing Θ.
In the Tyrrhenian intermediate water (Supplementary Figure S11), CFC-12 concentrations, salinity and Θ increased from 1987 to 2016, and SF6 concentrations increased from 2011 to 2016, but all decreased afterward. Except for the extremely high AOU in 1999, the nearly constant AOU between 2001–2016 supports constant ventilation. But from 2016 to 2018, the slightly increasing AOU and decreasing transient tracers indicate weak ventilation.
From the perspective of the tracer age difference (Supplementary Figure S8b), minor changed tracer ages in the Tyrrhenian Sea between 2001 and 2016 are found at the depth below ∼1700 m, which suggests steady-state ventilation. Such a situation may be attributed to the counterbalance of the advective influence of the WMT event, the TDW and the tEMDW. The decrease in tracer ages between ∼500 and ∼1700 m during this period (i.e., increased ventilation) may be associated with the input of the LIW and the tEMDW from the EMed because of the influence of the new Adriatic source. A similar tracer age decrease above the deep layer is found in the south Liguro-Provençal basin between 1997 and 2011 (Schneider et al., 2014).
Gulf of Lions and Liguro-Provençal Basin
In the northern part of the Western Mediterranean Sea, i.e., Gulf of Lions and Liguro-Provençal basin, we have only observations in two years (1997 and 2016), so that only limited information on the temporal evolution can be made. Increased CFC-12 concentration, salinity, Θ and σΘ are observed in the water layer below ∼300 m (Supplementary Figures S12, S13) indicating the steady to increased ventilation during the period.
Algerian Basin
While similar CFC-12 concentrations in 1995, 1997, and 2001 at deep and intermediate depths of the central Algerian basin (Figure 13 and Supplementary Figure S14) suggested stagnated ventilation before 2001, salinity, Θ and σΘ slightly increased from 1995 to 1997. The salinity showed similar values in 1997 and 2001, but σΘ decreased driven by increased Θ in the deep layer. Subsequently, all properties increased significantly from 2001 to 2011 due to the WMT event when intense DWF led to strong ventilation in the deep western Mediterranean basin (Schroeder et al., 2008). This trend continued up to 2018, although at a slower pace. The CFC-12 concentrations increased from 2011 to 2016 and then decreased slightly to 2018. SF6 concentration also decreased after 2016 in the central Algerian deep water below ∼2000 m. The decreased concentration of the transient tracers suggests weakened ventilation in the WMDW after 2016, which is also supported by the increase in AOU from 2011 to 2018. During this time, salinity, Θ and σΘ increased from 2011 to 2016 and showed similar values between 2016 and 2018. In the western Algerian deep layer (Figure 13), CFC-12 concentrations remain constant from 1995 to 1997 but increased afterward, while salinity, Θ and σΘ gradually increased from 1995 to 2018.
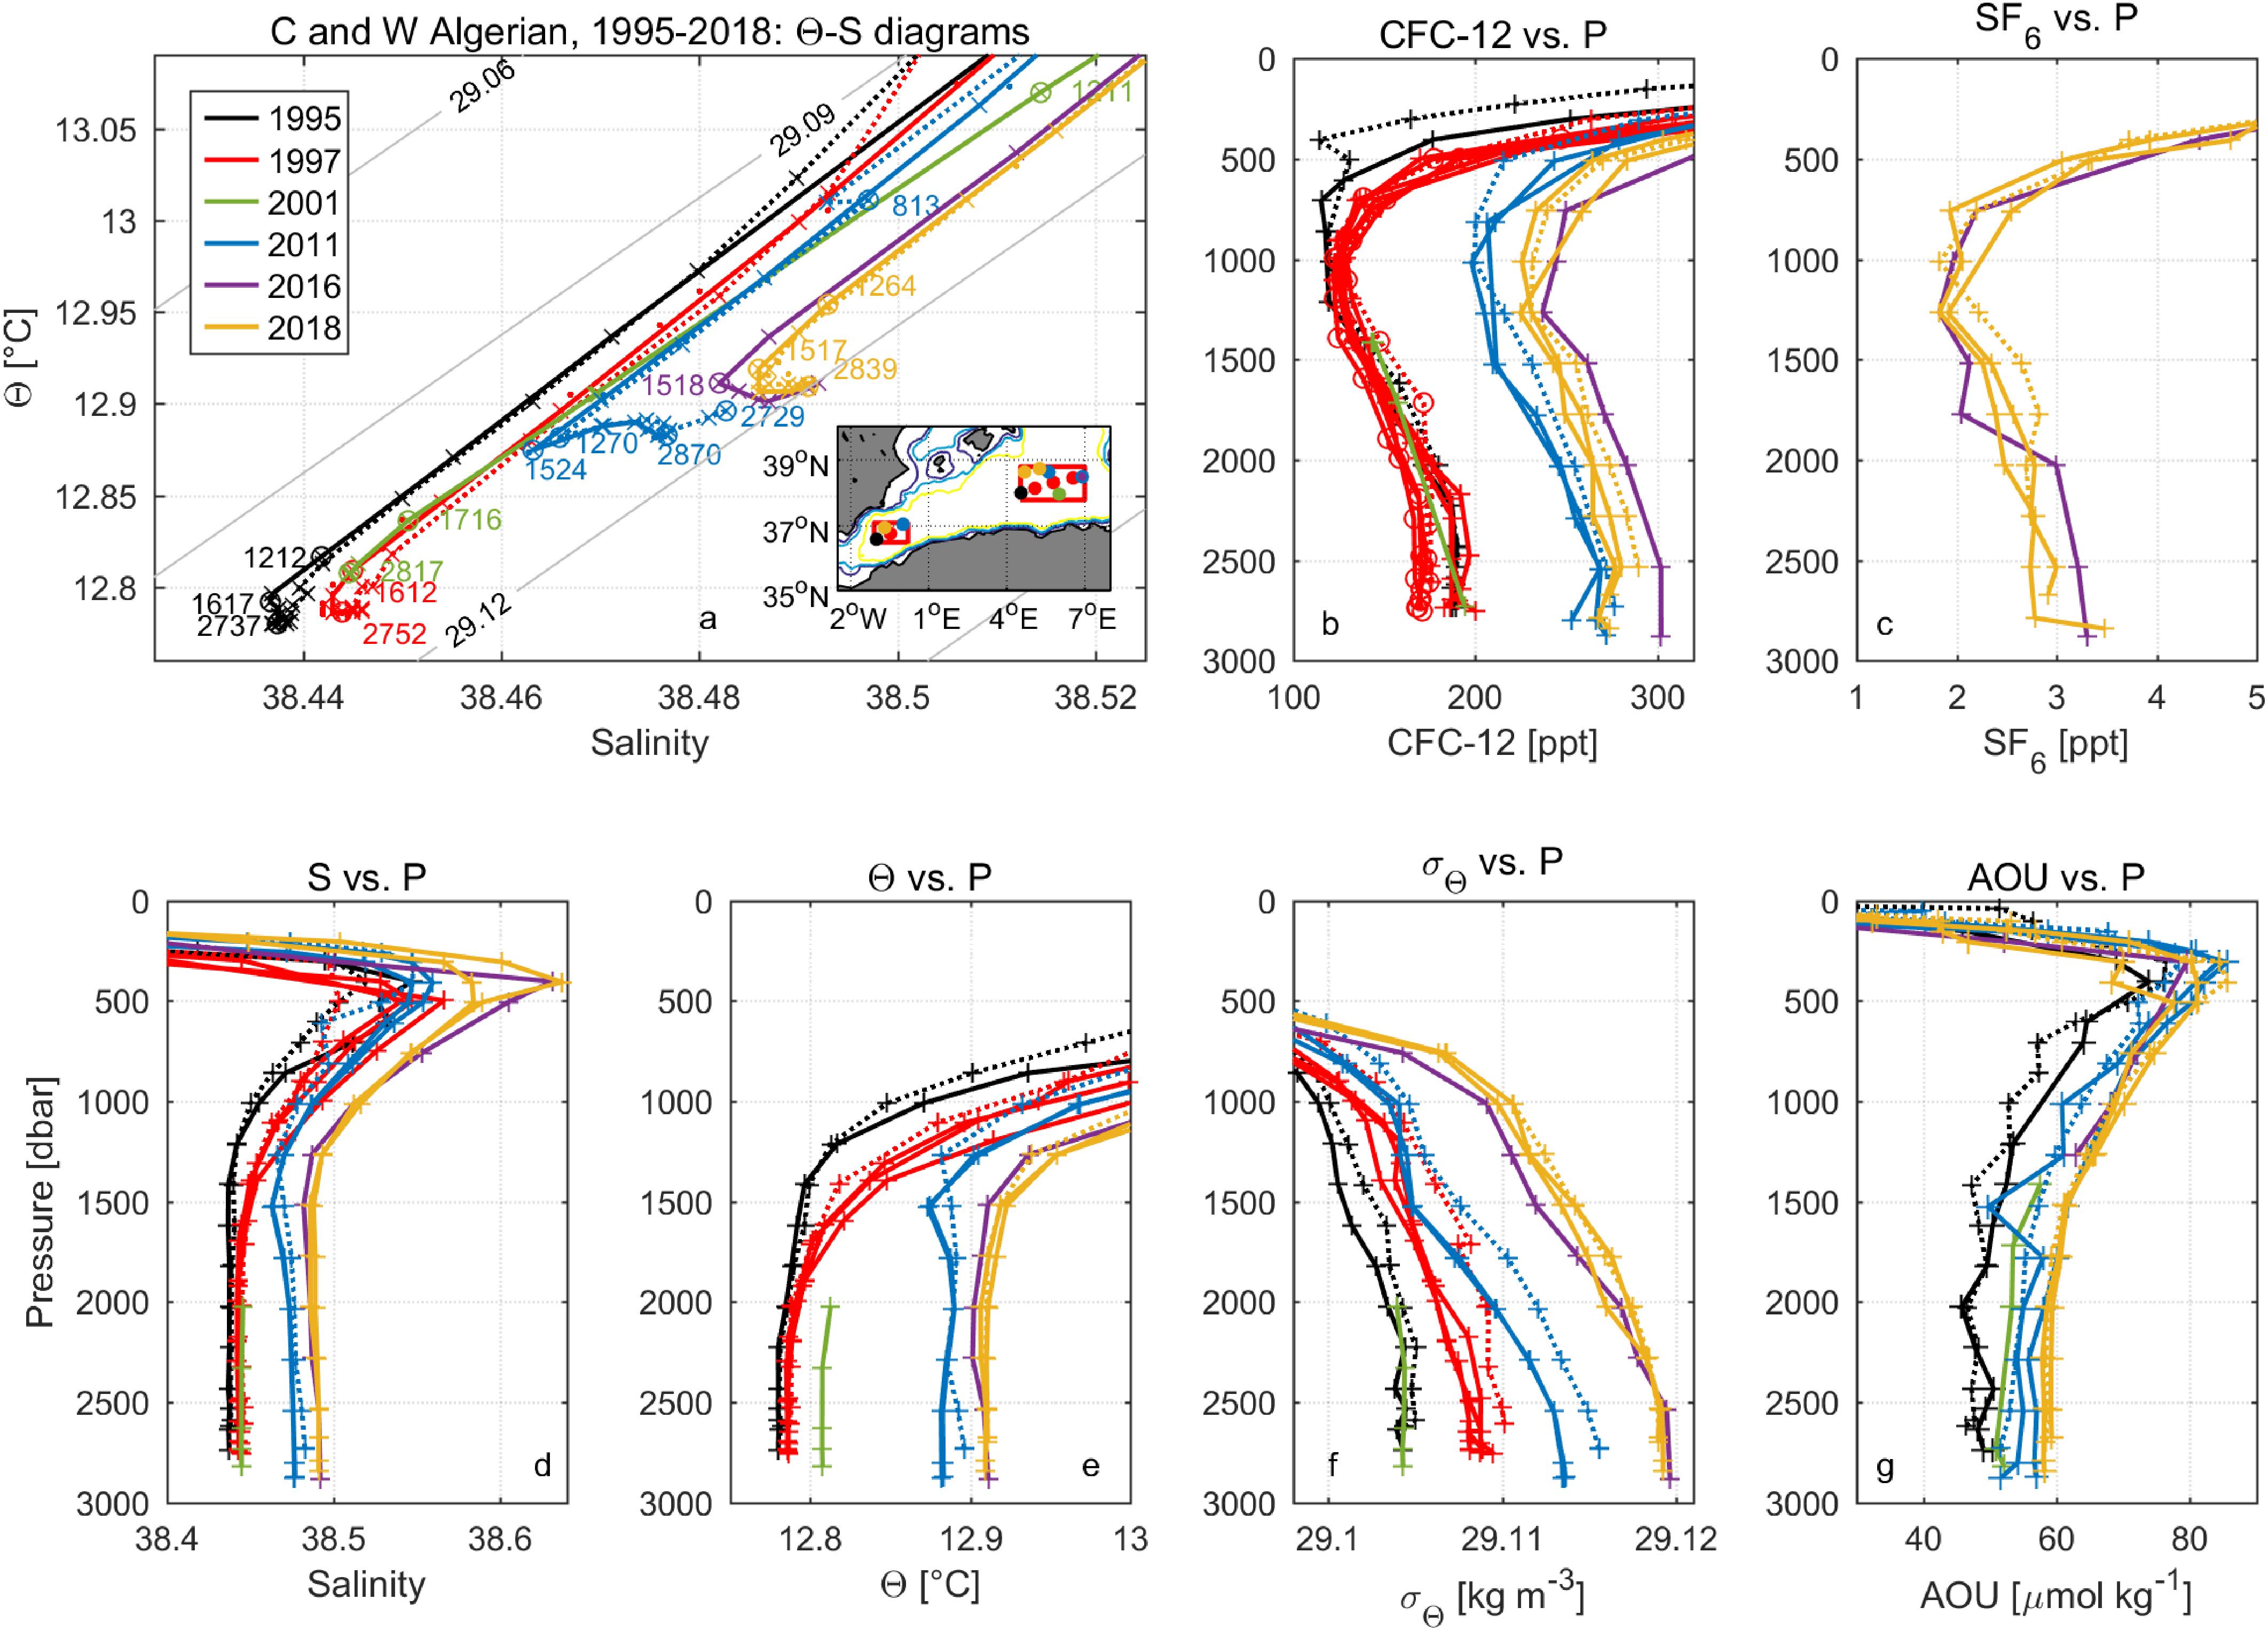
Figure 13. Similar to Figure 3 but in the central and western Algerian basin. The stations shown in the central Algerian basin are M31/1 3, P234 736, 737 and 738, M51/2 511, M84/3 324 and 323, TALPro2016 19 and MSM72 99 and 101 (continuous lines). The stations in the western Algerian basin are M31/1 2, P234 720, M84/3 331 and MSM72 119 (dotted lines). In (b), we added the 1997 data with “o” symbols calculated from CFC-11.
In the Algerian intermediate water (Supplementary Figure S14), CFC-12 concentrations, salinity, Θ and AOU increased from 1997/2001 to 2011, and again to 2018 for the western part of the basin. While for the central basin, increasing CFC-12 and decreasing AOU indicate strong ventilation from 2011 to 2016 with higher salinity and Θ. But the ventilation weakened to 2018 with lower salinity and Θ through the decreased CFC-12 concentrations and increased AOU.
Alboran Sea
In the water layer below ∼500 m in the Alboran Sea (Supplementary Figures S15, S16), we find trends similar to those in the western Algerian basin. That is, CFC-12 concentrations, salinity, Θ and σΘ increased from 1997 to 2018, and AOU increased from 2011 to 2018. The increase in CFC-12 concentrations from 1997 to 2018 depicted the generally enhanced ventilation of the Alboran Sea deep water. For the water between 200 and 450 m depth, the increasing CFC-12 from 1997 to 2018 and decreasing AOU from 2011 to 2018 indicate enhanced ventilation. Although the influence of the WMT is seen in the Alboran Sea, no Θ–S inversion is observed since the sea is not deep enough (Figure 11).
Discussion
We have compared transient tracer observations from 1987 to 2018 (CFC-12/11 and SF6) in the Mediterranean Sea, mainly focusing on the layers below the Levantine Intermediate Water (LIW), in order to characterize the temporal evolution of ventilation. Here we discuss trends and variability of the ventilation patterns in the Mediterranean Sea based on the combined observations of transient tracers, salinity, potential temperature, potential density and apparent oxygen utilization described in the previous section. We start with a discussion of the slowly ventilated TMZ and then discuss trends in deep water ventilation for the different basins. During recent decades, the influences of the EMT and WMT events have led to bottom and deep-water renewal that has modified the TMZ and bottom water ventilation patterns.
Tracer Minimum Zone (TMZ)
The Mediterranean Sea is one of few places in the global ocean with a pronounced TMZ at mid-depth of the water column attributed to rapid ventilation in the deep waters so that the TMZ corresponds to the slowest ventilated layer. The TMZ in the contemporary Mediterranean Sea is presented from the Levantine basin to the Alboran Sea, although with a break in the Strait of Sicily. The dominating water mass of the TMZ is the Transitional Mediterranean Water (TMW) in the EMed and the transitional EMDW (tEMDW) in the WMed. The depth of the TMZ has shallowed in both the western and eastern basins before the EMT and WMT ventilation episodes but has been deepening after these events. For the eastern basin, the TMZ shallowed from 1987 to the 1990s and then deepened up to the 2010s. In the western basin, this shift is not so obvious although the TMZ deepened from 1987 to 1995, shallowed to the mid-2000s (not shown) and then deepened slightly to the 2010s followed by slow upward motion (Supplementary Table S2). For instance, the TMZ shallowed from ∼1400 m (1987) to 600–800 m (the 1990s) and then deepened to 1000–1300 m (2018) in the eastern Ionian Sea, as well as deepened from ∼700 m (1987) to 900–1000 m (1995) and deepened again from 800–1000 m (2011) to 1200–1300 m (2016/18) in the central Algerian basin. The transient tracer concentrations in the TMZ have increased significantly in the EMed during the past ∼30 years, although the increase in transient tracers in the TMZ of the WMed is less pronounced. However, the transient tracer concentration in the TMZ is higher in the WMed than in the EMed for any given year.
Eastern Mediterranean Basin
We start with the Adriatic Sea as a major source region of deep waters in the Eastern Mediterranean basin. Here we observe no ventilation of the deep-water (below 600 m) from 1987 to 1999, but with strong ventilation between 1999 and 2011 that continued in the period 2011–2016. Even though there was no ventilation of the deep water in the Adriatic Sea up to 1999, as seen by constant CFC-12 and increased AOU, it got slightly saltier and warmer. The trend for the intermediate layer (200–600 m) is similar, but with a pronounced decrease in transient tracers between 1987 and 1995 and then increased ventilation observed in 1999, indicating how changes in this layer are different from the deep layer. The extremely cold winter in 2012 (Gačić et al., 2014) and increased transient tracer concentrations support strong ventilation in the Adriatic Deep Water between 2011 and 2016, although with decreased bottom density (Chiggiato et al., 2016). The spatial distribution of SF6 concentrations (Figure 2h) reveals that the AdDW was no longer dense enough to reach the bottom of the Ionian Sea in 2018, indicating that the Adriatic source weakened during recent years. This is also supported by the decreased transient tracers and dissolved oxygen (i.e., increased AOU) from 2011 to 2018 in the western Ionian bottom water and in 2016 in the Adriatic near-bottom water column (below 1000 m). In consequence, the Adriatic Deep Water is currently the dominant deep water source in the EMed, although with weakened influence during the last decade.
The intensified ventilation in the Adriatic Sea influenced the overflow through the Strait of Otranto sill into the Ionian Sea where the EMDW is formed from the AdDW as it mixes with the remnant deep water from the Aegean source. For the other important deep water source of the EMed, the Southern Aegean Sea (i.e., the Cretan Sea), a clear trend is observed with well-ventilated waters in 1995, where after the concentrations remained essentially constant up to 1998, although with considerable variability in the data, and slightly higher concentrations in 2011 and 2018. Schneider et al. (2014) showed slow ventilation of the Cretan Sea from 1998 to 2011. This indicates that as a deep water source the Aegean source weakened after 1995 (Figure 4) and thus led to the current weak ventilation in the CDW.
The Adriatic and Aegean sources meet in the Ionian Sea, and the increase in CFC-12 concentrations between 1987 and 1995 in the EMDW is larger in the east, which is coincident with the east-to-west gradient of the influence of the dominant Aegean source in the Ionian Sea at that time. This is also illustrated by the amplitude of Θ–S inversion related to the Aegean source, which decreases from the eastern to the western Ionian Sea, as well as from the eastern to the north-western Ionian Sea. In 1999, the influence of the Aegean source was weaker in the eastern and central Ionian deep water but stronger in the western Ionian deep water compared to those in 1995, which describes the delayed influence of the Aegean source to the western Ionian Sea. Subsequently, the amplitude of Θ–S inversions related to the Aegean source became smaller in the whole Ionian Sea and the extent of the reversal decreased from 2001 to 2018. In 2018, the Θ–S inversions created by the influence of the Aegean source became very small and even invisible. With the influence of the Aegean became weaker and found predominantly at shallower depths (Theocharis et al., 2002), the new Adriatic source started to influence the Ionian Sea from the bottom layer (Hainbucher et al., 2006; Cardin et al., 2015). This is manifested by the more pronounced increase in CFC-12 concentrations in the western and central Ionian deep water compared to the eastern Ionian deep water between 2001 and 2011, and by the increase in salinity in the water column from ∼3000 m to the bottom in the western and central Ionian Sea in 2011 (Roether et al., 2014). The new Adriatic source leads to the second Θ–S inversions with decreased salinity and Θ observed in the Ionian bottom water in 1999 and 2001. However, the weaken ventilation of the western Ionian deep water and nearly stagnated ventilation of the central and eastern Ionian deep water in 2011–2018, reveal the weakened influence of new Adriatic source to the Ionian Sea, although the AdDW has been the dominant source of deep water in the eastern Mediterranean for the last two decades. Trends in the transient tracer concentrations suggest more contribution of new Adriatic deep water to the Ionian Sea between 2001 and 2011, a signal that weakened between 2011 and 2018.
The water from the Adriatic Sea spreads eastward from the Ionian Sea toward the Cretan Passage, as indicated by the Θ–S inversions (Figure 8a) in 2011 (Manca et al., 2006; Velaoras et al., 2018), which led to the non-monotonous change of local salinity. The salinity decrease in the water column from ∼3000 m to the bottom in 2011 is related to the less saline new Adriatic source (Cardin et al., 2015), following the salinity decrease from 2011 to 2016 (Velaoras et al., 2018). The salinity (38.74–38.75) in the northern Cretan Passage in 2016/18 is closer to that in the Adriatic Sea in 2016 (38.72) than that in the Southern Aegean Sea in 2018 (39.05). A similar decrease in salinity from 2015 to 2016 has been reported for the Myrtoan basin, located in the southwestern Aegean Sea (Velaoras et al., 2017). However, the salinity increased from 2016 to 2018 in the northern Cretan Passage (Figure 8) and from 2016 to 2017 in the Myrtoan basin (Velaoras et al., 2017), reversing the trend.
It is worth noting that the change of physical properties (such as salinity, Θ and σΘ) in the northern Cretan Passage deep water after 1995 is significant while the change of CFC-12 concentrations during the same time is, in practice, small. We see no evidence of new DWF in (the surrounding of) the Aegean/Cretan Sea since the EMT event so that the new Adriatic-originated water could reach into the bottom layer of the Levantine basin, where it was detected in 2011 (Figure 10).
Although the spatial distribution of CFC-12 concentrations in the EMed in 2018 is different from that in 1987, similar CFC-12 water column gradients (bottom-to-intermediate) were found in 1987, 2011 and 2018 in the western Ionian Sea. However, the distribution of CFC-12 in 2018 is closer to the one in 1987 than that of 2011. Similarly, the distribution pattern of SF6 in 2018 is closer to that of CFC-12 concentrations in 1987 than that of SF6 concentrations in 2011. This shows a trend of water mass distributions toward a pre-EMT state that is more articulated in 2018 compared to 2011. However, the hydrographic properties are still far away from the pre-EMT condition in 2018, although the transient tracers distribution support a relaxation toward pre-EMT conditions.
Strait of Sicily
The Strait of Sicily plays a significant role in the water exchanges between EMed and WMed. Due to few transient tracer data, additional Θ–S diagrams in 1985, 1986, 1992, 1997, 1998, and 2003 (Astraldi et al., 2002; Gasparini et al., 2005) are used here to refer three different phases: before the EMT event (1985–1987), during the EMT event (1991–1993) and after the EMT event (after 1995). There is a weak trend of increasing AOU in the deep waters during the whole time-series, while the CFC-12 concentration increased together with increasing Θ and salinity. The large Θ/S increase at Strait of Sicily could be related to the propagation of EMT signal being uplifted by internal mixing, finally reaching density level able to cross the sill. This reveals that the EMed continuously influences the Strait of Sicily. The time-series is punctuated by the anomalous year 1999 with clearly more ventilated intermediate waters (low AOU and high CFC-12) characterized by low salinity and high Θ (i.e., lower density), and with less ventilated deep waters (high AOU, low CFC-12). In 2018, the CFC-12 concentrations, salinity and Θ in the Strait of Sicily bottom layer (tEMDW) are higher than those in the Ionian Sea at the same depth (Figures 6–8, 10), i.e., with lower density. This is an indication that the water in the Strait of Sicily is more impacted by the ventilation of intermediate waters than deep ones from the EMed.
Western Mediterranean Basin
The Gulf of Lions is the main source region for deep water in the WMed, but we have only two repeats of transient tracers in this region. The increased transient tracer concentrations indicate intense ventilation from 1997 to 2016. When combined with more data from the CTD and mooring in 1987, 1988, 1993, 1999 (Pinardi et al., 2015), and 2007–2013 (Houpert et al., 2016; Somot et al., 2018; Testor et al., 2018), we found mild Θ–S inversions in the 1990s, but stronger ones and even double inversions starting from the winter 2004/05, which indicates the difference before and after the WMT event in the source region.
The evolution of properties in the deep waters of the Gulf of Lions is comparable to those in the adjacent Algero-Provençal basin, the main basin in the WMed. The WMed deep water is characterized by nearly constant CFC-12 concentrations, i.e., nearly stagnant ventilation, between 1995 and 2001 followed by enhanced ventilation up to 2016 and possibly slow ventilation during the last few years of the time-series up to 2018. The recent slow ventilation could be attributed to the weakened influence of the WMT event that started in winter 2004/05. The Θ–S inversions that are tell-tale of the WMT event were found in 2011, 2016 and 2018 in the central Algerian basin and 2011 and 2018 in the western Algerian basin (Figure 13). From the mooring data at a repeat station (2800 m, 37.98°N, 4.65°E) located in the Algerian basin (Schroeder et al., 2016), the near-bottom warm and salty water intruded in 2005, and the layer below the Θ–S inversions became ∼600 m thick in 2006, ∼1000 m in 2008, > 1200 m in 2010, 1400 m in 2013, and > 1500 m in 2015, which described the uplifting old WMDW replaced by the new one from near the bottom. From the CTD data (Figure 13), the depths of inversions were all ∼1500 m in the central Algerian basin, but ∼1250 m in 2011 and ∼1500 m in 2018 in the western Algerian basin. The shallower depths of Θ–S inversions in the western Algerian in 2011 revealed the uplift of the new WMDW toward the Alboran Sea (Schroeder et al., 2008, 2010).
There is no direct deep ventilation in the Tyrrhenian Sea but the signal of ventilation is imported by advected water masses. Similar to the Algerian basin, the Tyrrhenian Deep Water (TDW) is characterized by signs of intense ventilation during the 2011–2016 period followed by a possible slowdown of the ventilation after 2016. The increased transient tracer concentrations of the bottom layer around the Sardinia Channel indicate the overflow of well-ventilated WMDW from the WMT event into the deep layer of the Tyrrhenian Sea. Another sign is the weakened intensity of the EMed influence in the intermediate layer (tEMDW and LIW). The TMZ is less-developed in the Tyrrhenian Sea than those in the western basin (Figure 13b). This situation does change with deep-water rich in CFC-12 concentrations coming from the western basin filling the Tyrrhenian Sea in the near-bottom layer. The differences in CFC-12 concentrations between the TDW and the WMDW were ∼10 ppt in 2001, ∼60 ppt in 2011, and ∼30 ppt in 2018, a development that coincides with the influenced period of the WMT event.
As the shallow sea connected the Algerian basin with the Atlantic Ocean, the Alboran Sea is characterized by well-ventilated deep water with signs of increased ventilation between 1997 and 2018, although such ventilation signal is imported by advected water masses.
Conclusion
The Mediterranean Sea is one of the best-ventilated bodies of water in the global ocean and is as such characterized by high transient tracer concentrations in the deep layer below a zone of lower tracer concentrations in the intermediate layer, the Tracer Minimum Zone (TMZ). This zone of weak ventilation stretches across the whole Mediterranean Sea from the Levantine basin into the western basin. In this study, we report on spatiotemporal variability of deep and intermediate water ventilation of the Mediterranean Sea using a 30+ year time-series of transient tracer and hydrographic observations. During this period, the effects of two “events” dominate the variability of ventilation, the Eastern Mediterranean Transition (EMT) and the Western Mediterranean Transition (WMT).
We have summarized the results and conclusions of this study and depicted the Mediterranean deep and intermediate overturning circulation in the key convective areas over time (Figure 14). In the Eastern Mediterranean Sea, the low saline and cold Adriatic Deep Water (AdDW) was the dominant source to drive the ventilation in the Eastern Mediterranean Deep Water (EMDW) before the EMT. During the EMT, the dominant source shifted to the high saline and warm Cretan Deep Water (CDW) and led to the strong ventilation in the surrounding areas such as the eastern, north-eastern and central Ionian, northern Cretan Passage and western Levantine by 1995, far-away areas such as the western and north-western Ionian and central Levantine by 1999, and farther-away area such as the Strait of Sicily by 2001. Since then, the Aegean source intensity continuously decreased. The water from the Aegean source was not dense enough to reach the bottom of the adjacent Ionian and Levantine basins in 1999 and the bottom of the northern Cretan Passage in 2011 but ventilating in the intermediate layer 1500–2500 and 1000–1500 m, respectively. When the Aegean source was weakening, the Adriatic source restarted from 1999 and became the dominant source in the 2000s and 2010s. Recently, the Adriatic source produced slightly less dense water that didn’t reach the bottom of the western Ionian but was rather ventilating the 2000–3000 m depth. In the Western Mediterranean Sea, the Western Mediterranean Deep Water (WMDW) was used to be in a steady-state ventilation scenario under the influence of deep convection in the source region, the Gulf of Lions. In the mid-2000s, the WMT event caused a near-complete renewal of WMDW. Subsequently, the deep convection intensity slowed down so that the ventilation in the WMDW weakened.
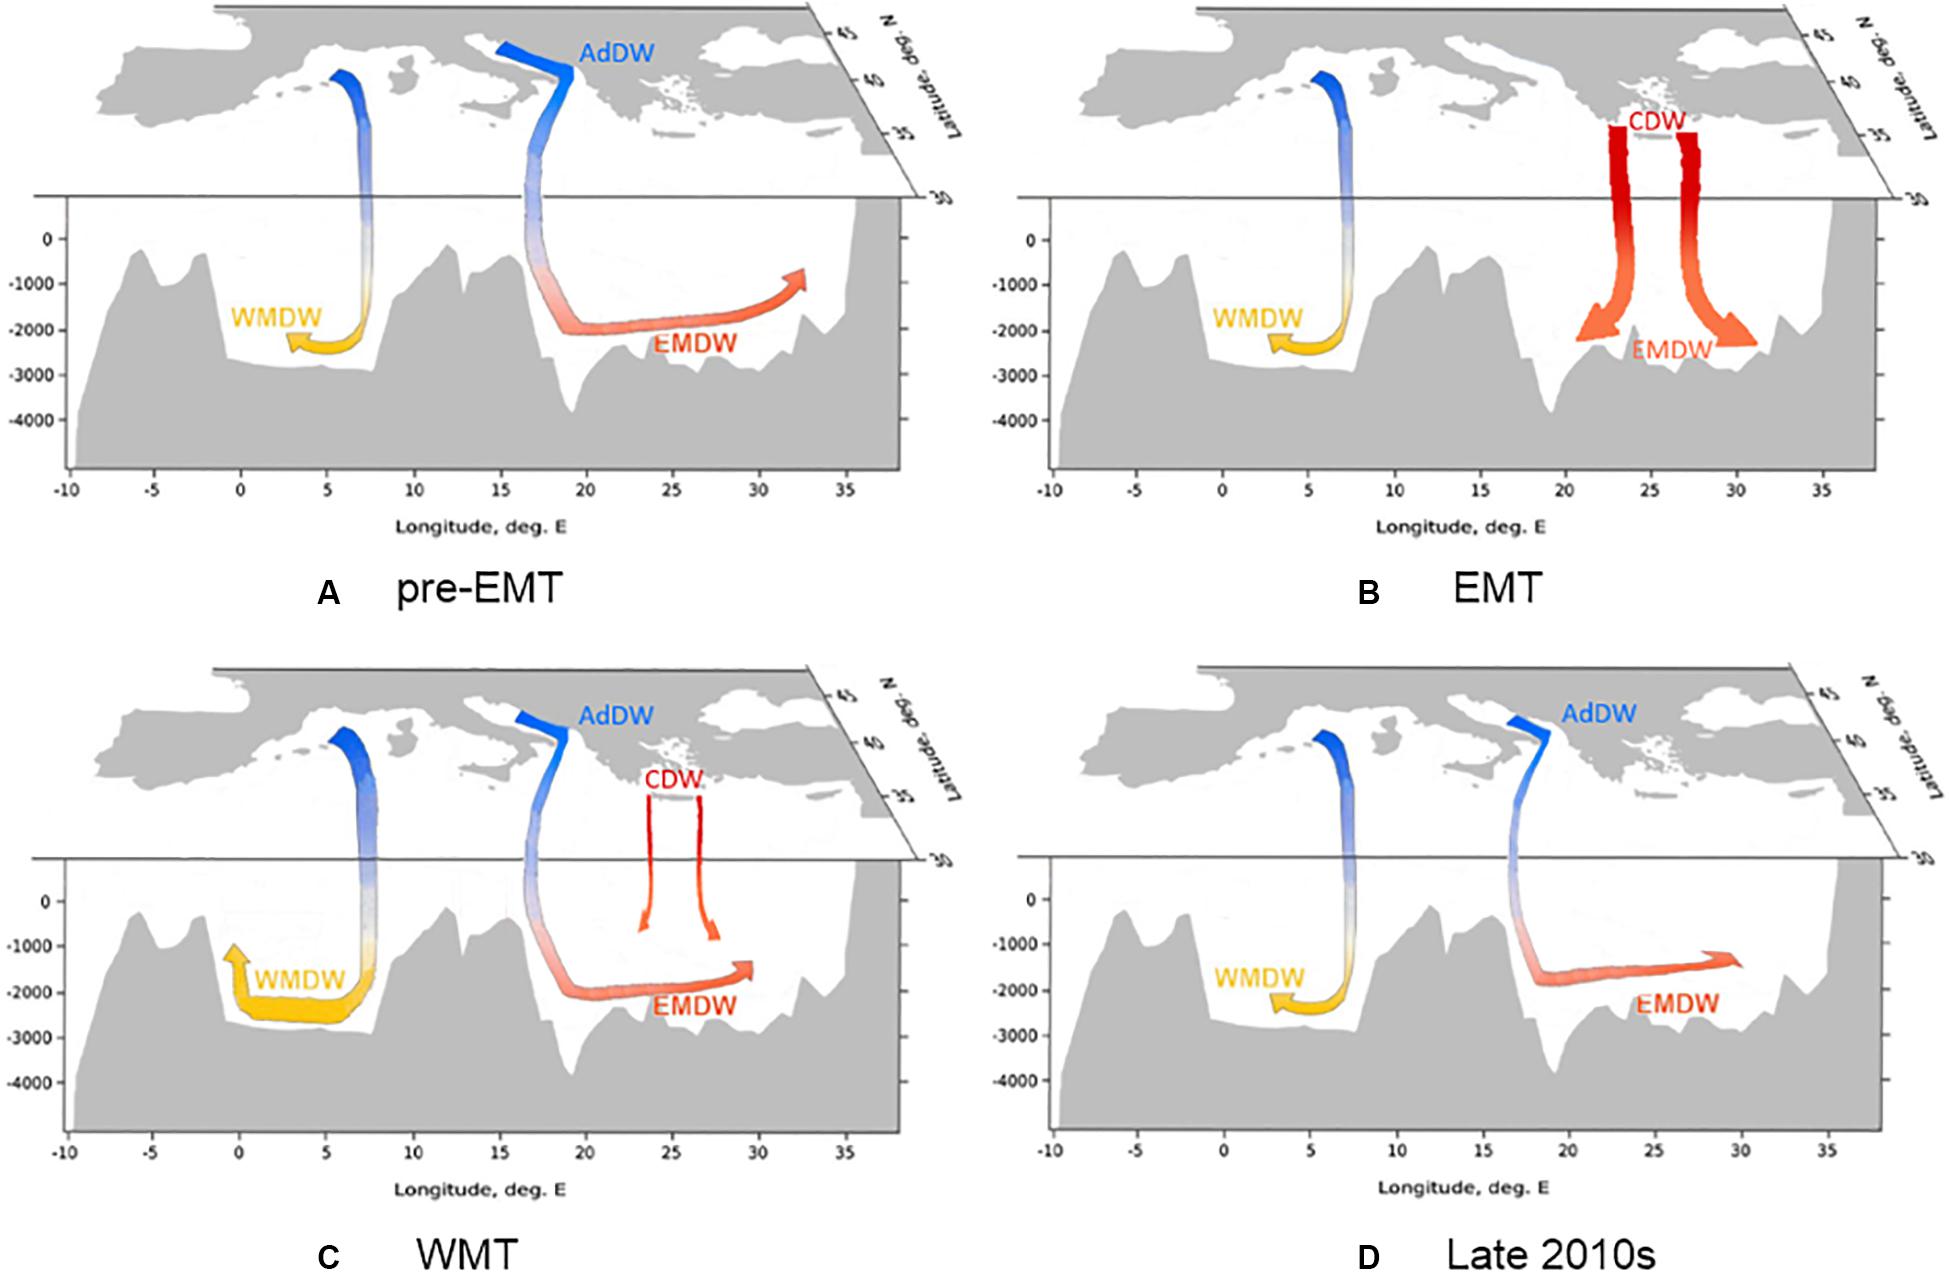
Figure 14. Schematic figures of the Mediterranean deep overturning circulation (A) before the EMT, (B) during the EMT, (C) during the WMT, and (D) in the late 2010s, which were prepared based on Hainbucher et al. (2006); Tsimplis et al. (2006), Jullion et al. (2017); Somot et al. (2018) and this study. Colors highlight the approximate change in salinity (blue = low salinity and red = high salinity). Thickness of arrows represents the approximate change in source intensity (thick = high intensity and thin = low intensity). Water masses are defined as follows: AdDW, Adriatic Deep Water; CDW Cretan Deep Water; EMDW, Eastern Mediterranean Deep Water; WMDW, Western Mediterranean Deep Water.
The combination of two (or more) transient tracers (e.g., CFC-12 and SF6) can better constrain ventilation. In particular, considering the decreasing CFC-12 and increasing SF6 atmospheric concentrations, the ability of CFC-12 alone in interpreting ventilation in the Mediterranean Sea is decreasing, while SF6 is able to deliver information of ventilation and changes in ventilation. The complicated and variable ventilation of the Mediterranean Sea would benefit from an expanding suite of transient tracers. For instance, does a range of halogenated CFC replacement compound constitute possible additional tracers (Li et al., 2019; Li and Tanhua, 2019) or the isotope 39Ar (Ebser et al., 2018) that can be used to better constrain the Transit Time Distributions as a measure of ventilation (Stöven and Tanhua, 2014). For the Mediterranean Sea, other models without the assumption of steady-state ventilation (as the Transit Time Distribution does) should be considered in the future based on its high variable ventilation patterns.
Data Availability Statement
Cruise data in Table 1 in 1987–2011 are from https://www.nodc. noaa.gov/ocads/oceans/Coastal/Meteor_Med_Sea.html. Obser- vations of CFC-12 and SF6 from cruises ESAW2 and CRELEV2016 are available on request to the corresponding author. Observations of CFC-12 and SF6 from cruises TALPro2016 and MSM72 are available from https://cchdo. ucsd.edu/cruise/29AJ20160818 and https://cchdo.ucsd.edu/cruise/06M220180302.
Author Contributions
PL performed the data processing, contributed figures and tables, and wrote the manuscript. TT conducted the sampling from cruises ESAW2, CRELEV2016, TALPro2016, and MSM72 and supported the writing process. Both authors contributed to the article and approved the submitted version.
Funding
The service charges for this open access publication have been covered by a Research Centre of the Helmholtz Association.
Conflict of Interest
The authors declare that the research was conducted in the absence of any commercial or financial relationships that could be construed as a potential conflict of interest.
Acknowledgments
We acknowledge the great support by the scientists and crew from expeditions M5/6, M31/1, Ura2, P234, Aegaeo98, Ura7, M44/4, M51/2, M84/3, ESAW2, CRELEV2016, TALPro2016, and MSM72. We thank Dr. Tim Stöven for his instructions on some MATLAB scripts. We gratefully thank support through the scholarship program from the China Scholarship Council (CSC). We also thank reviewers for their valuable suggestions.
Supplementary Material
The Supplementary Material for this article can be found online at: https://www.frontiersin.org/articles/10.3389/fmars.2020.00594/full#supplementary-material
References
Akpinar, A., Yilmaz, E., Fach, B., and Salihoglu, B. (2016). “Physical oceanography of the Eastern Mediterranean Sea,” in The Turkish Part of the Mediterranean Sea, eds K. Turan, B. Salihoglu, E. O. Ozbek, and B. Ozturk (Turkey: Turkish Marine Research Foundation), 1–14.
Artegiani, A., Paschini, E., Russo, A., Bregant, D., Raicich, F., and Pinardi, N. (1996a). The Adriatic Sea general circulation. Part I: air–sea interactions and water mass structure. J. Phys. Oceanogr. 27, 1492–1514. doi: 10.1175/1520-0485(1997)027<1492:tasgcp>2.0.co;2
Artegiani, A., Paschini, E., Russo, A., Bregant, D., Raicich, F., and Pinardi, N. (1996b). The Adriatic Sea general circulation. Part II: baroclinic circulation structure. J. Phys. Oceanogr. 27, 1515–1532. doi: 10.1175/1520-0485(1997)027<1515:tasgcp>2.0.co;2
Astraldi, M., Gasparini, G., Sparnocchia, S., Moretti, M., and Sansone, E. (1996). The characteristics of the water masses and the water transport in the Sicily Strait at long time scales. Bull. de l’Institut Océanogr. 95–116.
Astraldi, M., Gasparini, G., Vetrano, A., and Vignudelli, S. (2002). Hydrographic characteristics and interannual variability of water masses in the central Mediterranean: a sensitivity test for long-term changes in the Mediterranean Sea. Deep Sea Res. I Oceanogr. Res. Pap. 49, 661–680. doi: 10.1016/s0967-0637(01)00059-0
Buffett, G. G., Krahmann, G., Klaeschen, D., Schroeder, K., Sallares, V., Papenberg, C., et al. (2017). Seismic oceanography in the Tyrrhenian Sea: thermohaline staircases, eddies, and internal waves. J. Geophys. Res. Oceans 122, 8503–8523. doi: 10.1002/2017jc012726
Cardin, V., Civitarese, G., Hainbucher, D., Bensi, M., and Rubino, A. (2015). Thermohaline properties in the Eastern Mediterranean in the last three decades: is the basin returning to the pre-EMT situation? Ocean Sci. 11, 53–66. doi: 10.5194/os-11-53-2015
Chiggiato, J., Bergamasco, A., Borghini, M., Falcieri, F. M., Falco, P., Langone, L., et al. (2016). Dense-water bottom currents in the Southern Adriatic Sea in spring 2012. Mar. Geol. 375, 134–145. doi: 10.1016/j.margeo.2015.09.005
Durrieu de Madron, X., Houpert, L., Puig, P., Sanchez-Vidal, A., Testor, P., Bosse, A., et al. (2013). Interaction of dense shelf water cascading and open-sea convection in the northwestern Mediterranean during winter 2012. Geophys. Res. Lett. 40, 1379–1385. doi: 10.1002/grl.50331
Ebser, S., Kersting, A., Stöven, T., Feng, Z., Ringena, L., Schmidt, M., et al. (2018). 39Ar dating with small samples provides new key constraints on ocean ventilation. Nat. Commun. 9:5046.
Gačić, M., Civitarese, G., Kovačević, V., Ursella, L., Bensi, M., Menna, M., et al. (2014). Extreme winter 2012 in the Adriatic: an example of climatic effect on the BiOS rhythm. Ocean Sci. 10, 513–522. doi: 10.5194/os-10-513-2014
Gasparini, G., Ortona, A., Budillon, G., Astraldi, M., and Sansone, E. (2005). The effect of the Eastern Mediterranean Transient on the hydrographic characteristics in the Strait of Sicily and in the Tyrrhenian Sea. Deep Sea Res. I Oceanogr. Res. Pap. 52, 915–935. doi: 10.1016/j.dsr.2005.01.001
Hainbucher, D., Álvarez, M., Astray, B., Bachi, G., Cardin, V., Celentano, P., et al. (2019). Variability and Trends in Physical and Biogeochemical Parameters of the Mediterranean Sea, Cruise No. MSM72, March 02, 2018 - April 03, 2018, Iraklion (Greece) - Cádiz (Spain), MED-SHIP2. Bremen: Gutachterpanel Forschungsschiffe.
Hainbucher, D., Rubino, A., and Klein, B. (2006). Water mass characteristics in the deep layers of the western Ionian Basin observed during May 2003. Geophys. Res. Lett. 33:L05608.
Hall, T. M., and Plumb, R. A. (1994). Age as a diagnostic of stratospheric transport. J. Geophys. Res. Atmos. 99, 1059–1070.
Hemleben, C. (1996). Oestliches Mittelmeer, Rotes Meer, Arabisches Meer: Cruise No. 31; 30 December 1994-1922 March 1995. Hamburg: Universität Hamburg.
Hemleben, C., Hoernle, K., Jørgensen, B., and Roether, W. (2003). Ostatlantik, Mittelmeer, Schwarzes Meer, Cruise No. 51, 12 September-28 December 2001. Hamburg: Universität Hamburg.
Houpert, L., Durrieu De Madron, X., Testor, P., Bosse, A., D’ortenzio, F., Bouin, M.-N., et al. (2016). Observations of open-ocean deep convection in the northwestern Mediterranean Sea: seasonal and interannual variability of mixing and deep water masses for the 2007–2013 period. J. Geophys. Res. Oceans 121, 8139–8171. doi: 10.1002/2016jc011857
Jullion, L. (2016). TAlPro-2016: A Tyrrhenian Sea & Alger-provencal component of the MedSHIP Programme, RV Angeles Alvariño, 18/08/16 - 29/08/16, Palermo (Italy) - Barcelona (Spain), Bremerhaven, EUROFLEETS2 Cruise Summary Report. Available: hdl:10013/epic.5a866780-1f8a-45cf-8111-47b2b5dc29db (accessed September 20, 2019).
Jullion, L., Jacquet, S., and Tanhua, T. (2017). Untangling biogeochemical processes from the impact of ocean circulation: first insight on the Mediterranean dissolved barium dynamics. Glob. Biogeochem. Cycles 31, 1256–1270. doi: 10.1002/2016gb005489
Khatiwala, S., Primeau, F., and Holzer, M. (2012). Ventilation of the deep ocean constrained with tracer observations and implications for radiocarbon estimates of ideal mean age. Earth Planet. Sci. Lett. 325, 116–125. doi: 10.1016/j.epsl.2012.01.038
Klein, B., Roether, W., Civitarese, G., Gacic, M., Manca, B. B., and D’alcala, M. R. (2000). Is the Adriatic returning to dominate the production of Eastern Mediterranean deep water? Geophys. Res. Lett. 27, 3377–3380. doi: 10.1029/2000gl011620
Klein, B., Roether, W., Manca, B. B., Bregant, D., Beitzel, V., Kovacevic, V., et al. (1999). The large deep water transient in the Eastern Mediterranean. Deep Sea Res. I Oceanogr. Res. Pap. 46, 371–414. doi: 10.1016/s0967-0637(98)00075-2
Lascaratos, A., Roether, W., Nittis, K., and Klein, B. (1999). Recent changes in deep water formation and spreading in the eastern Mediterranean Sea: a review. Prog. Oceanogr. 44, 5–36. doi: 10.1016/s0079-6611(99)00019-1
Li, P., Mühle, J., Montzka, S. A., Oram, D. E., Miller, B. R., Weiss, R. F., et al. (2019). Atmospheric histories, growth rates and solubilities in seawater and other natural waters of the potential transient tracers HCFC-22, HCFC-141b, HCFC-142b, HFC-134a, HFC-125, HFC-23, PFC-14 and PFC-116. Ocean Sci. 15, 33–60. doi: 10.5194/os-15-33-2019
Li, P., and Tanhua, T. (2019). Medusa-Aqua system: simultaneous measurement and evaluation of novel potential halogenated transient tracers HCFCs, HFCs and PFCs in the ocean. Ocean Sci. Discuss. 2019, 1–34.
Luyten, J., Pedlosky, J., and Stommel, H. (1983). The ventilated thermocline. J. Phys. Oceanogr. 13, 292–309.
Malanotte-Rizzoli, P., and Hecht, A. (1988). Large-scale properties of the Eastern Mediterranean: a review. Oceanol. Acta 11, 323–335.
Malanotte-Rizzoli, P., and Robinson, A. R. (1988). POEM: physical oceanography of the eastern Miditerranean. EOS Trans. Am. Geophys. Union 69, 194–203.
Manca, B., Kovaĉević, V., Gaĉić, M., and Viezzoli, D. (2002). Dense water formation in the Southern Adriatic Sea and spreading into the Ionian Sea in the period 1997-1999. J. Mar. Syst. 3, 133–154. doi: 10.1016/s0924-7963(02)00056-8
Manca, B. B., Ibello, V., Pacciaroni, M., Scarazzato, P., and Giorgetti, A. (2006). Ventilation of deep waters in the Adriatic and Ionian Seas following changes in thermohaline circulation of the Eastern Mediterranean. Clim. Res. 31, 239–256. doi: 10.3354/cr031239
Marshall, J., and Schott, F. (1999). Open-ocean convection: observations, theory, and models. Rev. Geophys. 37, 1–64. doi: 10.1029/98rg02739
Nellen, W., Bettac, W., Roether, W., Schnack, D., Thiel, H., Weikert, H., et al. (1996). MINDIK (Band II), Reise Nr. 5, 2 January-24 September 1987. Hamburg: Universitat Hamburg.
Pätzold, J. (2000). Östliches Mittelmeer-Nördliches Rotes Meer 1999: Cruise No. 44, 22 January-16 May 1999. Hamburg: Universität Hamburg.
Pinardi, N., Zavatarelli, M., Adani, M., Coppini, G., Fratianni, C., Oddo, P., et al. (2015). Mediterranean Sea large-scale low-frequency ocean variability and water mass formation rates from 1987 to 2007: a retrospective analysis. Prog. Oceanogr. 132, 318–332. doi: 10.1016/j.pocean.2013.11.003
Rhein, M., Send, U., Klein, B., and Krahmann, G. (1999). Interbasin deep water exchange in the western Mediterranean. J. Geophys. Res. Oceans 104, 23495–23508. doi: 10.1029/1999jc900162
Roether, W., Klein, B., Beitzel, V., and Manca, B. B. (1998). Property distributions and transient-tracer ages in Levantine Intermediate Water in the Eastern Mediterranean. J. Mar. Syst. 18, 71–87. doi: 10.1016/s0924-7963(98)00006-2
Roether, W., Klein, B., and Hainbucher, D. (2014). The Eastern Mediterranean Transient: evidence for similar events previously. Mediterranean Sea Temp. Variabil. Spat. Patt. 202, 75–83. doi: 10.1002/9781118847572.ch6
Roether, W., Klein, B., Manca, B. B., Theocharis, A., and Kioroglou, S. (2007). Transient Eastern Mediterranean deep waters in response to the massive dense-water output of the Aegean Sea in the 1990s. Prog. Oceanogr. 74, 540–571. doi: 10.1016/j.pocean.2007.03.001
Roether, W., Manca, B. B., Klein, B., Bregant, D., Georgopoulos, D., Beitzel, V., et al. (1996). Recent changes in eastern Mediterranean deep waters. Science 271, 333–335. doi: 10.1126/science.271.5247.333
Rubino, A., and Hainbucher, D. (2007). A large abrupt change in the abyssal water masses of the eastern Mediterranean. Geophys. Res. Lett. 34:L23607.
Šantić, D., Kovačević, V., Bensi, M., Giani, M., Vrdoljak Tomaš, A., Ordulj, M., et al. (2019). Picoplankton distribution and activity in the deep waters of the Southern Adriatic Sea. Water 11:1655. doi: 10.3390/w11081655
Schlitzer, R., Roether, W., Oster, H., Junghans, H.-G., Hausmann, M., Johannsen, H., et al. (1991). Chlorofluoromethane and oxygen in the Eastern Mediterranean. Deep Sea Res. A Oceanogr. Res. Pap. 38, 1531–1551. doi: 10.1016/0198-0149(91)90088-w
Schneider, A., Tanhua, T., Körtzinger, A., and Wallace, D. W. R. (2010). High anthropogenic carbon content in the eastern Mediterranean. J. Geophys. Res. 115:C12050.
Schneider, A., Tanhua, T., Roether, W., and Steinfeldt, R. (2014). Changes in ventilation of the Mediterranean Sea during the past 25 year. Ocean Sci. 10, 1–16. doi: 10.5194/os-10-1-2014
Schroeder, K., Chiggiato, J., Bryden, H., Borghini, M., and Ismail, S. B. (2016). Abrupt climate shift in the Western Mediterranean Sea. Sci. Rep. 6:23009.
Schroeder, K., Gasparini, G., Tangherlini, M., and Astraldi, M. (2006). Deep and intermediate water in the western Mediterranean under the influence of the Eastern Mediterranean Transient. Geophys. Res. Lett. 33:L21607.
Schroeder, K., Josey, S., Herrmann, M., Grignon, L., Gasparini, G., and Bryden, H. (2010). Abrupt warming and salting of the Western Mediterranean Deep Water after 2005: atmospheric forcings and lateral advection. J. Geophys. Res. Oceans 115:C08029.
Schroeder, K., Ribotti, A., Borghini, M., Sorgente, R., Perilli, A., and Gasparini, G. (2008). An extensive western Mediterranean deep water renewal between 2004 and 2006. Geophys. Res. Lett. 35:L18605.
Schroeder, K., Tanhua, T., Bryden, H. L., Alvarez, M., Chiggiato, J., and Aracri, S. (2015). Mediterranean sea ship-based hydrographic investigations program (Med-SHIP). Oceanography 28, 12–15. doi: 10.5670/oceanog.2015.71
Somot, S., Houpert, L., Sevault, F., Testor, P., Bosse, A., Taupier-Letage, I., et al. (2018). Characterizing, modelling and understanding the climate variability of the deep water formation in the North-Western Mediterranean Sea. Clim. Dyn. 51, 1179–1210. doi: 10.1007/s00382-016-3295-0
Sparnocchia, S., Gasparini, G., Astraldi, M., Borghini, M., and Pistek, P. (1999). Dynamics and mixing of the Eastern Mediterranean outflow in the Tyrrhenian basin. J. Mar. Syst. 20, 301–317. doi: 10.1016/s0924-7963(98)00088-8
Stöven, T., and Tanhua, T. (2014). Ventilation of the Mediterranean Sea constrained by multiple transient tracer measurements. Ocean Sci. 10, 439–457. doi: 10.5194/os-10-439-2014
Tanhua, T., Hainbucher, D., Schroeder, K., Cardin, V., Álvarez, M., and Civitarese, G. (2013a). The Mediterranean Sea system: a review and an introduction to the special issue. Ocean Sci. 9, 789–803. doi: 10.5194/os-9-789-2013
Tanhua, T., Van Heuven, S., Key, R. M., Velo, A., Olsen, A., and Schirnick, C. (2010). Quality control procedures and methods of the CARINA database. Earth Syst. Sci. Data 2, 35–49. doi: 10.5194/essd-2-35-2010
Tanhua, T., Waugh, D. W., and Bullister, J. L. (2013b). Estimating changes in ocean ventilation from early 1990s CFC-12 and late 2000s SF6 measurements. Geophys. Res. Lett. 40, 927–932. doi: 10.1002/grl.50251
Testor, P., Bosse, A., Houpert, L., Margirier, F., Mortier, L., Legoff, H., et al. (2018). Multiscale observations of deep convection in the northwestern Mediterranean Sea during winter 2012–2013 using multiple platforms. J. Geophys. Res. Oceans 123, 1745–1776. doi: 10.1002/2016jc012671
Theocharis, A., Klein, B., Nittis, K., and Roether, W. (2002). Evolution and status of the Eastern Mediterranean Transient (1997-1999). J. Mar. Syst. 33, 91–116. doi: 10.1016/s0924-7963(02)00054-4
Tsimplis, M. N., Zervakis, V., Josey, S. A., Peneva, E. L., Struglia, M. V., Stanev, E. V., et al. (2006). “Changes in the oceanography of the Mediterranean Sea and their link to climate variability,” in Developments in Earth and Environmental Sciences, eds P. Lionello, P. Malanotte-Rizzoli, and R. Boscolo (Amsterdam: Elsevier), 227–282. doi: 10.1016/s1571-9197(06)80007-8
Velaoras, D., Krokos, G., Nittis, K., and Theocharis, A. (2014). Dense intermediate water outflow from the Cretan Sea: a salinity driven, recurrent phenomenon, connected to thermohaline circulation changes. J. Geophys. Res. Oceans 119, 4797–4820. doi: 10.1002/2014jc009937
Velaoras, D., Papadopoulos, V. P., Kontoyiannis, H., Cardin, V., and Civitarese, G. (2018). Water masses and hydrography during April and June 2016 in the Cretan Sea and Cretan Passage (Eastern Mediterranean Sea). Deep Sea Res. II Top. Stud. Oceanogr. 164, 25–40. doi: 10.1016/j.dsr2.2018.09.005
Velaoras, D., Papadopoulos, V. P., Kontoyiannis, H., Papageorgiou, D. K., and Pavlidou, A. (2017). The response of the Aegean Sea (eastern Mediterranean) to the extreme 2016-2017 winter. Geophys. Res. Lett. 44, 9416–9423. doi: 10.1002/2017gl074761
Keywords: Mediterranean Sea, ventilation, transient tracer, CFC-12, SF6
Citation: Li P and Tanhua T (2020) Recent Changes in Deep Ventilation of the Mediterranean Sea; Evidence From Long-Term Transient Tracer Observations. Front. Mar. Sci. 7:594. doi: 10.3389/fmars.2020.00594
Received: 30 March 2020; Accepted: 29 June 2020;
Published: 22 July 2020.
Edited by:
Nadia Lo Bue, National Earthquake Observatory (INGV), ItalyReviewed by:
Darryn Waugh, Johns Hopkins University, United StatesAnthony Bosse, Aix-Marseille Université, France
Copyright © 2020 Li and Tanhua. This is an open-access article distributed under the terms of the Creative Commons Attribution License (CC BY). The use, distribution or reproduction in other forums is permitted, provided the original author(s) and the copyright owner(s) are credited and that the original publication in this journal is cited, in accordance with accepted academic practice. No use, distribution or reproduction is permitted which does not comply with these terms.
*Correspondence: Toste Tanhua, ttanhua@geomar.de