Barkley Canyon Gas Hydrates: A Synthesis Based on Two Decades of Seafloor Observation and Remote Sensing
 M. Riedel1*
  M. Scherwath2
  M. Römer3
  C. K. Paull4
  E. M. Lundsten4
  D. Caress4
  P. G. Brewer4
  J. W. Pohlman5
  L. L. Lapham6 N. R. Chapman7
  M. J. Whiticar7 G. D. Spence7
  R. J. Enkin8 K. Douglas8
- 1GEOMAR Helmholtz Centre for Ocean Research Kiel, Kiel, Germany
- 2Ocean Networks Canada, University of Victoria, Victoria, BC, Canada
- 3MARUM - Center for Environmental Sciences and Department of Geosciences at the University of Bremen, Bremen, Germany
- 4Monterey Bay Aquarium Research Institute, Moss Landing, CA, United States
- 5U.S. Geological Survey, Woods Hole Coastal and Marine Science Center, Woods Hole, MA, United States
- 6University of Maryland Center for Environmental Science, Chesapeake Biological Laboratory, Solomons, MD, United States
- 7School of Earth and Ocean Sciences, University of Victoria, Victoria, BC, Canada
- 8Geological Survey of Canada, Pacific, Victoria, BC, Canada
Barkley Canyon is one of the few known sites worldwide with the occurrence of thermogenic gas seepage and formation of structure-II and structure-H gas hydrate mounds on the seafloor. This site is the location of continuous seafloor monitoring as part of the Ocean Networks Canada (ONC) cabled observatory off the west coast off Vancouver Island, British Columbia, Canada. We combine repeat remotely operated vehicle (ROV) seafloor video observations, mapping with an autonomous underwater vehicle (AUV), ship-, ROV-, and AUV-based identification of gas flares, as well as seismic and Chirp data to investigate the distribution of fluid migration pathways. Geologically, the site with the prominent gas hydrate mounds and associated fluid seepage is covering an area of ∼0.15 km2 and is situated on a remnant of a rotated fault block that had slipped off the steep flanks of the north-east facing canyon wall. The gas hydrate mounds, nearly constant in dimension over the entire observation period, are associated with gas and oil seepage and surrounded by debris of chemosynthetic communities and authigenic carbonate. The formation of gas hydrate at and near the seafloor requires additional accommodation space created by forming blisters at the seafloor that displace the regular sediments. An additional zone located centrally on the rotated fault block with more diffuse seepage (∼0.02 km2 in extent) has been identified with no visible mounds, but with bacterial mats, small carbonate concretions, and clam beds. Gas venting is seen acoustically in the water column up to a depth of ∼300 m. However, acoustic water-column imaging during coring and ROV dives showed rising gas bubbles to much shallower depth, even <50 m, likely a result of degassing of rising oil droplets, which themselves cannot be seen acoustically. Combining all observations, the location of the gas hydrate mounds is controlled by a combination of fault-focused fluid migration from a deeper reservoir and fluid seepage along more permeable strata within the rotated slope block. Fluids must be provided continuously to allow the sustained presence of the gas hydrate mounds at the seafloor.
Introduction and Geological Background
Gas hydrates (clathrates) are solid substances composed of an assemblage of rigid cages of water molecules that enclose molecules of natural gas (Sloan and Koh, 2008). Due to their dependency on high pressure and low temperature regimes for stability, natural occurrences of gas hydrates are limited to continental slopes (>∼ 500 m, e.g., McIver, 1981; Klauda and Sandler, 2005) or polar terrestrial regions in association with permafrost (e.g., Ruppel, 2007, 2015). Depending on the type of gas molecule trapped, natural gas hydrates occur in three types of structures: structure-I (s-I) is associated with mostly methane as the guest molecule, structure-II (s-II) and structure-H (s-H) occur if larger molecules (ethane, propane, etc.) are incorporated into the water cages (Sloan and Koh, 2008). Estimates of the amount of carbon sequestered by natural gas hydrate globally range over four orders of magnitude from as low as ∼0.2 × 10¹⁵ m3 (100 Gt carbon; Soloviev, 2002) to as high as ∼3,000 × 1015 m3 (1.6 × 10⁶ Gt carbon, Trofimuk et al., 1973). A complete historic evolution of all global estimates from the early 1970s until 2010 was summarized by Boswell and Collett (2011) who also highlighted the current scientific advances made in assessing the technically recoverable fraction of methane from hydrates as an energy resource. The global recoverable volumes of methane from hydrate were estimated to be in the order of ∼3 × 10¹³ m3, or an equivalent 1.5 × 10³ Gt of carbon (Boswell and Collett, 2011). Additional estimates of the total amount of methane found in gas hydrates was provided in a review by Ruppel and Kessler (2017).
Because methane bound by gas hydrate is a potent greenhouse gas with a warming potential 25 times greater than CO2 over a 100-years time span, transferring a portion of gas hydrate methane to the atmosphere has the potential to enhance global warming (e.g., Kennett et al., 2003; Buffett and Archer, 2004; Archer et al., 2009). However, presently there is no evidence for a significant atmospheric contribution from gas hydrate (Ruppel and Kessler, 2017).
Most naturally occurring marine gas hydrate accumulations are formed from gas generated during the microbially-mediated biodegradation of sediment organic matter and petroleum at temperatures typically below 80°C and depths less than 2 km from the seafloor (e.g., Kvenvolden and McMenamin, 1980; Kvenvolden, 1988; Milkov, 2005; Ruppel and Kessler, 2017). Only a few sites are known worldwide, where gas hydrates contain significant amounts of thermogenic hydrocarbons formed during the breakdown of organic matter at higher temperature (typically above 150°C) and greater depth (>5 km below the seafloor). Examples of settings with thermogenic gas hydrate are within the Gulf of Mexico (e.g., Brooks et al., 1984; Sassen and MacDonald, 1994, 1999, 2001; MacDonald et al., 2003), the Gumusut-Kakap province off Borneo (e.g., Paganoni et al., 2016), near the Eel Canyon of Northern California (e.g., Gwiazda et al., 2016) and Barkley Canyon (e.g., Pohlman et al., 2005), which is the focus of this study. There are also suggestions of potential combinations of microbial and thermogenic contributions to gas hydrate accumulations, such as off the Falkland Islands (Foschi et al., 2019), off New Zealand (Kroeger et al., 2015), or at the Umitaka Spur, Japan Sea (Lu et al., 2008; Freire et al., 2011). Microbial and thermogenic gases are typically distinguished by the carbon (13C/12C) and hydrogen (D/H) stable isotope ratios of methane and the molecular and isotopic composition of associated gases. Microbial gases are predominantly methane that is enriched with 12C and H, while thermogenic gases consist of methane enriched with 13C isotope as well higher hydrocarbons (C2-C5) formed during the thermal breakdown of organic matter (Bernard et al., 1976; Whiticar et al., 1986; Whiticar, 1999). However, these generalizations are viewed as guidelines. Recent reviews and studies have shown the boundaries for gas classification overlap (e.g., Milkov and Etopie, 2018; Whiticar 2021), making interpretation of gas sources more complex.
Remote detection of natural gas hydrates in sediments along continental margins is often suggested based on the identification of a bottom-simulating reflector (BSR) in seismic reflection data (e.g., Shipley et al., 1979; Hyndman and Spence, 1992; Holbrook, 2001). The BSR in general marks the base of the gas hydrate stability zone and free gas occurrences underneath. This results in a reflection polarity opposite to the seafloor from the velocity inversion at this interface (e.g., Haacke et al., 2007; Spence et al., 2010). At some gas hydrate occurrences with a thermogenic gas contribution, a second (deeper) BSR at the base of the structure-II gas hydrates has been observed (e.g., Laird and Morley, 2011; Paganoni et al., 2016; Qian et al., 2018). Other incidences of multiple BSRs have been attributed to paleo climate conditions linked to glacial-interglacial variations in sea level and sea bottom temperature (e.g., Bangs et al., 2005; Auguy et al., 2017; Zander et al., 2017), or possibly channel migration and/or erosion (e.g., Hornbach et al., 2003; Zhang et al., 2020), or uplift from tectonic forces (e.g., Foucher et al., 2002; Pecher et al., 2014).
Natural gas hydrates were first suggested to occur within the accretionary prism sediments of the northern Cascadia margin based on BSRs seen in regional multichannel seismic (MCS) reflection data (Spence et al., 1991; Hyndman and Davis, 1992; Hyndman and Spence, 1992). This early discovery was followed up by numerous additional conventional and high-frequency deep-towed seismic (Chapman et al., 2002), heat-flow, and electromagnetic investigations to describe the regional distribution of gas hydrates along the margin (see summaries and references in Spence et al., 2000; Hyndman et al., 2001; Riedel et al., 2022). In addition, scientific drilling, coring, and logging was conducted during Ocean Drilling Program (ODP) Leg 146 (Westbrook et al., 1994) and Integrated Ocean Drilling Program Expedition 311 (Riedel et al., 2006a, 2010b; Pohlman et al., 2009) describing the gas hydrate system across the prism. A more recent focus of gas hydrate-related scientific studies off northern Cascadia is on cold vent systems and gas venting (e.g., Riedel et al., 2006b; Lapham et al., 2013; Pohlman et al., 2013; Wilson et al., 2015; Römer et al., 2016; Riedel et al., 2018; Scherwath et al., 2019). Cold seep systems are observed worldwide along active and passive continental margins (e.g., Suess, 2014 and references therein). These systems are inherently heterogenous and exhibit a high degree of variability (in space and time) of the abundance and types of chemo-synthetic communities and venting-associated seafloor morphologies (e.g., Paull et al., 2015 and references therein).
One of the most intensely studied seep-sites along the northern Cascadia margin is located within Barkley Canyon (Figure 1), where massive seafloor outcrops of gas hydrate are located in water depths of ∼860 m. The site itself was found when an estimated 1.5 ton of solid gas hydrate was dredged off the seafloor by a fishing trawler in November 2000 (Spence et al., 2001a). Shortly after this discovery, dives with the ROV ROPOS (Remotely Operated Platform for Ocean Science) confirmed the occurrence of large mounds of solid gas hydrate on the seafloor (Chapman et al., 2004). Work on samples recovered from these early dives revealed that the site is unique, in that it is a location with thermogenic gas hydrate occurrences (Pohlman et al., 2005), the only known site to date off northern Cascadia. Furthermore, pore-water analyses from sediment push cores recovered near the mounds indicated very high fluid flux and shallow depths of the sulfate-methane interface (Lapham et al., 2010; Pohlman et al., 2011). Detailed geochemical analyses on hydrate samples collected, further recognized that the mounds contain not only s-II, but also s-H gas hydrate (Lu et al., 2007).
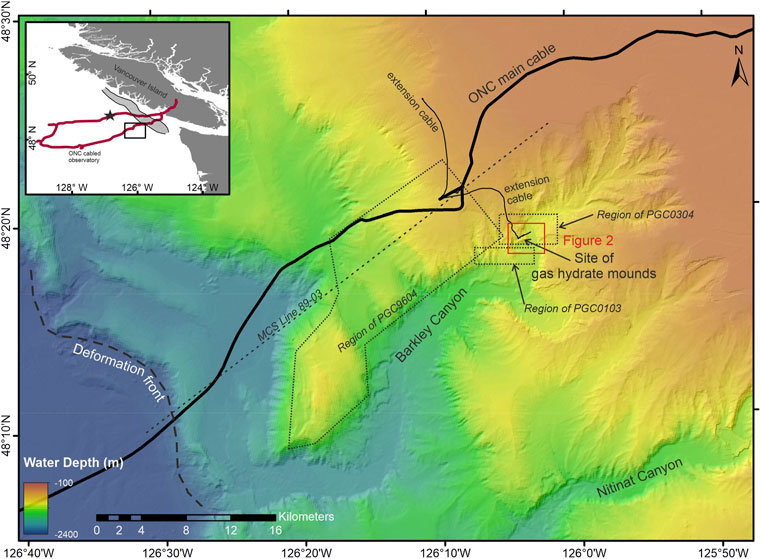
FIGURE 1. Location of the study site with gas hydrate mounds at the Ocean Networks Canada cabled observatory. Location of two survey with densely spaced 2D seismic lines (PGC9604, PGC0103, PGC0304) are shown as dotted polygons. The location of regional seismic line 89–03 is shown by a dashed line. The site of the gas hydrate mounds is highlighted in Figure 2. Inset shows the location of the study region off Vancouver Island, British Columbia, Canada, with the ONC cable (red line) and the approximate extent of the Tofino Basin as hashed-region. Other vent locations used for comparison are at the Clayoquot slope node of the ONC cable, indicted by the black star.
The monitoring of these mounds within this gas hydrate rich environment became a focus for the Ocean Networks Canada (ONC) cabled underwater observatory (Barnes et al., 2011) studies. The first reconnaissance ROV survey by ONC was conducted in 2006 with the ROV ROPOS (Dive R0996) as part of the initial route-survey. Since then, numerous additional dives with different ROVs have been conducted by ONC and the Monterey Bay Aquarium Research Institute (MBARI), out of which we used 57 dives to investigate the seafloor environment (Supplementary Table S1). In addition, three expeditions using the ROVs Tiburon and Doc Ricketts from MBARI were conducted in 2006, 2009, and 2011. The gas hydrate mounds and seepage system became the target of several monitoring experiments operated by ONC, including the use of a remotely operated crawler, called Wally (Thomsen et al., 2012). A dedicated survey to map the seafloor around the gas hydrate mounds was conducted in 2009 (Figure 2) with an autonomous underwater vehicle (AUV). The multibeam data revealed details of the seafloor morphology with a horizontal resolution of ∼1 m (e.g., Paull et al., 2015).
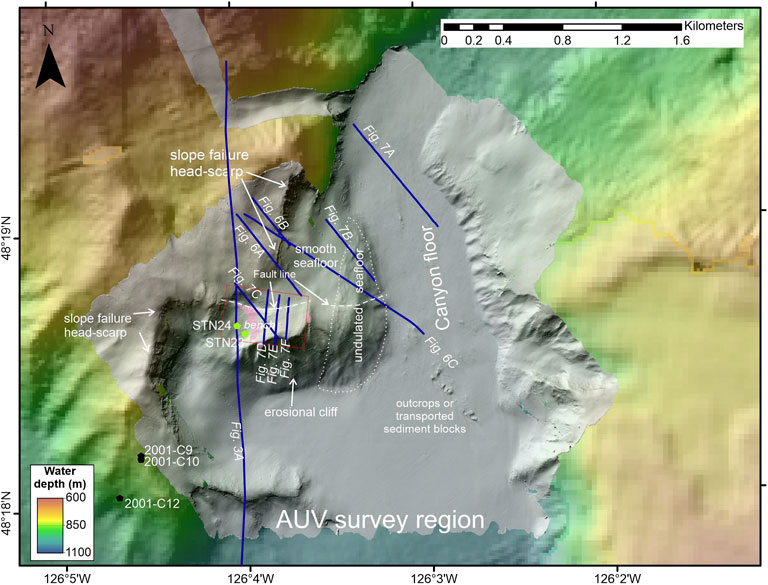
FIGURE 2. Area mapped with AUV multibeam at 150 m line spacing shown with grey shading. AUV line spacing was reduced to 25 m to cover a small area with more closely spaced Chirp lines (rectangular region outlined with a red dotted line). Locations of gas hydrate mounds are highlighted with pink-shaded transparent polygons on top of the bathymetric bench. Location of seismic and AUV Chirp data shown in subsequent figures are indicated by blue lines. Core locations from the expedition in 2001 (Ventflux2) are shown as black solid symbols, ∼ 1 km to the SW of the mound-region. Cores from the 2008 expedition (STN 23 & 24) taken near the gas hydrate mounds are shown by green solid symbols.
Following discovery of the mounds, a seismic survey as part of the Ventflux2 expedition was carried out to map the region around the mounds with single-channel seismic methods (Spence et al., 2001b), followed by a second attempt in 2003 during the BofFiNS expedition (Willoughby and Fyke, 2003). Here, we show results from these expeditions for the first time and integrate these data with regional seismic data acquired during previous seismic surveys.
Our goal is to fill a large knowledge gap, despite all efforts and monitoring campaigns, and answer the following questions:
- What is the mechanism for the development of gas hydrate mounds on the northern wall of Barkley Canyon?
- Is the presence of thermogenic hydrocarbon seeps at the seafloor indicative of a s-II gas hydrate system at greater depth?
- What are the migration pathways for fluids supporting the gas hydrate mounds exposed on the seafloor?
To address these questions, we first combine ROV dives with repeated seafloor video observations and the AUV bathymetry data to establish an inventory of characteristic fluid seepage features, such as occurrences of gas hydrate mounds, bacterial mats, clams, carbonate crusts, as well as oil- and gas discharge sites. These data are then combined with AUV sub bottom profiler images of the sedimentary structures in the shallow sub-surface to investigate fluid migration pathways, and finally integrated into the larger tectonic setting of Barkley Canyon and regional occurrences of BSRs from seismic imaging. This study integrates data from many different expeditions, encompassing different disciplines and techniques, and combines data of different vintage. This study provides a synthesis of our understanding of the Barkley Canyon gas hydrate occurrence to date and – despite all efforts made – addresses remaining knowledge gaps and suggests new long-term monitoring targets not yet undertaken.
Methods
This study combines various remote-sensing techniques and ROV-based video imaging capabilities over the time span from the initial discovery of Barkley Canyon gas hydrates in November 2000 (Spence et al., 2001a) and initial ROV dives, followed by seismic imaging attempts in 2001 and 2003, until the last maintenance cruise operated by ONC in the summer of 2021. Additional regional seismic reflection data from the northern Cascadia margin are incorporated. A list of all scientific expeditions, ROV dives, and associated investigations used are given in the Supplementary Table S1.
Seismic Data and Bottom-Simulating Reflectors
A grid of single channel seismic (SCS) reflection lines were acquired during expeditions in 2001 (Spence et al., 2001b) and 2003 (Willoughby and Fyke, 2003). Data acquisition during the 2001 expedition used a single 40 in3 sleeve gun as source (dominant frequency 100 Hz) at a shot-spacing of 12.5 m. Data were recorded with a 25 m long single-channel streamer at a sampling rate of 0.5 ms. A pre-amplifier bandpass filter of 30–2,100 Hz was used during acquisition. This allowed a detailed imaging of seafloor topography as well as BSRs and associated sediment structures. Data from 2003 (acquired with same sized airgun and single-channel streamer) suffer from a low signal-to-noise ratio and imaging artefacts from strong topography-related diffractions due to a wide shot-spacing (∼30 m), and pre-amplifier bandpass filter settings restricting the frequency band to 50–200 Hz prior to digital recording. However, the 2003 data were able to detect BSRs.
To compare the 2001 and 2003 SCS data acquired from inside the canyon with the regional structures and associated BSRs north of Barkley canyon, we have chosen two data sets from previous surveys. Deep-penetrating multichannel seismic (MCS) line 89–03 (maximum 3,700 m offset) was selected from the archived seismic survey conducted in 1989 with a 125 L volume airgun array, providing a low-frequency (8–60 Hz) image of the structural setting down to ∼2 s two-way time. For details on acquisition and processing, see e.g., Hyndman and Spence (1992) and Hyndman (1995). A set of parallel high-resolution seismic lines (8–240 Hz) was acquired in 1996 (spacing ∼400 m) using a 24-channel solid-state streamer (max. 290 m offset) on the northern bathymetric bench above Barkley Canyon with a single 120 in3 Bolt airgun (cruise PGC9604). Details on the acquisition parameters are provided in Mi (1998) and Ganguly et al. (2000). Because original processed lines were lost, these data were recovered from archives and re-processed for our study. Survey geometry was linked back to the original archived survey navigation in 1996. Processing involved geometry definition, predictive deconvolution for bubble-suppression, normal-move-out correction and stacking, and frequency-wavenumber time-migration. Post-migration predictive deconvolution and band-pass filtering (12–280 Hz) were added to further suppress the prominent airgun bubble from the data.
The seismic data were mainly used to identify the BSR and to estimate regional heat-flow patterns from its depth variation. This technique has been widely used on the northern Cascadia margin (e.g., Ganguly et al., 2000; He et al., 2007; Riedel et al., 2010a) and elsewhere (e.g., Yamano et al., 1982; Grevemeyer and Villinger, 2001; Kinoshita et al., 2001; Villinger et al., 2010; Phrampus et al., 2017). In our case, we assume a hydrostatic pressure regime down to the depth of the BSR and convert depth to pressure (in kPa) using a constant seawater density of 1,028 kg m−3. Depth of the BSR (DBSR) defined as meters below seafloor (m bsf) is derived using an average velocity for the sediments between seafloor and BSR of 1,600 m/s, in general agreement with previous velocity studies and drilling at this margin (e.g., Riedel et al., 2010b).
The s-I gas hydrate phase-boundary curve is defined after Sloan and Koh (2008) for a seawater salinity of 3.4 wt% and a pure methane system. For simplicity of the calculations, temperature at the BSR (TBSR) is given as function of the hydrostatic pressure at the BSR (PBSR) in values of MPa using this function:
TBSR = −4.77713016 × 10⁻⁷ × PBSR6 + 5.22043912 × 10⁻⁵ × PBSR 5 − 2.32953642 × 10⁻³ × PBSR 4 + 5.51150830 × 10⁻² × PBSR 3 − 0.757440615 × PBSR 2 + 6.50932289 × PBSR − 13.967, which is defined as optimal polynomial fit to the theoretical gas hydrate phase curve (for a pressure-range of 3.3–29.1 MPa, and a temperature range from 1–21°C). We also adopt a depth-dependent seafloor temperature (Tseaf in °C) following the empirical equation as used in Riedel et al. (2018), which was derived from oceanographic data sets available online through the World Ocean Circulation Experiment (WOCE) atlas (http://woceatlas.ucsd.edu/):
where seafloor depth (D) is given in meters (m). The geothermal gradient is then calculated from the difference in BSR- and seafloor temperatures, divided by the BSR depth (DBSR) defined as meters below seafloor (m bsf). Heat flow is then given after multiplying this gradient with a depth-dependent thermal conductivity (tc) (following Davis et al., 1990):
Conversion of observed seismic two-way travel time to depth below seafloor includes uncertainties from each required input parameter described above. We estimated the combined total uncertainty to ±10 m by converting travel-time to depth using extreme values for velocity, thermal conductivity, and sea floor temperatures.
High Resolution Bathymetry and AUV Operations
The study region around the gas hydrate mounds was investigated with an AUV survey in 2009 (e.g., Paull et al., 2015). During this survey, MBARI’s AUV “D Allan B” acquired multibeam bathymetry (Reson 200 kHz multi-beam sonar), side-scan sonar (Edgetech 110 and 410 kHz), and Chirp data (2–12 kHz) along multiple track lines. The AUV was flown at a height of ∼50 m above seafloor and 150 m line spacing to nominally achieve 100% multibeam coverage. Line spacing was reduced to 25 m in a small area (region outlined with a red dotted line in Figure 2) to provide more Chirp coverage on the mounds. Multibeam data were processed with the software MB-System (Caress et al., 2017) and corrected for sound velocity to generate a grid of seafloor topography at a 1 m lateral resolution. A final navigation adjustment was made to account for AUV navigational uncertainty (a base shift relative to prominent topography) revealing positioning accuracy of <10 m. The AUV Chirp data are recorded initially relative to the height of the AUV flying above seafloor. The recorded fly-depth information of the AUV was then used to shift the data to true travel-time below sea surface. All Chirp data are presented in envelope (instantaneous amplitude) mode.
Water-Column Imaging
Acoustic detection of gas emissions in the water-column from ship-based multibeam or single-beam echosounder data (EK60) was made using the QPS Fledermaus Midwater tool. An initial set of known gas flares (recorded in publicly available data sets) was taken from previous analyses (Riedel et al., 2018). The AUV water-column backscatter information was visualized inside the software CARIS® to detect gas flares following the approach described in Römer et al. (2014). The location of gas emission sites from AUV data can be located within a few meters. The ship-mounted single-beam was used to estimate gas flare locations but since the sounder foot-print radius is ∼160 m in 800 m water depth, gas flare locations can span laterally over ∼320 m. For the purpose of this study we incorporated additional EK60 echosounder data (12 and 18 kHz) from the expedition conducted in 2008 (Haacke et al., 2022) from periods while the vessel was kept stationary during coring. As individual bubble streams can be tracked while rising in the water column, a more detailed analysis of bubble-rise rate behaviour and depth-limitation of degassing was possible. Similar EK60 echosounder data were recorded during dives with the ROV Doc Ricketts, but only photos of the echosounder image are available for analysis.
ROV Video Operations
Numerous ROV dives were conducted as part of the ongoing ONC monitoring efforts at Barkley Canyon and during surveys to the site by MBARI (2006, 2009, 2011). Most of the ONC-managed dives are dedicated to operations at instrument platforms and do not allow additional exploration. We have selected from the dives conducted a sub-set of surveys that incorporated regional surveying (e.g., ROPOS Dive 996 from 2006) or visual bottom transects between individual experiments. A list of these dives is given in the Supplementary Table S1 including a map of dive-track and acoustic imaging lines across the region (Supplementary Figure S1). These transect lines were conducted with the ROV <2 m above seafloor, recording video with a visual footprint of only 2–3 m width. In some cases, the ROV video was recorded with parallel laser-beams providing a quantitative horizontal scale. When no laser beams were recorded, the size of objects was estimated from observations made during previous dives, or by using other representative objects like known fish species.
The ONC database includes dive logs with entries of the various observations made (all times are given in UTC). These logs were scanned for key words to get the coordinates for observations related to fluid seepage and seafloor morphology (“hydrate”, “gas”, “bubble”, “oil”, “carbonate”, “clam”, “bacterial mat”, “mound”, “crest”, “rock”, “coral”, and “ridge”). An issue with this approach is that the recorded observations may not be entered into the log at the exact time when the ROV was passing the object noted or refer to objects not in the direct (frontal) view of the camera, but are within the general vicinity of the ROV. Thus, video recordings were inspected to verify the positions of all entries in the dive logs. Where available, the ROV camera heading information at the time of observation was used, or estimated from consecutive navigation points during a portion of a transect before and after a dive-log entry was made, assuming the camera position was not changed. The ROV may be several meters off from the actual object reported in the dive log and thus observations can scatter even when the same object is repeatedly noted in consecutive dives. Yet, as ROV positioning is limited by ultra-short baseline (USBL) systems, the uncertainties in the locations reported by visual inspections are usually not better than ±8–10 m (equivalent to ∼1% of the water depth).
Oil Sample Collection and Gas Analyses
During two dives with the ROV Doc Ricketts in 2011, we collected oil from sediments at a gas hydrate mound in the central portion of the study area. While the ROV sat stationary on the seafloor, the upper few centimetres of sediment in front of the ROV was stirred with a metal rod to release oil using one of the robotic arms. Rising oil bubbles were collected with a funnel attached to the second robotic arm, and stored in a pressurized canister. Images taken during sampling (Dive DR273 and DR279) are shown in Supplementary Figures S2, S3. After the ROV was recovered, 4 sub-samples were created from the two pressurized canisters and shipped to the lab at the School of Earth and Ocean Sciences (University of Victoria) for gas composition determinations. The stable carbon and hydrogen isotope ratio measurements of the light hydrocarbons (methane–butane) were made by Continuous Flow–Isotope Ratio Mass Spectrometry (CF-IRMS, e.g., Whiticar and Hovland, 1995, Supplementary Table S2). All isotope data are reported here in the conventional delta notation in permil relative to the international Vienna Pee Dee Belemnite (VPDB) standard for δ13C (precision ±0.2‰) and the Vienna Standard Mean Ocean Water (VSMOW) for δ2H (precision ±2‰). The hydrocarbon gas composition was determined using the mass 44 peak by CF-IRMS.
Sediment Physical Property Measurements and Pore Water Sampling
Two piston cores were taken during expedition PGC0807 within the region of known gas hydrate mounds and above previously recognized gas vents (Figure 2). Three piston cores were taken ∼1.5 km west of the gas hydrate mounds during expedition PGC0103 (Figure 2). Cores were cut on deck into whole-round core sections. Cores were then split into two halves, with one half dedicated to geochemical sub-sampling, and the second half was used for core-photography and physical property measurements. Two Munsell Soil Colour Charts (5Y and Gley) were included in each photograph frame to allow for adjustments to any changes in light conditions. Magnetic susceptibility was measured using a Bartington MS2E high resolution susceptibility probe with a measurement spacing of 1 cm. Electrical resistivity was measured on all cores from both expeditions with a small Wenner probe. Calibration of the probe was made against sea water (Standard Mean Ocean Water with salinity of 35 ppm). Temperature was monitored constantly throughout the procedures. Measurement spacing depended on core quality and was adjusted to avoid zones with cracks and voids. Using a simplified Archie’s relationship (Archie, 1942), the resistivity data were converted to porosity. We assumed the empirical parameters a and m to be 1 and 2, respectively, as no independent porosity data are available for this location. The three piston cores taken during expedition PGC0103 in 2001 (Ventflux2) were treated in the same manner, but only electrical resistivity was measured on Cores C10 and C12. Digital photographs were taken, but uncalibrated without Munsell Colour Charts.
From the piston cores, samples were taken for porewater sulfate analyses. Whole round core sections (5–10 cm in length) were taken, cleaned, and squeezed onboard. A complete description of the pore-squeezing procedure and sample treatment is given in Haacke et al. (2022). During 2004, several push cores (up to 22 cm in length) were taken with the ROV ROPOS from the sediment close to gas hydrate mounds from which porewaters were extracted with Rhizons (Seeber-Elverfeldt et al., 2005). Sulfate concentrations were measured on the pore water by ion chromatograph according to standard published methods (Lapham et al., 2008) and are reported in units of mmol l−1 (mM).
Gas Hydrate Phase Boundary
The gas hydrate phase boundary in seawater was calculated using the software CSMHyd (Sloan and Koh, 2008) for different hydrocarbon mixtures encountered at the Cascadia margin. A pure methane system and one system resembling the gas mixture extracted from gas hydrate at the seafloor (Pohlman et al., 2005) was incorporated in our study. Measurements of the seawater properties (conductivity and temperature) were required for calculating the theoretical phase boundary of gas hydrate in the water column. We obtained vertical profiles of seawater properties at the gas hydrate mounds of Barkley canyon through ROV dives using the conductivity, temperature-depth (CTD) sensor attached to the ROV Doc Ricketts. For comparison, we also use CTD data obtained during a sampling expedition in 2010 at Bullseye Vent (Riedel et al., 2014).
Results
Seismic Constraints and BSR-Based Heat-Flow
Seismic imaging within the steep canyon, especially near the location of the gas hydrate mounds, was difficult (Figure 3). The strong, continuous reflection mimicking seafloor topography and of opposite polarity relative to the seafloor reflection seen at ∼0.19 s two-wave time below seafloor roughly 1 km south from the site of gas hydrate mounds exemplifies the BSR in this area (Figures 3A,B). Similar reflections from the same survey were seen over an area of ∼2.5 km2. No equivalent BSR can be identified on the steeper flanks of the canyon wall despite prominent and well-imaged sediment layering along the lines.
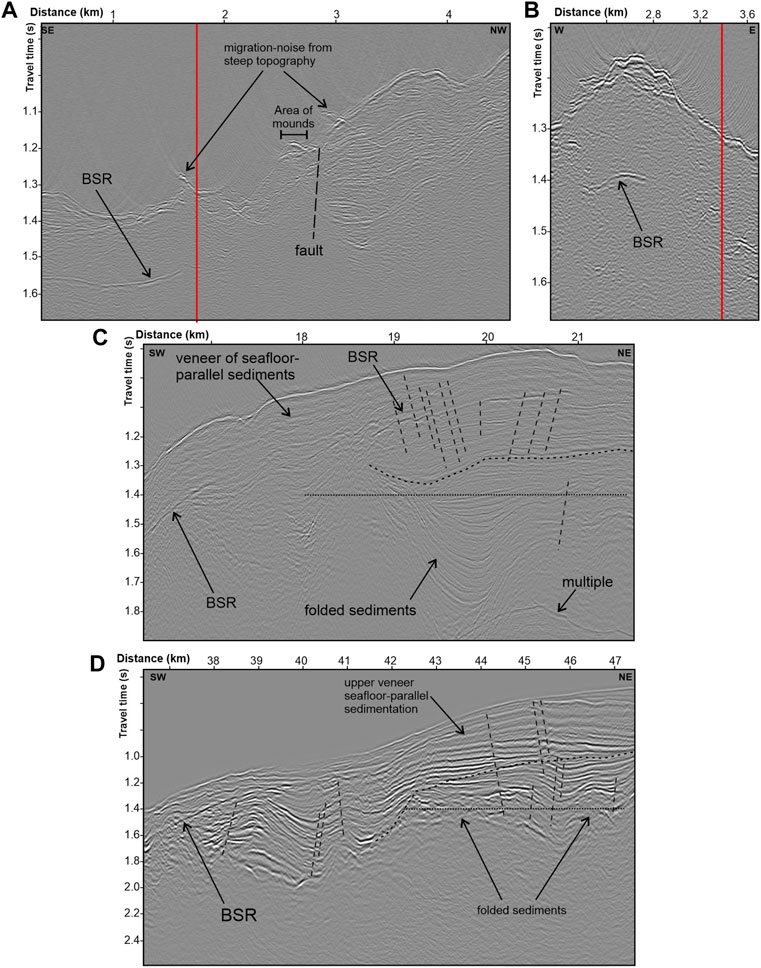
FIGURE 3. (A) Seismic record (expedition PGC0103) showing a BSR, ∼1 km south of the gas hydrate mounds. The BSR is seen up to line-kilometre 1.5, but is absent in the remainder of the profile. A prominent fault separates visible layering along the canyon wall to the NW from acoustically weakly reflective sediments to the SE. (B) A neighbouring line (crossing point is marked by red line) shows a small portion of a BSR underneath the topographic high. Data are migrated but steep seafloor topography results in migration-noise. (C) Seismic record (expedition PGC9604) along the northern flank of the canyon ∼5 km to the NW of the gas hydrate mounds. A BSR is only weakly developed. An unconformity separates the upper veneer of seafloor-parallel sediments from a deeper unit of older, folded sediments. The depth to which the canyon has eroded at its present floor is marked by the horizontal dotted line. (D) Portion of multichannel seismic line 89–03 showing a BSR along the western section up to line-kilometre 39. The section between line-kilometre 42 and 47 projects to the location of the gas hydrate mounds. The erosion depth of the canyon in indicated by a horizontal dotted line. An unconformity marks the boundary between the upper younger and mostly seafloor-parallel sediments and underlying older and folded sediments. Both units are also cut by numerous faults (dashed lines).
More wide-spread BSRs are seen on the northern flank of the canyon wall, starting approximately 3 km west of the gas hydrate mound region. We selected Line 18 from the 1996 survey as an example for the BSR nature in this setting (Figure 3C). Again, a polarity-reversed reflection can be traced for much of the profile at similar sub-seafloor depths near 0.19 s two-way time (twt) at just over 1,000 m water depths. However, as the upper sediments are nearly seafloor parallel themselves, the BSR is possibly masked at many places. For comparison, one profile from the low-frequency MCS survey in 1989 was selected providing a regional representative view of the stratigraphy and BSR (Figure 3D) further west and north of the canyon region. None of the seismic lines investigated along the Barkley Canyon region and along the entire northern Cascadia margin show evidence of a deeper second BSR. This is in contrast to the southern Cascadia margin, where a second BSR exists under Southern Hydrate Ridge, attributed to shifts in temperature and pressure regimes after the last glacial period and not migration of thermogenic gas (Bangs et al., 2005).
Using the BSR as a proxy for temperature, heat-flow values were estimated (Figure 4). The results show the expected range in heat-flow values along the margin in accordance with accretionary prism deformation and subduction (Davis et al., 1990; Hyndman et al., 1993). A strong overprint of the heat flow values is clearly associated with the topography, with focusing in synclines (yielding higher heat flow) and defocusing at anticlines or exposed ridges (yielding reduced heat flow) as already previously noted by Ganguly et al. (2000). For the examples chosen in Figures 3A,B, the heat flow is ∼75 mW m−2 at an approximate distance of 30 km from the deformation front.
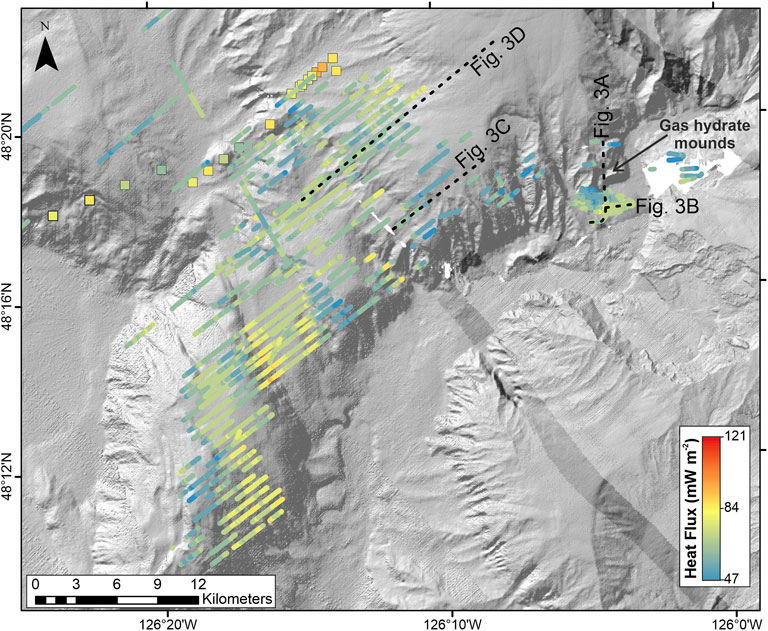
FIGURE 4. Map of heat flow values derived from BSR depths. Heat flow values derived with a heat-probe (Davis et al., 1990) are shown as large squares. On average, heat flow is ∼75 mW m−2 at the location in the Barkley Canyon, ∼1 km south of the gas hydrate mounds (Figures 3A,B), and very similar to the region upslope above the canyon, as shown in Figures 3C,D.
The seismic profiles from around the Barkley Canyon region show that the sedimentary section can be roughly divided into two units: 1) an upper veneer of sedimentary layers being nearly parallel to the seafloor and 2) an underlying unit of sediment layers showing strong folding. Both units additionally show signs of faulting with some of the faults penetrating the entire depth range imaged, while others are occurring in the lower unit only. The seismic records for line 89–03 (Figure 3D) and line 18 from the 1996 survey (Figure 3C) best illustrate this separation. The canyon itself has eroded deep into the sedimentary systems, roughly to a depth of 1.4 s twt, equivalent to ∼600 m below seafloor depth (relative to the seafloor depth at the north-western bench of the slope projected to a similar margin-parallel location). This depth is marked on Figures 3C,D and clearly illustrates that the erosion has reached depth intervals within the lower folded and faulted sedimentary unit, thus exposing these presumably much older sediments.
Detailed AUV Bathymetry and Chirp Data
The region of the gas hydrate mounds is located at an average water depth of 860 m. The region was surveyed in 2009 with an AUV covering a total area of ∼8 km2 (Figure 2). The floor of Barkley Canyon is clearly seen as an ∼0.5 km wide nearly flat seafloor S-shaped meandering band through which a line of outcrops or blocks of transported material sticks up through the otherwise gentle seafloor morphology. North-west of the canyon floor the seafloor can be divided into several smaller sub-regions, based on their distinctive morphology. Immediately north-west at the edge of the canyon floor, seafloor rises gently in a region with an undulating seafloor morphology (compare to Figure 2, 5). Upslope from the undulated topography, the seafloor becomes smoother, up to a cliff or failure head-scarp. This region is truncated by an apparent fault-line from a seafloor bench that itself shows a sharp erosional cliff with down-slope slumping into the deeper located canyon floor. The surface of the bench is marked with a rough seafloor morphology hosting the gas hydrate mounds. This distinctive bench is ∼650 m long (measured along the erosional cliff) and up to 250 m wide.
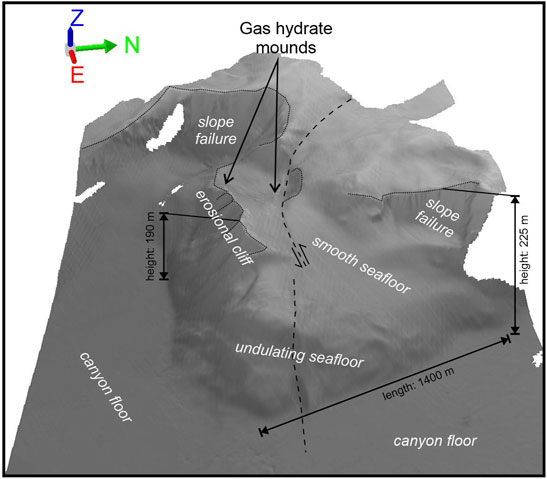
FIGURE 5. Perspective view of the AUV shaded bathymetry relief showing the location of the gas hydrate mounds situated on a bench, resembling the shape of a rotated fault block. Approximate height of geographic features is indicated. The prominent sinusoidal fault line is shown as dashed line. Head scarps of slope failures along the canyon wall and the erosion cliff at the fault block are indicated by dotted black lines. Two regions of distinct seafloor morphology (smooth vs. undulating) are indicated.
The AUV bathymetric data were used to prepare a 3D perspective view using ArcScene® (Figure 5). The perspective view of bathymetry illustrates the region of the gas hydrate mounds is situated on a tilted bathymetric bench resembling the body of a rotated fault block. The northern boundary of the block is marked by the sinusoidal fault-line, resembling the look of a strike-slip fault. The bench or fault-block reveals a general dip towards the northern canyon wall but increasing steepness to the east.
The canyon wall above the fault line is characterized by numerous head-scarps (Figure 5) associated with blocky, rotational failure (Figure 6). The AUV data show older sediments covered with sediments sloughed off from upslope and that the blocks have progressively moved downslope, as sediment layering is warped (Figures 6A,B). Thus, the unstable flank of the canyon appears to gradually fail. These fault-blocks resemble the form of the bathymetric bench on which the gas hydrate mounds are situated. The only existing airgun seismic line (Figure 6C) shows similar such fault blocks, but on a larger-scale. Additionally, the data reveal a basal reflection of the flank sediment mass which appears to be buttressed against a sediment block of weakly reflective, but dominantly flat lying strata.
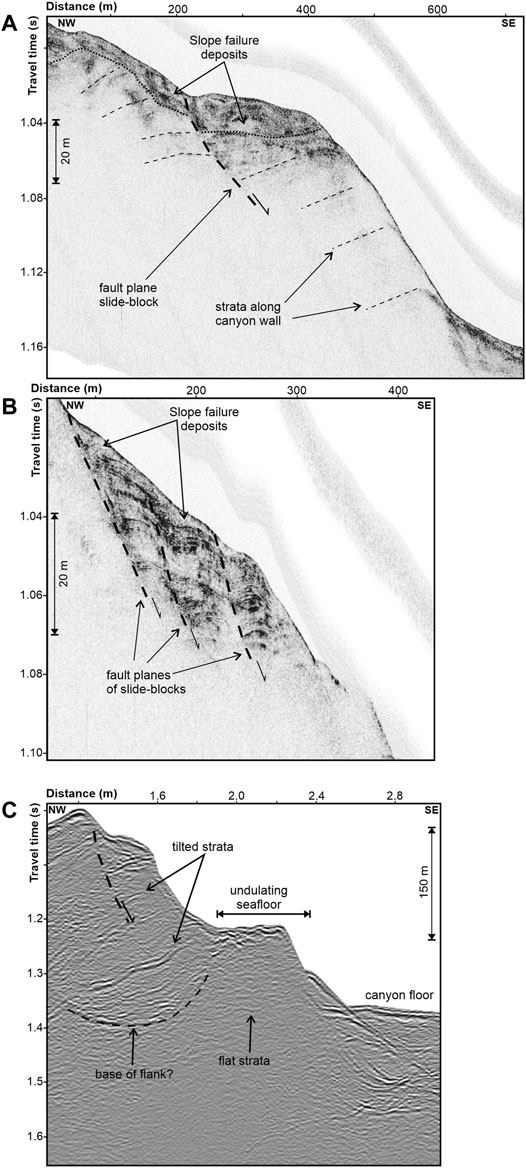
FIGURE 6. Examples of rotational block failures along the north-western canyon wall. Location of lines are shown in Figure 2. (A) AUV Chirp data showing a veneer of chaotically deposited slope failure debris above layered strata. One prominent fault is seen along which a slope-block slides downward and is being gradually tilted. (B) Chirp data of a section of canyon wall with rotational slide blocks that have not fully failed yet. Sediment layering is gradually deformed across the fault lines. (C) The only available airgun section from expedition PGC0103 along the canyon wall shows the entire flank of the canyon wall as larger slide block failure complex, with tilted strata. The complex appears buttressed against a section of sediment that shows the undulating seafloor morphology (compare to Figure 2). Some weak layering is predominantly flat (seafloor parallel), likely a portion of much older sediment exposed by the canyon erosion process.
Selected examples of the AUV Chirp data highlight details of the various subregions of the canyon’s flank and the bench hosting the gas hydrate mounds (Figure 7). The meandering canyon floor is characterized by thick uniform sediment fill in the central portion of the canyon and a wedge-shaped stack of layers developed along the west flank of the meandering path (Figure 7A). A similar change in this depositional character is seen on the south-facing side of the canyon. The lower flank of the canyon’s side is characterized by an undulating morphology (Figures 2, 7B). On the bench the undulating surface morphology changes to a smooth seafloor. The boundary between the two sub-regimes of seafloor morphology marks the location where the sediment fill no longer covers the seafloor (at distance 680 m along the profile shown in Figure 7B) and underlying sediment/rock is exposed. Chirp data across the bench (Figures 7C–F) show an abrupt change in character across the fault near the gas hydrate mounds. The surface of the bench to the south of the fault is tilted towards the north, and show northward dipping strata which apparently truncate along the fault (Figures 7C,D,F). Sediments north of the fault line are flat-lying and penetration of the Chirp data is three times as deep. The AUV lines across the patch hosting the prominent gas hydrate mounds reveal a unique character. The seafloor is warped upwards forming blisters, elevated by ∼5 m above surrounding seafloor, especially along the fault line. Acoustically, these blisters are opaque, similar to observations made by Sager et al. (2003) who identified similar pop-up features at methane vents associated with gas hydrate mounds in the Gulf of Mexico.
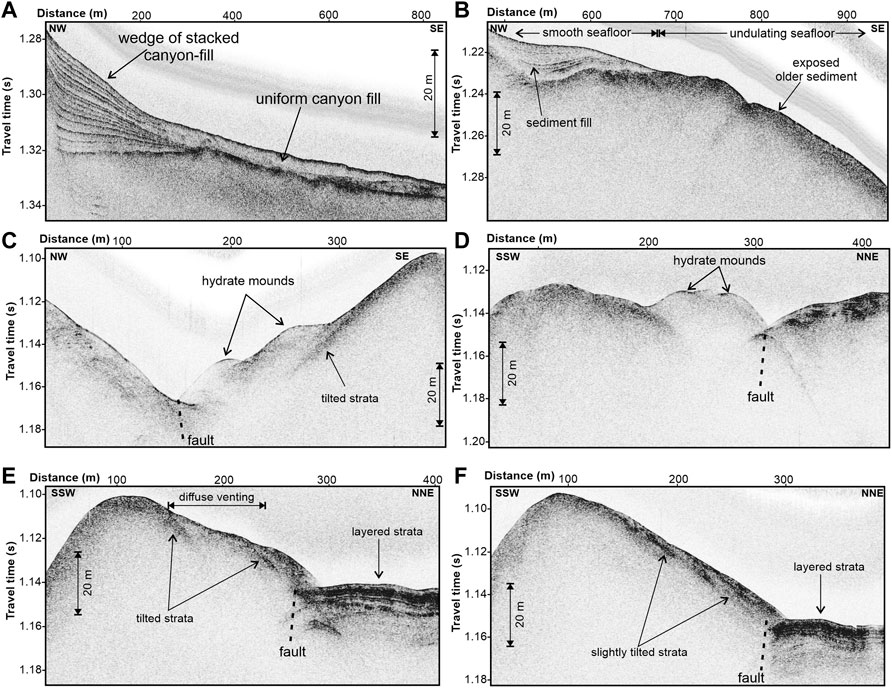
FIGURE 7. Examples of AUV Chirp data showing important acoustic characteristic of the sub-surface structures around the general region of Barkley Canyon gas hydrate mounds (location see Figure 2). (A) Profile through the central portion of the meandering canyon floor shows a wedge of layers on the lee-side of the meander and thick, acoustically turbid canyon fill. (B) Profile showing the sub-surface regime across the change in seafloor pattern from undulating to smooth morphology. (C) and (D) Profiles illustrate the acoustically turbid character of the gas hydrate mounds or blisters, that are warped up by ∼5 m higher than the surrounding seafloor. (E) Section of a line across the region with diffuse seepage and tilted strata, sharply truncated at the fault line to the NNE-section with layered sediments. (F) Profile showing slightly tilted strata and prominent truncation at the fault line. This line is located at the eastern edge outside of the diffuse seepage zone.
Detailed Location of Fluid Seepage Features
We reviewed video-data from 57 individual ROV dives and identified fluid-seepage related features on the seafloor. Investigating repeatedly visited sites, we utilize similarities in shape and size of the gas hydrate mounds, as well as specific markers left behind during several dives to estimate the coordinates of the seepage features (Figures 8–11). All video-log entries are plotted on top of the AUV bathymetric map at 1 m grid resolution to assign seafloor morphological structures to physical features on the seafloor (Figures 8, 10). An overview of all events identified including ROV dive tracks utilized is given in Supplementary Figure S1. Examples of fluid seepage features are shown in Figures 9, 11.
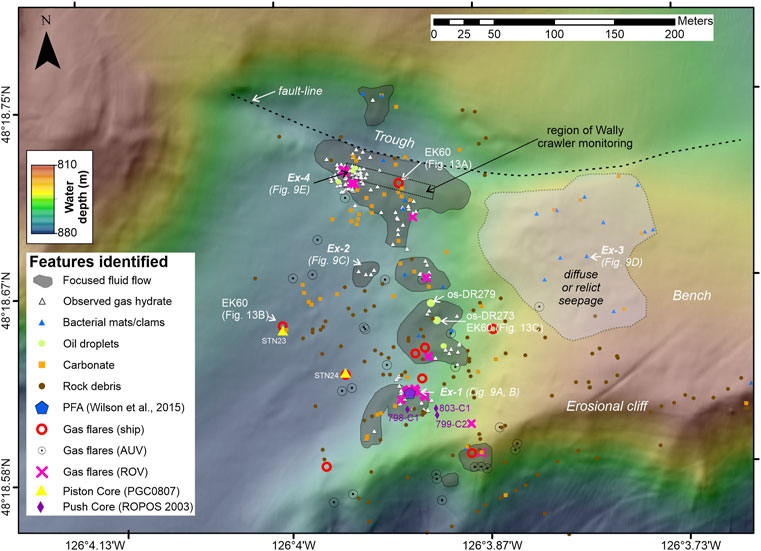
FIGURE 8. Detailed map of AUV-bathymetry with location of sightings of fluid-seepage related features. Examples (Ex-1 to Ex-4) of video images are given in Figure 9. The pore-fluid array (PFA) site (Wilson et al., 2015) is at the southern-most mound-complex (Ex-1). We interpreted sites of focused fluid flow (Ex-1, -2, and -4) based on repeated video sightings and characteristic seafloor morphology, marked as dark-shaded regions. In contrast, a zone of diffuse (or relict) seepage on the eastern side of the bench was identified based on fewer seepage-related features (Ex-3), an absence of gas hydrate mounds, and a gentle seafloor morphology. Location of the two oil-samples (os) collected in 2011 and analysed for our study are marked with large green circles, as well as locations for EK60 data from ship-mounted data, and acquired during the ascent of the ROV after dive DR273.
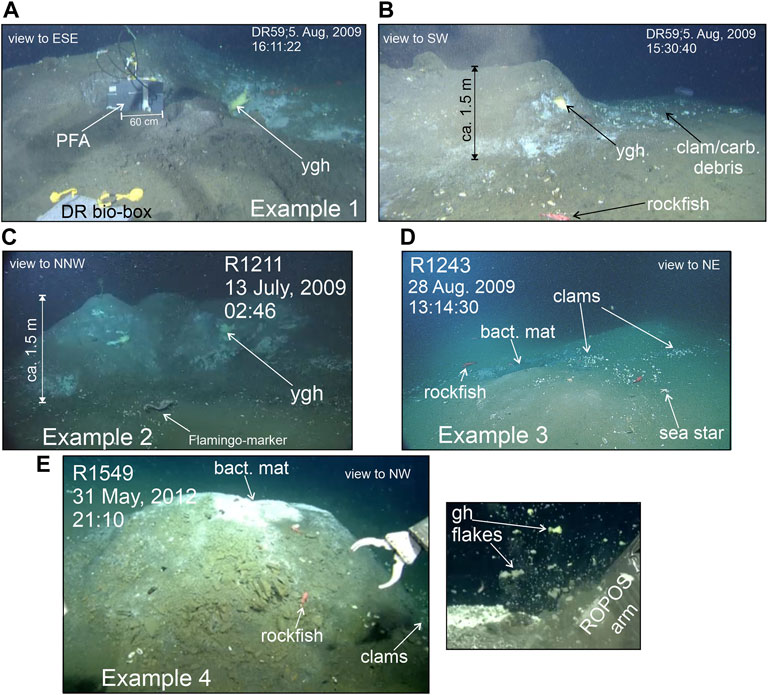
FIGURE 9. Examples of focused seepage-features identified from repeat video observations. (A) Example 1 is a location of the southern-most mound-complex where a pore-fluid array (PFA) was deployed (Wilson et al., 2015). Yellow gas hydrate (ygh) outcrops are seen at this site and abundant oil- and gas venting was observed. (B) The mound complex is roughly 1.5 m elevated above surrounding seafloor. All around the mound, debris of clams and carbonates are found. The seafloor is covered with various patches of grey/black or white-coloured bacterial mats. (C) Example 2 is located in the central region of all mounds identified. The gas hydrate mounds (with yellow-coloured gas hydrate) form an elongated topographically distinct ridge of ca. 1.5 m height. (D) Example 3 is within the region of diffuse seepage with a gentle topography (<1 m height of smaller mounds), occurrence of some clams (mostly dead) and carbonate debris within patches of grey/black or white-coloured bacterial mats. (E) Example 4 is at the western zone of Wally-operations. Footage shows a ∼0.5 m tall outcrop covered with grey/white coloured bacterial mats. Upon probing with the robotic arm of ROPOS, oil droplets and flakes of white and yellow-coloured gas hydrate (some with remains of bacterial mats attached) floated upwards. Size of the largest flakes were estimated to be ca. 5 cm in diameter.
The gas hydrate mounds are certainly the most distinctive feature of the seafloor around this site and a sub-set of mounds along the sinusoidal fault-line are the target of repeat monitoring efforts using the crawler Wally (Thomsen et al., 2012). Individual mounds are largely sediment covered, but patches of solid hydrate are exposed (Figure 9A). Some of the gas hydrate mounds are also associated with gas and oil seepage. The height of these mounds was estimated to be between 1–3 m above surrounding seafloor (Figures 9B,C). The mounds host living chemosynthetic communities (Beggiatoa bacterial mats, Vesicomyid clams, Solemya reidi clam) and are also surrounded by debris of clam shells and authigenic carbonate (Figure 9B). Some of this debris appears to be transported downslope on the western portion of the bench and at the steep south-facing erosional cliff (Figure 8). The observations of gas hydrate mounds repeatedly seen over 15 years and the dense clustering of bacterial mats, clams, carbonates, and associated gas and oil venting (i.e., fluid seepage indicators) outline two regions of focused fluid seepage.
The main focused seepage region which includes most of the mounds is about 0.025 km2 in areal extent and is located in the south-western region of the rotated fault-block (grey-shaded patches shown in Figure 8). In this main focused fluid flow region, all but one of the gas hydrate mounds are situated south of the prominent fault line. The gas hydrate mounds nearest to this fault line are the site of the repeat observations with the crawler Wally (Thomsen et al., 2012). A small trough is situated on the hanging wall of the fault line and one gas hydrate mound is seen ∼50 m to the NW of that trough (Figure 8). This site is also associated with gas flares and oil-bubble leakage. Further south of the fault line, several additional mounds are observed, with the southern-most cluster being visited repeatedly and having been the focus of a long-term study using a pore-fluid array (Wilson et al., 2015). Thus, the gas hydrate mounds in this focused fluid flow region spread over ∼250 m in a nearly N-S orientation. Although not always imaged from the same camera standpoint and with different camera systems of the various ROVs (with changing colour calibration), individual gas hydrate mounds repeatedly visited over the 15 years of data availability appear to be only slightly changing in dimension (width and height) and overall character (i.e., abundance of chemosynthetic communities and bacterial mats).
A second focused fluid flow region is seen at the eastern edge of the rotated block (Figure 10) covering a small region of 0.005 km2 (approximately 40 m E-W by 220 m N-S). Here, three gas hydrate mounds are also associated with oil seepage, gas emissions, bacterial mats, and living clams. Downslope of this region, bacterial mats and clam colonies were identified during one dive (DR059) occurring in an elongated depression over several meters. Examples of the seepage features in this second region are given in Figure 11.
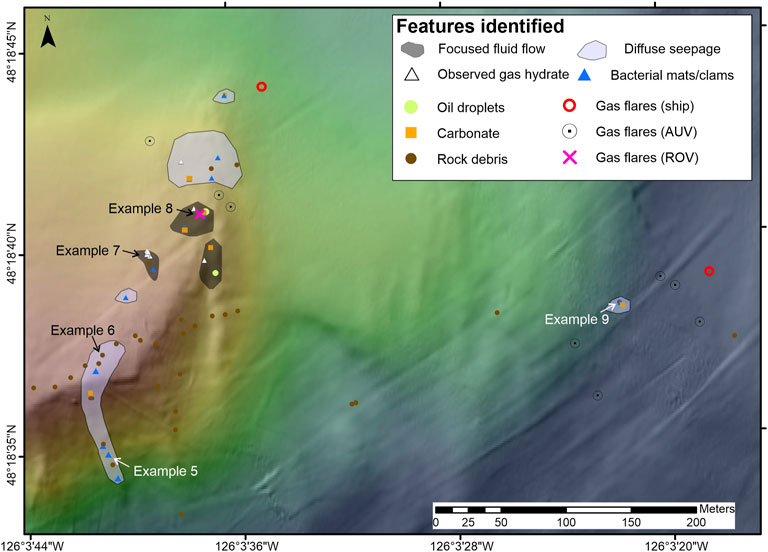
FIGURE 10. Detailed map of AUV-bathymetry along the eastern edge of the bench with location of seepage-related features (similar in nomenclature as in Figure 8). Examples of seepage-related features and unique rock-debris are shown in Figure 11. A zone of focused fluid seepage is defined based on occurrence of exposed gas hydrate, gas and oil bubbling, and a morphology of pronounced mounds above surrounding seafloor (dark shaded region). Diffuse seepage (purple shaded region) is suggested based on the observation of only few bacterial mats and clams and only minor topographic variations.
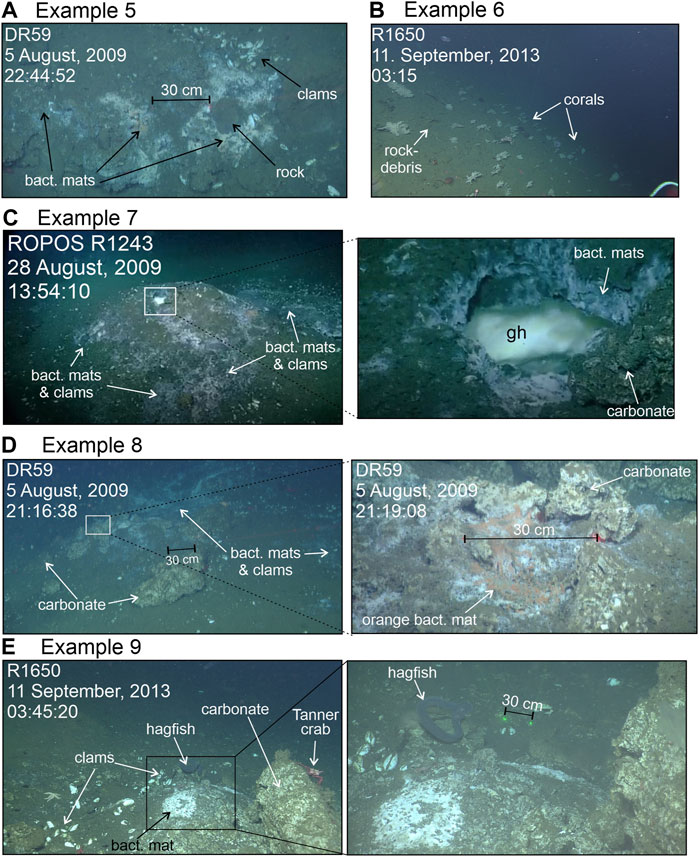
FIGURE 11. Examples of seepage-features at the eastern edge of the bench. (A) At the cliff edge and downslope, few clams and bacterial mats are observed. (B) Abundant rock debris associated with cold-water corals are seen at the cliff edge and downslope towards the canyon floor. (C) Example of white gas hydrate (gh) outcropping on a small mound surrounded by bacterial mats and clams. (D) Larger carbonate concretions, bacterial mats, and clams. Here, also orange-coloured bacterial mats are found. (E) A small seep site with bacterial mats, clams and carbonate near the foot of the region marked as “undulating seafloor morphology” (Figures 2, 5).
At some of the gas hydrate mounds, the hydrate was seen to occur with a yellow colour (Figures 9A,B), indicative of the co-existence of thermogenic hydrocarbons as reported by Pohlman et al. (2005). Lu et al. (2007) reported the occurrence of s-II and s-H gas hydrate from these sites. The upper 1.3 m of sediments of piston core STN23, recovered outside the main focused fluid seepage region and ∼125 m west of the nearest oil-leakage site, were described to contain oily fluids with a kerosene smell (Haacke et al., 2022). Oil-samples were taken at two locations at the same mound during ROV dive DR273 and 279 (Supplementary Figures S2, S3).
Areas of sparse and isolated occurrences of bacterial mats, clams, and carbonate chunks are taken to identify “diffuse venting” and characteristically associated with a seafloor morphology that is showing some minor undulations (<1 m in height, but unrelated to the presence of gas hydrate), compared to regions of entirely smooth seafloor barren of any observations indicating seepage. The diffuse venting area on the central portion of the bench covers an area of ∼0.13 km2.
Gas flares were known to be present in the study region from previous ship-mounted single-beam EK60 echosounding efforts (Haacke et al., 2022; compiled in; Riedel et al., 2018). Seven flare locations (one cluster with three individual flares inside a 25 m radius) were noted across the region of the gas hydrate mounds, and two flares are located further east, outside of the focused fluid seepage zone (Figures 8, 10). The AUV data identified 35 flare locations, of which five match the ship-mounted EK60 locations within 50 m, acknowledging the navigation uncertainties of all data respectively. ROV-video observations of gas flares match four of the AUV-based flare sites (within 20 m) and the cluster of three ship-based flares. There was only one gas flare identified in the AUV data at the western edge of the region defined as diffuse seepage. Several gas flares were seen in the AUV-data west of the gas hydrate mounds, where otherwise only debris of dead clam shells and carbonate rocks were seen. In this region, the two piston cores from expedition PGC0807 were taken.
Throughout the regions of focussed fluid flow, and especially along the erosion cliff (Figures 11A,B), the seafloor is also covered with rock debris (see distribution in Figures 8, 10). More abundant rock debris is found at the eastern portion of the study zone, over the region marked as “undulating seafloor” in Figures 2, 5. A detailed look into that region that is mostly devoid of fluid seepage features is given in Supplementary Figures S4 and S5.
Geochemistry of Oil Samples
A comprehensive analysis of the gas evolved from gas hydrate samples and a vent gas taken at the gas hydrate mounds is given by Pohlman et al. (2005). Here, we add results from additional analyses of the oil associated gas, i.e., extracted from oil-samples collected in 2011. The fundamental finding by Pohlman et al. (2005) of a predominantly thermogenic source for the hydrate and vent gases, based on molecular and stable isotope composition is supported by these new data. However, there are differences in the composition of the hydrate and vent gas vs. the oil associated gases. The oil associated gases in this study generally have a greater relative abundance of the C2+ hydrocarbons (21–72 vol%), i.e., ethane (C2) propane (C3) and iso-, n-butanes (i-C4, n-C4), compared to methane (CH4) (Figure 12A). The hydrate gas varies from 14–30 vol% C2+, whereas the vent gas is a methane-rich, dry gas with a C2+ of 2.7 vol% (Pohlman et al., 2005). Although the gas composition can be strongly influenced by mechanisms related to the place and method of sampling, e.g., effects of diffusion, advection, sorption, solubility etc., the abundance of higher hydrocarbon gases is a strong indication of the presence of thermogenic hydrocarbons in the system. The dominant contribution of thermogenic gas is supported by the diagnostic Bernard parameter (C1/[C2+C3], Bernard et al., 1976) that ranges from 1.4 to 44.2 (Figure 12A). For comparison, a dominantly microbial gas has a Bernard parameter from 102 to ca. 105 (Whiticar, 2020).

FIGURE 12. (A) Normalized concentrations (vol%) and Bernard parameter (C1/[C2+C3]) of hydrocarbon and CO2 gases in samples from hydrate (red triangles) and vent (blue dot) gas samples reported by Pohlman et al. (2005) and oil samples taken during MBARI expedition in 2011 (green squares). (B) Chung isotope gas plot (Chung et al., 1988) of δ13C and δ2H for C1-C4 hydrocarbons. The expected δ13CH4 from a humic, Type III kerogen source is indicated along with the shift due to the addition of microbial methane. (C) expanded CD diagram (δ13CH4 vs. δ2H-CH4 from Whiticar, 2021) illustrating the mixture of recent, microbial methane with migrated thermogenic methane. The expected thermogenic δ13CH4 vs. δ2H-CH4 endmember is shown (D) Carbon isotope difference plot (modified from Jenden et al., 1993) reinforces that interpretation of a lower maturity, thermogenic gas mixed with a microbial gas.
In combination with the molecular composition, the interpretation of the hydrocarbon gas type can be further aided by their stable C- and H-isotope signatures. The δ13C values for C2+ hydrocarbons are essentially identical in all samples (Figure 12B, closed symbols), and diagnostic for thermogenic gases with δ13C2H6, ranging from −24.8 to −26.6‰, δ13C3H8 from −21.9 to −24.0‰, δ13iC4H10 from −24.3 to −25.9‰ and δ13nC4H10 from −21.3 to −23.7‰. In contrast, the δ13CH4 shows great variability from −42.1 to −58.1‰, with the oil associated gases more 12C-enriched (−50.5 to −58.1‰) than the hydrate and vent gases (−42.1 to −43.4‰). Assuming that the C2+ hydrocarbons present are typical of thermogenic origin and neglecting the ubiquitous, low-level background and diagenetic gases in sediments (e.g., Hunt et al., 1980), then the trajectory of the δ13C2+ values in the Chung et al. (1988) isotope plot (Figure 12B) can be used to predict the co-genetic methane δ13CH4. The intercept of dashed line for the theoretical thermogenic gas in Barkley Sound, shown in Figure 12B, indicates that the expected δ13CH4 would be roughly −32 ± ∼2‰. This is calculated using a probable humic, Type III kerogen source with an approximate 5–7‰ offset (based on Berner and Faber, 1996) from the measured δ13C2H6 of −24.8 to −26.6‰. This estimated range in δ13CH4 of −30 to −34‰ assumes a source rock kerogen maturity of around 0.5% vitrinite reflectance equivalent and a δ13Ckerogen of −23‰, although the estimate is not strongly dependent on these parameters. The actual measured range in δ13CH4 of −42.1 to −58.1‰ indicates the admixture (dotted lines in Figure 12B) to the thermogenic gas of more 12C-enriched methane that is most probably microbial gas. The amount of microbial methane added differs for the different sample types, with the oil associated gas in this study containing the greatest amount.
The hydrogen isotope ratios of the C2+ hydrocarbons shown in Figure 12B (open symbols) have a relatively tight range in values, similar to δ13C2+, with δ2H-C2H6, from −115 to −138‰, δ2H-C3H8 from −83 to −99‰, δ2H-iC4H10 from −88 to −92‰ and δ2H-nC4H10 from −89 to −95‰. This further implies a common thermogenic source for all these gases. Consistent with δ13CH4, the δ2H-CH4 indicates the admixture of microbial methane to all the gases. Also consistent with δ13CH4, is that the oil associated gases in this study are more 2H depleted than the hydrate or vent gases, due to a greater contribution of microbial gas commingled with the thermogenic gas.
The carbon and deuterium (CD) diagram of δ13CH4 vs. δ2H-CH4 (Figure 12C, Whiticar, 2021) demonstrates the progressive addition of microbial methane to the thermogenic gas. In addition, the data trend in the CD diagram (dashed line) indicates that 1) the thermogenic methane endmember of the mixture is likely derived from a humic, Type III kerogen source, rather than marine or lacustrine Type I or II kerogen, and 2) the microbial endmember is likely methanogenesis by the hydrogenotrophic pathway (Whiticar, 2020), typical of anoxic marine sediments, rather than a more freshwater, land-based acetoclastic methanogenic pathway. The δ13CH4 vs. δ2H-CH4 isotope trend line in Figure 12C could alternatively be explained by bacterial methane oxidation that would result in the observed methane 13C and 2H enrichments. However, this interpretation is unreasonable and inconsistent with the abundance of higher hydrocarbons present.
The carbon isotope difference plot modified from Jenden et al. (1993) (Figure 12D) characterizes natural gases using the relative carbon isotopic difference between δ13CH4, δ13C2H6, and δ13C3H8, rather than relying on their absolute isotope values. Although the plot is calibrated to Type II kerogens, Figure 12D affirms the thermogenic-microbial mix and/or in the case of the hydrate and vent gases, the presence of low maturity thermogenic gas. The amount of microbial methane admixed with the thermogenic methane can be estimated using a simple isotope mass balance of mtotal × δ total = mthermo × δ thermo + mmicrob × δ microb and taking the δ thermo to be −32‰ and the δ microb to be −65‰ (typical of marine microbial methane, Whiticar, 2020). The added microbial methane ranges from ∼18 to 19% for the hydrate gas, 17% for the vent gas and 31 to 44% for the oil associated samples. It is interesting to note that the driest gas (greatest methane vol%) is the vent gas, and the oil associated gas has the largest component of microbial methane. Compound partitioning in the different sample types likely influences the molecular composition, whereas the isotope fractionation due to migration or alteration effects, such as microbial oxidation, are not significant.
In summary, the gas compositions indicate a low maturity, humic (Type III kerogen) thermogenic gas mixed with a surficial marine microbial methane which agrees with a similar analysis performed on hydrate and vent gas from Barkley Canyon by Pohlman et al. (2005). The amount of microbial methane admixed varies according to sample type. This thermogenic gas interpretation is corroborated by the maturation model of Bustin (1995) and Petroleum System Model (PSM) by Schümann et al. (2008) of the Tertiary sediments in the Tofino Basin. Based on the seismic reflection line 85–01 and using calibration with the anticipated heat flow histories (average 70–80 mW/m2) and the three exploration wells, Prometheus H-68, Pluto I-87 and Zeus D-14, the PSM demonstrated that hydrocarbon generation (predominantly gas prone) from the Type III kerogens is possible.
Water-Column Acoustic Observations
Acoustic water column imaging is commonly used to detect gas venting from the seafloor while the ship is in transit or during multibeam mapping surveys. Here, we show EK60 acoustic data from a single beam echosounder (18 kHz) collected while the ship was nearly stationary, thus allowing more accurate detection of individual gas outlets and definition of gas bubble rise rates (Figure 13). The EK60 data indicate relatively constant rise rates of 18–20 cm/s for both locations investigated. Trails of gas bubbles can be followed as they rise to a water depth of ∼300 m, where a highly reflective zone of zooplankton obscures the bubble-associated reflections. In the zone shallower than 200 m, mixed acoustic returns from individual fish are distinctly seen as either flat or up- and downward bending acoustic trails. Most gas plumes do not emerge above the plankton layer. However, one example (Figure 13A) taken above the Wally crawler region has strong acoustic returns of nearly linear streaks of rising gas bubbles (rise rate ∼18 cm/s) even in water depths shallower than 300 m. At this location, abundant oil seepage was reported during ROV dives and the acoustic trails in the EK60 data extend to 50 m below sea surface, the shallowest that the EK60 system covers. Two piston cores were taken slightly west of the main zone of gas hydrate mounds and where gas flares were acoustically detected. The EK60 record of the time during coring at STN23 is depicted in Figure 13B. The data show the rising gas bubbles and the same acoustic band of zooplankton. Additionally, a strong return of the down- and up-going corer-device is clearly seen in the record. Upon ascent of the core, additional strong acoustic trails appear above ∼250 m water depth emanating from the corer-assembly, unconnected to trails starting at the seafloor. During dives with the ROV Doc Ricketts in 2011, the ship’s 12 kHz echosounder data was running. After completion of operations on the seafloor of dive DR273, the EK60 echogram showed unusual gas-bubble trails emanating from the echogram of the ROV upon ascent at water depth of ∼250 m (Figure 13C). The ROV sampling had not obtained any hydrate, but the ROV was covered in oily residue, especially, after the effort to collect oil-samples. The oil started to degas at shallow water depth, giving rise to the acoustic imaging of gas trails, similar to observations made during the ascent of the piston core at station STN23. We obtained photographs of the computer-screen but no gain-adjustments or post-processing were possible as the data was not recorded digitally.
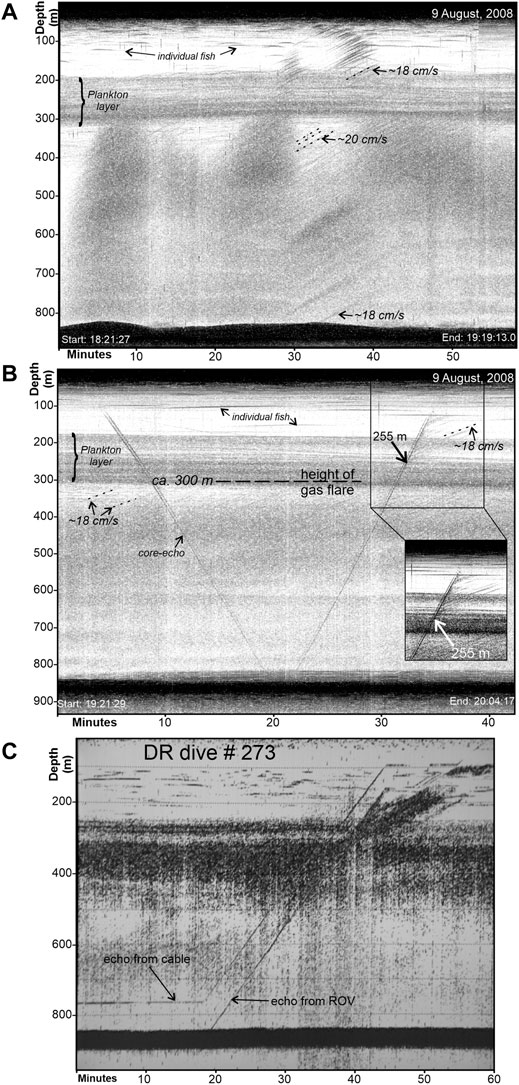
FIGURE 13. Examples of EK60 echograms: (A) from expedition PGC0807 at location above gas hydrate mounds near the fault line, (B) at piston core taken at STN23, and (C) photograph of echogram onboard R/V Western Flyer, taken during ascent of ROV Doc Ricketts (for locations see Figure 8). On all examples, gas rising from the seafloor can be clearly seen up to a depth of ∼300 m. Additional gas bubble trails unconnected to the seafloor are seen starting at ∼ 250 m up to depths as shallow as ∼ 50 m (limit of sounder-resolution). Bubble rise-rates are consistently around 18–20 cm/s.
Sediment Physical Property Measurements and Pore-Water Sampling
To date, only two piston cores from the region close to the gas hydrate mounds are available (Haacke et al., 2022) and neither contained observable gas hydrate (Figure 8). Core STN23 was 2.26 m long but was noted to contain oily fluids above 1.1 m bsf. The upper 1.1 m bsf are green to green-grey soft sediment, containing open cracks and fractures, shell fragments, and carbonate concretions (Supplementary Figure S6). Below that depth, the core was devoid of oil and contained a dense, light grey glaciomarine clay unit with some ice-rafted granodiorite debris and fine sand, but no fractures. Only 38 cm of sediment were recovered at STN24. The sediments of STN24 were described as medium olive grey pebbly sand to silty clay (Supplementary Figure S6). This core ended in carbonate crusts. For both cores, magnetic susceptibility and electrical resistivity (Supplementary Figure S7) were measured immediately onboard revealing details of the sediment composition. An intriguing similarity is a sharp decrease in susceptibility values within the upper 10 cm. The susceptibility record for the glaciomarine clay seen at STN23 is overall much more variable than that seen within the upper section, which may be a result from transported material, such as ice-rafted debris. Electrical resistivity varies slightly between 0.4 and 0.8 Ωm throughout the two cores and shows a general higher average value within the glaciomarine sediments below 1.1 m bsf. Using Archie’s relationship (Archie, 1942) we converted the resistivity data to porosity. The porosity values obtained are only a rough estimate as no independent porosity data are available. However, they differentiate well the two different lithologies found. Porosity within the upper sediments is between 0.6 and 0.7, and is reduced to ∼0.5 within the glaciomarine sediments. Some potential outliers were noted in the data (marked in Supplementary Figure S7) from the occurrence of minor core disturbance (cracks and voids).
During a previous expedition in 2001 (Ventflux2, Spence et al., 2001b) coring was conducted approximately 1.5 km further SW of the prominent gas hydrate mounds. Three cores were taken (C9, C10 and C12) that contrast the results from the region of the gas hydrate mounds. Sediments were described as dominantly homogenous greenish-grey clay with some lamination containing silty clay or thin sandy intervals (Spence et al., 2001b). Electrical resistivity and converted porosity on cores C10 and C12 are nearly constant throughout the entire cored interval reflecting the homogenous sediment type (Supplementary Figure S8).
Pore water sulfate concentration profiles are a proxy for methane flux/advection rates (Borowski et al., 1996). Sulfate profiles from piston and push cores demonstrate high methane flux/advection rates at the gas hydrate mounds (Supplementary Figure S9). The depth to no sulfate is <20 cm directly at the gas hydrate mounds (push cores 798-C1, 799-C2, and 803-C1, with linear sulfate gradients of 1.95, 2.11, and 1.58 mmol cm−1, respectively). With increasing distance from the mounds, the depth to no sulfate increases gradually. At Core STN24 (∼50 m from the mound where push cores were taken), the depth of no sulfate is projected to ∼50 cm (although the sulfate profile is not linear). At core STN23, ∼100 m away from the same mound, this depth is at ∼1 m with a linear sulfate gradient of 0.27 mmol cm−1. The two cores taken more than 1 km away from the mounds (2001-C9, -C12, linear sulfate gradients of 0.036 and 0.033 mmol cm−1, respectively) reflect low flux rates with the depth of no sulfate being >8 m, which has been observed previously along the northern Cascadia margin away from other known vent sites (Solem et al., 2002; Riedel et al., 2006b; Pohlman et al., 2013). Using the approach by Borowski et al. (1996) to convert the linear sulfate gradients into sulfate flux rates, we used an average porosity of 0.6 based on our electrical resistivity data and simplified Archie conversion, and a sulfate diffusion coefficient of 5.8 × 10⁻⁶ cm2 s−1 (Li and Gregory, 1974). The region of the gas hydrate mound experiences an average sulfate flux rate of ∼75 × 10−3 mM cm−2 yr−1 whereas the background sulfate flux rate far away from the mounds is 1.4 × 10⁻³ mM cm−2 yr−1, which is smaller by a factor of ∼50 than the mound region flux. Assuming a stoichiometric balance between the downward flux in sulfate and the upward flux of methane (with a diffusion coefficient of 0.9 × 10⁻⁵ cm2 s−1 at 5°C and ∼9 MPa pressure for the average water depth where our cores were taken; Kossel et al., 2013), the sulfate flux rates translate to average methane gradients of 1.1 mmol m−1 as the background value, compared to ∼58 mmol m−1 near the mounds.
Discussion
Origin of Thermogenic Fluid Seepage
The occurrence of the gas hydrate mounds and associated leakage of thermogenic hydrocarbons at Barkley Canyon is rather unique. No location with similar gas composition has been identified to date along the northern Cascadia margin, despite the wide spatial extent of the oil-bearing Tofino Basin (e.g., Johns et al., 2006; Hayward and Calvert, 2007; Johns et al., 2012), the presumed source region for the thermogenic hydrocarbons leaking at Barkley Canyon (Pohlman et al., 2005). Compositional and carbon isotope ratio data from gases extracted from oil samples collected in 2011 (Figure 12) further strengthen this link. Additionally, analyses of authigenic carbonate rocks recovered at the gas hydrate mounds show evidence of a deep-rooted fluid source (Joseph et al., 2012, 2013). Although the geochemical composition of the gases, hydrates, and carbonate samples suggest a connection to the Tofino Basin (the only basin deep and old enough for thermal conditions appropriate for hydrocarbon generation off northern Cascadia (Schümann et al., 2008)), the tectonic setting of the margin and deformation of the basin (e.g., Hayward and Calvert, 2007; Yelisetti and Spence, 2021) makes a simple lateral migration pathway difficult. It is, however, possible, that during early hydrocarbon generation, a portion of that oil and gas did migrate in a westerly direction and may have gotten trapped in sub-basins that are presently disconnected from the source region. As the seismic data demonstrate, Barkley Canyon has eroded into the unit of older folded and faulted sediments (Figure 3). Drilling on the Cascadia shelf was completed in the past at several well locations (Shouldice, 1971), but correlation of ages to seismically imaged strata proved highly complex (Naranyan et al., 2005; Hayward and Calvert, 2007). However, it is conceivable that sediments identified as likely reservoir rocks (traps) by Schümann et al. (2008) are occurring within the depth range of Barkley Canyon’s erosional cut. Faulting as seen on the seismic data of these units thus may provide pathways for oil and gas migration to the seafloor from these formerly trapped reservoirs.
An additional, previously unrecognized, feature of the area of the gas hydrate mounds is the emplacement of the seepage nearly exclusively on a rotational fault block. Two deeper penetrating seismic profiles provide useful images of the canyon wall structures, and corroborate that rotational block failure is a common style of canyon flank collapse (Figures 3A, 6C). A large sinusoidal fault line on the northern flank of the canyon wall is identified on the AUV bathymetric data (Figures 5, 8) and Chirp profiles (Figure 7) that marks the north-western limit of seepage features and the fault block (Figure 8). Thus, the sinusoidal fault is inferred to be a pathway for hydrocarbon migration.
BSR and s-II Gas Hydrate
Seismic imaging of the mound-region proved highly difficult due to the complex nature of steep canyon topography. Where clear images of a BSR were obtained, they were at a sub-seafloor depth of around 150 m (0.19 s twt, average sediment P-wave velocity of 1,600 m/s), about 1 km south of the fault-block that hosts the gas hydrate mounds (Figure 3). BSRs are wide-spread in all other seismic data sets acquired across the north-western canyon-wall (esp. those data from 1996) and further upslope of the canyon itself, which suggests a similar thermal regime with an expected BSR depth in accordance with the s-I methane hydrate phase boundary. The available gas composition provided in Pohlman et al. (2005) enables the theoretical phase boundary for such hydrocarbon mix to be calculated and compared to the s-I methane hydrate system in seawater (Figure 14). As expected, the thermogenic hydrate phase boundary is shifted to higher temperatures for equivalent pressure values. If we assume a thermal gradient representative for the distance of the mounds relative to the deformation front (∼30 km), we would expect a heat value of 70–80 mW/m2 in accordance with the fluid-expulsion model and overall subduction-related thermal structure of the accretionary prism (e.g., Hyndman and Davis, 1992; Riedel et al., 2010b). Assuming a linear geothermal gradient, the predicted depth of the s-I related BSR is ∼140 m bsf and nearly twice as deep for the theoretical gas hydrate phase boundary containing thermogenic gases (at ∼280 m bsf). Acknowledging the uncertainties in all the calculations required to convert BSR depth on seismic data to depth (foremost unknown velocity), the BSRs identified anywhere along our data are most consistent with s-I methane hydrate, i.e., the regional BSR is not formed primarily from the thermogenic gas. No second BSR is seen anywhere along the margin, which leads to the conclusion that thermogenic gases at depth are occurring (if at all) at such low concentrations, that no pervasive s-II hydrate regime is developed (as seen at the seafloor), giving rise to either a significantly deeper primary BSR or a second impedance contrast, as for example seen off Borneo (Paganoni et al., 2016).
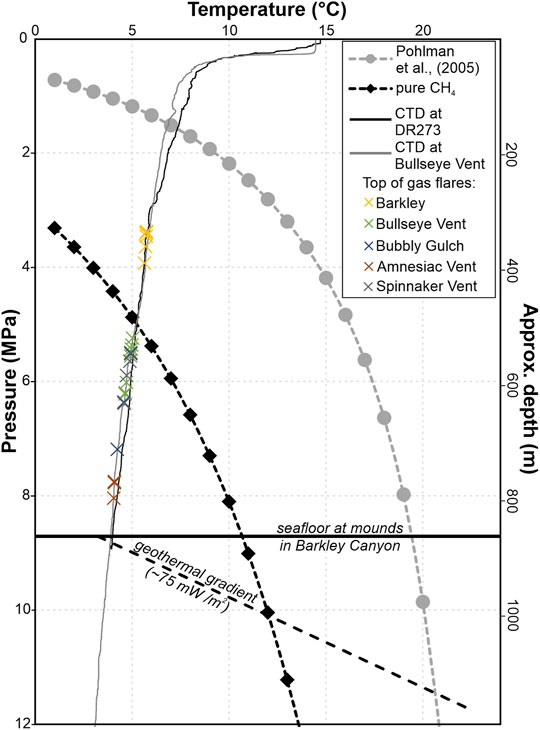
FIGURE 14. Gas hydrate phase boundaries for two hydrocarbon mixtures in seawater calculated with the CSMHYD-software (Sloan and Koh, 2008). A simple linear geothermal gradient representative of the expected average regional thermal regime intersects the s-I phase boundary at ∼ 140 m bsf and the thermogenic phase boundary at ∼ 280 m bsf. Data from a CTD at Bullseye Vent (∼50 km NW of Barkley Canyon) and from ROV dive DR273 at Barkley Canyon are shown together with the temperature/pressure points for the maximum height of gas plumes at vent locations seen in northern Cascadia (see inset of Figure 1) reported by Scherwath et al. (2019). Approximate depth was defined using a seawater density of 1,030 kg/m3.
Localized Lateral Fluid Migration
The elongated, sinusoidal fault-line is interpreted as a major fluid pathway, but this does not fully explain the wide distribution over 250 m N-S of the gas hydrate mounds and also the more diffuse seepage features observed (Figures 8–11). The Chirp data show that sediment layers within the upper ∼10 m bsf of the rotated fault block are themselves tilted towards the fault-line (Figures 7D–F). We therefore propose that the fluids initially migrating from depth upwards along the sinusoidal fault-line are then laterally distributed along more permeable sediment layers. The geometry of the tilted layers and the overall surface of the fault block promotes fluid drainage, which is buoyancy-driven. The formation of gas hydrate requires additional accommodation space and blisters are formed on the seafloor, displacing surrounding sediment (Figures 7C,D). Although coring was successful only at one location to greater depths, the one core recovered (STN23) indicates that the occurrence of oil-stained sediment is primarily a surface phenomenon rather than pervasively infusing the strata that comprise the fault block throughout the entire depth ranges recovered. The lower glaciomarine clay was barren of any hydrocarbon and showed no signs of fractures or fluid-pathways.
Distribution of Fluid Seepage Features
We have managed to review nearly 60 individual ROV dive-videos capturing fluid-seepage related features on the seafloor (Figures 8–11, Supplementary Figures S4, S5) allowing an interpretation of the longevity of fluid seepage and possible lateral variations therein.
Gas Hydrate Mounds
The gas hydrate mounds are the most distinctive feature of the seafloor suggesting active and sustained fluid advection from depth. Yet, gas hydrate is inherently unstable in direct contact with seawater as ocean water is devoid of any methane, thus the question of how stable these gas hydrate mounds are arises. Long-term geochemical fluid-sampling with a pore-fluid array directly at the southern-most gas hydrate mound (location see Figure 8) reported by Wilson et al. (2015) showed slower dissolution rates for the sediment-covered gas hydrate than what was expected from laboratory measurements. Observations made on recovered hydrate samples from the gas hydrate mounds showed dissolution rates within 20% of the predicted theoretical values and a retreat-rate of 1 m/year for the exposed hydrate surfaces was estimated (Hester et al., 2009). Pore fluid analyses reported by Lapham et al. (2010) reveal that pore-fluids in sediments near the gas hydrate mounds are greatly under-saturated in methane with respect to expected values for equilibrium with the gas hydrate so that the mounds should be dissolving. The fact that the mounds have been seen in nearly identical dimensions throughout the 15 years of repeated video-observations supports the conclusion by Lapham et al. (2010) that some diffusion-retarding process protects the mounds and enhances their stability. But more so, fluids rich in hydrocarbons are likely constantly replenished from depth to maintain the gas hydrate mounds, which is supported by the high methane flux rates found by our new analyses. The determined sulfate flux rates at the gas hydrate mound (Supplementary Figure S9) where the pore-fluid array was located indicate an average downward sulfate flux rate of 75 mM cm−2 yr−1, equivalent to an average methane gradient of 58 mM m−1, which is about 50 times the average background fluxes distal to the seepage area.
Gas Flares and Oil-Seepage
Acoustic detection of gas flares was made initially by ship-mounted single-beam echosounders, but provided a broad footprint and thus large uncertainty in actual vent location of ∼150 m. The use of the AUV’s side-scan sonar provided us with an opportunity to better mark the gas-flare positions, in addition to the video-based definition from the ROV dives. In many cases, the gas flare positions from all these sources agree within a radius of ∼20 m. The AUV side-scan sonar data showed 35 flare sites in total across the study area (Figures 8, 10), out of which five are associated with locations defined by ship single-beam data. Four of the AUV flare sites match with ROV video observations, but not all ROV gas observations were matched by either AUV or ship-based data. The mismatch between observations is that venting is known to be episodic or discontinuous (e.g., Römer et al., 2016). Yet, the AUV-defined gas flares west of the prominent gas hydrate mounds, in a region otherwise completely devoid of any features suggesting active fluid seepage, are enigmatic. A possible explanation is a mismatch in observational coverage between the narrow ROV bottom video footage of a few meters and the wider AUV water-column imaging (up to 100 m width to both sides of the AUV). Active fluid seepage sites may be small and have simply not been found yet in this region.
Following the gas flares acoustically to shallower water depths using the ship-mounted echosounder data allows us to further investigate the fate of these gases in the water column (Figure 13). Gas flares above the gas hydrate mounds at Barkley Canyon are seen up to a water depth of ∼300 m. Using CTD data measured during a ROV descent we are able to plot these depths into the theoretical gas hydrate phase diagrams (Figure 14). Those gas flares plot all above the s-I methane hydrate phase boundary. This is in contrast to other gas flares previously detected at other vents (e.g., Römer et al., 2016; Riedel et al., 2018; Scherwath et al., 2019) that all are occurring below the s-I phase boundary (here using CTD data measured directly above Bullseye Vent (∼50 km NW of Barkley Canyon) during a water sampling campaign in 2010). Gas escaping at the seafloor is always immediately coated by a thin shell of gas hydrate, which helps stabilize the ascent of the gas bubble (Topham, 1984; Rehder et al., 2002). Acoustic detection of gas flares is thus often limited to the depths of the hydrate stability in seawater, as the gas is quickly dissolved into the ocean upon the loss of the hydrate coating and thus becomes acoustically invisible. Thus, gas escaping at the gas hydrate mounds must be coated with a mix of s-I and s-II gas hydrate. With this in mind, the occurrence of gas trails in echosounder data in water depths between 250 and 50 m at two sites above gas hydrate mounds at Barkley Canyon is unusual (Figures 13A,B). We interpret this as acoustic returns from gas that escapes from rising oil-covered bubbles. Degassing of oil was probably the cause of free gas release upon the ascent of the ROV Doc Ricketts in 2011 after oil samples were collected at the seafloor (Figure 13C). Since oil droplets rising in the water column cannot easily be distinguished from gas bubbles, these observations of unusually shallow gas bubble trails in water column acoustic data may be a way to remotely detect oil-seepage at the seafloor.
Occurrence of Rock Debris
The overall canyon wall is prone to repeated slope failures and many head-scarps are identified on the AUV bathymetry (Figures 2, 5). Sediment sloughed off the canyon wall is deposited in small catchment mini-basins or transported further downward into the canyon floor and subsequently transported further downslope. These mini-basins are regions identified with a smooth seafloor morphology barren of any seepage features. This is contrasted by regions of rougher morphology (undulating seafloor, see Figures 2, 5, 7B) that also are riddled by rock-debris (Supplementary Figures S2, S3). The abundant occurrence of these rocks in the region identified as undulating seafloor suggests either transport of these rocks downslope by small debris flows or as outcrop/remnant of older sedimentary units where finer sediments are scoured by seafloor currents. However, similar rocks are seen across the entire region of gas hydrate mounds and at the steep cliffs and south-facing wall of the rotational fault block. These rocks here are possibly drop stones (from ice bergs or ice rafts floating out from the shelf at the end of the last ice age) or deposited during former downslope failure processes, as this sub-region is presently isolated from new sediment input due to the elevated topography and fault-line-related development of a mini-basin (Figure 8). However, abundant gas seepage, microbial activity and macro-fauna bioerosion results in constant re-working of the upper sediment cover and its removal by currents, thus keeping these rocks exposed.
Summary and Conclusion
Overall, the Barkley Canyon area is unique along the northern Cascadia margin because of the occurrence of numerous seafloor gas hydrate mounds linked to thermogenic fluids resulting in the formation of s-II and s-H gas hydrate within a relatively small (0.02 km2) area. The origin of these thermogenic fluids is explained by lateral fluid-migration in the Eocene during early hydrocarbon generation from the Tofino Basin (∼60 km landwards of the study site), trapping in sub-basins further to the west, and subsequent erosion by Barkley Canyon. Despite the occurrence of thermogenic hydrocarbons and complex gas hydrate structures at the seafloor, the seismic data suggest no presence of significant amounts of such clathrate structures at greater depth, as no second BSR was identified anywhere in the region. The suggested source-region for thermogenic hydrocarbons in the Tofino Basin is perhaps much broader than just a small zone near Barkley Canyon, as the Tofino Basin extends up to 100 km northward along the coast. If significant amounts of thermogenic hydrocarbons exist at greater depth that could promote s-II gas hydrate formation, a second BSR would be expected. The seismic data coverage inside the canyon and above the gas hydrate mounds is sparse but the few examples seen suggest a BSR depth in equilibrium to s-I methane hydrate representing the regional heat-flow regime of around 70–80 mW m−2. Identical ranges in heat flow and associated BSR depths are seen north of the canyon. There are two possible reasons for the apparent lack of a 2nd BSR: either the thermogenic hydrocarbons are tightly focused to only a few migration pathways preventing regional spreading, or concentrations at greater depths are too small to allow formation of abundant s-II hydrates to form a permeability barrier for free gas that then gives rise to an impedance contrast imageable with seismic methods.
Due to the migration of thermogenic fluids and abundant oil seepage from the seafloor, another unique characteristic of this study site is the occurrence of gas flares reaching to near sea surface, which has not been observed elsewhere along the Cascadia margin. Usually, gas flares in water depths >800 m are acoustically observed to near the upper limit of the s-I gas hydrate stability zone. Gas flares above the gas hydrate mound region instead reach to an upper limit of ∼300 m, shallower than s-I hydrate, suggesting gas bubbles coated with more complex clathrate structures. Additionally, gas is acoustically seen from 250 m to < ∼50 m suggesting that oil-coated bubbles start to degas upon reaching such shallow water depths. This may promote hydrocarbon release into the atmosphere which otherwise is rather limited due to the uptake of gas into the water column by chemical (solution, oxidation) and biological (metabolism) processes. The Barkley Canyon site would benefit from repeat remote radar satellite observations for natural oil-slicks, similar to sites in the Gulf of Mexico (e.g., MacDonald et al., 1996), to better understand temporal variability and amount of hydrocarbon migration.
Seafloor topography from the AUV mapping and repeat ROV video surveys suggest a zone of focused fluid flow including oil seepage and gas hydrate occurrence in two sub-regions of the rotated fault block. The largest of these sub-regions is approximately 200 m by 200 m in extent at the western end of the block (with the site of the seafloor crawler Wally) and hosts at least 20 individual mounds (or mound-complexes). The gas hydrate mounds host unique chemosynthetic communities with bacterial mats, clam colonies, and other macro-fauna within a tightly limited habitat-zone in a perimeter of only few meters around the individual mounds. A second focused fluid flow sub-region that is much smaller in spatial extent (∼40 m (E-W) by ∼220 m (N-S)) is located at the eastern edge of the fault block and hosts three visually confirmed gas hydrate mounds. In between these two sub-regions, a zone of diffuse venting with only few distinctive chemosynthetic organisms and minor carbonate crusts was recognized. Here, seafloor topography is much more subtle and no gas hydrate mounds have been seen.
From our analysis of AUV bathymetry data and Chirp imaging, we conclude emplacement of the Barkley Canyon site is uniquely associated with a rotated fault block, promoting focused fluid seepage. The surface of the fault-block is in itself tilted towards the north-eastern canyon wall of Barkley Canyon. The dense clustering of gas hydrate mounds is the result of focused fluid seepage predominantly at the edges of the rotated fault block. Fluid migration is further facilitated away from the main feeding-fault along more permeable sedimentary layers as suggested by the AUV Chirp data. The existing cores only recovered oil-stained sediments within a thin 1.3 m bsf upper veneer. The underlying dense glaciomarine clay unit was barren of any indications of oil, fractures, or other possible seepage pathways. Thus, the oil was possibly not migrating from below through (semi-) vertical pathways, but rather appears lithology controlled, suggesting a more pronounced lateral transport. This is corroborated by the AUV’s Chirp data that showed tilted sediment strata within the upper 10 m bsf of the marked bathymetric bench that hosts the gas hydrate mounds. A conceptual diagram (Figure 15) depicts the occurrence of the bathymetric bench and associated fluid seepage and gas hydrate mounds as a result of fault-focused fluid migration from some deeper reservoir and then lateral diversion through permeable strata across the bench. This could be verified with new piston coring and some carefully designed seismic imaging, best with deep-towed systems, to improve imaging inside the steep canyon topography.
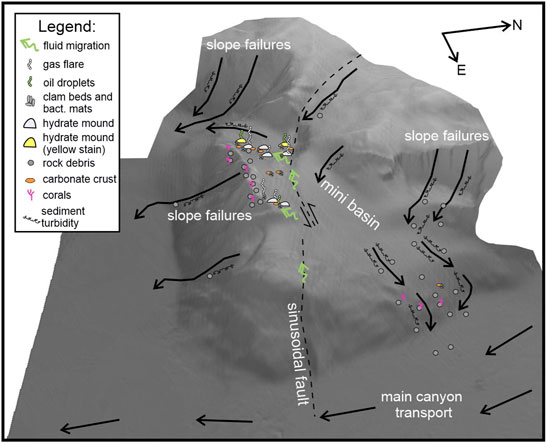
FIGURE 15. Diagram of processes allowing gas hydrate emplacement at the Barkley Canyon site. The canyon has eroded deep into the sedimentary section of the accretionary prism, exposing sediment/rocks that had accumulated thermogenic fluids in the past. The fluids seep upwards along faults and the edges of the rotated block that had slipped down the canyon wall. Additional buoyancy-driven fluid seepage occurs along sedimentary strata. Gas hydrate mounds form on the seafloor and excess fluids are expelled into the ocean. Over time, the edges of the block are eroded and sediment and debris are transported downslope into the main canyon channel or are left behind on the seafloor. Slope failures along the upper canyon wall are caught in smaller mini basins or are bypassed downslope.
Data Availability Statement
Video and image data used from ROV dives are available at Ocean Networks Canada online database https://data.oceannetworks.ca/DataSearch.
Author Contributions
MRi wrote the initial manuscript and performed all analyses of the seismic and acoustic data used, esp. the repeat-video investigation. CP and PB were chief scientists of MBARI ROV exepditions in 2009 and 2011. GS and NC were chief scientists of several expeditions providing seismic, piston core, and ROV data. EL and DC provided AUV bathymetry, backscatter and Chirp data and conducted together with MRö all work for data integration. KD and MS provided all ROV video data and other ONC monitoring information. MW, JP, and LL provided all geochemical data and interpretation. RE provided the sediment core physical property data. All authors contributed to manuscript revision, read, and approved the submitted version.
Funding
The David and Lucile Packard Foundation provided support for the MBARI operations used in this study. Any use of trade, firm, or product names is for descriptive purposes only and does not imply endorsement by the U.S. Government.
Conflict of Interest
The authors declare that the research was conducted in the absence of any commercial or financial relationships that could be construed as a potential conflict of interest.
Publisher’s Note
All claims expressed in this article are solely those of the authors and do not necessarily represent those of their affiliated organizations, or those of the publisher, the editors and the reviewers. Any product that may be evaluated in this article, or claim that may be made by its manufacturer, is not guaranteed or endorsed by the publisher.
Acknowledgments
The authors would like to express their sincere gratitude towards the many individual people who were involved in the various expeditions, ROV-dives, data acquisition, and processing of data, including all ship’s crews and technical support staff. The ROPOS ROV data as well all other ONC data are accessible though Ocean Networks Canada’s data portal data. oceannetworks.ca. MRi is grateful for the support provided from ONC’s data stewardship team, as well as its data analytics and quality team and the science team through ONC’s Enhanced Support Program. Ocean Networks Canada is an initiative of the University of Victoria and has primarily been funded by the Canadian Foundation for Innovation, Transport Canada, Fisheries and Oceans Canada, and the Canadian Province of British Columbia. This is UMCES contribution # 6119.
Supplementary Material
The Supplementary Material for this article can be found online at: https://www.frontiersin.org/articles/10.3389/feart.2022.852853/full#supplementary-material
References
Archer, D., Buffett, B., and Brovkin, V. (2009). Ocean Methane Hydrates as a Slow Tipping point in the Global Carbon Cycle. Proc. Natl. Acad. Sci. 106 (49), 20596–20601. doi:10.1073/pnas.0800885105
Archie, G. E. (1942). The Electrical Resistivity Log as an Aid in Determining Some Reservoir Characteristics. Trans. AIME 146, 54–62. doi:10.2118/942054-G
Auguy, C., Calvès, G., Calderon, Y., and Brusset, S. (2017). Seismic Evidence of Gas Hydrates, Multiple BSRs and Fluid Flow Offshore Tumbes Basin, Peru. Mar. Geophys. Res. 38, 409–423. doi:10.1007/s11001-017-9319-2
Bangs, N. L. B., Musgrave, R. J., and Tréhu, A. M. (2005). Upward Shifts in the Southern Hydrate Ridge Gas Hydrate Stability Zone Following Postglacial Warming, Offshore Oregon. J. Geophys. Res. 110, B03102. doi:10.1029/2004JB003293
Barnes, C. R., Best, M., Johnson, F. R., Pautet, L., and Pirenne, B. (2011). Understanding Earth - Ocean Processes Using Real-Time Data from NEPTUNE Canada's Widely Distributed Sensor Networks, Northeast Pacific. Geosci. Can. 38 (1), 21–30. Available at: https://journals.lib.unb.ca/index.php/gc/article/view/18588/20203 ([last accessed February 21, 2022).
Bernard, B. B., Brooks, J. M., and Sackett, W. M. (1976). Natural Gas Seepage in the Gulf of Mexico. Earth Planet. Sci. Lett. 31, 48–54. doi:10.1016/0012-821X(76)90095-9
Berner, U., and Faber, E. (1996). Empirical Carbon Isotope/maturity Relationships for Gases from Algal Kerogens and Terrigenous Organic Matter, Based on Dry, Open-System Pyrolysis. Org. Geochem. 24 (10-11), 947–955. doi:10.1016/S0146-6380(96)00090-3
Borowski, W. S., Paull, C. K., and Ussler, W. (1996). Marine Pore-Water Sulfate Profiles Indicate In Situ Methane Flux from Underlying Gas Hydrate. Geol 24, 6552–6658. doi:10.1130/0091-7613(1996)024<0655:MPWSPI>2.3.CO
Boswell, R., and Collett, T. S. (2011). Current Perspectives on Gas Hydrate Resources. Energy Environ. Sci. 4, 1206–1215. doi:10.1039/C0EE00203H
Brooks, J. M., Kennicutt, M. C., Fay, R. R., McDonald, T. J., and Sassen, R. (1984). Thermogenic Gas Hydrates in the Gulf of Mexico. Science 225 (4660), 409–411. doi:10.1126/science.225.4660.409
Buffett, B., and Archer, D. (2004). Global Inventory of Methane Clathrate: Sensitivity to Changes in the Deep Ocean. Earth Planet. Sci. Lett. 227, 185–199. doi:10.1016/j.epsl.2004.09.005
Bustin, R. M. (1995). Organic Maturation and Petroleum Source Rock Potential of Tofino Basin, Southwestern British Columbia. Bull. Can. Pet. Geology. 43 (2), 177–186. doi:10.35767/gscpgbull.43.2.177
Caress, D. W., Chayes, D. N., and dos Santos Ferreira, C. (2017). MB-system: Mapping the Seafloor. Available at: https://www.mbari.org/products/research-software/mb-system/(last accessed October 14, 2021).
Chapman, N. R., Gettrust, J. F., Walia, R., Hannay, D., Spence, G. D., Wood, W. T. R. D., et al. (2002). High‐resolution, Deep‐towed, Multichannel Seismic Survey of Deep‐sea Gas Hydrates off Western Canada. Geophysics 67, 1038–1047. doi:10.1190/1.1500364
Chapman, R., Pohlman, J., Coffin, R., Chanton, J., and Lapham, L. (2004). Thermogenic Gas Hydrates in the Northern Cascadia Margin. Eos Trans. AGU 85 (38), 361. doi:10.1029/2004EO380001
Chung, H. M., Gormly, J. R., and Squires, R. M. (1988). Origin of Gaseous Hydrocarbons in Subsurface Environments: Theoretical Considerations of Carbon Isotope Distribution. Chem. Geology. 71 (1-3), 97–104. doi:10.1016/0009-2541(88)90108-8
Davis, E. E., Hyndman, R. D., and Villinger, H. (1990). Rates of Fluid Expulsion across the Northern Cascadia Accretionary Prism: Constraints from New Heat Row and Multichannel Seismic Reflection Data. J. Geophys. Res. 95 (B6), 8869–8889. doi:10.1029/JB095iB06p08869
Foschi, M., Paganoni, M., Cartwright, J. A., and Idiz, E. (2019). Microbial vs Thermogenic Gas Hydrates in the South Falkland Basin: BSR Distribution and Fluid Origin. Mar. Pet. Geology. 102, 695–703. doi:10.1016/j.marpetgeo.2019.01.023
Foucher, J. P., Nouzé, H., and Henry, P. (2002). Observation and Tentative Interpretation of a Double BSR on the Nankai Slope. Mar. Geol. 187 (1), 161–175. doi:10.1016/S0025-3227(02)00264-5
Freire, A. F. M., Matsumoto, R., and Santos, L. A. (2011). Structural-stratigraphic Control on the Umitaka Spur Gas Hydrates of Joetsu Basin in the Eastern Margin of Japan Sea. Mar. Pet. Geology. 28 (10), 1967–1978. doi:10.1016/j.marpetgeo.2010.10.004
Ganguly, N., Spence, G. D., Chapman, N. R., and Hyndman, R. D. (2000). Heat Flow Variations from Bottom-Simulating Reflectors on the Cascadia Margin. Mar. Geol. 164 (1–2), 53–68. doi:10.1016/S0025-3227(99)00126-7
Grevemeyer, I., and Villinger, H. (2001). Gas Hydrate Stability and the Assessment of Heat Flow through continental Margins. Geophys. J. Int. 145, 647–660. doi:10.1046/j.0956-540x.2001.01404.x
Gwiazda, R., Paull, C. K., Caress, D. W., Lorenson, T., Brewer, P. G., Peltzer, E. T., et al. (2016). “Eel Canyon Slump Scar and Associated Fluid Venting,” in Submarine Mass Movements and Their Consequences, 7th International Symposium. Editors G. Lamarche, J. Mountjoy, S. Bull, T. Hubble, S. Krastel, A. Micallefet al. (Springer), 411–418. doi:10.1007/978-3-319-20979-1_41
Haacke, R., Hamilton, T. S., Enkin, R. J., Esteban, L., and Pohlman, J. W. (2022). 2008007PGC Cruise Report: study of marine gas hydrates at the frontal ridge and mid-slope areas of the Vancouver Island accretionary wedge; Geological Survey of Canada, Open File 8874, 172. doi:10.4095/329697
Haacke, R. R., Westbrook, G. K., and Hyndman, R. D. (2007). Gas Hydrate, Fluid Flow and Free Gas: Formation of the Bottom-Simulating Reflector. Earth Planet. Sci. Lett. 261 (3), 407–420. doi:10.1016/j.epsl.2007.07.008
Hayward, N., and Calvert, A. J. (2007). Seismic Reflection and Tomographic Velocity Model Constraints on the Evolution of the Tofino Forearc basin, British Columbia. Geophys. J. Int. 168 (2), 634–646. doi:10.1111/j.1365-246X.2006.03209.x
He, T., Spence, G. D., Riedel, M., Hyndman, R. D., and Chapman, N. R. (2007). Fluid Flow and Origin of a Carbonate mound Offshore Vancouver Island: Seismic and Heat Flow Constraints. Mar. Geology. 239, 83–98. doi:10.1016/j.margeo.2007.01.002
Hester, K. C., Peltzer, E. T., Walz, P. M., Dunk, R. M., Sloan, E. D., and Brewer, P. G. (2009). A Natural Hydrate Dissolution experiment on Complex Multi-Component Hydrates on the Sea Floor. Geochimica et Cosmochimica Acta 73, 6747–6756. doi:10.1016/j.gca.2009.08.007
Holbrook, W. S. (2001). “Seismic Studies of the Blake Ridge: Implications for Hydrate Distribution, Methane Expulsion, and Free Gas Dynamics,” in Natural Gas Hydrates: Occurrence, Distribution, and Detection. Editors C. K. Paull, and W. P. Dillon (Washington, DC: AGU Geophysical Monograph), 124, 235–256. doi:10.1029/GM124p0235
Hornbach, M. J., Holbrook, W. S., Gorman, A. R., Hackwith, K. L., Lizarralde, D., and Pecher, I. (2003). Direct Seismic Detection of Methane Hydrate on the Blake Ridge. Geophysics 68, 92–100. doi:10.1190/1.1543196
Hunt, J. M., Huc, A. Y., and Whelan, J. K. (1980). Generation of Light Hydrocarbons in Sedimentary Rocks. Nature 288, 688–690. doi:10.1038/288688a0
Hyndman, R. D., and Davis, E. E. (1992). A Mechanism for the Formation of Methane Hydrate and Seafloor Bottom-Simulating Reflectors by Vertical Fluid Expulsion. J. Geophys. Res. 97 (B5), 7025–7041. doi:10.1029/91jb03061
Hyndman, R. D., and Spence, G. D. (1992). A Seismic Study of Methane Hydrate marine Bottom Simulating Reflectors. J. Geophys. Res. 97 (B5), 6683–6698. doi:10.1029/92JB00234
Hyndman, R. D., Spence, G. D., Chapman, R., Riedel, M., and Edwards, R. N. (2001). “Geophysical Studies of marine Gas Hydrate in Northern Cascadia,” in Natural Gas Hydrates: Occurrence, Distribution, and Detection.. Editors C. K. Paull, and W. P. Dillon, 124, 273–295.Geophys. Monogr
Hyndman, R. D. (1995). The Lithoprobe Corridor across the Vancouver Island continental Margin: the Structural and Tectonic Consequences of Subduction. Can. J. Earth Sci. 32, 1777–1802. doi:10.1139/e95-138
Hyndman, R. D., Wang, K., Yuan, T., and Spence, G. D. (1993). Tectonic Sediment Thickening, Fluid Expulsion, and the thermal Regime of Subduction Zone Accretionary Prisms: the Cascadia Margin off Vancouver Island. J. Geophys. Res. 98 (B12), 21865. doi:10.1029/93JB02391
Jenden, P. D., Drazan, D. J., and Kaplan, I. R. (1993). Mixing of Thermogenic Natural Gases in Northern Appalachian Basin. Bulletin 77 (6), 980–998. doi:10.1306/BDFF8DBC-1718-11D7-8645000102C1865D
Johns, M. J., Barnes, C. R., and Narayan, Y. R. (2006). Cenozoic Ichthyolith Biostratigraphy: Tofino Basin, British Columbia. Can. J. Earth Sci. 43, 177–204. doi:10.1139/E05-102
Johns, M. J., Trotter, J. A., Barnes, C. R., and Narayan, Y. R. (2012). Biostratigraphic, Strontium Isotopic, and Geologic Constraints on the Landward Movement and Fragmentation of Terranes within the Tofino Basin, British Columbia. Can. J. Earth Sci. 49, 819–856. doi:10.1139/e2012-032
Joseph, C., Campbell, K. A., Torres, M. E., Martin, R. A., Pohlman, J. W., Riedel, M., et al. (2013). Methane-derived Authigenic Carbonates from Modern and Paleoseeps on the Cascadia Margin: Mechanisms of Formation and Diagenetic Signals. Palaeogeogr. Palaeoclimatol. Palaeoecol. 390, 52–67. doi:10.1016/j.palaeo.2013.01.012
Joseph, C., Torres, M. E., Martin, R. A., Haley, B. A., Pohlman, J. W., Riedel, M., et al. (2012). Using the 87Sr/86Sr of Modern and Paleoseep Carbonates from Northern Cascadia to Link Modern Fluid Flow to the Past. Chem. Geology. 334, 122–130. doi:10.1016/j.chemgeo.2012.10.020
Kennett, J. P., Cannariato, K. G., Hendy, I. L., and Behl, R. J. (2003). Methane Hydrates in Quaternary Climate Change: The Clathrate Gun Hypothesis. Washington, D. C: AGU, 216.
Kinoshita, M., Moore, G. F., and Kido, Y. N. (2011). Heat Flow Estimated from BSR and IODP Borehole Data: Implication of Recent Uplift and Erosion of the Imbricate Thrust Zone in the Nankai Trough off Kumano. Geochem. Geophys. Geosyst. 12, a–n. doi:10.1029/2011GC003609
Klauda, J. B., and Sandler, S. I. (2005). Global Distribution of Methane Hydrate in Ocean Sediment. Energy Fuels 19 (2), 459–470. doi:10.1021/ef049798o
Kossel, E., Bigalke, N., Piñero, E., and Haeckel, M. (2013). The SUGAR Toolbox - A Library of Numerical Algorithms and Data for Modelling of Gas Hydrate Systems and marine Environments. GEOMAR Rep. (N. Ser.) 8, 160. doi:10.3289/geomar_rep_ns_8_2013
Kroeger, K. F., Plaza-Faverola, A., Barnes, P. M., and Pecher, I. A. (2015). Thermal Evolution of the New Zealand Hikurangi Subduction Margin: Impact on Natural Gas Generation and Methane Hydrate Formation - A Model Study. Mar. Pet. Geology. 63, 97–114. doi:10.1016/j.marpetgeo.2015.01.020
Kvenvolden, K. A., and McMenamin, M. A. (1980). Hydrates of Natural Gas: A Review of Their Geological Occurrences. Arlington, VA: U.S. Geol. Survey Circ. No. 825. Available at: https://pubs.usgs.gov/circ/1980/0825/report.pdf (Accessed October 26, 2021).
Kvenvolden, K. A. (1988). Methane Hydrate - A Major Reservoir of Carbon in the Shallow Geosphere? Chem. Geol. 71 (1), 41–51. doi:10.1016/0009-2541(88)90104-0
Laird, A. P., and Morley, C. K. (2011). Development of Gas Hydrates in a Deep-Water Anticline Based on Attribute Analysis from Three-Dimensional Seismic Data. Geosphere 7 (1), 240–259. doi:10.1130/GES00598.1
Lapham, L. L., Chanton, J. P., Chapman, R., and Martens, C. S. (2010). Methane Under-saturated Fluids in Deep-Sea Sediments: Implications for Gas Hydrate Stability and Rates of Dissolution. Earth Planet. Sci. Lett. 298, 275–285. doi:10.1016/j.epsl.2010.07.016
Lapham, L. L., Chanton, J. P., Martens, C. S., Sleeper, K., and Woolsey, J. R. (2008). Microbial Activity in Surficial Sediments Overlying Acoustic Wipeout Zones at a Gulf of Mexico Cold Seep. Geochem. Geophys. Geosyst. 9, a–n. doi:10.1029/2008GC001944
Lapham, L., Wilson, R., Riedel, M., Paull, C. K., and Holmes, M. E. (2013). Temporal Variability of in situ Methane Concentrations in Gas Hydrate-Bearing Sediments Near Bullseye Vent, Northern Cascadia Margin. Geochem. Geophys. Geosyst. 14 (7), 2445–2459. doi:10.1002/ggge.20167
Li, Y., and Gregory, S. (1974). Diffusion of Ions in Sea Water and in Deep-Sea Sediments. Geochimica et Cosmochimica Acta 38, 703–714. doi:10.1016/0016-7037(74)90145-8
Lu, H., Moudrakovski, I., Matsumoto, R., Dutrisac, R., and Ripmeester, J. (2008). The Characteristics of Gas Hydrates Recovered from Shallow Sediments at Umitaka spur, Eastern Margin of the Sea of Japan. AGU, Fall Meeting 2008, OS33A-1315, available online at: https://ui.adsabs.harvard.edu/abs/2008AGUFMOS33A1315L/abstract (last accessed October 27, 2021).
Lu, H., Seo, Y.-t., Lee, J.-w., Moudrakovski, I., Ripmeester, J. A., Chapman, N. R., et al. (2007). Complex Gas Hydrate from the Cascadia Margin. Nature 445, 303–306. doi:10.1038/nature05463
MacDonald, I. R., Reilly, J. F., Best, S. E., Venkataramaiah, R., Sassen, R., Amos, J., et al. (1996). “A Remote-Sensing Inventory of Active Oil Seeps and Chemosynthetic Communities in the Northern Gulf of Mexico,” in Hydrocarbon Migration and its Near-Surface Expression, AAPG Mem (Tulsa, Okla: Am. Assoc. of Pet. Geol.), 66, 27
MacDonald, I. R., Sager, W. W., and Peccini, M. B. (2003). Gas Hydrate and Chemosynthetic Biota in Mounded Bathymetry at Mid-slope Hydrocarbon Seeps: Northern Gulf of Mexico. Mar. Geology. 198 (1-2), 133–158. doi:10.1016/s0025-3227(03)00098-7
McIver, R. D. (1981). “Gas Hydrates,” in Long-Term Energy Resources. Editors R. F. Meyer, and J. C. Olson (Boston, MA: Pitman), 713–726.
Mi, Y. (1998). Seafloor Sediment Coring and Multichannel Seismic Studies of Gas Hydrate. Victoria, BC, Canada: offshore Vancouver Island, MSc thesis, School of Earth and Ocean Sciences, University of Victoria.
Milkov, A. V., and Etiope, G. (2018). Revised Genetic Diagrams for Natural Gases Based on a Global Dataset of >20,000 Samples. Org. Geochem. 125, 109–120. doi:10.1016/j.orggeochem.2018.09.002
Milkov, A. V. (2005). Molecular and Stable Isotope Compositions of Natural Gas Hydrates: A Revised Global Dataset and Basic Interpretations in the Context of Geological Settings. Org. Geochem. 36, 681–702. doi:10.1016/j.orggeochem.2005.01.010
Naranyan, Y. R., Barnes, C. R., and Johns, M. J. (2005). Taxonomy and Biostratigraphy of Cenozoic Foraminifers from Shell Canada wells, Tofino Basin, Offshore Vancouver Island, British Columbia. Micropaleontology 51 (2), 101–167. doi:10.1661/0026-2803(2005)051
Paganoni, M., Cartwright, J. A., Foschi, M., Shipp, R. C., and Van Rensbergen, P. (2016). Structure II Gas Hydrates Found below the Bottom-Simulating Reflector. Geophys. Res. Lett. 43, 5696–5706. doi:10.1002/2016GL069452
Paull, C. K., Caress, D. W., Thomas, H., Lundsten, E., Anderson, K., Gwiazda, R., et al. (2015). Seafloor Geomorphic Manifestations of Gas Venting and Shallow Subbottom Gas Hydrate Occurrences. Geosphere 11, 491–513. doi:10.1130/GES01012.1
Pecher, I., Crutchley, G., Mountjoy, J., Gorman, A., Fraser, D., Kroeger, K., et al. (2014). Double BSRs on the Hikurangi Margin, New Zealand - Possible Implications for Gas Hydrate Stability and Composition. in” Proc. of the 8th Intl. Conf. on Gas Hydrates (ICGH8-2014), 28th July–1st Aug. abstract available online at:last accesss https://meetingorganizer.copernicus.org/EGU2018/EGU2018-10236.pdf (last accessed October 27, 2021).
Phrampus, B. J., Harris, R. N., and Tréhu, A. M. (2017). Heat Flow Bounds over the Cascadia Margin Derived from Bottom Simulating Reflectors and Implications for thermal Models of Subduction. Geochem. Geophys. Geosyst. 18, 3309–3326. doi:10.1002/2017GC00707710.1002/2017gc007077
Pohlman, J. W., Bauer, J. E., Waite, W. F., Osburn, C. L., and Chapman, N. R. (2011). Methane Hydrate-Bearing Seeps as a Source of Aged Dissolved Organic Carbon to the Oceans. Nat. Geosci 4, 37–41. doi:10.1038/ngeo1016
Pohlman, J. W., Canuel, E. A., Chapman, N. R., Spence, G. D., Whiticar, M. J., and Coffin, R. B. (2005). The Origin of Thermogenic Gas Hydrates on the Northern Cascadia Margin as Inferred from Isotopic (13C/12C and D/H) and Molecular Composition of Hydrate and Vent Gas. Org. Geochem. 36 (5), 703–716. doi:10.1016/j.orggeochem.2005.01.011
Pohlman, J. W., Kaneko, M., Heuer, V. B., Coffin, R. B., and Whiticar, M. (2009). Methane Sources and Production in the Northern Cascadia Margin Gas Hydrate System. Earth Planet. Sci. Lett. 287 (3-4), 504–512. doi:10.1016/j.epsl.2009.08.037
Pohlman, J. W., Riedel, M., Bauer, J. E., Canuel, E. A., Paull, C. K., Lapham, L., et al. (2013). Anaerobic Methane Oxidation in Low-Organic Content Methane Seep Sediments. Geochimica et Cosmochimica Acta 108, 184–201. doi:10.1016/j.gca.2013.01.022
Qian, J., Wang, X., Collett, T. S., Guo, Y., Kang, D., and Jin, J. (2018). Downhole Log Evidence for the Coexistence of Structure II Gas Hydrate and Free Gas below the Bottom Simulating Reflector in the South China Sea. Mar. Pet. Geology. 98, 662–674. doi:10.1016/j.marpetgeo.2018.09.024
Rehder, G., Brewer, P. W., Peltzer, E. T., and Friederich, G. (2002). Enhanced Lifetime of Methane Bubble Streams within the Deep Ocean. Geophys. Res. Lett. 29, 21–1. doi:10.1029/2001GL013966
Riedel, M., Collet, T., Scherwath, M., Pohlman, J., Hyndman, R. D., and Spence, G. D. (2022). “World Atlas of Submarine Gas Hydrates in Continental Margins,” in World Atlas of Submarine Gas Hydrates in Continental Margins. Editors J. Mienert, and C. Berndt, doi:10.1007/978-3-030-81186-0
Riedel, M., Collett, T. S., and Malone, M. (2010b). “Expedition 311 Synthesis: Scientific Findings,” in The Expedition 311 Scientists, Proc. IODP. Editors M. Riedel, T. S. Collett, and M. J. Malone (Washington, DC: Integrated Ocean Drilling Program Management International, Inc.), 311. doi:10.2204/iodp.proc.311.213.201010.2204/iodp.proc.311.213.2010
Riedel, M., Collett, T. S., and Malone, M. J.the Expedition 311 Scientists (2006a). Proc. IODP, 311. Washington, DC: Integrated Ocean Drilling Program Management International, Inc.. doi:10.2204/iodp.proc.311.2006
Riedel, M., Côté, M. M., Neelands, P. J., Obana, K., Wania, R., Price, A., et al. (2014). Report on Cruise 2010007PGC, C.C.G. Vessel John P. Tully, 30 June - 10 July 2010, SeaJade-I Seafloor Earthquake Array - Japan Canada Cascadia Experiment, Ocean Bottom Seismometer Recovery, Methane Gas-Plume Acoustic Imaging, and CTD-Water Sampling Program. Geol. Surv. Can. Open File 7557, 295545. doi:10.4095/295545
Riedel, M., Novosel, I., Spence, G. D., Hyndman, R. D., Chapman, R. N., Solem, R. C., et al. (2006b). Geophysical and Geochemical Signatures Associated with Gas Hydrate-Related Venting in the Northern Cascadia Margin. Geol. Soc. America Bull. 118 (1), 23–38. doi:10.1130/B25720.1
Riedel, M., Scherwath, M., Römer, M., Veloso, M., Heesemann, M., and Spence, G. D. (2018). Distributed Natural Gas Venting Offshore along the Cascadia Margin. Nat. Commun. 9, 3264. doi:10.1038/s41467-018-05736-x
Riedel, M., Tréhu, A. M., and Spence, G. D. (2010a). Characterizing the thermal Regime of Cold Vents at the Northern Cascadia Margin from Bottom-Simulating Reflector Distributions, Heat-Probe Measurements and Borehole Temperature Data. Mar. Geophys. Res. 31, 1–16. doi:10.1007/s11001-010-9080-2
Römer, M., Riedel, M., Scherwath, M., Heesemann, M., and Spence, G. D. (2016). Tidally Controlled Gas Bubble Emissions: A Comprehensive Study Using Long-Term Monitoring Data from the NEPTUNE Cabled Observatory Offshore Vancouver Island. Geochem. Geophys. Geosyst. 17, 3797–3814. doi:10.1002/2016GC006528
Römer, M., Sahling, H., Pape, T., dos Santos Ferreira, C., Wenzhöfer, F., Boetius, A., et al. (2014). Methane Fluxes and Carbonate Deposits at a Cold Seep Area of the Central Nile Deep Sea Fan, Eastern Mediterranean Sea. Mar. Geology. 347, 27–42. doi:10.1016/j.margeo.2013.10.011
Ruppel, C. D., and Kessler, J. D. (2017). The Interaction of Climate Change and Methane Hydrates. Rev. Geophys. 55 (1), 126–168. doi:10.1002/2016RG000534
Ruppel, C. (2015). Permafrost-associated Gas Hydrate: Is it Really Approximately 1% of the Global System? J. Chem. Eng. Data 60 (2), 429–436. doi:10.1021/je500770m
Ruppel, C. (2007). Tapping Methane Hydrates for Unconventional Natural Gas. Elements 3 (3), 193–199. doi:10.2113/gselements.3.3.193
Sager, W. W., MacDonald, I. R., and Hou, R. (2003). Geophysical Signatures of Mud mounds at Hydrocarbon Seeps on the Louisiana continental Slope, Northern Gulf of Mexico. Mar. Geol. 198, 5. doi:10.1016/S0025-3227(03)00097-5
Sassen, R., Joye, S., Sweet, S. T., DeFreitas, D. A., Milkov, A. V., and MacDonald, I. R. (1999). Thermogenic Gas Hydrates and Hydrocarbon Gases in Complex Chemosynthetic Communities, Gulf of Mexico continental Slope. Org. Geochem. 30, 485–497. doi:10.1016/S0146-6380(99)00050-9
Sassen, R., and MacDonald, I. R. (1994). Evidence of Structure H Hydrate, Gulf of Mexico continental Slope. Org. Geochem. 22 (6), 1029–1032. doi:10.1016/0146-6380(94)90036-1
Sassen, R., Sweet, S. T., Milkov, A. V., DeFreitas, D. A., and Kennicutt, II, M. C. (2001). Thermogenic Vent Gas and Gas Hydrate in the Gulf of Mexico Slope: Is Gas Hydrate Decomposition Significant? Geol, 2, 1072–1110. doi:10.1130/0091-7613(2001)029<0107:TVGAGH>2
Scherwath, M., Thomsen, L., Riedel, M., Römer, M., Chatzievangelou, D., Schwendner, J., et al. (2019). Ocean Observatories as a Tool to advance Gas Hydrate Research. Earth Space Sci. 6, 2644–2652. doi:10.1029/2019EA000762
Schümann, T. K., Whiticar, M. J., and Rohr, K. M. M. (2008). Petroleum Resource Potential of the Tofino Basin. Victoria, BC, Canada: University of Victoria and the Ministry of Energy, Mines and Petroleum Resources MEMPR, 60.
Seeberg-Elverfeldt, J., Schlüter, M., Feseker, T., and Kölling, M. (2005). Rhizon Sampling of Porewaters Near the Sediment-Water Interface of Aquatic Systems. Limnol. Oceanogr. Methods 3 (8), 361–371. doi:10.4319/lom.2005.3.361
Shipley, T. H., Houston, M. H., Buffler, R. T., Shaub, F. J., McMillen, K. J., Ladd, J. W., et al. (1979). Seismic Reflection Evidence for Widespread Occurrence of Possible Gas Hydrate Horizons on continental Slopes and Rises. AAPG Bull. 63, 2204–2213. doi:10.1306/2f91890a-16ce-11d7-8645000102c1865d
Shouldice, D. H. (1971). Geology of the Western Canadian continental Shelf. Bull. Can. Soc. Petrol. Geol. 19, 405
Sloan, E. D., and Koh, C. (2008). Clathrate Hydrates of Natural Gases. 3rd ed.. Boca Raton, Fla, USA: CRC Press.
Solem, R. C., Spence, G. D., Vukajlovich, D., Hyndman, R. D., Riedel, M., Novosel, I., et al. (2002). Methane Advection and Gas Hydrate Formation within an Active Vent Field Offshore Vancouver Island. Fourth Int. Conf. Gas Hydrates.
Soloviev, V. (2002). Global Estimation of Gas Content in Submarine Gas Hydrate Accumulations. Russ. Geol. Geophys. 43, 609
Spence, G. D., Chapman, N. R., Hyndman, R. D., and Cleary, C. (2001a). Fishing Trawler Nets Massive "catch" of Methane Hydrates. Eos Trans. AGU 82 (50), 621. doi:10.1029/01eo00358
Spence, G. D., Coffin, R., and Hoehne, J. (2001b). VENTFLUX 2: Single Channel Seismics, Piston Coring and CTD Casts Associated with Gas Hydrates Offshore Vancouver Island, Report of Cruise PGC01-003 C.C.G. Vessel John P. Tully 23 July – 12 August 2001, available online at: https://apps.dtic.mil/sti/pdfs/ADA411571.pdf (last accessed October 13, 2021).
Spence, G. D., Haacke, R. R., and Hyndman, R. D. (2010). “4. Seismic Indicators of Natural Gas Hydrate and Underlying Free Gas,” in Geophysical Characterization of Gas Hydrates. Editors M. Riedel, E. C. Willoughby, and S. Chopra (Houston, TX, USA: Society of Exploration Geophysicists), 39–71. Chapter 4. doi:10.1190/1.9781560802197.ch4
Spence, G. D., Hyndman, R. D., Chapman, N. R., Riedel, M., Edwards, N., and Yuan, J. (2000). “Cascadia Margin, Northeast Pacific Ocean: Hydrate Distribution from Geophysical Observations,” in Natural Gas Hydrate. Editor M. D. Max (Dordrecht, The Netherlands: Kluwer Academic Publishers), 183–198.
Spence, G. D., Hyndman, R. D., Langton, S., Davis, E. E., and Yorath, C. J. (1991). Analysis and Interpretation of Seismic Data from the Western Canada continental Margin, Part 2: Multichannel Reflection Data across the Vanocuver Island Margin, marine Multichannel Seismic Reflection Survey across the Northern Cascadia Accretionary Prism. Geol. Surv. Can. Open File 2391, 132398. doi:10.4095/132398
Suess, E. (2014). Marine Cold Seeps and Their Manifestations: Geological Control, Biogeochemical Criteria and Environmental Conditions. Int. J. Earth Sci. (Geol Rundsch) 103, 1889–1916. doi:10.1007/s00531-014-1010-0
Thomsen, L., Barnes, C., Best, M., Chapman, R., Pirenne, B., Thomson, R., et al. (2012). Ocean Circulation Promotes Methane Release from Gas Hydrate Outcrops at the NEPTUNE Canada Barkley Canyon Node. Geophys. Res. Lett. 39, a–n. doi:10.1029/2012GL052462
Topham, D. R. (1984). The Formation of Gas Hydrates on Bubbles of Hydrocarbon Gases Rising in Seawater. Chem. Eng. Sci. 39 (5), 821–828. doi:10.1016/0009-2509(84)85051-4
Trofimuk, A., Cherskiy, N., and Tsarev, V. (1973). Accumulations of Natural Gases in Zones of Hydrate Formation in the Hydrosphere. Doklady Akademii Nauk SSSR 212, 931
Villinger, H. W., Tréhu, A. M., and Grevemeyer, I. (2010). “18. Seafloor Marine Heat Flux Measurements and Estimation of Heat Flux from Seismic Observations of Bottom Simulating Reflectors,” in Geophysical Characterization of Gas Hydrates, Society of Exploration Geophysicists. Editors M. Riedel, C. E. Willoughby, and S. Chopra (Houston, TX, USA: Society of Exploration Geophysicists), 279–300. doi:10.1190/1.9781560802197.ch18
Westbrook, G. K., Carson, B., and Musgrave, R. J. (1994). Proceedings of the Ocean Drilling Program, 146 Part 1 Initial Reports, 146. College Station, TX: Ocean Drilling Program. doi:10.2973/odp.proc.ir.146-1.1994Pt. 1
Whiticar, M. J. (1999). Carbon and Hydrogen Isotope Systematics of Bacterial Formation and Oxidation of Methane. Chem. Geology. 161, 291–314. doi:10.1016/S0009-2541(99)00092-3
Whiticar, M. J. (2021). “Carbon Isotopes in Petroleum Science,” in Encyclopedia of Petroleum Geoscience. Encyclopedia of Earth Sciences Series. Editor R. Sorkhabi (Springer), 1–19. Cham. doi:10.1007/978-3-319-02330-4_310-1
Whiticar, M. J., Faber, E., and Schoell, M. (1986). Biogenic Methane Formation in marine and Freshwater Environments: CO2 Reduction vs. Acetate Fermentation-Isotope Evidence. Geochimica et Cosmochimica Acta 50, 693–709. doi:10.1016/0016-7037(86)90346-7
Whiticar, M. J., and Hovland, M. (1995). “Data Report: Molecular and Stable Isotope Analyses of Sorbed and Free Hydrocarbon Gases of Leg 146, Cascadia and Oregon Margins,” in Proceedings-Ocean Drilling Program Scientific Results. Editors B. Carson, G. K. Westbrook, R. J. Musgrave, and E. Suess (College Station, TX: National Science Foundation), 439–450. doi:10.2973/odp.proc.sr.146-1.212.1995
Whiticar, M. J. (2020). “The Biogeochemical Methane Cycle,” in Hydrocarbons, Oils and Lipids: Diversity, Origin, Chemistry and Fate. Handbook of Hydrocarbon and Lipid Microbiology. Editor H. Wilkes (Cham: Springer), 669–746. doi:10.1007/978-3-319-90569-3_5
Willoughby, E., and Fyke, J. (2003). BofFiNS 2003: Gas Hydrate Investigation at Bullseye and Fish-Boat and Survey of the Intersection of the Nootka Fault with the continental Margin Using Single-Channel Seismic Streamer Cruise PGC03-004: 3 August- 29 August, 2003 C.C.G.S. John P. Tully, CEOR. Victoria, BC, Canada: School of Earth and Ocean Sciences, University of Victoria, 57
Wilson, R. M., Lapham, L. L., Riedel, M., Holmes, M. E., and Chanton, J. P. (2015). Observing Methane Hydrate Dissolution Rates under Sediment Cover. Mar. Chem. 172, 12–22. doi:10.1016/j.marchem.2015.03.004
Yamano, M., Uyeda, S., Aoki, Y., and Shipley, T. H. (1982). Estimates of Heat Flow Derived from Gas Hydrates. Geol 10, 339–343. doi:10.1130/0091-7613(1982)10<339:eohfdf>2.0.co;2
Yelisetti, S., and Spence, G. D. (2021). Seismic Velocity Structure beneath the Tofino Forearc Basin Using Full Waveform Inversion. Energies 14 (11), 3099–3124. doi:10.3390/en14113099
Zander, T., Haeckel, M., Berndt, C., Chi, W.-C., Klaucke, I., Bialas, J., et al. (2017). On the Origin of Multiple BSRs in the Danube Deep-Sea Fan, Black Sea. Earth Planet. Sci. Lett. 462, 15–25. doi:10.1016/j.epsl.2017.01.006
Keywords: gas hydrate, fluid seepage, Barkley Canyon hydrates, AUV (autonomous underwater vehicle), ROV (remote operated vehicle)
Citation: Riedel M, Scherwath M, Römer M, Paull CK, Lundsten EM, Caress D, Brewer PG, Pohlman JW, Lapham LL, Chapman NR, Whiticar MJ, Spence GD, Enkin RJ and Douglas K (2022) Barkley Canyon Gas Hydrates: A Synthesis Based on Two Decades of Seafloor Observation and Remote Sensing. Front. Earth Sci. 10:852853. doi: 10.3389/feart.2022.852853
Received: 11 January 2022; Accepted: 24 February 2022;
Published: 27 April 2022.
Edited by:
Davide Oppo, University of Louisiana at Lafayette, United StatesReviewed by:
Dong Feng, Shanghai Ocean University, ChinaPeter Feldens, Leibniz Institute for Baltic Sea Research (LG), Germany
Copyright © 2022 Riedel, Scherwath, Römer, Paull, Lundsten, Caress, Brewer, Pohlman, Lapham, Chapman, Whiticar, Spence, Enkin and Douglas. This is an open-access article distributed under the terms of the Creative Commons Attribution License (CC BY). The use, distribution or reproduction in other forums is permitted, provided the original author(s) and the copyright owner(s) are credited and that the original publication in this journal is cited, in accordance with accepted academic practice. No use, distribution or reproduction is permitted which does not comply with these terms.
*Correspondence: M. Riedel, mriedel@geomar.de