Iron Redistribution Upon Thermokarst Processes in the Yedoma Domain
 Arthur Monhonval1*
  Jens Strauss2
  Elisabeth Mauclet1
  Catherine Hirst1
  Nathan Bemelmans1
  Guido Grosse2,3
  Lutz Schirrmeister2
  Matthias Fuchs2
  Sophie Opfergelt1
- 1Earth and Life Institute, Université Catholique de Louvain, Louvain-la-Neuve, Belgium
- 2Permafrost Research Section, Alfred Wegener Institute Helmholtz Centre for Polar and Marine Research, Potsdam, Germany
- 3Institute of Geosciences, University of Potsdam, Potsdam, Germany
Ice-rich permafrost has been subject to abrupt thaw and thermokarst formation in the past and is vulnerable to current global warming. The ice-rich permafrost domain includes Yedoma sediments that have never thawed since deposition during the late Pleistocene and Alas sediments that were formed by previous thermokarst processes during the Lateglacial and Holocene warming. Permafrost thaw unlocks organic carbon (OC) and minerals from these deposits and exposes OC to mineralization. A portion of the OC can be associated with iron (Fe), a redox-sensitive element acting as a trap for OC. Post-depositional thaw processes may have induced changes in redox conditions in these deposits and thereby affected Fe distribution and interactions between OC and Fe, with knock-on effects on the role that Fe plays in mediating present day OC mineralization. To test this hypothesis, we measured Fe concentrations and proportion of Fe oxides and Fe complexed with OC in unthawed Yedoma and previously thawed Alas deposits. Total Fe concentrations were determined on 1,292 sediment samples from the Yedoma domain using portable X-ray fluorescence; these concentrations were corrected for trueness using a calibration based on a subset of 144 samples measured by inductively coupled plasma optical emission spectrometry after alkaline fusion (R2 = 0.95). The total Fe concentration is stable with depth in Yedoma deposits, but we observe a depletion or accumulation of total Fe in Alas deposits, which experienced previous thaw and/or flooding events. Selective Fe extractions targeting reactive forms of Fe on unthawed and previously thawed deposits highlight that about 25% of the total Fe is present as reactive species, either as crystalline or amorphous oxides, or complexed with OC, with no significant difference in proportions of reactive Fe between Yedoma and Alas deposits. These results suggest that redox driven processes during past thermokarst formation impact the present-day distribution of total Fe, and thereby the total amount of reactive Fe in Alas versus Yedoma deposits. This study highlights that ongoing thermokarst lake formation and drainage dynamics in the Arctic influences reactive Fe distribution and thereby interactions between Fe and OC, OC mineralization rates, and greenhouse gas emissions.
Introduction
Upon ice-rich permafrost thaw, substantial amounts of organic carbon (OC) stored in frozen deposits become potentially available for microbial mineralization (Strauss et al., 2017; Nitzbon et al., 2020; Turetsky et al., 2020). The Yedoma domain includes Yedoma Ice Complex deposits (50–90% volume percent ice, in the following referred as Yedoma deposits) that have never thawed since late Pleistocene deposition and Alas deposits that formed upon thermokarst processes during the Lateglacial and Holocene warmer and wetter periods (Schirrmeister et al., 2013; Strauss et al., 2013). The latest estimates show that the Yedoma domain stores around 327—466 Gt of OC despite covering only 8% of the circumarctic permafrost region (Hugelius et al., 2014; Strauss et al., 2017). Ongoing global warming in high northern latitudes will unlock OC frozen in ice-rich Yedoma deposits (with potential lake formation and drainage) and refrozen Alas deposits, exposing more OC to decomposition (Schneider von Deimling et al., 2015; Olefeldt et al., 2016). Thawing of present day Yedoma and Alas deposits triggers a cascade of processes, including the mineralization of previously locked carbon by microorganisms generating additional greenhouse gas emissions (Schuur et al., 2008).
For millennial-scale OC preservation, the interactions between OC and mineral surfaces, especially with iron (Fe) oxides surfaces, are of great importance in soils (Kaiser and Guggenberger, 2007; Kögel-Knabner et al., 2008; Kögel-Knabner et al., 2010; Adhikari and Yang, 2015) and sediments (Eglinton, 2012; Lalonde et al., 2012). In the Qinghai-Tibetan Plateau permafrost region, approximately 20% of the soil OC is stabilized by Fe (Mu et al., 2016) illustrating the important relationship between Fe and OC in permafrost terrain. Mineral-OC interactions contribute to stabilize OC through complexation, co-precipitation or aggregation processes and thus hinder microbial degradation of OC (Lutzow et al., 2006). The OC can be 1) physically protected within soil aggregates (involving Fe-Al oxy-(hydr)oxides, clay minerals, or carbonates), which means that OC is spatially inaccessible for microorganisms; or 2) physico-chemically protected in organo-mineral associations and/or as organo-metallic complexes. These organo-mineral associations result from the interaction of OC with mineral surfaces such as OC adsorbed onto Fe-oxides or clay minerals, using cation bridges such as Ca2+ or Mg2+. Organo-metallic complexes result from the complexation of OC with metal ions (i.e., OC complexed with e.g., Fe3+, Al3+). Overall, several stabilizing mechanisms exist between reactive Fe (Fe-oxides or complexed Fe) and OC.
These mineral-protected pools of OC are of major concern to better understand OC mineralization rates in permafrost soils upon thawing (Opfergelt, 2020). The soil OC that interacts with reactive minerals (via aggregation, sorption, complexation, and/or co-precipitation) is less available for microbial decomposition, thus contributing to the “protected” or “stabilized” organic matter pool (Schmidt et al., 2011; Lalonde et al., 2012; Kleber et al., 2015, 2021; Salvadó et al., 2015). Yet, the “protected” OC pools are not permanent and may lose their mineral-protected status in redox changing environments (Kögel-Knabner et al., 2010; Colombo et al., 2014; Herndon et al., 2017; Huang and Hall, 2017; Opfergelt, 2020; Patzner et al., 2020). Iron-mediated OC decomposition in anoxic condition can counteract protection mechanisms of OC (Chen et al., 2020; Kappler et al., 2021). Thermokarst processes trigger redox changes in the environment (Kokelj and Jorgenson, 2013; Abbott and Jones, 2015), and Fe is a redox-sensitive element, consequently thawing of ice-rich permafrost deposits may redistribute and modify total Fe distribution, and the proportion of Fe distributed between Fe oxides and OC complexes. Overall, we expect biogeochemical Fe transformations to occur upon redox fluctuations in thermokarst-affected ice-rich permafrost soils, with potential direct implications for OC stabilization in Yedoma domain deposits (Figure 1), mirroring the impact of redox processes on Fe redistribution described for gradual thaw (i.e., gradual deepening of the active layer; Lipson et al., 2012; Herndon et al., 2020b; Patzner et al., 2020).
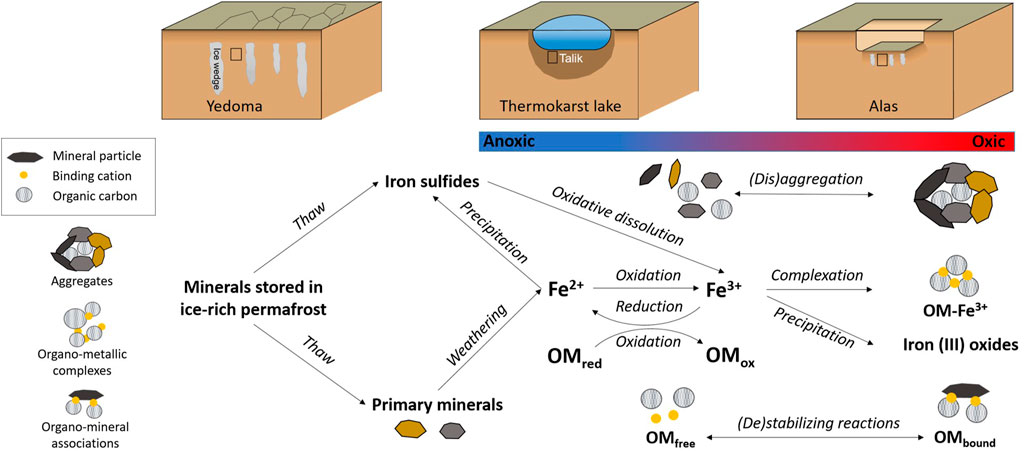
FIGURE 1. Conceptual scheme of the biogeochemical iron (Fe) transformations expected upon thermokarst lake formation and drainage in ice-rich-permafrost (Yedoma) sediments and implications for organic matter (OM) stabilization. Black rectangles in the upper schematic representation of Yedoma, thermokarst lake and Alas profile indicate the sample location. Geochemical reactions shown are both abiotic and microbially mediated. OMred represents reduced organic species, which can include CH4, and OMox represents oxidized organic species, which can include CO2.
The dependence of Fe-bearing mineral solubilization, Fe translocation and Fe precipitation on redox conditions has been studied in polygonal permafrost soil of the Lena Delta (Fiedler et al., 2004), the Alaska North Slope (Lipson et al., 2012; Herndon et al., 2020b) and also in a thaw gradient site (i.e., palsa, bog, and fen) close to Abisko in northern Sweden (Patzner et al., 2020). These studies found that redox processes drive Fe solubilization under fluctuating water-table height. Similarly, the mobilization of Fe upon thermokarst lake formation and subsequent transport in the hydrological network has been observed in several studies (e.g., Audry et al., 2011; Pokrovsky et al., 2014; Manasypov et al., 2015). However, the influence of redox fluctuations on Fe distribution in deeper deposits from ice-rich permafrost regions during the late Pleistocene and Holocene periods remains unknown. Using modern day studies of Fe dynamics in permafrost as an analogue, we hypothesize that upon thermokarst processes, the fluctuating redox conditions due to subsidence, lake formation, drainage, subaerial exposure and/or deposition, and refreezing, will drive Fe solubilization, translocation and precipitation within former Yedoma deposits, potentially affecting Fe-OC interactions in the resulting Alas deposits. To test this hypothesis, a screening of total Fe concentrations in ice-rich permafrost landscape is needed to better evaluate the potential for Fe redistribution upon thaw. Being able to identify that thaw processes have occurred in the past with potential influence on Fe-OC interactions is valuable information in the context of a warming Arctic. Indeed, identifying potential redistribution of Fe-oxides and complexed Fe that took place in thawed, newly formed and subsequently refrozen deposits during the Lateglacial and Holocene warming periods may help to predict the fate of Fe-OC interactions upon current global warming and to better assess implications for OC stabilization. This information is relevant given that a large portion of the Arctic permafrost region is threatened by abrupt thaw and thermokarst processes (Olefeldt et al., 2016; Turetsky et al., 2020). Turetsky et al. (2020) emphasize that despite the fact that abrupt thaw will probably occur in <20% of the permafrost zone, this thaw could affect half of the permafrost OC through collapsing ground, lake formation, rapid erosion, and thaw slumping.
The aim of this study is to investigate the Fe redistribution upon thermokarst processes during the Lateglacial and Holocene and to highlight potential implications for interactions between Fe and OC in present day ice-rich permafrost sediments. To this goal, 1) we measured the total Fe concentration on 1,292 deposits samples across the ice-rich permafrost region, including Yedoma (never thawed) and Alas (previously thawed) deposits, and 2) we assessed the proportion of reactive Fe and the distribution between Fe oxides and Fe complexed with OC based on selective Fe extractions on a subset of Yedoma and Alas samples.
Environmental Settings
The Yedoma domain is 1.4 million km2 in extent and its Yedoma and thermokarst deposits contain between 327–466 Gt OC (Strauss et al., 2017). This region mainly includes areas of Alaska and Northeast Siberia which were not covered by ice sheets during the last glacial period (110–10 ka BP). For tens of millennia during the late Pleistocene, continuous periglacial weathering, transport, and sedimentation lead to the accumulation of several decameters thick permafrost deposits and syngenetic ice-wedge formation. The large syngenetic ice-wedges, often exceeding 50% of the soil volume, are a consequence of the late Pleistocene dry and cold climate which triggered regular frost cracking within the deposits. Subsequent filling of cracks with liquid water from rain or snowmelt resulted in the formation of vertical ice veins that over multiple millennia grew into up to 40°m deep and several meters wide ice-wedges (Schirrmeister et al., 2013). The deposits also consist of ice-bearing sediments, which increase the total ice volume within Yedoma deposits (Strauss et al., 2017). These ice-rich deposits were then particularly sensitive to the rise in air temperature during the Pleistocene/Holocene transition period (starting around 14 ka BP; Walter et al., 2007). Ice-wedge degradation led to widespread thermokarst lake formation and subsequent lake drainage. Reworked sediments from former Yedoma deposits and newly formed peat deposits accumulated in thermokarst basins and refroze to form Alas deposits (Grosse et al., 2013). These Alas deposits are depleted in ice, compared to the original Yedoma ice-rich deposits, but still contain an important stock of OC (130–213 Gt C; Strauss et al., 2017). To perform this large-scale assessment of total Fe concentrations in Yedoma domain deposits, our set of samples (n = 1,292) covers many regions of the Yedoma domain (North, West, and Interior Alaska, the Kolyma region, the Indigirka region, the New Siberian Archipelago, the Laptev Sea coastal region, and Central Yakutia–Figure 2).
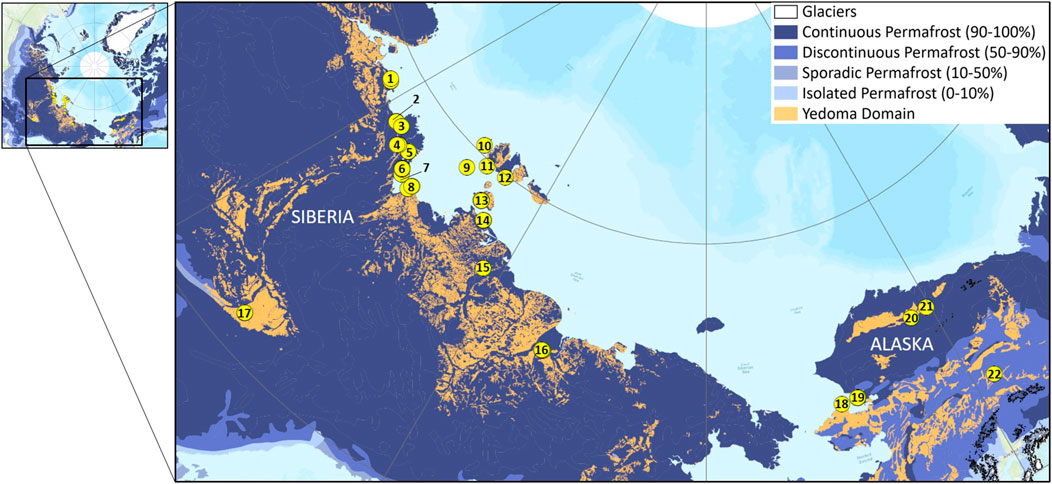
FIGURE 2. Location of the studied permafrost sites from the Yedoma Domain. 1. Cape Mamontov Klyk; 2. Nagym (Ebe Sise Island); 3. Khardang Island; 4. Kurungnakh Island; 5. Sobo Sise Island; 6. Bykovsky Peninsula; 7. Muostakh Island; 8. Buor Khaya Peninsula; 9. Stolbovoy Island; 10. Belkovsky Island; 11. Kotel’ny Island; 12. Bunge Land; 13. Bol’shoy Lyakhovsky Island; 14. Oyogos Yar coast; 15. Kytalyk; 16. Duvanny Yar; 17. Yukechi; 18. Kitluk; 19. Baldwin Peninsula; 20. Colville; 21. Itkillik; 22. Vault Creek tunnel. Yedoma domain coverage from Strauss et al. (2016, 2017).
Methods
Sampling
Depending on the sites, individual or multiple Yedoma/Alas deposit profiles were sampled (Table 1). Samples were obtained either from cores or from natural exposures. Coring was conducted with various types of drilling rigs, from the surface during the winter season, and below the active layer during the summer season. Cliffs exposing deep permafrost deposits at coasts and river shores or headwall exposures in thaw slumps were sampled frozen with hammer and axes. Sub-profiles were sometimes needed to reconstruct a complete composite profile because of vertical discontinuities (i.e., ice wedges presence) or sections covered by thawed mud overburden. For any additional information related to sampling techniques of a specific site, please refer to the respective reference papers for each field site (Table 1). Recovered samples remained frozen or were air-dried in the field before transport to the lab. The particle size distribution of these Yedoma domain deposits (described in reference papers from Table 1) is below 2 mm; therefore no sieving was necessary.
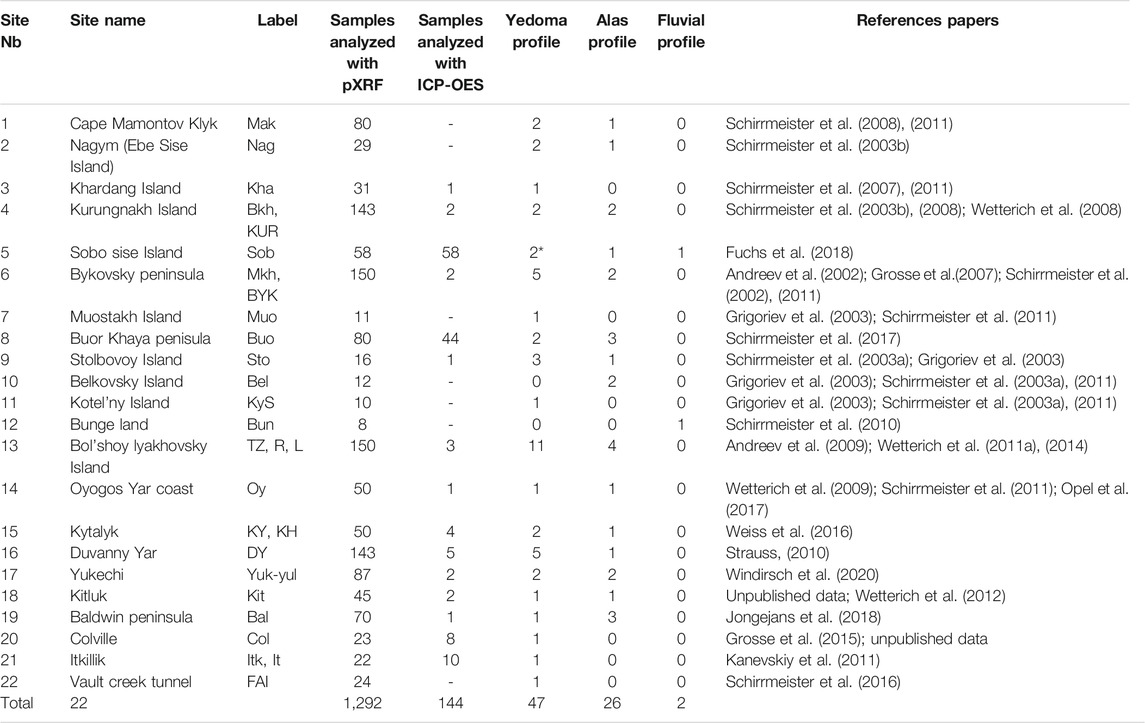
TABLE 1. List of the studied sites from the Yedoma domain, associated label, number of samples analyzed with portable X-ray fluorescence and inductively coupled plasma optical emission spectrometry method, number of profiles sampled for each type of deposits and associated reference papers. Sites are located in Siberia (1–17) and Alaska (18–22). The site numbers 1 to 22 are located on the map in Figure 2. * Sobo Sise profiles are of Holocene age on top of Yedoma Ice Complex deposits. Labels identification for each profile are detailed in Supplementary Table S1.
Assessment of Bulk Iron Concentrations
We assessed the total Fe concentration on 1,292 samples from Yedoma domain deposits using a portable X-ray fluorescence (XRF) device (Niton xl3t Goldd + pXRF; ThermoFisher Scientific, Waltham, United States). The measurements were performed in laboratory (ex situ) conditions on air- or freeze-dried samples to avoid the introduction of additional variability (e.g., water content, sample heterogeneity). Briefly, samples are placed on a circular plastic cap (2.5 cm diameter) provided at its base with a thin transparent film (prolene 4 µm). Minimum sample thickness in the cap is set to 2 cm to prevent underestimation of the detected intensities (Ravansari et al., 2020) and total time of analysis is set to 90 s to standardize each measurement. The analysis is performed using a lead stand to protect operators from X-rays. To assess the precision of the pXRF method, we conducted three to five repetitions on twenty individual samples from different locations from Yedoma and Alas deposits (x-axis error bar from Figure 3).
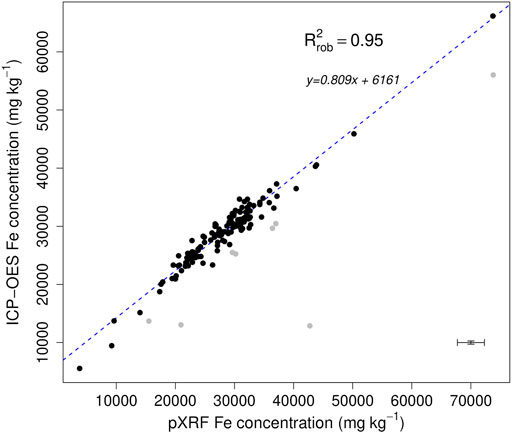
FIGURE 3. Total Fe concentrations (mg kg−1) measured by the inductively coupled plasma optical-emission spectrometry (ICP-OES) method as a function of those measured by the portable X-ray fluorescence (pXRF) method on the Yedoma domain deposits. Errors bars (±2σ) are based on three repetitions of three samples for the ICP-OES method and five or three repetitions of twenty samples for the pXRF method. The robust linear regression is presented (blue line; alpha = 0.95; n = 144), excluding the grey points, and the equation is provided.
To ensure trueness, the pXRF-measured concentrations were calibrated with another method. For a subset of 144 samples, we compared the total Fe concentrations measured by pXRF with Fe concentrations obtained using a method measuring Fe concentration in solution by inductively coupled plasma optical-emission spectrometry ICP-OES (iCAP 6500 ThermoFisher Scientific) after sample dissolution by alkaline fusion. Briefly, air- or freeze-dried sediment samples are carefully milled for homogenization. A portion of the milled sample (80 mg) is mixed with lithium metaborate and lithium tetraborate and heated up to 1,000°C for 10 min. The fusion bead is dissolved in HNO3 2.2 N at 80°C and stirred until complete dissolution (Chao and Sanzolone, 1992). The loss on ignition is assessed at 1,000°C and total element content is expressed in reference to the sediment dry weight at 105°C. Trueness of the analytical measurement by ICP-OES is validated by repeated measurements on the USGS basalt reference material BHVO-2 (Wilson, 1997) as well as on certified soils GSS-1 and GSS-4 (National Research Centre for CRM, 1986). The offset, defined as the difference between certified and ICP-OES value over the certified value, is −0.8, −4.2, and −6.1% for the three certified materials, respectively. To assess the precision of the ICP-OES method, we conducted three repetitions on three individual samples from different locations from Yedoma and Alas deposits (y-axis error bar from Figure 3). The linear regression obtained based on Fe concentrations measured by pXRF and ICP-OES after alkaline fusion on this subset of 144 samples (robust R2 = 0.95; Figure 3) was used to correct pXRF concentrations for trueness on the total set of samples (n = 1,292). This linear regression is dependent on the internal geometry of the pXRF device used and should not be used for other pXRF-measured data without a calibration check. All concentrations data can be found in the Yedoma domain Mineral Concentration Assessment (YMCA) dataset (Monhonval et al., 2020). Here, only pXRF concentration values corrected using the well-defined regression are used.
Selective Iron Extractions
To test the influence of permafrost thaw on the distribution of Fe-oxides and on Fe involved in complexes, we performed selective Fe extractions on a subset of samples from Yedoma and Alas deposits (n = 21) from three locations in Siberia: Sobo Sise Island, Buor Khaya Peninsula and Kytalyk (site number 5, 8, and 15 in Figure 2, respectively). Total Fe concentrations from Yedoma and Alas deposits in the subset are within similar range. Three standard procedures of selective Fe extraction from soil were used: dithionite-citrate-bicarbonate extraction (DCB), dark ammonium oxalate extraction (referred here as oxalate extraction), and sodium pyrophosphate extraction (referred here as pyrophosphate extraction). These extractions (DCB, oxalate, and pyrophosphate) are not fully quantitative (Rennert, 2019) but can be used as indicators of the Fe-oxides phases or complexed Fe within a particular soil or sediment. More specifically, 1) DCB extractions provide an estimate of the content of free Fe oxides in soils, i.e., poorly crystalline and crystalline Fe-oxides, and should not include structural Fe from clay minerals (Mehra and Jackson, 2013; McKeague and Day, 1966); 2) oxalate extractions target poorly crystalline Fe oxides (Blakemore et al., 1981), i.e., amorphous Fe oxides species and organo-metallic complexes; 3) pyrophosphate extractions are used as an indicator of Fe-organic complexes (Bascomb, 1968; Parfitt and Childs, 1988). A contribution of Fe oxide nanoparticulates in addition to the Fe involved in organic complexes cannot be excluded (Jeanroy and Guillet, 1981), even if limited by the centrifugation and the filtration of the extract.
Practically, Fe concentration was measured in solution by ICP-OES after the following extraction procedures: 1) for a DCB extraction, 0.75 g of milled sediment was mixed with 30 ml of citrate solution (sodium citrate Na3C6H5O7 2H2O) 0.3 M buffered by sodium bicarbonate NaHCO3. The sample tube was placed in a hot bath (85°C) and three successive additions of 0.75 g of sodium dithionite (Na2S2O4) were used to reduce crystallized and amorphous Fe oxides. The tube was centrifuged and the solution was filtered (Whatman 41 filter, 20 µm retention size). The residue was rinsed three times with 20 ml of NaCl 1 M and centrifuged. The rinsing solutions were filtered and pooled with the first solution to obtain a final solution; 2) for an oxalate extraction, 0.4 g of milled sediment was mixed with 40 ml of oxalate extractant (ammonium oxalate (NH4)2C2O4 H2O and oxalic acid H2C2O4 2H2O). The tube was agitated for 4 h in the dark, given that this reagent is UV-sensitive. The tube was centrifuged and the solution was filtered (Whatman 41 filter); 3) for a pyrophosphate extraction, 0.4 g of milled sediment was mixed with 40 ml of pyrophosphate solution (tetrasodium pyrophosphate decahydrate Na4P2O7 10H2O 0.1 M). The tube was agitated for 16 h. Sodium sulfate (1.4 g) was added and the solution was centrifuged (30 min at 4,000 rpm) and filtered (Whatman 41 filter). To assess the precision of selective Fe extractions (i.e., DCB, oxalate and pyrophosphate), three repetitions of three different samples were performed. Samples were selected from Yedoma and Alas deposits from the Yukechi site (with similar matrix, not presented here). The mean and associated coefficient of variation (i.e., the ratio between standard deviation and the mean) were calculated for each sample and are summarized in Supplementary Table S2.
In the following, the Fe extracted using DCB, oxalate or pyrophosphate extraction methods will be referred to as Fed, Feo and Fep, respectively, whereas total Fe measured by XRF and corrected for trueness (Assessment of Bulk Iron Concentrations) will be referred to as Fet. The Feo/Fed ratio will be used to reflect the relative proportion of amorphous (short-range ordered) Fe oxyhydroxides and complexed Fe within the global pool of Fe oxides. The Fed/Fet ratio will be used for the proportion of free Fe oxides and complexed Fe relative to the total Fe, the Feo/Fet ratio indicates the proportion of amorphous Fe oxides and complexed Fe relative to the global Fe pool, and Fep/Fet ratio the proportion of Fe present in organo-metallic complexes relative to the global Fe pool.
Selective Carbon Extractions
The carbon selectively extracted by oxalate and pyrophosphate has been evaluated on the same solutions used for selective Fe extractions (Selective Iron Extractions). More specifically: 1) in the solution from the oxalate extraction, we evaluate the proportion of organic acids by measuring the absorbance at 430 nm on a Genesys 10 S VIS spectrophotometer, with the oxalate extractant solution as a blank. The optical density of the oxalate extract (ODOE) is mainly influenced by the extracted fulvic acids thereby indicating the concentration in organic acids present in solution (Daly, 1982); 2) in the solution from the pyrophosphate extraction, we measure the concentration of dissolved OC released after dispersion by pyrophosphate (referred as Cp) using a Shimadzu total organic carbon (TOC) analyzer (measuring non purgeable OC). This indicates the amounts of C participating in organo-metallic complexes in soils. To assess the precision of selective C extractions (i.e., ODOE and Cp), three repetitions of three different samples were performed. Samples were selected from Yedoma and Alas deposits from the Yukechi site. The mean and associated coefficient of variation (i.e., the ratio between the standard deviation and the mean) were calculated for each sample and are shown in Supplementary Table S3.
Statistical Analysis
We performed computations for statistical analysis using R software version R.3.5.1 (R Core Team, 2018). Robust linear regression (R2rob) presented in this study are implemented with an alpha of 0.95. In the following, the non-parametric statistical Wilcoxon test (median) is used in preference to the student test (mean) to statistically compare two distributions when data distribution do not follow the normality hypothesis (Shapiro-Wilk normality test p-value <0.05). Median and median absolute deviation (MAD) will be used to compare concentrations of Yedoma and Alas datasets. Mean and standard deviation (σ) will be used to compare concentrations among different sites.
Results
Global Distribution of Iron Concentrations in Yedoma and Alas Deposits
The median total Fe concentration (±MAD, i.e., median absolute deviation) in never thawed Yedoma deposits (31.9 ± 3.0 g kg−1; n = 814) and previously thawed, refrozen or newly formed Alas deposits (31.2 ± 8.2 g kg−1; n = 470) shows no significant differences (p-value = 0.64, Wilcoxon test). However, the dispersion (i.e., MAD) of total Fe concentrations is more than two times larger for Alas deposits compared to Yedoma deposits (Figure 4). This implies that Alas deposits have higher probability to display either lower or higher total Fe concentrations at a certain depth, relative to Yedoma deposits. Along with this, Figure 5 displays profile selections (i.e., based on Yedoma deposit profiles excluding active layer) of individual Yedoma, Alas or deltaic/fluvial deposits profiles and confirm the homogenous total Fe concentrations in Yedoma deposits and heterogeneous total Fe concentrations in Alas deposits as mentioned above. Figure 5 highlights some additional observations. First, profiles with sediments of deltaic/fluvial origins display significantly lower total Fe concentrations compared to Yedoma or Alas deposits (p-value < 0.005, Wilcoxon test). Deltaic deposits (Bun) and fluvial deposits (Sob14 T2-6) have a median total Fe concentration equal to 12.3 ± 0.8 g kg−1 and 21.7 ± 6.8 g kg−1, significantly lower to the median values mentioned above for Yedoma and Alas deposits. Second, Yedoma deposits from Siberia (e.g., labeled Mak, Muo, DY, TZ, L, and Oy) show similar total Fe concentrations throughout the whole Siberia region, even for sites located thousands of km apart from each other. This is illustrated by equivalent mean total Fe concentrations (±2σ, i.e., two standard deviations) along the Yedoma deposit profiles from Cape Mamontov Klyk (Mak-12–19) 31.9 ± 1.3 g kg−1, to Oyogos Yar coast (Oy-07-08) 32.6 ± 3.0 g kg−1, Duvanny Yar (DY-05) 33.5 ± 2.8 g kg−1, Sobo Sise Island (Sob14-T2-3) 31.6 ± 2.0 g kg−1, Muostakh Island (Muo) 31.7 ± 3.7 g kg−1, and even to the New Siberian Archipelago: Bol’shoy Lyakhovsky Island (L7-18) 32.7 ± 3.4 g kg−1 or Stolbovoy Island (Sto) 27.2 ± 1.2 g kg−1. Note that the distance between profiles from Cape Mamontov Klyk (Mak-12–19) to Duvanny Yar (DY-05) is more than 1,500 km (see Figure 2). Lastly, Figure 5 highlights that Yedoma deposit profiles from Alaska (i.e., labeled Itk, Col, Bal2 and Kit) display homogeneous total Fe concentrations along each profile (similarly to Yedoma deposits from Siberia) but with different mean total Fe concentrations between them. The Itkillik Yedoma exposure displays a mean of 24.6 ± 1.7 g kg−1 Fe, Colville Yedoma profile of 30.5 ± 1.9 g kg−1, Baldwin Peninsula Yedoma deposits of 43.2 ± 7.4 g kg−1 Fe (the Fe concentration becomes 42.1 ± 3 g kg−1 Fe when excluding the three samples at the bottom of the profile considered as a separate unit), and 41.1 ± 4.7 g kg−1 Fe from a Yedoma exposure at the Kitluk River on the northern Seward Peninsula.
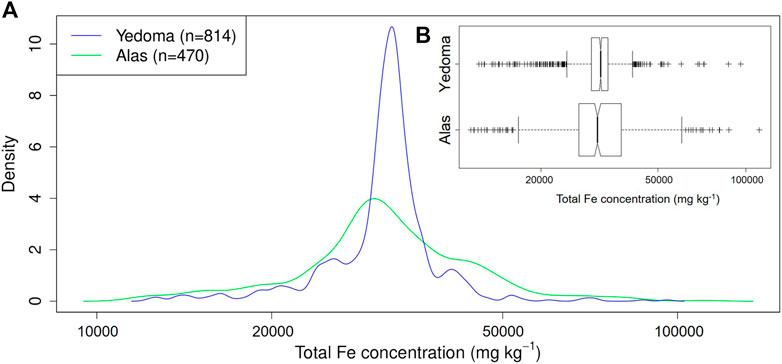
FIGURE 4. (A) Density plot and (B) fligner test (boxplot) of the total iron (Fe) concentration within Yedoma (n = 814; blue line) and Alas (n = 470; green line) deposits.
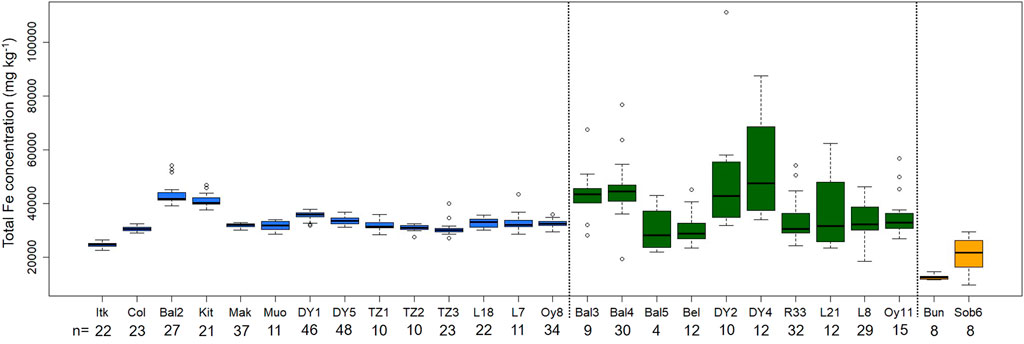
FIGURE 5. Boxplot of the Fe concentration within selected profiles from different types of deposit: Yedoma Ice Complex (blue), Alas (green), and deltaic/fluvial deposits (orange). Yedoma Ice Complex deposit profiles were selected based on the absence of active layer deposits or fluvial deposits along the profile. Alas profiles located near Yedoma profiles selected (when possible) are shown. The number of samples for each boxplot is given below labels of the x-axis. The sample labels refer to Table 1.
Variability of Iron Concentrations With Depth in Yedoma and Alas Deposits
The full dataset of total Fe concentration from Yedoma domain deposits is provided in the PANGAEA data repository (https://doi.pangaea.de/10.1594/PANGAEA.922724). Here, the depth-variations of total Fe concentrations in Yedoma domain deposits are investigated in detail and linked to the specific history of the deposits from deposition during late Pleistocene to post-depositional processes during Lateglacial and Holocene warmer periods. In each location, where both Yedoma and Alas deposits were available, the vertical total Fe concentration is compared between the Yedoma profile and the Alas profile (Supplementary Presentation S1). We present each profile with a simplified stratigraphic column, which highlights the successive layers along the sampled profile (i.e., Yedoma deposits, thermokarst deposits, fluvial deposits, active layer, or peat layer). The complexity in individual profiles arises from the multiple origins of Yedoma deposition during the late Pleistocene, as well as thermokarst, soil development, cryoturbation, peat formation, or flooding processes (as indicated by fluvial sandy layers) that affected the depositional and soil environment.
Ice-rich Yedoma deposits had homogeneous Fe concentrations throughout the whole deposit thickness, whereas Alas deposits were characterized by variable Fe concentrations with depth (Supplementary Presentation S1). This reflects the higher dispersion of Fe concentrations in Alas deposits compared to Yedoma deposits (Figure 4; Global Distribution of Iron Concentrations in Yedoma and Alas Deposits). For example, both Duvanny Yar Yedoma deposit profiles (DY-01 and DY-05) showed constant Fe concentrations despite their large thicknesses and despite the fact that they are located 2 km away from each other. DY-01 had a mean of 35.5 ± 2.77 g kg−1 Fe (±2σ) for a total thickness of about 20 m and DY-05 of 33.5 ± 2.79 g kg−1 Fe for an equivalent thickness. Conversely, DY-04 Alas profile displayed a mean of 53.3 ± 37.6 g kg−1 (±2σ) for a deposit thickness of 3.5 m which points at the heterogeneity of the material inherent to Alas thawing history (Supplementary Presentation S1). Deposits with fluvial origins (i.e., characterized as sandy layers) showed depleted total Fe concentrations, as highlighted in Supplementary Presentation S1). Conversely, in sediments containing peat layers, total Fe concentrations either: 1) increased in active layer deposits or even in peat layers from underlying permafrost; 2) decreased, usually in the top horizons of the profile; or 3) remained with similar Fe concentration as deposits located above or below in the profile (Supplementary Presentation S1). The data further indicate a positive correlation between total Fe concentrations and TOC content (wt%; Supplementary Figure S1). An exception to this trend is observed for organic-rich samples (i.e., TOC >30 wt%) in the top surface layer (within the first centimeters) of the profile that show a depletion of total Fe concentrations.
Distribution of Selectively Extracted Iron and Carbon in Yedoma and Alas Deposits
The Fe concentrations in selective extractions by DCB, oxalate and pyrophosphate within a subset of selected Yedoma and Alas deposits are presented in Table 2. Robust and Pearson correlation matrix for all studied parameters (Fet, Fed, Feo, Fep) is presented in Supplementary Figure S2. Based on this subset of 21 samples from the Yedoma domain, the Fed/Fet ratios in Yedoma (n = 12) and Alas (n = 9) deposits have a median of 26.6 and 27.8%, respectively, and are not statistically different (p-value 0.46, Wilcoxon test). Taking the never thawed, previously thawed and newly formed deposits together, the mean of Fed/Fet, which represents the proportion of free Fe oxides out the global Fe pool (Selective Iron Extractions), equals 24.7%. Within those free oxides, poorly crystalline (i.e., amorphous) Fe oxides or complexed Fe reach 80.9% and therefore represent about 20% of the total Fe pool (Feo/Fet; Table 2). The distribution of reactive Fe-oxides varies within each profile; the Feo/Fet ratio ranges from 22.8 to 36.5% (Sob14 T2-2), 13.8–22.0% (Sob14 T2-5), 10–28.6% (KY T1-1) and 17.2–30.4% (KY T2-2), for two pairs of Yedoma-Alas profiles (Table 2); the Fep/Feo ratio in the same profiles indicates that more than a third of Fe amorphous phases are involved in complexes with OC.
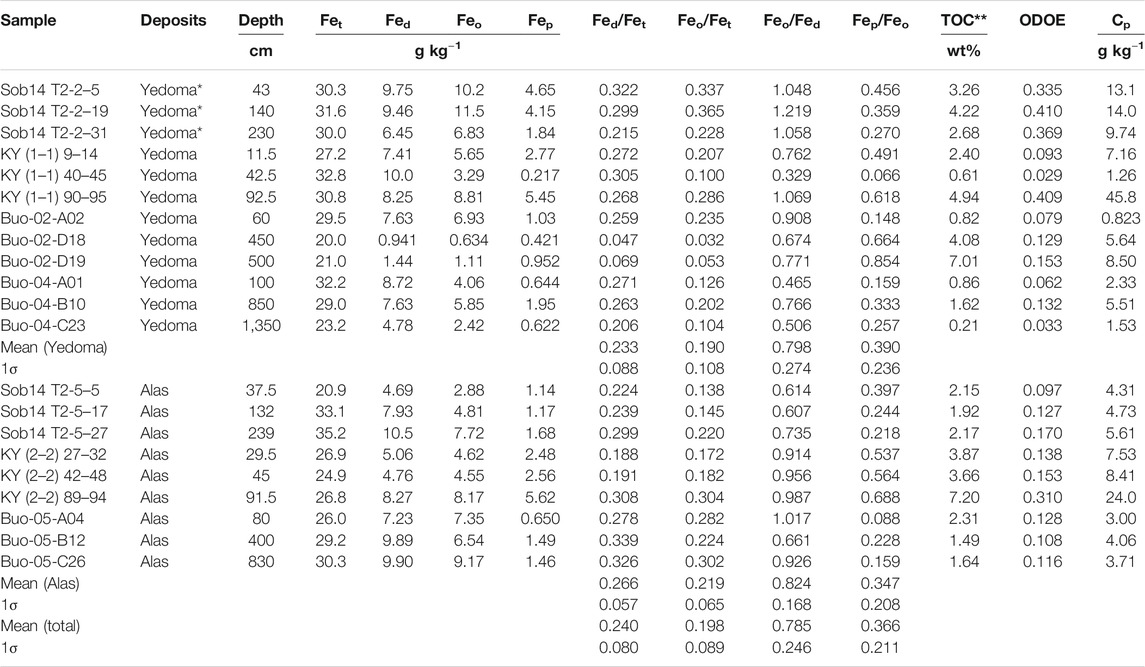
TABLE 2. Concentrations in total Fe (Fet) and Fe selectively extracted by dithionite-citrate-bicarbonate (Fed), ammonium oxalate (Feo), pyrophosphate (Fep) in Yedoma and Alas deposits. Total organic carbon (TOC), optical density of oxalate extract (ODOE) and C extracted with pyrophosphate (Cp) are also presented. *Sobo Sise samples are Holocene age deposits on top of Yedoma Ice Complex deposits profile. ** The TOC data are from Fuchs et al. (2018) for Sobo Sise Island (Sob), from Schirrmeister et al. (2017) for Buor Khaya Peninsula (Buo) and from Weiss et al. (2016) for Kytalyk (KY).
The C selectively extracted by the oxalate and pyrophosphate is presented in Table 2 and correlation matrix for all studied parameters (ODOE, Cp, TOC) is presented in Supplementary Figure S2. Positive correlations stand out between TOC content (in wt%) and Cp (mg kg−1; R2rob = 0.80; Figure 6A), and between Cp and Fep (R2rob = 0.80; Figure 6B), resulting in a positive correlation between TOC content and Fep (R2rob = 0.77; Figure 6C). A positive correlation is also observed between ODOE and Feo (R2rob = 0.4; not shown), as well as between ODOE and Fep (R2rob = 0.77; Figure 6D). The total Fe concentration in these deposits (Fet) is not correlated with pyrophosphate-extractable Fe and C (Fep, Cp) or TOC (R2rob < 0.05), but is correlated with DCB- (Fed; R2rob = 0.76; Figure 6E) and oxalate-(Feo; R2rob = 0.34; not shown) extractable Fe.
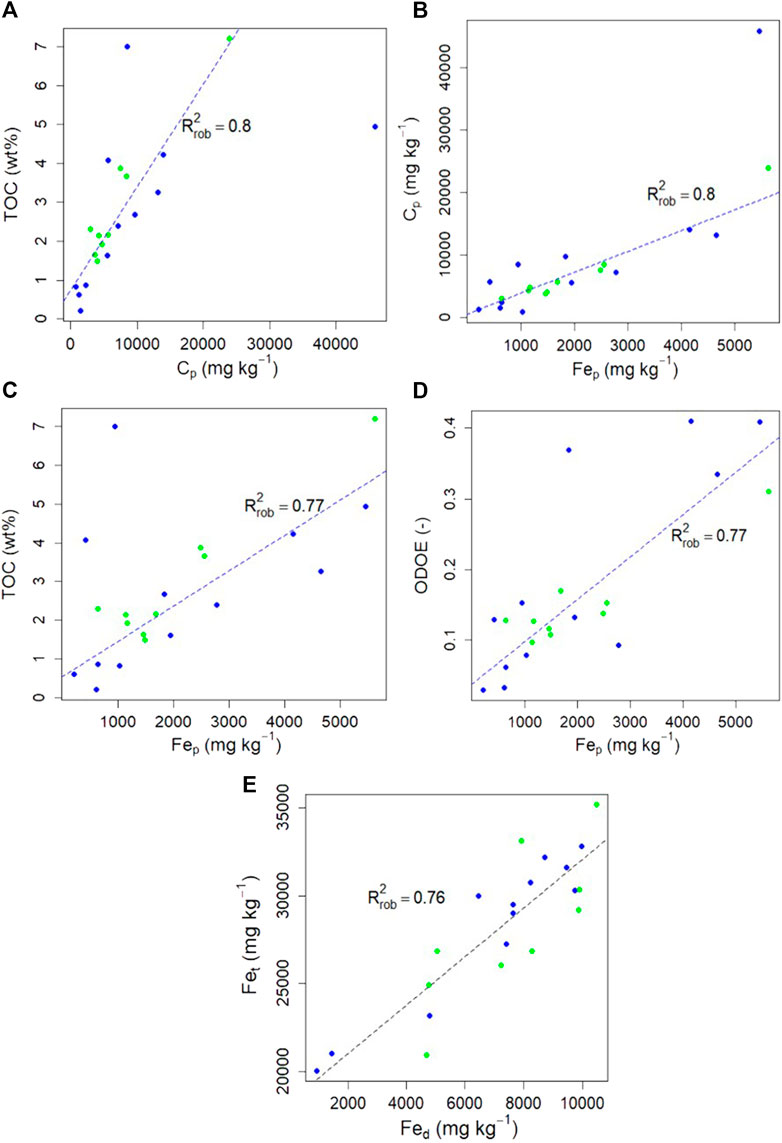
FIGURE 6. Robust linear regression plots for Yedoma Ice Complex deposits (blue dots) and Alas deposits (green dots) between (A) Total organic carbon (TOC) content (wt%) vs C extracted with pyrophosphate (Cp) (B) Cp vs Fe selectively extracted by pyrophosphate (Fep) (C) TOC vs Fep(D) Optical density of oxalate extract (ODOE) vs Fep; and (E) Total Fe concentrations (Fet) vs Fe selectively extracted by dithionite-citrate-bicarbonate (Fed). Dashed lines represent the robust linear regression (alpha = 0.95; n = 21).
Discussion
Iron Distribution in Yedoma Deposits
In Yedoma deposits, total Fe concentrations are stable with depth in all profiles (from both Siberia and Alaska). The standard deviation, 2σ, ranges from 1.3 to 3.7 g kg−1 Fe with depth for Cape Mamontov Klyk (Mak-12–19) and Muostakh Island (Muo), respectively (Figure 5; Supplementary Presentation S1). We suggest that the conditions of formation for these ice-rich deposits can explain the stable total Fe concentrations with depth within their profiles. First, Yedoma deposits have never thawed since their late Pleistocene deposition, thereby limiting the periods of redox fluctuations which may affect Fe solubility (Schwertmann, 1991; Colombo et al., 2014). We see this supported by evidence for a rapid syngenetic freezing (on geological timescale) of the transported particles after settlement during periods of Yedoma deposit aggradation (Schirrmeister et al., 2002) as well as overall dry conditions under late Pleistocene tundra steppe active layer conditions (Schirrmeister et al., 2013). Second, sediments along a single Yedoma profile likely result from materials with similar total Fe concentrations. Sediments contributing to Yedoma deposits are derived from a mix of lithologies being affected by intense periglacial weathering processes and getting deposited as unconsolidated sediments. The similar periglacial weathering, erosion, and sediment transport processes which were similar across large unglaciated permafrost domains in the Late Pleistocene may have contributed to the homogenization of mixed sediment lithologies before Yedoma aggradation. The origins of Yedoma sediments across the Yedoma domain have, for a long time, divided the scientific community and are still under debate (Schirrmeister et al., 2002, 2020; Murton et al., 2015). Yedoma deposits were, at first, characterized as homogeneous silty fine, ice- and organic-rich sediments with primary or secondary aeolian processes being the main contributor during the time of formation. Hence, Yedoma deposits were and still are often defined as loess or loess-related deposits (Pewe and Journaux, 1983; Tomirdiaro and Chernen’kiy, 1987; Murton et al., 2015). However, in addition to the established aeolian contribution to these ice-rich sediments, additional contributions from fluvial, colluvial, alluvial local sedimentation processes are identified in many regions of the Yedoma domain (e.g., Schirrmeister et al., 2020). It is now considered that the aggradation of Yedoma deposits is not the result of a single process of aeolian deposition, but rather the result of a polygenetic origin with probable seasonally differentiated deposition mechanisms controlled by local environmental conditions, including the contribution from local fluvial, colluvial, and alluvial sediments (Strauss et al., 2012; Schirrmeister et al., 2013, 2020). Similar heavy mineral composition between Yedoma deposits and the nearby mountain range support a contribution from local sediments during Yedoma deposits aggradation (e.g., Schwamborn et al., 2002; Siegert et al., 2002). The largely linear relationship between sample depth (or vertical position in an exposure) and calibrated 14C age reported for Yedoma deposits (Schirrmeister et al., 2002; Wetterich et al., 2014) indicates that the material is supplied with a stable sedimentation rate. Our data are well in line with the supply of local sediments with similar Fe concentrations, which is consistent with the reported homogeneous mineralogy of Yedoma deposits with depth (Strauss et al., 2017).
Despite generally dry conditions, Yedoma deposits may have experienced short wetter periods during their formation (indicated by the presence of peat or peaty soil layers). It can be identified from some of the studied profiles, as in Cape Mamontov Klyk (Mak-2–10), Bol’shoy Lyakhovsky Island (1-3 TZ) or Sobo Sise Island (SobT2-2), that the formation of peat layers are associated with the highest total Fe concentrations (Supplementary Presentation S1). In Cape Mamontov Klyk, the highest Fe concentrations occurred in a sandy peat layer underlying the typical silty Yedoma deposits. In Bol’shoy Lyakhovsky Island, the highest total Fe concentrations occurred in a peat inclusion from a typical Yedoma Ice Complex unit. In Sobo Sise, the total Fe concentrations are the highest in a single peaty horizon of Holocene age overlying Yedoma deposits. The higher total Fe concentration highlighted in these deposits often correspond with peat layers or inclusions. The local redistribution of total Fe in Yedoma profiles can be explained with two hypotheses: 1) solubilization of Fe (from Fe oxide or complexed Fe dissolution) induced by the wetter conditions during short warmer periods and translocation of Fe to a peat layer where the microscale redox environment favors Fe oxide precipitation or 2) cryoturbation of a surface peat horizon where Fe was precipitated following a similar solubilization and precipitation process. The high TOC content in these Fe-rich samples (e.g., TOC: Mak-2–3 = 15.3 wt% and Sob14T2-2–11 = 7.6 wt%) supports the hypothesis that the presence of peat favors the precipitation of solubilized Fe. Field observations from Schirrmeister et al. (2008) indicate that the sandy-peat layer from Cape Mamontov Klyk (5–10 m above sea level; Supplementary Presentation S1) have brownish to reddish mottled layers, in a buried oxic gley–soil horizon, thereby supporting our hypothesis of Fe translocation upon water saturated conditions and Fe oxide precipitation in favorable oxic conditions. Water saturated conditions are suggested to favor the translocation of reduced Fe as already observed in previous studies (Fiedler et al., 2004; Riedel et al., 2013; Herndon et al., 2017). The accumulation of Fe is also found in active layer or Holocene deposits (located in the top of the Bykovsky Peninsula profiles-Supplementary Presentation S1), and comparable with Fe accumulation in organic-rich surface soils of ice-wedge polygon from arctic tundra (Herndon et al., 2020a). Thus, evidence for Fe accumulation also supports that higher TOC content, often observed in active layer, promotes Fe precipitation in favorable redox conditions. Despite the fact that Yedoma deposit formation predominantly took place during the interstadial Marine Isotope Stage (MIS) three and the stadial MIS 2, promoted by long-lasting continental cold and arid climate conditions, short thaw phases occurred during the late Pleistocene with potential impact on the formation of Yedoma deposits (Schirrmeister et al., 2002, 2013; Wetterich et al., 2014). Wetter conditions trigger anoxia, which improves vegetation growth, lowers organic matter mineralization rates and thus promotes peat accumulation (Keller and Medvedeff, 2016). In northern latitudes, phases of peat expansion triggered by increasing air temperatures and moisture supply were inferred from paleo proxies (from 57 ka to 45 ka BP and from 35 ka to 29 ka BP; Treat et al., 2019). Buried peat layers found in deep Yedoma deposits could be indirect evidence of these “short” warming and wetting periods (Treat et al., 2019), and our data highlight that this likely promoted Fe precipitation. However, our data show that the presence of peat layers in Yedoma deposits does not necessarily imply accumulation of Fe (Supplementary Presentation S1). Detecting the presence or absence of Fe accumulation in these peat layers is important to identify potential accumulation of reactive Fe, which in turn can promote OC stabilization. Based on the positive correlation between total Fe concentrations and reactive Fe concentrations in the deposits (R2 = 0.76; Figure 6E), we argue that Fe accumulation in peat layers likely contributes to organic matter stabilization and hence to lower organic matter mineralization rates.
Our data highlight that Yedoma deposits from Siberia show similar total Fe concentrations (Global Distribution of Iron Concentrations in Yedoma and Alas Deposits; Figure 5) across deposits that span 1,500 km across Siberia (Figure 2). In Yedoma deposits from Alaska, the mean total Fe concentration differs from one Alaskan location to another, being higher in Western Alaska (Kitluk and Baldwin Peninsula: 41.1 ± 4.7 and 43.2 ± 7.4 g kg−1 Fe, respectively) than in Northern Alaska (Colville and Itkillik: 30.5 ± 1.9 and 24.6 ± 1.7 g kg−1 Fe, respectively; Figure 5; see Figure 2 for locations). The mineralogical variation between loess in different parts of the world reflects the nature of the surficial geology and the effectiveness of sediment mixing processes in the individual source regions (Pye, 1995). Our data suggest that across the Siberian sites, the sediments contributing to the deposits are of similar chemical composition, or of mixed lithologies with a total Fe concentration similar to the Fe concentration in the continental crust (Börker et al., 2018). The total Fe concentration reported in the upper continental crust (39 g kg−1; Rudnick and Gao, 2003), in continental sediments (40 g kg−1; Rauch and Pacyna, 2009) and in a typical loess (24 g kg−1; Rauch and Pacyna, 2009) are likely to yield a homogeneous total Fe concentration in Yedoma deposits (32 g kg−1; this study) after sediment mixing by periglacial surface abrasion and polygenetic (aeolian, fluvial, colluvial, alluvial) transport and deposition. In contrast, in Alaska, the different mean total Fe concentration in different locations suggests a range of Fe contributions from different local lithologies, such as carbonates present in North Alaska close to the Brooks Range (Walker and Everett, 1991; Till et al., 2008). Overall, despite their different mean total Fe concentrations, both Siberia and Alaska Yedoma deposits present similar Fe concentrations with depth, and can be used to investigate the influence of thermokarst process with potential redistribution of Fe during Alas deposits formation.
Thawing Triggers Iron Mobility in Ice-Rich Deposits and Iron Redistribution in Alas Deposits
Our results show a larger variability in total Fe concentrations in Alas deposits relative to Yedoma deposits (Figures 4, 5; Supplementary Presentation S1 for both Siberia and Alaska. In contrast to never thawed Yedoma deposits (discussed in Iron Distribution in Yedoma Deposits), Alas deposits, have experienced intense thawing processes with potential effects on redox-sensitive elements (e.g., Fe). Alas deposits result from the impact of thaw and post-depositional processes on ice-rich Yedoma deposits, as well as newly formed Holocene deposits. Ground collapse during thawing of ice-rich deposits, caused by the volume loss after ground ice melt, often creates favorable conditions for thermokarst lake formation. Depending on local conditions, these lakes can persist for several decades, centuries, or even millennia, before they drain due to further permafrost degradation or dry out under unfavorable water balance conditions (e.g., shallow water bodies; Grosse et al., 2013). Moreover, several studies consider that thermokarst lakes form, drain and reform in a cycle (“thaw-lake cycle”); a process that would result in substantial changes to Alas deposits on millennial timescale because of repeatedly reworked sediments undergoing several alternating stages of lacustrine and subaerial wetland development (Jones et al., 2012). Field evidence of multiple thermokarst lake generations overlapping at sites can also be found in cores (e.g., Lenz et al., 2016). In summary, Alas deposits are the result of thermokarst dynamics during the Lateglacial and Holocene and associated reworking of deposits once or multiple times depending on overall thaw dynamics in the landscape. Additional complexity arises from the fact that thermokarst landforms undergo successional changes over time from initial towards advanced stages of degradation and possibly stabilization, during which the dominant physical and biogeochemical processes may change as these features evolve (Biskaborn et al., 2013; Kokelj and Jorgenson, 2013; Turetsky et al., 2020).
Relative to Yedoma deposits that have never thawed displaying homogeneous Fe concentrations with depth (Iron Distribution in Yedoma Deposits), Alas deposits from corresponding locations are characterized by changes in total Fe concentrations with depth (Supplementary Presentation S1). This likely results from Fe becoming mobile during post-depositional processes such as thermokarst events and subsequent drainage, affecting Fe distribution in reworked and newly formed deposits. It is well established that Fe can be mobilized in water-saturated soil (Riedel et al., 2013; Colombo et al., 2014; Pokrovsky et al., 2014; Manasypov et al., 2015; Herndon et al., 2020b). The loss of Fe from alluvial plain soil horizons is correlated to low redox potential (Eh) supporting the idea that leaching of redox-sensitive elements, such as Fe, occurred during fluctuating redox conditions in thermokarst lakes (Fiedler and Sommer, 2004). Moreover, redox gradients can occur over small scale, e.g., with relief changes between high-centered and low-centered polygons in polygonal permafrost soils (Fiedler et al., 2004), or over centimeter scale (Herndon et al., 2020). It follows that solubilization, translocation and precipitation are also the major processes involved in Fe mobility in Alas deposits. Here, the data support that 1) thermokarst lake formation after ice-rich Yedoma degradation has generated reducing conditions favoring the solubilization and translocation of dissolved Fe from oxides or complexed forms in the initial Yedoma deposit, 2) the subsequent thermokarst lake drainage and refreezing as well as peat accumulation generated suitable oxic conditions that promote Fe precipitation in Alas deposits. The Alas deposits therefore represent reworked and newly formed deposits, which have experienced local oxidation and precipitation of dissolved Fe in favorable environments depending on microscale redox potential. This is also supported by field observations of Alas deposits profiles (e.g., DY-02) with the typical brownish color given by Fe oxides (Wetterich et al., 2011b) in the layers enriched in total Fe concentration (Supplementary Presentation S1).
Grain-size distribution is commonly used as an indicator of major disturbances between the original Yedoma deposits and the reworked and newly formed Alas deposits induced by post-depositional processes (Strauss et al., 2012). This allows identifying contrasts between homogeneous grain-size distribution in Yedoma deposits (e.g., in Duvanny Yar DY-01 and DY-05) and the more heterogeneous distribution with coarser and finer particles in Alas deposits (e.g., DY-04 and DY-02 from the same location; Strauss, 2010; Strauss et al., 2012). The contrast between homogeneous distribution of total Fe concentration with depth in Yedoma deposits and the heterogeneous distribution of total Fe concentration with depth in Alas deposits (Supplementary Presentation S1) is in good agreement with the observations based on the grain-size distribution (Supplementary Figure S3), and supports that the reworking and new formation of the deposits is leading to changing conditions for the mobility of Fe. The degree of Fe redistribution within Alas deposits could be an indicator of the intensity of post-depositional processes. The study of such redistribution may give new clues on thermokarst dynamics, in particular 1) drainage rate after lake formation, 2) rapid refreezing after drainage, or 3) single or multiple thaw-lake cycles. In this way, these observations of Fe mobilization in the paleo-record act as an analogue for present day and future Fe distribution in thermokarst lake deposits.
Changing Iron and Organic Carbon Interactions During Post-Depositional Processes
The changing conditions for Fe mobility upon thermokarst processes potentially affect Fe-OC interactions and thereby OC stability in the reworked deposits (Colombo et al., 2014; Herndon et al., 2020b; Kleber et al., 2021). This study shows that, on average, 25% of total Fe is in Fe-oxide form (as crystalline or amorphous phases) and that out of these oxides, 80% is amorphous or complexed Fe (Table 2). Based on the subset of samples analyzed for the selective extractions of Fe (n = 21), it appears that the proportion of reactive Fe oxides to the global Fe pool is not significantly different between thawed and never thawed deposits, whether considering the total Fe-oxides (Fed/Fet; p-value = 0.46) or the amorphous Fe-oxides (Feo/Fet, p-value = 0.55; Table 2). The crystallinity of Fe-oxides phases in soils is not solely controlled by redox conditions, but other factors such as water budget, organic matter input, initial Fe phase composition, and time (potentially inducing Fe-oxide aging) are also important players (Cudennec and Lecerf, 2006; Winkler et al., 2018). In addition, microbial activity, especially from Fe-reducing microorganisms, may influence the crystallinity of Fe oxides and abundance of complexed Fe (Rivkina et al., 2020). As a result, both increases or decreases in Fe oxides crystallinity have been reported under redox fluctuations in wetlands soils (Winkler et al., 2018). This likely explains why our data indicate that the thawing history of the deposits is not leading to systematic changes in the crystallinity of Fe oxides. We observed that the concentration in reactive Fe oxides (Fed) in Yedoma and Alas deposits is positively correlated with their total Fe concentrations (Figure 6E). This result supports that total Fe accumulation (i.e., reported locally in Yedoma deposits and intensively in Alas deposits) is directly associated to the accumulation of reactive Fe oxides, thereby providing potential OC stabilizing phases in these deposits. The redistribution in total Fe concentration in the Alas deposits suggest that Fe accumulation likely occurred in oxic conditions favorable for oxy-hydroxide formation, whereas Fe depletion was likely associated with flooding conditions leading to dissolution in reducing conditions combined with subsequent loss of Fe via lateral or vertical leaching mechanisms.
The characterization of reactive Fe-oxides (crystalline, poorly crystalline and complexed Fe (Fed, Feo, Fep)) is a primary step required to track the potential driving factors linking mineral and organic components in soils and sediments. Interactions between Fe and OC, as Fe-OC complexes and as OC-Fe oxide associations, are supported by the positive correlation between 1) the complexed Fe (Fep) and the complexed carbon (Figure 6B), and 2) the complexed Fe and the ODOE which represents organic acids associated with amorphous Fe oxides and complexed Fe (Figure 6D). The more TOC is present in the deposit, the more carbon is present in complexed form (Figure 6A). Deciphering between the many OC stabilizing processes reported in the literature, such as physical and physico-chemical protection involving Fe oxides (aggregation, organo-mineral associations) and organo-metallic complexes (complexation) is of primary importance to better predict the fate of OC in a warming Arctic (e.g., Lutzow et al., 2006; Kögel-Knabner et al., 2008). Our work highlights that total Fe is redistributed upon thermokarst processes, but more importantly, we highlight the local (Yedoma) or intensive (Alas) redistribution of protective mechanisms associated to OC in ice-rich permafrost regions.
Implications of Thermokarst Processes for Iron Mobility and Interactions With Organic Carbon
The different steps of Fe mobility between Yedoma and Alas deposits can be summarized as follows (Figure 7): in Yedoma deposits that never thawed since deposition, the syngenetic freezing of sediments soon after deposition limits solubilization and translocation of Fe throughout the profile (Supplementary Presentation S1). Nonetheless, Yedoma deposits, which may have experienced short wetter periods (indicated by peat layers), show a local accumulation/depletion of Fe and therefore suggest Fe mobility and translocation mechanisms. In contrast, in Alas deposits, which have experienced intensive thermokarst processes, we observe a large variability of total Fe concentrations (Figure 7), suggesting sustained dissolution of Fe oxides and/or complexed Fe, Fe translocation and precipitation in redox favorable microscale environments with potential peat influence. Finally, fluvial deposits underlying Yedoma deposits or deposits showing marine to deltaic influence in coastal regions (e.g., Bunge Land; Supplementary Presentation S1) display low total Fe concentrations that either suggest depletion caused by lateral loss during flood events or a different sediment origin already depleted in Fe prior to deposition. These fluvial deposits are also characterized with very low TOC values which may not facilitate Fe precipitation. Overall, the redistribution of Fe between Yedoma and Alas deposits reflects the influence of the complex history of Yedoma deposits (polygenetic origin, potential short thawing periods during late Pleistocene) and the intense post-depositional processes of Alas deposits during Lateglacial to Holocene warmer periods (Figure 8).
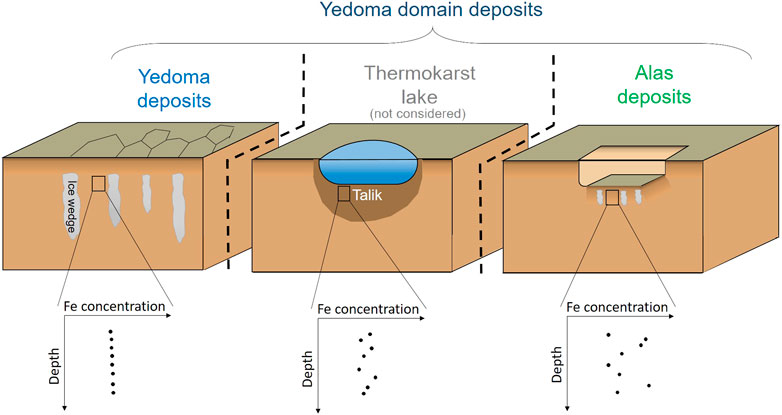
FIGURE 7. Conceptual scheme of the depth-distribution of total Fe concentration in never thawed Yedoma Ice Complex deposits, in deposits subsequently to thaw processes, i.e., below thermokarst lake (not considered in this study) and in Alas deposits. Black rectangles in the upper schematic representation of Yedoma, thermokarst lake and Alas profile indicate the sample location. The spatial coverage of the geomorphologic features is not to scale.
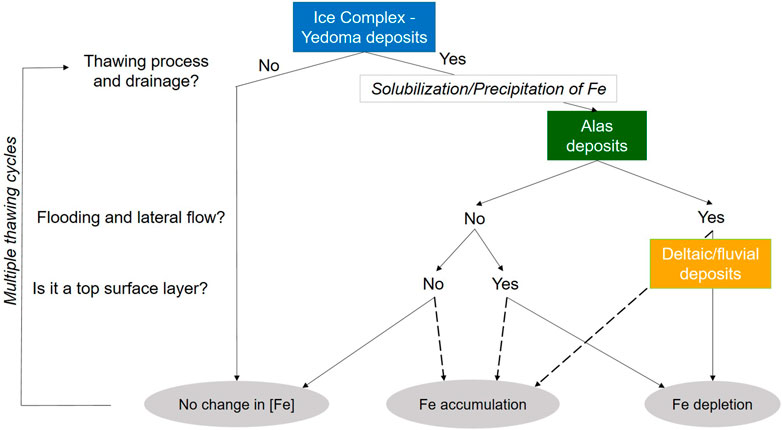
FIGURE 8. Schematic representation of the iron dynamic within Yedoma domain deposits and the resulting impact for Fe concentration ([Fe]) in Yedoma Ice Complex (blue), Alas (green), and deltaic/fluvial deposits (orange). The “Yes” and “No” correspond to the answer of the question on the left side of the scheme. Dashed lines suggest the potential influence of peat to create favorable oxic conditions.
The Fe-OC associations are not permanent: they may disappear in a wetter, reducing environment, or form in oxic conditions resulting in a redistribution of Fe throughout the sediment profile (Opfergelt, 2020; Patzner et al., 2020). Our results highlight that specific horizons from Alas deposits have a 2 to 3-fold increase in total Fe concentration (Supplementary Presentation S1) and therefore we could expect a 2 to 3-fold increase in reactive Fe, based on the positive correlation between total Fe concentrations and reactive Fe concentrations in the deposits (R2 = 0.76; Figure 6E). In contrast, sandy layers, often depleted in TOC, have a 2.5-fold decrease in total Fe concentrations compared to the overlying typical Ice Complex deposits (Supplementary Presentation S1). The redistribution of stabilizing OC phases (i.e., Fe-oxides or complexed Fe) is key for the fate of OC in a warming Arctic. The changing Fe concentration between Yedoma and Alas deposits support the idea that future thermokarst processes in the Arctic will affect Fe-OC interactions. In this study, we contend that Alas deposits which have experienced past thawing processes are key witnesses to predict what may happen next with Fe-OC interactions during the current and future Arctic warming. More specifically, it can be expected that oxic conditions would favor Fe-oxides formation, generating Fe-OC interactions thereby contributing to mitigate OC decomposition, whereas flooding would generate reducing conditions and the lateral and vertical transport of dissolved Fe phases resulting in the depletion of total Fe concentrations, thereby contributing to decrease Fe-OC interactions, and limiting long-term OC stabilization. We also highlight that future permafrost thaw will be superimposed on deposits with a relict Fe distribution from the Holocene and Pleistocene. The paleo Fe distribution in the Yedoma domain may have a knock-on effect how Fe can be distributed during future thaw, and therefore is primed for variations in OC stabilization and OC mineralization rates. It is therefore essential to consider the permafrost history to predict the evolution of OC upon warming and permafrost thaw.
Conclusion
We determined the total Fe concentration (n = 1,292) and distribution of Fe-oxides and Fe involved in complexes (n = 21) in unthawed Yedoma deposits and previously thawed Alas deposits from the Yedoma domain. We found:
1) that the total Fe concentrations in never thawed Yedoma deposits are homogeneous with depth in Alaska and in Siberia, allowing for Fe concentrations in previously thawed Alas deposits to be compared with Yedoma deposits to test the impact of thermokarst processes on Fe mobility.
2) a local redistribution of total Fe concentration throughout Yedoma profiles (i.e., driven by short thaw phases upon Yedoma aggradation with potential peat influence) and an intensive total Fe redistribution in Alas deposits consequent to thermokarst lake formation and drainage, supporting that iron is mobile upon thaw. We suggest Fe mobility after Fe-oxides dissolution, i.e., Fe translocation within sediments followed by Fe-oxides re-precipitation in favorable microscale conditions or Fe leaching.
3) a positive correlation between the total Fe concentration and the reactive Fe concentration in both Yedoma and Alas deposits. On average, proportion of reactive Fe (i.e., Fe-oxides or complexed Fe) equals 25% of global Fe pool for both Yedoma and Alas deposits. The intensive redistribution of total Fe in Alas profiles imply that reactive Fe is redistributed upon thermokarst processes with direct implication on OC stabilization.
The Yedoma domain has been a highly dynamic environment since the late Pleistocene period until today, and will continue to be so with the projected rising temperatures. Our research suggests that similar processes (i.e., Fe solubilization, translocation and precipitation) occur in ice-rich permafrost degradation upon thermokarst processes as previously described for polygonal or thaw gradient permafrost landscapes. The total Fe accumulation/depletion, observed in Alas deposits is accompanied with an accumulation/depletion of reactive Fe and micro-scale implications for OC stabilization. We argue that the change from frozen to unfrozen state leads to the modifications of multiple environmental conditions (fluctuating redox conditions, subsidence, leaching, and drainage) with indirect impact on Fe-oxides distribution and hence on a portion of mineral-protected OC pools.
Data Availability Statement
The datasets presented in this study can be found in online repositories. The names of the repository/repositories and accession number(s) can be found below: https://doi.pangaea.de/10.1594/PANGAEA.922724.
Author Contributions
AM and SO conceived and planned the experimental work. AM realized the Fe concentration measurements by pXRF with the help of EM, and realized the selective Fe extractions with the help of NB. GG, LS, MF, and JS contributed with their expertise on permafrost stratigraphy, the sedimentological history of the sample deposits and provided the samples. CH contributed with her expertise on Fe in Arctic regions. AM performed the data processing. AM wrote the manuscript with input from all co-authors.
Funding
This project received funding from the European Union’s Horizon 2020 research and innovation program under grant agreement No. 714617 to SO, and SO acknowledges funding from the Fund for Scientific Research FNRS in Belgium (FC69480). This work was embedded into the Action Group “The Yedoma Region” funded by the International Permafrost Association. Field sample collection was funded by a European Research Council (ERC) Starting Grant 338,335) to GG as well as Alfred Wegener Institute basic funding.
Conflict of Interest
The authors declare that the research was conducted in the absence of any commercial or financial relationships that could be construed as a potential conflict of interest.
The handling editor is currently organizing a Research Topic with one of the authors LS.
Publisher’s Note
All claims expressed in this article are solely those of the authors and do not necessarily represent those of their affiliated organizations, or those of the publisher, the editors and the reviewers. Any product that may be evaluated in this article, or claim that may be made by its manufacturer, is not guaranteed or endorsed by the publisher.
Acknowledgments
The authors acknowledge the Mineral and Organic Chemical Analysis (MOCA) platform at UCLouvain for conducting chemical analysis, Benoît Pereira and Aubry Vandeuren for their expertise on portable X-Ray Fluorescence measurements, and the members of the WeThaw project for useful discussions. We thank Peter Kuhry from Stockholm University, as well as the Russian–German scientific collaborations like “System Laptev Sea”, “Lena Delta” and other Russian-German expeditions for providing samples.
Supplementary Material
The Supplementary Material for this article can be found online at: https://www.frontiersin.org/articles/10.3389/feart.2021.703339/full#supplementary-material
Supplementary Presentation 1 | Depth-variation plot of total Fe concentrations (mg kg−1) presented with the corresponding stratigraphic columns in never thawed Yedoma Ice Complex deposits (left side:A, C, E, G, I, K, M, O) and in previously thawed and newly formed Alas deposits (right side:B, D, F, H, J, L, N, P) from the following sites: Duvanny Yar (A,B), Cape Mamontov Klyk (C,D), Bol’shoy Lyakhovsky Island (E,F), Bykovsky Peninsula (G,H), Oyogos Yar coast (I,J), Baldwin Peninsula (K,L), Sobo Sise Island (M,N), New Siberian Archipelago and Muostakh Island (O,P). Samples with total organic carbon (TOC) content > 5wt% (plain circle) and < 5wt% (open circle) are identified (samples with missing information about TOC content are presented with a cross). The stratigraphic columns are based on descriptions provided in the reference papers listed in Table 1 for each location. Labels for each profile are explained in Supplementary Table S1.
References
Abbott, B. W., and Jones, J. B. (2015). Permafrost Collapse Alters Soil Carbon Stocks, Respiration, CH4, and N2O in upland Tundra. Glob. Change Biol. 21, 4570–4587. doi:10.1111/gcb.13069
Adhikari, D., and Yang, Y. (2015). Selective Stabilization of Aliphatic Organic Carbon by Iron Oxide. Sci. Rep. 5, 1–7. doi:10.1038/srep11214
Andreev, A. A., Grosse, G., Schirrmeister, L., Kuznetsova, T. V., Kuzmina, S. A., Bobrov, A. A., et al. (2009). Weichselian and Holocene Palaeoenvironmental History of the Bol'shoy Lyakhovsky Island, New Siberian Archipelago, Arctic Siberia. Boreas. 38, 72–110. doi:10.1111/j.1502-3885.2008.00039.x
Andreev, A. A., Schirrmeister, L., Siegert, C., Bobrov, A. A., Demske, D., Seiffert, M., et al. (2002). Paleoenvironmental Changes in Northeastern Siberia during the Late Quaternary - Evidence From Pollen Records of the Bykovsky Peninsula. Polarforschung. 70, 13–25. doi:10.2312/polarforschung.70.13
Audry, S., Pokrovsky, O. S., Shirokova, L. S., Kirpotin, S. N., and Dupré, B. (2011). Organic Matter Mineralization and Trace Element Post-Depositional Redistribution in Western Siberia Thermokarst lake Sediments. Biogeosciences. 8, 3341–3358. doi:10.5194/bg-8-3341-2011
Bascomb, C. L. (1968). Distribution of Pyrophosphate-Extractable Iron and Organic Carbon in Soils of Various Groups. J. Soil Sci. 19, 251–268. doi:10.1111/j.1365-2389.1968.tb01538.x
Biskaborn, B. K., Herzschuh, U., Bolshiyanov, D. Y., Schwamborn, G., and Diekmann, B. (2013). Thermokarst Processes and Depositional Events in a Tundra lake, Northeastern Siberia. Permafrost Periglac. Process. 24, 160–174. doi:10.1002/ppp.1769
Blakemore, L. C., Searle, P. L., and Daly, B. K. (1981). Methods for Chemical Analysis of Soils. New Zealand Soil Bur. Scientific Rep. 10 A, second revision., 102. doi:10.7931/DL1-SBSR-10A
Börker, J., Hartmann, J., Amann, T., and Romero-Mujalli, G. (2018). Terrestrial Sediments of the Earth: Development of a Global Unconsolidated Sediments Map Database (GUM). Geochem. Geophys. Geosyst. 19, 997–1024. doi:10.1002/2017GC007273
Chao, T. T., and Sanzolone, R. F. (1992). Decomposition Techniques. J. Geochemical Exploration. 44, 65–106. doi:10.1016/0375-6742(92)90048-d
Chen, C., Hall, S. J., Coward, E., and Thompson, A. (2020). Iron-Mediated Organic Matter Decomposition in Humid Soils Can Counteract protection. Nat. Commun. 11, 2255. doi:10.1038/s41467-020-16071-5
Colombo, C., Palumbo, G., He, J.-Z., Pinton, R., and Cesco, S. (2014). Review on Iron Availability in Soil: Interaction of Fe Minerals, Plants, and Microbes. J. Soils Sediments. 14, 538–548. doi:10.1007/s11368-013-0814-z
Cudennec, Y., and Lecerf, A. (2006). The Transformation of Ferrihydrite into Goethite or Hematite, Revisited. J. Solid State. Chem. 179, 716–722. doi:10.1016/j.jssc.2005.11.030
Daly, B. K. (1982). Identification of Podzols and Podzolised Soils in New Zealand by Relative Absorbance of Oxalate Extracts of A and B Horizons. Geoderma. 28, 29–38. doi:10.1016/0016-7061(82)90038-6
Fiedler, S., and Sommer, M. (2004). Water and Redox Conditions in Wetland Soils—Their Influence on Pedogenic Oxides and Morphology. Soil Sci. Soc. Am. J. 68, 10. doi:10.2136/sssaj2004.3260
Fiedler, S., Wagner, D., Kutzbach, L., and Pfeiffer, E.-M. (2004). Element Redistribution along Hydraulic and Redox Gradients of Low-Centered Polygons, Lena Delta, Northern Siberia. Soil Sci. Soc. Am. J. 68, 1002–1011. doi:10.2136/sssaj2004.1002
Fuchs, M., Grosse, G., Strauss, J., Günther, F., Grigoriev, M., Maximov, G. M., et al. (2018). Carbon and Nitrogen Pools in Thermokarst-Affected Permafrost Landscapes in Arctic Siberia. Biogeosciences. 15, 953–971. doi:10.5194/bg-15-953-2018
Grigoriev, M. N., Rachold, V., and Bolshiyanov, D. (2003). Russian-German Cooperation System Laptev Sea: the Expedition LENA 2002, Berichte zur Polar- und Meeresforschung (Reports on Polar and Marine Research), Alfred Wegener Inst. Polar Mar. Res. 466, 341. doi:10.2312/BzPM_0466_2003
Grosse, G., Jones, B., and Arp, C. (2013). “8.21 Thermokarst Lakes, Drainage, and Drained Basins,” in Treatise on Geomorphology (Elsevier), 325–353. doi:10.1016/B978-0-12-374739-6.00216-5
Grosse, G., Jones, B. M., Schirrmeister, L., Meyer, H., Wetterich, S., Strauss, J., et al. (2015). “Late Pleistocene and Holocene Ice-Rich Permafrost in the Colville River valley, Northern Alaska,” in EPIC3PAST Gateways 2015, Potsdam, 18 May 2015 - 22 May 2015, Geophysical Research Abstracts (Potsdam: EGU2015-10607). Available at: http://www.awi.de/pastgateways2015 (Accessed October 12, 2020).
Grosse, G., Schirrmeister, L., Siegert, C., Kunitsky, V. V., Slagoda, E. A., Andreev, A. A., et al. (2007). Geological and Geomorphological Evolution of a Sedimentary Periglacial Landscape in Northeast Siberia during the Late Quaternary. Geomorphology. 86, 25–51. doi:10.1016/j.geomorph.2006.08.005
Herndon, E., AlBashaireh, A., Singer, D., Roy Chowdhury, T., Gu, B., and Graham, D. (2017). Influence of Iron Redox Cycling on Organo-mineral Associations in Arctic Tundra Soil. Geochimica et Cosmochimica Acta. 207, 210–231. doi:10.1016/j.gca.2017.02.034
Herndon, E., Kinsman-Costello, L., Di Domenico, N., Duroe, K., Barczok, M., Smith, C., et al. (2020a). Iron and Iron-Bound Phosphate Accumulate in Surface Soils of Ice-Wedge Polygons in Arctic Tundra. Environ. Sci. Process. Impacts. 22, 1475–1490. doi:10.1039/D0EM00142B
Herndon, E., Kinsman‐Costello, L., and Godsey, S. (2020b). “Biogeochemical Cycling of Redox‐Sensitive Elements in Permafrost‐Affected Ecosystems,” in In Geophysical Monograph Series. Editors K. Dontsova, Z. Balogh‐Brunstad, and G. Le Roux (Wiley), 245–265. doi:10.1002/9781119413332.ch12
Huang, W., and Hall, S. J. (2017). Elevated Moisture Stimulates Carbon Loss from mineral Soils by Releasing Protected Organic Matter. Nat. Commun. 8, 1–10. doi:10.1038/s41467-017-01998-z
Hugelius, G., Strauss, J., Zubrzycki, S., Harden, J. W., Schuur, E. A. G., Ping, C.-L., et al. (2014). Estimated Stocks of Circumpolar Permafrost Carbon with Quantified Uncertainty Ranges and Identified Data Gaps. Biogeosciences. 11, 6573–6593. doi:10.5194/bg-11-6573-2014
Jeanroy, E., and Guillet, B. (1981). The Occurrence of Suspended Ferruginous Particles in Pyrophosphate Extracts of Some Soil Horizons. Geoderma. 26, 95–105. doi:10.1016/0016-7061(81)90078-1
Jones, M. C., Grosse, G., Jones, B. M., and Walter Anthony, K. (2012). Peat Accumulation in Drained Thermokarst lake Basins in Continuous, Ice-Rich Permafrost, Northern Seward Peninsula, Alaska. J. Geophys. Res. 117, a. doi:10.1029/2011JG001766
Jongejans, L. L., Strauss, J., Lenz, J., Peterse, F., Mangelsdorf, K., Fuchs, M., et al. (2018). Organic Matter Characteristics in Yedoma and Thermokarst Deposits on Baldwin Peninsula, West Alaska. Biogeosciences 15, 6033–6048. doi:10.5194/bg-15-6033-2018
Kaiser, K., and Guggenberger, G. (2007). Sorptive Stabilization of Organic Matter by Microporous Goethite: Sorption into Small Pores vs. Surface Complexation. Eur. J. Soil Sci. 58, 45–59. doi:10.1111/j.1365-2389.2006.00799.x
Kanevskiy, M., Shur, Y., Fortier, D., Jorgenson, M. T., and Stephani, E. (2011). Cryostratigraphy of Late Pleistocene Syngenetic Permafrost (Yedoma) in Northern Alaska, Itkillik River Exposure. Quat. Res. 75, 584–596. doi:10.1016/j.yqres.2010.12.003
Kappler, A., Bryce, C., Mansor, M., Lueder, U., Byrne, J. M., and Swanner, E. D. (2021). An Evolving View on Biogeochemical Cycling of Iron. Nat. Rev. Microbiol. 19, 360–374. doi:10.1038/s41579-020-00502-7
Keller, J. K., and Medvedeff, C. A. (2016). “Soil Organic Matter,” in Wetland Soils: Genesis, Hydrology, Landscapes, and Classification. Editors M.J. Vepraskas, C.B. Craft, and J.L. Richardson (Boca Raton, FL: CRC Press), 165–188.
Kleber, M., Bourg, I. C., Coward, E. K., Hansel, C. M., Myneni, S. C. B., and Nunan, N. (2021). Dynamic Interactions at the Mineral-Organic Matter Interface. Nat. Rev. Earth Environ. 2, 402–421. doi:10.1038/s43017-021-00162-y
Kleber, M., Eusterhues, K., Keiluweit, M., Mikutta, C., Mikutta, R., and Nico, P. S. (2015). Mineral-Organic Associations: Formation, Properties, and Relevance in Soil Environments,” In Advances in Agronomy (Elsevier), 1–140. doi:10.1016/bs.agron.2014.10.005
Kögel-Knabner, I., Guggenberger, G., Kleber, M., Kandeler, E., Kalbitz, K., Scheu, S., et al. (2008). Organo-Mineral Associations in Temperate Soils: Integrating Biology, Mineralogy, and Organic Matter Chemistry. J. Plant Nutr. Soil Sci. 171, 61–82. doi:10.1002/jpln.200700048
Kögel-Knabner, I., Amelung, W., Cao, Z., Fiedler, S., Frenzel, P., Jahn, R., et al. (2010). Biogeochemistry of Paddy Soils. Geoderma. 157, 1–14. doi:10.1016/j.geoderma.2010.03.009
Kokelj, S. V., and Jorgenson, M. T. (2013). Advances in Thermokarst Research. Permafrost Periglac. Process. 24, 108–119. doi:10.1002/ppp.1779
Lalonde, K., Mucci, A., Ouellet, A., and Gélinas, Y. (2012). Preservation of Organic Matter in Sediments Promoted by Iron. Nature 483, 198–200. doi:10.1038/nature10855
Lenz, J., Wetterich, S., Jones, B. M., Meyer, H., Bobrov, A., and Grosse, G. (2016). Evidence of Multiple Thermokarst Lake Generations From an 11 800‐Year‐old Permafrost Core on the Northern S Eward P Eninsula, A Laska. Boreas 45, 584–603. doi:10.1111/bor.12186
Lipson, D. A., Zona, D., Raab, T. K., Bozzolo, F., Mauritz, M., and Oechel, W. C. (2012). Water-Table Height and Microtopography Control Biogeochemical Cycling in an Arctic Coastal Tundra Ecosystem. Biogeosciences 9, 577–591. doi:10.5194/bg-9-577-2012
Lützow, M. v., Kögel-Knabner, I., Ekschmitt, K., Matzner, E., Guggenberger, G., Marschner, B., et al. (2006). Stabilization of Organic Matter in Temperate Soils: Mechanisms and Their Relevance Under Different Soil Conditions - a Review. Eur. J. Soil Sci. 57, 426–445. doi:10.1111/j.1365-2389.2006.00809.x
Manasypov, R. M., Vorobyev, S. N., Loiko, S. V., Kritzkov, I. V., Shirokova, L. S., Shevchenko, V. P., et al. (2015). Seasonal Dynamics of Organic Carbon and Metals in Thermokarst Lakes from the Discontinuous Permafrost Zone of Western Siberia. Biogeosciences 12, 3009–3028. doi:10.5194/bg-12-3009-2015
McKeague, J. A., and Day, J. H. (1966). Dithionite- and Oxalate-Extractable Fe and Al as Aids in Differentiating Various Classes of Soils. Can. J. Soil Sci. 46, 13–22. doi:10.4141/cjss66-003
Mehra, O. P., and Jackson, M. L. (2013). Iron Oxide Removal from Soils and Clays by a Dithionite-Citrate System Buffered with Sodium Bicarbonate. Clays Clay Miner, 317–327. doi:10.1016/B978-0-08-009235-5.50026-7
Monhonval, A., Opfergelt, S., Mauclet, E., Pereira, B., Vandeuren, A., Grosse, G., et al. (2020). Data from: Yedoma Domain Mineral Concentrations Assessment (YMCA). PANGAEA Digital Repository. doi:10.1594/PANGAEA.922724
Mu, C. C., Zhang, T. J., Zhao, Q., Guo, H., Zhong, W., Su, H., et al. (2016). Soil Organic Carbon Stabilization by Iron in Permafrost Regions of the Qinghai-Tibet Plateau. Geophys. Res. Lett. 43 (10), 286–310. doi:10.1002/2016GL070071
Murton, J. B., Goslar, T., Edwards, M. E., Bateman, M. D., Danilov, P. P., Savvinov, G. N., et al. (2015). Palaeoenvironmental Interpretation of Yedoma Silt (Ice Complex) Deposition as Cold-Climate Loess, Duvanny Yar, Northeast Siberia. Permafrost Periglac. Process. 26, 208–288. doi:10.1002/ppp.1843
National research centre for CRM (1986). Institute of Geophysical and Geochemical Exploration Component (GBW 07401- GBW 07404). Langfang, China.
Nitzbon, J., Westermann, S., Langer, M., Martin, L. C. P., Strauss, J., Laboor, S., et al. (2020). Fast Response of Cold Ice-Rich Permafrost in Northeast Siberia to a Warming Climate. Nat. Commun. 11, 2201. doi:10.1038/s41467-020-15725-8
Olefeldt, D., Goswami, S., Grosse, G., Hayes, D., Hugelius, G., Kuhry, P., et al. (2016). Circumpolar Distribution and Carbon Storage of Thermokarst Landscapes. Nat. Commun. 7, 13043. doi:10.1038/ncomms13043
Opel, T., Wetterich, S., Meyer, H., Dereviagin, A. Y., Fuchs, M. C., and Schirrmeister, L. (2017). Ground-ice Stable Isotopes and Cryostratigraphy Reflect Late Quaternary Palaeoclimate in the Northeast Siberian Arctic (Oyogos Yar Coast, Dmitry Laptev Strait). Clim. Past Discuss. 13, 587–611. doi:10.5194/cp-13-587-2017
Opfergelt, S. (2020). The Next Generation of Climate Model Should Account for the Evolution of mineral-organic Interactions with Permafrost Thaw. Environ. Res. Lett. 15, 091003. doi:10.1088/1748-9326/ab9a6d
Parfitt, R., and Childs, C. (1988). Estimation of Forms of Fe and Al - a Review, and Analysis of Contrasting Soils by Dissolution and Mossbauer Methods. Soil Res. 26, 121–144. doi:10.1071/sr9880121
Patzner, M. S., Mueller, C. W., Malusova, M., Baur, M., Nikeleit, V., Scholten, T., et al. (2020). Iron mineral Dissolution Releases Iron and Associated Organic Carbon during Permafrost Thaw. Nat. Commun. 11, 6329. doi:10.1038/s41467-020-20102-6
Pewe, T. L., and Journaux, A. (1983). Origin and Character of Loess-like silt in Unglaciated South- central Yakutia, Siberia, USSR. US Geol. Surv. Prof. Pap. 1262, 46. doi:10.3133/pp1262
Pokrovsky, O. S., Shirokova, L. S., Manasypov, R. M., Kirpotin, S. N., Kulizhsky, S. P., Kolesnichenko, L. G., et al. (2014). Thermokarst Lakes of Western Siberia: a Complex Biogeochemical Multidisciplinary Approach. Int. J. Environ. Stud. 71, 733–748. doi:10.1080/00207233.2014.942535
Pye, K. (1995). The Nature, Origin and Accumulation of Loess. Quat. Sci. Rev. 14, 653–667. doi:10.1016/0277-3791(95)00047-X
R Core Team (2018). R: A Language and Environment for Statistical Computing. Vienna, Austria: R Foundation for Statistical ComputingURL https://www.R-project.org/.
Rauch, J. N., and Pacyna, J. M. (2009). Earth's Global Ag, Al, Cr, Cu, Fe, Ni, Pb, and Zn Cycles. Glob. Biogeochem. Cycles. 23, a. doi:10.1029/2008GB003376
Ravansari, R., Wilson, S. C., and Tighe, M. (2020). Portable X-ray Fluorescence for Environmental Assessment of Soils: Not Just a point and Shoot Method. Environ. Int. 134, 105250. doi:10.1016/j.envint.2019.105250
Rennert, T. (2019). Wet-chemical Extractions to Characterise Pedogenic Al and Fe Species - a Critical Review. Soil Res. 57, 1. doi:10.1071/SR18299
Riedel, T., Zak, D., Biester, H., and Dittmar, T. (2013). Iron Traps Terrestrially Derived Dissolved Organic Matter at Redox Interfaces. Proc. Natl. Acad. Sci. 110, 10101–10105. doi:10.1073/pnas.1221487110
Rivkina, E. M., Fedorov-Davydov, D. G., Zakharyuk, A. G., Shcherbakova, V. A., and Vishnivetskaya, T. A. (2020). Free Iron and Iron-Reducing Microorganisms in Permafrost and Permafrost-Affected Soils of Northeastern Siberia. Eurasian Soil Sci. 53, 1455–1468. doi:10.1134/S1064229320100166
Rudnick, R. L., and Gao, S. (2003). Composition of the continental Crust. Treatise Geochem. 3, 1–64. doi:10.1016/B0-08-043751-6/03016-4
Salvadó, J. A., Tesi, T., Andersson, A., Ingri, J., Dudarev, O. V., Semiletov, I. P., et al. (2015). Organic Carbon Remobilized from Thawing Permafrost Is Resequestered by Reactive Iron on the Eurasian Arctic Shelf. Geophys. Res. Lett. 42, 8122–8130. doi:10.1002/2015GL066058
Schirrmeister, L., Dietze, E., Matthes, H., Grosse, G., Strauss, J., Laboor, S., et al. (2020). The Genesis of Yedoma Ice Complex Permafrost - Grain-Size Endmember Modeling Analysis from Siberia and Alaska. E&g Quat. Sci. J. 69, 33–53. doi:10.5194/egqsj-69-33-2020
Schirrmeister, L., Froese, D., Tumskoy, V., Grosse, G., and Wetterich, S. (2013). “Yedoma: Late Pleistocene Ice-Rich Syngenetic Permafrost of Beringia,” in Encyclopedia of Quaternary Science. Editor S.A. Elias. 2nd edition (Amsterdam: Elsevier), 542–552. doi:10.1016/b978-0-444-53643-3.00106-0
Schirrmeister, L., Grosse, G., Kunitsky, V., Magens, D., Meyer, H., Dereviagin, A., et al. (2008). Periglacial Landscape Evolution and Environmental Changes of Arctic lowland Areas for the Last 60 000 Years (Western Laptev Sea Coast, Cape Mamontov Klyk). Polar Res. 27, 249–272. doi:10.1111/j.1751-8369.2008.00067.x
Schirrmeister, L., Grosse, G., Kunitsky, V. V., Fuchs, M. C., Krbetschek, M., Andreev, A. A., et al. (2010). The Mystery of Bunge Land (New Siberian Archipelago): Implications for its Formation Based on Palaeoenvironmental Records, Geomorphology, and Remote Sensing. Quat. Sci. Rev. 29, 3598–3614. doi:10.1016/j.quascirev.2009.11.017
Schirrmeister, L., Grosse, G., Kunitsky, V. V., Meyer, H., Dereviagyn, A. Y., and Kuznetsova, T. V. (2003a). Permafrost, Periglacial and Paleo-Environmental Studies on New Siberian Islands. Rep. Polar Res. 466, 195–314.
Schirrmeister, L., Grosse, G., Schwamborn, G., Andreev, A. A., Meyer, H., Kunitsky, V. V., et al. (2003b). Late Quaternary History of the Accumulation plain North of the Chekanovsky Ridge (Lena Delta, Russia): A Multidisciplinary Approach. Polar Geogr. 27, 277–319. doi:10.1080/789610225
Schirrmeister, L., Kunitsky, V., Grosse, G., Wetterich, S., Meyer, H., Schwamborn, G., et al. (2011). Sedimentary Characteristics and Origin of the Late Pleistocene Ice Complex on north-east Siberian Arctic Coastal Lowlands and Islands - A Review. Quat. Int. 241, 3–25. doi:10.1016/j.quaint.2010.04.004
Schirrmeister, L., Meyer, H., Andreev, A., Wetterich, S., Kienast, F., Bobrov, A., et al. (2016). Late Quaternary Paleoenvironmental Records from the Chatanika River valley Near Fairbanks (Alaska). Quat. Sci. Rev. 147, 259–278. doi:10.1016/j.quascirev.2016.02.009
Schirrmeister, L., Schwamborn, G., Overduin, P. P., Strauss, J., Fuchs, M. C., Grigoriev, M., et al. (2017). Yedoma Ice Complex of the Buor Khaya Peninsula (Southern Laptev Sea). Biogeosciences 14, 1261–1283. doi:10.5194/bg-14-1261-2017
Schirrmeister, L., Siegert, C., Kuznetsova, T., Kuzmina, S., Andreev, A., Kienast, F., et al. (2002). Paleoenvironmental and Paleoclimatic Records from Permafrost Deposits in the Arctic Region of Northern Siberia. Quat. Int. 89, 97–118. doi:10.1016/S1040-6182(01)00083-0
Schirrmeister, L., Wagner, D., Grigoriev, M., and Bolshiyanov, D. (2007). The Expedition LENA 2005 , Berichte zur Polar- und Meeresforschung (Reports on Polar and Marine Research), Bremerhaven, Alfred Wegener Inst. Polar Mar. Res. 550, 289. doi:10.2312/BzPM_0550_2007
Schmidt, M. W. I., Torn, M. S., Abiven, S., Dittmar, T., Guggenberger, G., Janssens, I. A., et al. (2011). Persistence of Soil Organic Matter as an Ecosystem Property. Nature 478, 49–56. doi:10.1038/nature10386
Schneider von Deimling, T., Grosse, G., Strauss, J., Schirrmeister, L., Morgenstern, A., Schaphoff, S., et al. (2015). Observation-based Modelling of Permafrost Carbon Fluxes with Accounting for Deep Carbon Deposits and Thermokarst Activity. Biogeosciences 12, 3469–3488. doi:10.5194/bg-12-3469-2015
Schuur, E. A. G., Bockheim, J., Canadell, J. G., Euskirchen, E., Field, C. B., Goryachkin, S. V., et al. (2008). Vulnerability of Permafrost Carbon to Climate Change: Implications for the Global Carbon Cycle. BioScience 58, 701–714. doi:10.1641/B580807
Schwamborn, G., Rachold, V., and Grigoriev, M. N. (2002). Late Quaternary Sedimentation History of the Lena Delta. Quat. Int. 89, 119–134. doi:10.1016/S1040-6182(01)00084-2
Schwertmann, U. (1991). Solubility and Dissolution of Iron Oxides. Plant Soil 130, 1–25. doi:10.1007/BF00011851
Siegert, C., Schirrmeister, L., and Babiy, O. (2002). The Sedimentological, Mineralogical and Geochemical Composition of Late Pleistocene Deposits from the Ice Complex on the Bykovsky peninsula, Northern Siberia. Polarforsch 70, 3–11.
Strauss, J., Laboor, S., Fedorov, A. N., Fortier, D., Froese, D., Fuchs, M., et al. (2016). Database of Ice-Rich Yedoma Permafrost (IRYP). doi:10.1594/PANGAEA.861733
Strauss, J. (2010). Late Quaternary Environmental Dynamics at the Duvanny Yar Key Section, Lower Kolyma, East Siberia. Diploma Thesis. Potsdam: Potsdam University.
Strauss, J., Schirrmeister, L., Grosse, G., Fortier, D., Hugelius, G., Knoblauch, C., et al. (2017). Deep Yedoma Permafrost: A Synthesis of Depositional Characteristics and Carbon Vulnerability. Earth-Science Rev. 172, 75–86. doi:10.1016/j.earscirev.2017.07.007
Strauss, J., Schirrmeister, L., Grosse, G., Wetterich, S., Ulrich, M., Herzschuh, U., et al. (2013). The Deep Permafrost Carbon Pool of the Yedoma Region in Siberia and Alaska. Geophys. Res. Lett. 40, 6165–6170. doi:10.1002/2013GL058088
Strauss, J., Schirrmeister, L., Wetterich, S., Borchers, A., and Davydov, S. P. (2012). Grain‐size Properties and Organic‐carbon Stock of Yedoma Ice Complex Permafrost from the Kolyma lowland, Northeastern Siberia. Glob. Biogeochem. Cycles. 26 (3). doi:10.1029/2011GB004104
Till, A. B., Dumoulin, J. A., Harris, A. G., Moore, T. E., Bleick, H. A., and Siwiec, B. R. (2008). Bedrock Geologic Map of the Southern Brooks Range, Alaska, and Accompanying Conodont Data. U.S. Geol. Surv. Open-File Rep., 88. Available at: http://pubs.usgs.gov/of/2008/1149/.
Tomirdiaro, S. V., and Chernen’kiy, O. (1987). Cryogenic Deposits of East Arctic and Sub Arctic. Russian: ANSSSR Far-East-Sci. Cent., 196.
Treat, C. C., Kleinen, T., Broothaerts, N., Dalton, A. S., Dommain, R., Douglas, T. A., et al. (2019). Widespread Global Peatland Establishment and Persistence over the Last 130,000 Y. Proc. Natl. Acad. Sci. USA. 116, 4822–4827. doi:10.1073/pnas.1813305116
Turetsky, M. R., Abbott, B. W., Jones, M. C., Anthony, K. W., Olefeldt, D., Schuur, E. A. G., et al. (2020). Carbon Release through Abrupt Permafrost Thaw. Nat. Geosci. 13, 138–143. doi:10.1038/s41561-019-0526-0
Walker, D. A., and Everett, K. R. (1991). Loess Ecosystems of Northern Alaska: Regional Gradient and Toposequence at Prudhoe Bay. Ecol. Monogr. 61, 437–464. doi:10.2307/2937050
Walter, K. M., Edwards, M. E., Grosse, G., Zimov, S. A., and Chapin, F. S. (2007). Thermokarst Lakes as a Source of Atmospheric CH4 during the Last Deglaciation. Science 318, 633–636. doi:10.1126/science.1142924
Weiss, N., Blok, D., Elberling, B., Hugelius, G., Jørgensen, C. J., Siewert, M. B., et al. (2016). Thermokarst Dynamics and Soil Organic Matter Characteristics Controlling Initial Carbon Release from Permafrost Soils in the Siberian Yedoma Region. Sediment. Geology. 340, 38–48. doi:10.1016/j.sedgeo.2015.12.004
Wetterich, S., Grosse, G., Schirrmeister, L., Andreev, A. A., Bobrov, A. A., Kienast, F., et al. (2012). Late Quaternary Environmental and Landscape Dynamics Revealed by a Pingo Sequence on the Northern Seward Peninsula, Alaska. Quat. Sci. Rev. 39, 26–44. doi:10.1016/j.quascirev.2012.01.027
Wetterich, S., Kuzmina, S., Andreev, A. A., Kienast, F., Meyer, H., Schirrmeister, L., et al. (2008). Palaeoenvironmental Dynamics Inferred from Late Quaternary Permafrost Deposits on Kurungnakh Island, Lena Delta, Northeast Siberia, Russia. Quat. Sci. Rev. 27, 1523–1540. doi:10.1016/j.quascirev.2008.04.007
Wetterich, S., Rudaya, N., Tumskoy, V., Andreev, A. A., Opel, T., Schirrmeister, L., et al. (2011a). Last Glacial Maximum Records in Permafrost of the East Siberian Arctic. Quat. Sci. Rev. 30, 3139–3151. doi:10.1016/j.quascirev.2011.07.020
Wetterich, S., Schirrmeister, L., and Kholodov, A. L. (2011b). The Joint Russian-German Expedition Beringia/Kolyma 2008 during the International Polar Year (IPY) 2007/2008. Berichte zur Polar- Meeresforschung (Reports Polar Mar. Research), Bremerhaven, Germany, Alfred-Wegener Inst. Polar Mar. Res. 636, 48. doi:10.2312/BzPM_0636_2011
Wetterich, S., Schirrmeister, L., Andreev, A. A., Pudenz, M., Plessen, B., Meyer, H., et al. (2009). Eemian and Late Glacial/Holocene Palaeoenvironmental Records from Permafrost Sequences at the Dmitry Laptev Strait (NE Siberia, Russia). Palaeogeogr. Palaeoclimatol. Palaeoecol. 279, 73–95. doi:10.1016/j.palaeo.2009.05.002
Wetterich, S., Tumskoy, V., Rudaya, N., Andreev, A. A., Opel, T., Meyer, H., et al. (2014). Ice Complex Formation in Arctic East Siberia during the MIS3 Interstadial. Quat. Sci. Rev. 84, 39–55. doi:10.1016/j.quascirev.2013.11.009
Wilson, S. A. (1997). Data Compilation for USGS Reference Material BHVO-2, Hawaian Basalt. US Geol. Surv. Open-file Rep. 2.
Windirsch, T., Grosse, G., Ulrich, M., Schirrmeister, L., Fedorov, A. N., Konstantinov, P. Y., et al. (2020). Organic Carbon Characteristics in Ice-Rich Permafrost in Alas and Yedoma Deposits, central Yakutia, Siberia. Biogeosciences 17, 3797–3814. doi:10.5194/bg-17-3797-2020
Keywords: permafrost, thaw, redox processes, carbon stabilization, arctic, subarctic
Citation: Monhonval A, Strauss J, Mauclet E, Hirst C, Bemelmans N, Grosse G, Schirrmeister L, Fuchs M and Opfergelt S (2021) Iron Redistribution Upon Thermokarst Processes in the Yedoma Domain. Front. Earth Sci. 9:703339. doi: 10.3389/feart.2021.703339
Received: 30 April 2021; Accepted: 09 July 2021;
Published: 23 July 2021.
Edited by:
Alexandra Veremeeva, Institute of Physical-Chemical and Biological Problems in Soil Science (RAS), RussiaReviewed by:
Paul Sanborn, University of Northern British Columbia, CanadaRinat Manasypov, Tomsk State University, Russia
Copyright © 2021 Monhonval, Strauss, Mauclet, Hirst, Bemelmans, Grosse, Schirrmeister, Fuchs and Opfergelt. This is an open-access article distributed under the terms of the Creative Commons Attribution License (CC BY). The use, distribution or reproduction in other forums is permitted, provided the original author(s) and the copyright owner(s) are credited and that the original publication in this journal is cited, in accordance with accepted academic practice. No use, distribution or reproduction is permitted which does not comply with these terms.
*Correspondence: Arthur Monhonval, arthur.monhonval@uclouvain.be