Spatial Distribution of Crusts in Antarctic and Greenland Snowpacks and Implications for Snow and Firn Studies
 Alexander H. Weinhart
 Sepp Kipfstuhl
 Maria Hörhold
 Olaf Eisen
 Johannes Freitag
- 1Alfred-Wegener-Institut Helmholtz-Zentrum für Polar- und Meeresforschung, Bremerhaven, Germany
- 2Universität Bremen, Fachbereich Geowissenschaften, Bremen, Germany
The occurrence of snowpack features has been used in the past to classify environmental regimes on the polar ice sheets. Among these features are thin crusts with high density, which contribute to firn stratigraphy and can have significant impact on firn ventilation as well as on remotely inferred properties like accumulation rate or surface mass balance. The importance of crusts in polar snowpack has been acknowledged, but nonetheless little is known about their large-scale distribution. From snow profiles measured by means of microfocus X-ray computer tomography we created a unique dataset showing the spatial distribution of crusts in snow on the East Antarctic Plateau as well as in northern Greenland including a measure for their local variability. With this method, we are able to find also weak and oblique crusts, to count their frequency of occurrence and to measure the high-resolution density. Crusts are local features with a small spatial extent in the range of tens of meters. From several profiles per sampling site we are able to show a decreasing number of crusts in surface snow along a traverse on the East Antarctic Plateau. Combining samples from Antarctica and Greenland with a wide range of annual accumulation rate, we find a positive correlation (R2 = 0.89) between the logarithmic accumulation rate and crusts per annual layer in surface snow. By counting crusts in two Antarctic firn cores, we can show the preservation of crusts with depth and discuss their temporal variability as well as the sensitivity to accumulation rate. In local applications we test the robustness of crusts as a seasonal proxy in comparison to chemical records like impurities or stable water isotopes. While in regions with high accumulation rates the occurrence of crusts shows signs of seasonality, in low accumulation areas dating of the snowpack should be done using a combination of volumetric and stratigraphic elements. Our data can bring new insights for the study of firn permeability, improving of remote sensing signals or the development of new proxies in snow and firn core research.
Introduction
Densification of snow to ice is one of the key processes at the surface of ice sheets and glaciers (Herron and Langway, 1980). The (local) characteristics at the interface of the atmosphere and the ice pre-condition the rates of further densification (Hörhold et al., 2011), which are of primary importance for the paleo-atmospheric archive of air bubbles as well as observations of mass balance (Zwally and Jun, 2017). Due to the rapid and significant technological progress, there are plenty of methods to derive snow properties of the polar ice sheets remotely. In contrast, field observations are still preciously scarce, albeit of their necessity to validate remote measurements of e.g. accumulation rate (Arthern et al., 2006), surface snow density (Champollion et al., 2019), grain size (Picard et al., 2012) or surface roughness (Tran et al., 2008), or for properties which cannot be obtained remotely (yet) like stratigraphic elements in the snow column.
By observing and describing the snow surface and snowpack stratigraphy, regions of different environmental regimes have been characterized, for instance, along overland traverses from the coast to the interior plateau of East Antarctica (Furukawa et al., 1992; Furukawa et al., 1996). These classifications, based on field observations, are commonly used to explain regional accumulation behavior or the influence of wind action on the snow surface. Examples for observed snow characteristics are megadunes in parts of Antarctica (Frezzotti et al., 2002) and smaller wind-induced dunes in Dronning Maud Land (DML) where a wind speed threshold of 10 ms−1 for dune formation at Kohnen Station was reported (Birnbaum et al., 2010).
Directly at the snow surface formation conditions for glazed surfaces on the West Antarctic Ice Sheet Divide (79°27.78′S, 112°7.51′W) have been monitored by Fegyveresi et al. (2018). Glazed surfaces have low porosity, can be one to several millimeters thick and form throughout the year, but according to the case study by Fegyveresi et al. (2018) primarily in summer. Glazed surfaces are reported to form after an event with high wind speed and eventually accumulation, followed by clear-sky conditions, low wind speed and higher atmospheric pressure enhancing the possibility of water vapor transport vertically upwards and the formation of subsurface hoar (Albert et al., 2004; Fegyveresi et al., 2018). They can have an extent of up to 200 km2 and are often found in leeward slopes of large-scale dunes formed by katabatic winds (Scambos et al., 2012). A very similar structural feature are smaller crusts, sometimes also referred to as windcrusts (Sommer et al., 2018a), which can be defined as very thin (<2 mm) high-density layers that form at the snow surface. In many field studies their appearance at the very surface as well as recurring features in firn and ice is reported as a side note in stratigraphy description. Monitoring of a wind-packing event in DML (Sommer et al., 2018b) and wind tunnel experiments (Sommer et al., 2018a) have indicated that snow deposition and wind (drift) in combination with exposition at the surface are necessary to form a crust. But the exact formation of both features (glazed surfaces and crusts) is still not completely clear, as the temporal development was rarely observed and methodical approaches for this intention are hardly available (Fegyveresi et al., 2018). This also applies to studies on the spatial distribution of crusts or quantitative studies of crust appearance in general. Based on this sparse knowledge, also their relevance for ice core studies is not well understood. As at the snow-atmosphere interface many physical and chemical processes take place in a complex way, especially the exchange of energy and mass, a variety of processes must interact to form a crust at the snow surface. Nevertheless, crusts have been counted and used in combination with impurities as relative dating approach in low accumulation areas and are interpreted in a very local application as a summer marker (Ren et al., 2004; Hoshina et al., 2014).
In general, dating reference horizons from volcanic eruptions in ice cores and calculating the water equivalent in a given period of time is a state of the art method to derive accumulation rates at certain positions on the ice sheets (Eisen et al., 2008). If an absolute time marker is missing, proxies like impurities or stable water isotopes can be used as relative temporal markers on a decadal, annual or even seasonal scale (Münch et al., 2016). In central Greenland, sea salt aerosols chloride and sodium (Cl− and Na+) are interpreted to reflect the winter to spring transition, while maxima in the ratio of chloride to sodium (further Cl−/Na+) are attributed to summer (Whitlow et al., 1992). Also ammonium (NH4+), nitrate (NO3−) and methanesulphonic acid (MSA) can be interpreted as a summer signal (Du et al., 2019). On the plateau of the Antarctic ice sheet, sulphate (SO42−) as well as Cl−/Na+ can be interpreted as seasonal summer to late summer signals (Weller and Wagenbach, 2007) and also NH4+, calcium (Ca2+) and Na+ have been used successfully as seasonal markers in DML ice cores for the past 2 ka (Sommer et al., 2000). At Kohnen Station (Figure 1), a link of crusts to seasonal anisotropy has been proposed (Moser et al., 2020). But so far, there has been no study backing crusts as a solid summer proxy in low accumulation areas. Especially on short (annual to seasonal) time scales the determination of an annual layer thickness from stratigraphy is problematic, as the accumulation is not evenly distributed over the year (precipitation intermittency) and the original deposited climate signal is not preserved in the snow column (Laepple et al., 2011). The exposition of snow at the surface can lead to erosion and redistribution by wind, resulting in a hiatus or overestimating a precipitation event in a time series. These postdepositional alterations also hamper the interpretation of impurities (Weller et al., 2004; Jonsell et al., 2007) or stable water isotopes (Hoshina et al., 2014) in snow, firn and ice. These processes generally occur on the surface of ice sheets, but are much more dominant in areas with low accumulation rates. The extent of these alterations of chemical impurities depends on the individual physico-chemical properties, like volatility, solubility or reactivity, with mineral dust and sea salt being less affected (e.g. Curran et al., 2002; Weller et al., 2004).
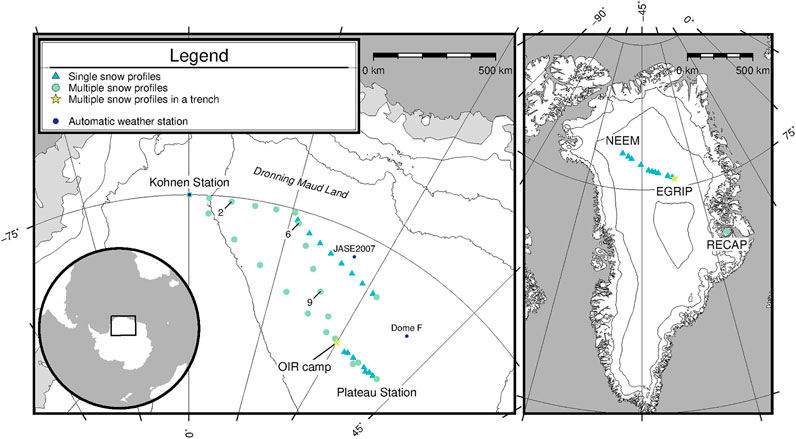
FIGURE 1. Overview map with the investigated snow profiles. Left: Map of the sampling sites along the CoFi traverse on the East Antarctic Plateau in 2016/17 and at Kohnen Station. Right: Snow profiles from various campaigns on the Greenland ice sheet. Locations of automatic weather stations in Antarctica are shown with small blue points. The numbers 2, 6, 9 and 14 (Plateau Station) indicate ion profiles presented in this manuscript.
The layering of polar firn, and therefore the stratigraphic elements therein, can also serve as a paleoclimatic record. At the same time crusts can block, or at least reduce, the exchange of gases between the atmosphere and the pore space in the firn column (Mitchell et al., 2015). In this context, the open pore structure is a main parameter controlling the permeability and gas transport in firn (Adolph and Albert, 2014). To what extent layers of low porosity, can impact the pore close-off at the firn-ice transition (Gregory et al., 2014) is still subject to research. Nevertheless, the variability of porosity has been proposed to be a significant factor for the pore close-off depth (Schaller et al., 2017).
Furthermore, crusts are also considered to affect remote sensing backscatter properties (Arthern and Wingham, 1998). The strong density gradient over very short depth intervals can influence (passive) microwave emission and (active) reflection (Wilheit, 1978). Firn volume characteristics have been proposed to be important when remotely deriving accumulation rates in DML (Arthern et al., 2006; Dierking et al., 2012), and there are observations of microwave brightness temperature linked to snowpack properties (Rotschky et al., 2006)—but still there is no conclusive physical explanation. Several approaches try to link these observations to the stratigraphy, i.e. the density layering of the snow and firn (Liang et al., 2008). Here, thin crusts could play an important role, but as they are not always reported in field observations, a systematic analysis of their impact remains open.
In this study, we present a crust dataset from snow cores (snow profiles) along a traverse route on the East Antarctic Plateau as well as from different sites on the Greenland ice sheet. In the results, we show for the first time a spatial distribution of crusts in the snowpack by means of statistical analysis on the local (tens of m) and regional (hundreds of km) scale. With this dataset, we cover an accumulation rate range from 30 kg m−2a−1–200 kg m−2 a−1 (and even single samples at 500 kg m−2a−1). Additionally, we show a crust record in two firn cores from DML, which gives insights on the temporal variability of crusts, and suggest an explanation for preservation of crusts over depth. With our dataset we contribute some evidence to ideas how crust formation on the polar ice sheets take place (Fegyveresi et al., 2018), in particular in low accumulation areas (<60 kg m−2 a−1) like on the East Antarctic Plateau. We test whether a correlation between the accumulation rate and crust concentration exists and compare our data with environmental parameters like wind speed. In a second step, we follow pilot studies (Ren et al., 2004; Hoshina et al., 2014; Moser et al., 2020) to investigate the link between crusts and chemical proxies in snow. In this context we introduce a cutting device specifically made for snow profiles. For selected samples we show the impurities NH4+, SO42- and Cl−/Na+ and combine them with our stratigraphic analysis. We discuss the deposition history of the snowpack in Greenland and Antarctica as well as the constraints of dating in low accumulation areas.
Material and Methods
Commonly (wind)crusts and glazed surfaces describe a high density layer at the snow surface, but can form through different processes. Nevertheless, in a snow profile, firn or ice core, these features simply occur as high density layers and are difficult to distinguish. Therefore we will simply use the term ‚crust’, implying that this feature could have been created by either process.
Sampling Area, Snow and Firn Profiles
In this study, we investigated 138 snow profiles from both polar ice sheets covering various environmental conditions. The majority of the profiles (108) was sampled in Antarctica in the framework of the Coldest Firn (CoFi) project at the Alfred Wegener Institute (AWI) in December 2016 and January 2017. One to four snow profiles per sampling site were taken along a traverse on the East Antarctic Plateau between Kohnen Station and former Plateau Station (further called CoFi traverse). Several profiles along a transect line (trench) were sampled at the Oldest Ice Reconnaissance camp (OIR camp; e.g. Karlsson et al., 2018). Eight samples were from Kohnen Station, taken in December 2015 (Figure 1, left).
The remaining 22 snow profiles originated from different campaigns in Greenland. Several profiles were sampled at Renland Ice Cap drilling site (RECAP; e.g. Holmes et al., 2019; Simonsen et al., 2019) in May 2015 and in a trench at the East Greenland Ice-Core Project site (EGRIP; e.g. Vallelonga et al., 2014; Du et al., 2019) in May 2016. Single samples (one profile per site) were taken on a traverse between the North Greenland Eemian Ice Drilling site (NEEM; e.g. Steen-Larsen et al., 2011; NEEM Community Members, 2013) and EGRIP in May 2015 (Figure 1, right).
The sampling sites (distinguishing between single profiles, multiple profiles and profiles in a trench) are shown in Figure 1. For the retrieval of the snow profiles the liner method was used, which was first described by Schaller et al. (2016). The used carbon fiber tubes conserve the original snow stratigraphy with negligible small compaction within the tube. The snow profiles had various lengths, covering the interval from the surface to 1 m or 2 m depth, respectively. More details on the sampling protocols in Antarctica are provided in Weinhart et al. (2020).
Additionally, we analyzed nine 2 m snow profiles along the CoFi traverse and ten 2 m snow profiles in the OIR trench to see the development of crusts with depth. For the investigation of the deeper firn, two firn cores were used in this study, both drilled on the East Antarctic Plateau (Table 1). The core B40 was drilled in season 2012/13, B54 in season 2016/17. Both have a total length of 200 m. As we focus on the firn structure, both cores were only considered from surface to 30 m depth.
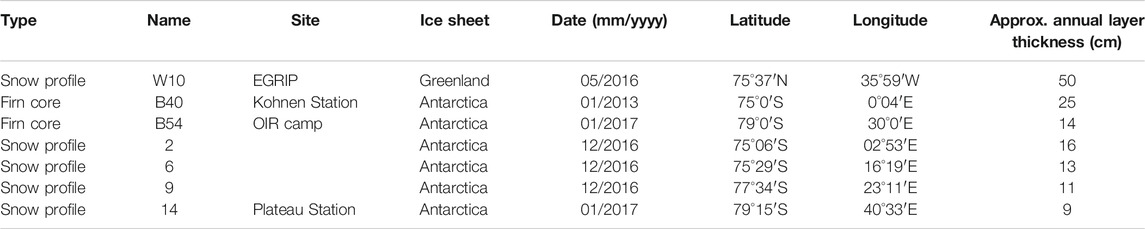
TABLE 1. Overview of investigated firn cores and snow profiles. See Figure 1 for the locations on both ice sheets.
We use data of the University of Wisconsin-Madison Automatic Weather Station (AWS) Program (JASE2007 and Dome F) as well as data from an AWS9 at Kohnen Station, which was jointly operated by the Institute for Marine and Atmospheric Research and AWI (Reijmer and van den Broeke, 2003), from the years 2016 and 2017.
Non-Destructive Analysis Using μCT
The snow profiles were analyzed by means of core-scale microfocus X-ray computer tomography (μCT) at AWI (Freitag et al., 2013). The X-ray source produces a (fan-shaped) cone beam, which is recorded by the detector after being transmitted through the sample. X-ray source and detector move simultaneously along the profile (snow, firn or ice) and record gray value images.
For a density profile of the sample, only the parts of the images parallel to the central radiographic line are processed and the gray values (representing the transmissivity of the radiation) translated into density using a calibration function and ice pieces of known geometry and density (Figure 2A). A possible application of the μCT density can be found in Schaller et al. (2016). The gray value images of the profiles contain visual information about the snow stratigraphy.
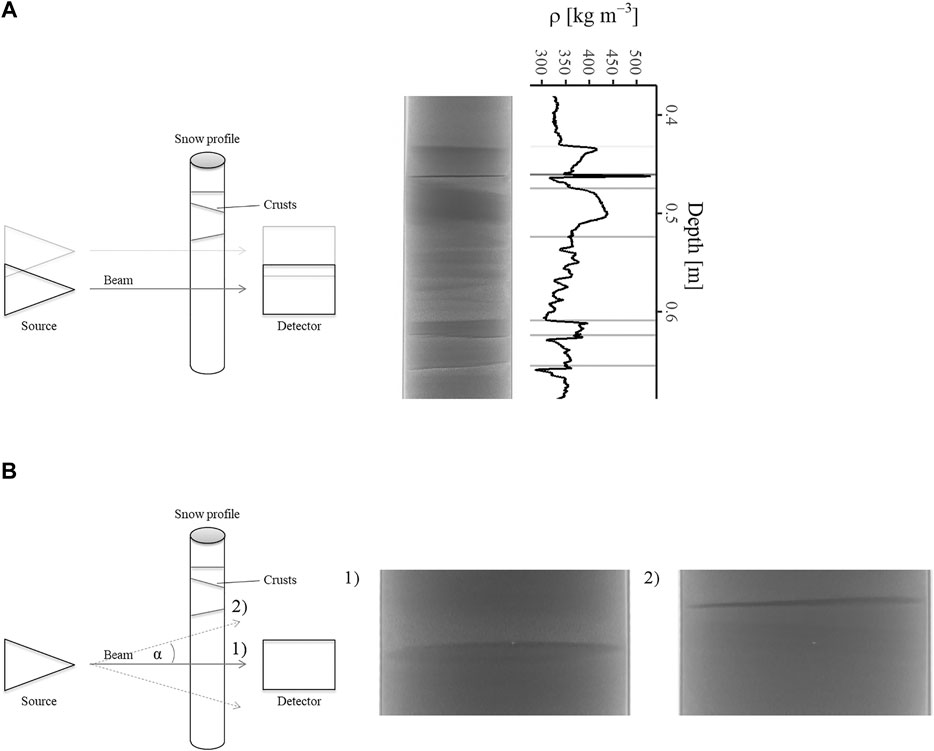
FIGURE 2. Setup of the μCT to retrieve a density profile and to detect crusts in a snow profile. (A) Using a transfer function, the gray value image is translated into a density profile, only using records along the central radiographic line (solid gray arrow pointing from the X-ray source to the detector). Here, crusts are visible, but only if they are oriented horizontally. Density peaks at crusts can be seen in the density profile next to the gray value image. (B) Using the non-processed images, we are able to look at samples with an angle (α = ±16°) to the central radiographic line (gray dotted lines). With that method, also oblique crusts like in picture 2) on the right can be detected. Angle 1) shows the crust with a horizontal view (crust being just slighty visible), while angle 2) shows the crust with oblique view (crust becomes clearly visible).
We defined crusts as thin layers with a strong gradient in the gray value in contrast to the surrounding snow (but we did not use a density threshold). In order to identify crusts, we used the non-processed μCT image sequences, which also store structural information with an angle to the horizontal central radiographic line of ±16°. With this procedure also oblique crusts could be spotted (Figure 2B), which are barely or not visible at all in the processed images. By moving along the snow profile and changing the angle of view, we detected crusts and looked for the angle of view with the highest contrast to the surrounding snow to find their orientation. From this information we calculated the position of the crusts center within the snow profile. Strong crusts can exhibit densities between 400 and 550 kg m−3 as determined in the central radiographic line (s. examples in Figure 2A). To ensure consistency in detecting the crusts, one person did the manual detection of crusts in all profiles.
Reproducibility of the Method
Counting and categorizing the visible crusts of a 1 m snow or firn section based on the gray value image took roughly 10 min. To validate the method, we also counted crusts in three profiles using 3D-volume imaging from the μCT like performed in Moser et al. (2020) (s. Figure 3 therein). In 3D mode, the profiles were investigated in 50 μm resolution. Exact surfaces of the crusts could be found and detected. The absolute difference in crust counting per profile between both methods was on average ±1.5 counts (from a total of 20–30 crusts). As we did not see a large difference and the 3D visualization is much more time consuming, the 2D method is the preferred option to count crusts when the 3D microstructure is not part of the investigation.
FIGURE 3. Sampling device for the snow profiles (A) Front part of the snow profile cutting device with trough (orange), blade with handle (metal), attachment (white synthetic material, hold in place by clamp with red handle), piston to cut the interior part of the snow profile (B) Due to the sampling method and the cohesiveness of the snow the profile remains as one piece, unless breaks or layers with high porosity occur.
Calculation of Crust Abundance
To compare the regional presence of crusts in snow, we used the number of crusts in a depth interval of 1 m as a proxy for crust abundance, further called crust concentration (cm). We also calculated the distribution of crusts over depth locally at EGRIP, Kohnen Station and the OIR camp by stacking all available profiles and show the result as a histogram.
The densification process begins below a depth of 2–3 m (Weinhart et al., 2020) and evolves differently dependent on mainly temperature and accumulation rate at the different sites (Hörhold et al., 2011). For the investigated firn cores, we calculated the crusts per kg ice (cice) by dividing cm by the density of firn (snow in the upper meter, respectively) for each meter interval to account for the differing bulk density and for a better comparability of our results from different locations.
We calculated an ‘annual layer thickness’ at each sampling site of the snow profiles using the snow density and accumulation rate (find values for the profiles that were analyzed for impurities in Table 1). For Antarctica we used a surface snow density of 355 kg m−3 (Weinhart et al., 2020) and accumulation data from Arthern et al. (2006). In Greenland we used a surface snow density of 335 kg m−3 as well as accumulation data derived from reference horizons at the sampling sites (Schaller et al., 2016). Then, we multiplied cm by the annual layer thickness [m a−1] resulting in the number of crusts per annual layer (cal) in the rate unit a−1.
Discrete Sampling and Chemical Analysis
After the μCT-measurements, selected snow profiles from the CoFi traverse in East Antarctica were cut in discrete samples of 1 cm thickness in the AWI cold laboratory at −18°C. We used a cutting device for snow profiles developed with the AWI workshop (Figure 3, left). For the sampling, the snow profile was carefully pushed out of the carbon fiber tube into the holding trough. The snow is cohesive enough to remain as whole piece in the trough (Figure 3, right). Length, position of possible breaks and noteworthy features (e.g. visible changes in grain structure, surface undulations, slivered carbon fibers) were noted. An attachment was placed at the end of the cutting device, which controls the thickness of the cut sample width. After pushing the profile forward and cutting one sample, a piston was used to cut out the inner part of the snow profile. As this part is assumed to be contamination-free, it was used for the analysis of impurities by means of ion chromatography (IC). Removing the attachment, the remaining outer part of the cut slice is stored in a separate bag for e.g. isotopic analysis (only presented for EGRIP). Then the area was cleaned with a brush for the next sample. The effective sample thickness was slightly below 1 cm as the blade cuts away a small fraction of the snow profile. This is acknowledged in the depth assignment, where the position of each sample with respect to depth is kept constant during the cutting procedure (without a consequence of a possible offset for the depth scale). The sampling was done in teams of two, in which one person was in charge for cutting and collecting the outer part of the snow profile, the other one sampled the contamination-free inner part wearing protective gloves.
Each sample was measured for major ions (Na+, NH4+, Ca2+, MSA, Cl−, SO42-, NO3−) using a Dionex® IC 2100 ion chromatograph. We compare the recognized crusts with the measured ions at selected sampling sites along the CoFi traverse in Antarctica (with decreasing temperature and accumulation rate) and in one profile at EGRIP, Greenland. The profiles in Antarctica are named profile 2, 6, 9 and 14, the profile at EGRIP is called W10 (Table 1). As we focus on the seasonality aspect in this study, we only present the ionic species NH4+, SO42- as well as Cl−/Na+ in the following. For the profile W10 we also show stable water isotopes, which were measured by Ring Down Spectroscopy following the protocol by van Geldern and Barth (2012) with a precision of <0.1‰ for δ18O.
Results
Most crusts are in the thickness range of 0.5–1 mm. The thickest crusts can be up to 2 mm thick, which is rather an exception. We do not find a trend or striking differences in crust thickness at the different sampling sites, i.e. the crust thickness is not higher at warmer sites with higher accumulation rate. We can report a high potential for depth hoar layers just below the crusts (s. Stratification of the Snow Column Through Crusts Section).
Spatial Distribution of Crusts
On the DML Plateau, East Antarctica
Within the samples from Antarctica, we find the maximum cm (23.5 m−1) from the surface to 1 m depth close to Kohnen Station. Along the CoFi traverse cm decreases and has its minimum on the plateau between OIR camp and Plateau Station, where we count an average cm of 9 m−1 (Figure 4). The mean standard deviation at sampling sites with four profiles along the traverse is 3.8 m−1. We record the maximum standard deviation at OIR camp with 7.5 m−1.
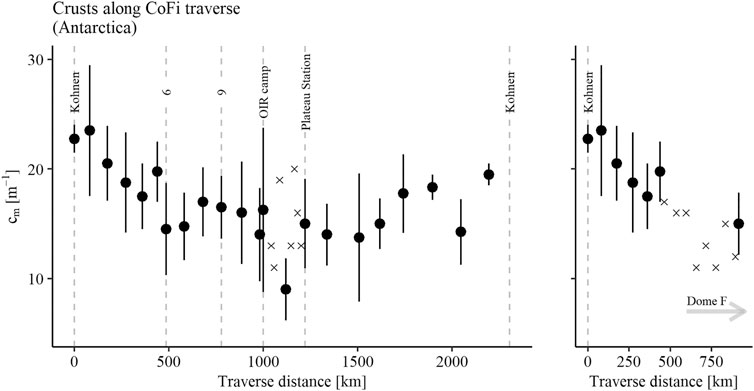
FIGURE 4. Crust concentration in the uppermost meter along the CoFi traverse route. Solid dots represent the average cm per site with multiple profiles, small crosses show locations with only one snow profile. Error bars in solid vertical lines show the standard deviation from multiple profiles at one sampling site.
On the Greenland Plateau
In Greenland, the highest cm is found at NEEM (28 m−1) and close to NEEM (33 m−1) (Figure 5). As we only have one snow profile per site along the traverse, the statistics are not as solid as for the CoFi traverse in Antarctica. The average cm in the depth range 0–1 m along the whole traverse amounts to 23.3 m−1. This fits well with cm of 23.5 m−1 at EGRIP from eight samples. At EGRIP, we calculated a standard deviation of 3.9 m−1, at RECAP of 2.9 m−1 (four samples).
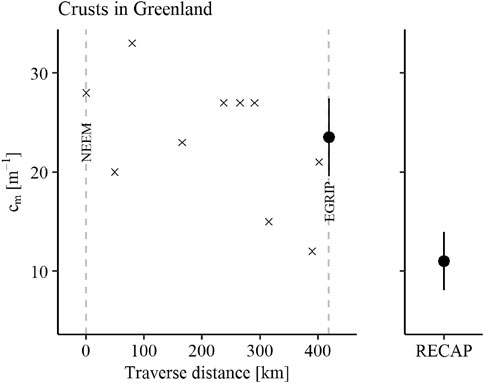
FIGURE 5. Crust concentration in snow profiles from the NEEM to EGRIP traverse. We used the same symbols as in Figure 4.
Crusts vs. Accumulation Rate
We show cm (Figure 6A) and cal (Figure 6B) plotted against the logarithmic accumulation rate. We see a steady increase in cal with increasing accumulation rate. A linear fit between the logarithmic accumulation rate and cal results in a coefficient of determination (R2) of 0.89 (plotted in Figure 6B). Note that this spatial correlation applies to the total dataset, i.e. from Greenland and Antarctica.
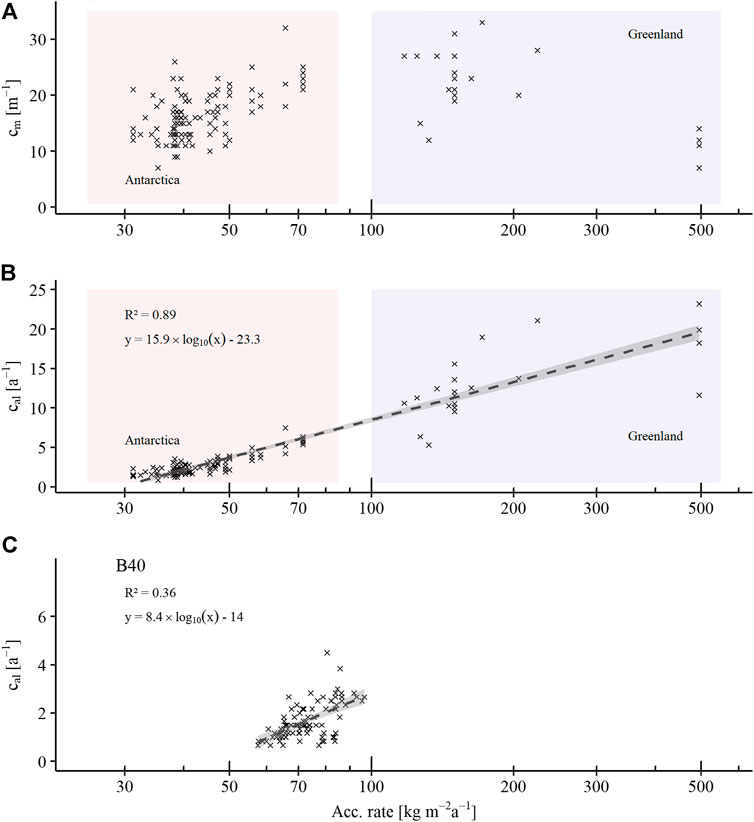
FIGURE 6. (A) and (B): Spatial crust statistics for Antarctica and Greenland. We used the crust information in snow of the top meter at all sampling sites. In (A) the crust concentration, in (B) the crust concentration per annual layer is plotted against the accumulation rate (logarithmic scale) at each sampling position. With increasing accumulation rate, also the number of crusts per year increases (C): Five-year running mean of crust concentration per annual layer, also plotted against the accumulation rate (logarithmic scale), in firn core B40 (up to 15 m depth) over the last 100 years at Kohnen Station. It shows the temporal evolution of crusts with changing accumulation rate, possibly affected/biased by the destruction of crusts through metamorphism with depth (and time).
For an estimation of the temporal sensitivity of crusts to accumulation rate, we calculated cal in B40 up to 15 m depth using a five-year running mean for both, crusts and accumulation rate, as the latter is subject to large interannual variability (in some cases roughly a factor of two in consecutive years–note that this is an artifact of a single point measurement and not necessarily representative for a larger area). The regression analysis on the temporal scale also results in a positive correlation, but with a much lower R2 (0.36) then on the spatial scale (Figure 6C). A potential bias of the slope is discussed in Crust concentration in relation to accumulation rate Section. We consider the temporal resolution of the accumulation rate in B54 and thus cal as not precise enough to perform a regression analysis here as well.
Vertical Record of Crusts in East Antarctic Firn
We see a decrease in cm from 0 to 2 m depth. The relative decrease seems to be higher at sites with a higher cm in the first meter. At Kohnen Station, from the first to the second meter in depth there is a reduction in cm of 27% (average of eight samples), at OIR camp of 25% (ten samples). But single samples along the traverse also show a reduction of over 50%.
The maximum lateral extent of crusts can be followed in the OIR trench, where it ranges between 10 and 15 m, typical dimensions of the snow patches perpendicular to the mean wind direction. In addition, the depth position of crusts is rarely consistent among nearby sampling sites on the East Antarctic Plateau. This can be explained by the high surface roughness relative to the annual accumulation rate as dune heights can exceed two or three times the annual layer thickness (Weinhart et al., 2020).
cm in the firn cores at Kohnen Station and the OIR camp agrees well with cm in snow profiles in the vicinity of the firn cores. In core B40 we count 21 crusts in the first meter and 18 in the second meter, whereas in core B54 we only find eight and seven crusts in the first and second meter, respectively. In both cores, cice decreases steadily but does not fall below 10 kg−1 (Figures 7A,B).
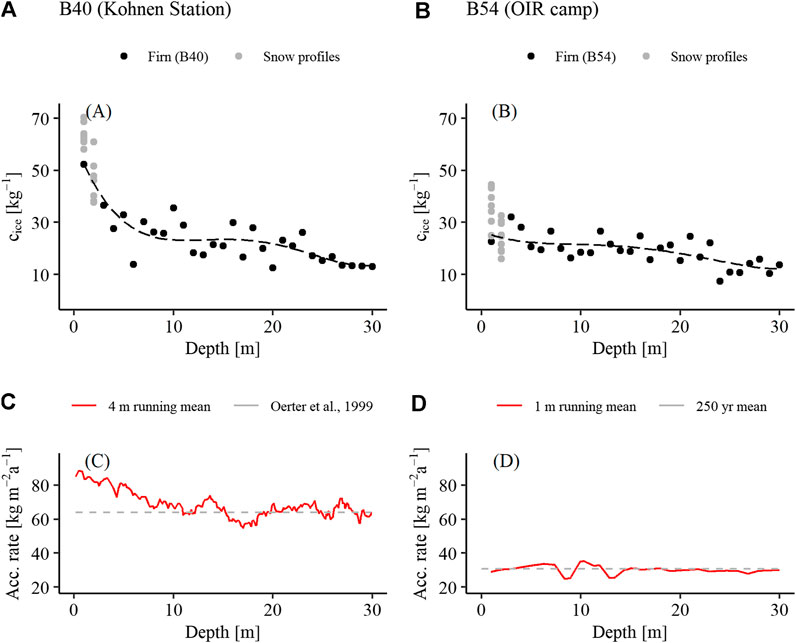
FIGURE 7. Crust concentration per meter water equivalent (calculated meter by meter) in cores B40 (A) and B54 (B). The bottom end of each 1 m segment is shown on the x-axis. The smoothed dashed curve is a polynomial fit of grade 4. We also show the accumulation rate of (C) B40 according to Medley et al. (2018) as well as the long-term mean (Oerter et al., 1999) and of (D) B54 (preliminary results).
Local Vertical Crust Distribution
We also find profiles where multiple crusts form on top of each other, also oblique to each other with only few millimeters between them. The question arises, whether a preference for the crusts to form in a distinct period of time is visible in several profiles from the same location. This could then indicate the annual layering on a local scale. At EGRIP in a stack of several profiles the crust distribution over depth agrees with the annual layer thickness (Table 1; Figure 8A). At Kohnen Station five local maxima in the crust count can be seen, which is consistent with the local accumulation rate (Figure 8B). At the OIR camp, the histogram is not as clear. The higher the surface roughness and the lower the accumulation rate, the more difficult is the recognition of a lateral consistency of crusts. For the smaller bin width (2.5 cm), we count eight local maxima, which could be congruent with the local accumulation rate or the number of deposition events (Figure 8C).
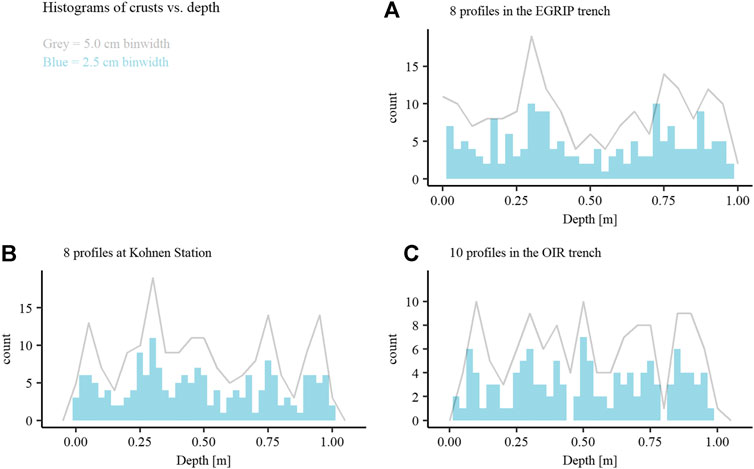
FIGURE 8. Histograms of crusts over depth using multiple snow profiles (A) at EGRIP (B) at Kohnen Station and (C) at OIR camp. The blue bars are the results of using a bin width of 2.5 cm, the gray line using a bin width of 5 cm.
Impurities in Snow Profiles From Antarctica and Greenland
The corresponding impurity profiles to the results presented in this section are shown in Figure 9 and Figure 10 in Case study at EGRIP (Greenland) and Case study in DML (Antarctica) Sections.
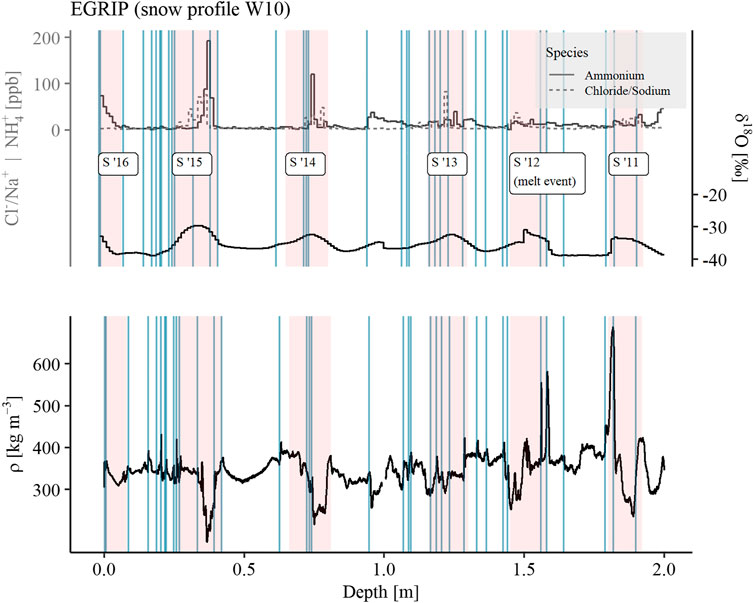
FIGURE 9. Snow profile from the trench at EGRIP (W10), sampled in May 2016. Five clear annual cycles are visible in Cl−/Na+ (dotted gray) and NH4+ (solid gray). Crusts are indicated with blue vertical lines. Interpreted summer signals are marked with a red shade, the corresponding year of summer (S’yy) is annotated in the top panel. Below 1.4 m depth the profile is influenced by surface melting (2012) and percolating melt water (e.g. Nghiem et al., 2012).
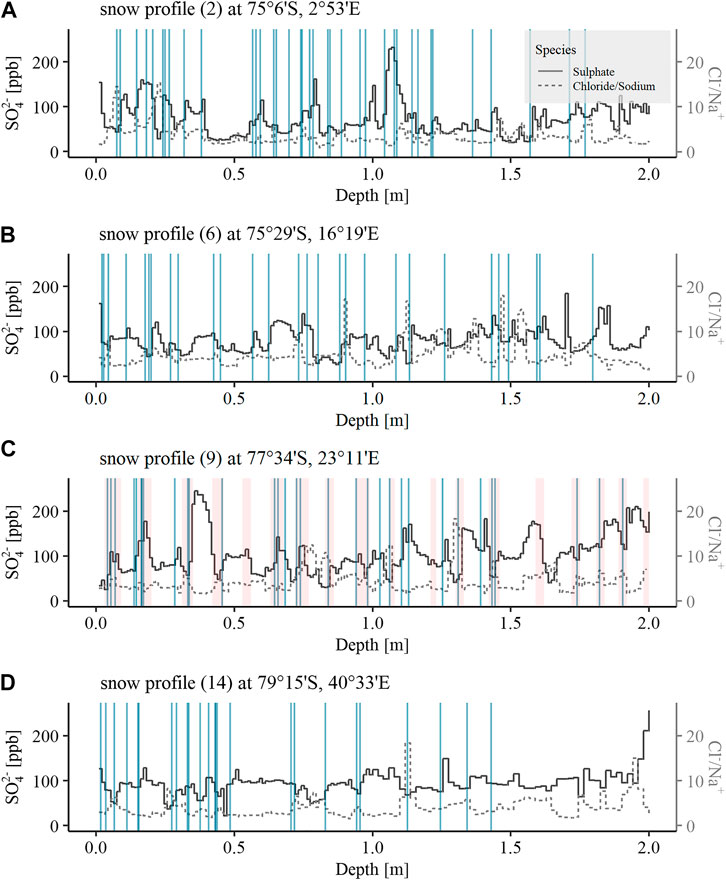
FIGURE 10. Four exemplary profiles of SO42− (black line), Cl−/Na+ (gray dotted line) and crusts (blue vertical lines). All ion profiles have a 1 cm resolution. A possible dating version of profile 9 shows summer intervals in shaded red vertical bars. Corresponding locations can be found in Figure 1.
In Antarctica, Cl−/Na+ increases from profile 2 close to Kohnen Station (mean: 3.6, max. peak: 15.3) toward the interior Plateau. In profile 14 at Plateau Station, the mean is 4.0 and the maximum peak at 21.4. The peak of Cl−/Na+ in Greenland can reach values up to 82.3, the mean of the profile is 7.7. The mean SO42− concentration is a bit lower in Greenland (W10: 90.8 ppb) than for the interior part of the East Antarctic Plateau (profile 2: 72.3 ppb; profile 6: 79.7 ppb; profile 9: 104.1 ppb; profile 14: 101.6 ppb).
We do not find seasonal cycles in impurities measured in the Antarctic profiles. While a seasonal signal in density (not shown) is not pronounced at low-accumulation sites (Landais et al., 2006; Laepple et al., 2016), we see rather some profiles (or parts of profiles), in which we recognize a strong coincidence of crusts, SO42− and Cl−/Na+ peaks, in some profiles the ions and crusts seem to have just an arbitrary connection (Figure 10). In profile 9 most of the crusts are located directly at the Cl−/Na+ peaks and (temporally) after the SO42- peaks.
In contrast to the Antarctic profiles, in the profile at EGRIP seasonal cycles in several ionic species are much easier and clearer to detect. As NH4+ seems to exhibit a clearer seasonality than sulphurous species like SO42- (Du et al., 2019), for the dating of the profile we rather use NH4+ and Cl−/Na+. The seasonal cycle in Cl−/Na+ corresponds well with the accumulation rate. NH4+ peaks set in a bit earlier but do not show a high amplitude like Cl−/Na+. For this profile, we also show δ18O as well as the high resolution μCT density (ρ) (Schaller et al., 2016). Both, local maxima in δ18O and minima in density, indicate summer seasons in Greenland as well. The crusts partly seem to cluster at the (temporal) end of the Cl−/Na+ peaks (Figure 9).
Discussion
Spatial and Temporal Variability of Crusts and Validity of the Method
On the interior plateau cm agrees well with data from snow pits in the vicinity of Dome Fuji (Sugiyama et al., 2012; Hoshina et al., 2014). But the number of crusts can vary a lot in space, especially on small scales (in the order of tens of meters), which is visible in the standard deviation at single sampling sites in Figure 4. This shows, that crusts are a rather local feature and several samples are needed to obtain a representative value. The high small-scale variability seems to be related to the dimension of snow patches and dune structures at the snow surface (Birnbaum et al., 2010). Sugiyama et al. (2012) reported a lower cm at Kohnen Station than we find in this study. We consider this offset to originate from the different methods and the higher potential of crust clusters (two or more crusts within 1 cm) at Kohnen Station than along the traverse. But also the temporal variability in cm can be a possible explanation.
In general, our method shows numbers of crusts in the same order of magnitude as other sparse published field observations so far. A big advantage we see in our method to derive crusts in comparison to observations in the field, is the detection of crust clusters and weak crusts, which can be easily overlooked in the field. In addition, the distinct density of the crusts itself and the surrounding snow (s. Stratification of the snow column through crusts Section) can be an important point for the classification of polar snowpacks.
On Crust Formation and Potential Implications for Snow and Firn Studies
Crusts in cold dry snow, which are not the result of melting processes, occur in the wide temperature range between 0°C and −60°C. Our crust count from various sampling sites in Greenland and Antarctica suggests that, surprisingly, at warm sites the crusts do not seem to grow thicker than at cold sites. This is different to our experience from granular materials with a high vapor pressure. Since crusts in polar snow form over a wide diversity of environmental conditions (temperature, wind, sunshine duration, relative and absolute humidity, etc.) it is difficult to give more than general assumptions for crust formation.
In areas of low accumulation (here: <60 kg m−2 a−1) the snow surface must be considered dynamic and exposed to the atmosphere for up to or even more than one year. Snow dunes with heights of 20–30 cm may well be exposed for more than one year.
Crust Concentration in Relation to Accumulation Rate
With decreasing accumulation rate and therefore more years covered in 1 m snow, one would intuitively expect cm to increase toward the East Antarctic Plateau. Surprisingly, we observe the opposite trend. The number of crusts decreases with decreasing accumulation rate (Anschütz et al., 2011) and temperature along the CoFi traverse (Figure 4). Comparing our results to the temperature and accumulation rate at each site, we find a similar trend for both parameters to cm. In contrast, the surface snow density (surface to 1 m depth, Weinhart et al., 2020) is not influenced by cm, as there is no correlation between both parameters. The crusts are too thin to make a significant impact on the surface snow density.
From a dating perspective, a rather important measure is the number of crusts that form per year. A relationship between surface features and accumulation rate has been proposed by Craven and Allison (1998), as higher accumulation rates lower the time of exposition of upper layers to surface conditions. On average, at least one crust per year forms on the interior plateau of East Antarctica due to the limited formation conditions (Figure 6). On the one hand, the annual accumulation rate can be a factor for the preservation of crusts over time. On the other hand, we conclude that the formation of crusts is also directly related to the number of deposition events per year. We also observe a non-linear behavior toward lower accumulation rates. In areas with higher accumulation rate (especially in the investigated areas in Greenland), there are more periods and conditions present, which favor crust formation.
A reduction of cm (and cal) on the plateau can generally also come from a higher destruction rate of crusts after formation. This objection has also been raised by Fegyveresi et al. (2018) and might in particular be relevant for areas with low accumulation rate and very mobile snow grains at the surface. Interestingly, as is could not confirm a correlation of crust hardness and duration of exposition at the snow surface, which causes phase transformations and sublimation-condensation cycles in the uppermost snow layer. We also did not find crusts with higher density on the interior East Antarctic Plateau. A possible explanation might be the higher mobility or the higher potential for destruction of crusts, but the formation conditions of crusts can be rather diverse.
We assume that only strong crusts survive the further firn metamorphism as both cores B40 and B54 show a similar decrease in cice from a depth of 5 m on (Figure 7). Unfortunately, we are not able to separate the temporal variability from thinning of crusts with time due to firn metamorphism. This finding would have been in particular interesting at Kohnen Station, whether the increase in accumulation rate over the last decades (Medley et al., 2018) caused an increase in cice, or the drop of cice in the first meters is only due to destruction because of firn metamorphism (Figures 7A,C).
Both regression analyses of cal with the logarithmic accumulation rate on the spatial and temporal scale result in a positive correlation (compare Figures 6B,C). We explain the offset between the temporal and spatial regression with the destruction of crusts with depth. The cause for the lower slope in B40 in contrast to the spatial overview is not completely clear. We observe an increase in accumulation rate in the upper 10 m which is also the depth interval in which we would expect the strongest crust destruction by firn metamorphism. This would theoretically lead to a higher slope, which is not the case for B40. Nevertheless, the correlation on the spatial and temporal scale proves a high sensitivity of crusts to accumulation rate. For future studies we suggest to investigate further firn and ice cores with an additional focus on the depth interval below 10 m (due to high crust destruction) in order to better separate the effect of accumulation rate from firn metamorphism.
At the moment, we assume that there are no regional differences how crusts vanish with depth and that the variability in crust strength is not stronger than the temporal variability, but cal can still be determined precisely in firn and ice cores. In the EPICA ice core at Kohnen Station (EPICA Community Members, 2006), single crusts are even visible down to the ice clathrate transition zone. If this relationship between cal and the accumulation rate can be proven in the future, taking the densification rate into account crusts can be used as proxy for accumulation rate variability in firn and ice cores.
Discussion of Wind Speed and Snow Mobility as Important Parameters for Crust Formation
While drifting snow seems to be an important factor for wind packing and crust formation as they are also grain size and their mobility might play a role in that context. Picard et al. (2012) reported an increased grain index in summer around Kohnen Station, which decreases toward the sampling sites on the interior plateau. Larger grains with lower mobility might be in favor for crust formation. Smaller grains, which form in particular at low temperatures (Endo and Fujiwara, 1973) like on the interior East Antarctic Plateau, are prone to wind erosion and redistribution. But more important could be the coordination number and the potential of particles to sinter together. Sintered grains remain at the snow surface while weakly bonded particles get blown away. The mobility and grain size distribution might not be optimal for crust formation on the interior plateau as the uppermost layer of the snowpack has the tendency to be eroded or redistributed completely and has no chance to build a crust.
While we discuss temperature (gradients) later in the text (Stratification of the Snow Column Through Crusts Section), we also compare the wind speed distribution over the last two years of the three mentioned AWS (Figure 1) with our crust record. Large scale weather events are visible at all three locations, but especially the wind speed maxima are significantly different. We find, that the abundance of events with wind speed exceeding 10 m s−1 is considerably higher at Kohnen Station than at JASE2007. At Dome Fuji, there are barely more than four events per year above that threshold. As we cannot date the formation of the crusts to link them to the wind events and the high wind speeds are recorded all over the year, we cannot conclude a direct dependence between crusts and events with high wind speed. Nevertheless, the abundance of events with high wind speeds fits with the general trend of cal along the CoFi traverse. To classify them unequivocal as marker for event-based accumulation or seasonality, additional observations of the snow surface coupled with weather data (in particular precipitation and wind speed) are necessary. To avoid crust destruction, the wind speeds should not exceed a level, at which erosion of the whole surface layer takes place. In this context, the wind speed thresholds might vary for different areas dependent on the environmental conditions and grain mobility. Wind scour areas, which are spread over the Antarctic continent and are characterized by high wind erosion (Das et al., 2013), might additionally hamper or prevent the formation of crusts.
Stratification of the Snow Column Through Crusts
From the local histograms in Figure 8 we conclude that at least a slight preference for crust formation in a specific time frame (fitting environmental conditions) seems to be likely. As a consequence of that distribution, crusts can indicate some sort of seasonal layering for a local application, but a sufficient amount of samples (we suggest at least six) is necessary. In low accumulation areas, the stacked signal does not show an unequivocal result due to the high amount of stratigraphic noise (Fisher et al., 1985).
Despite the direct effect of stratification, crusts can also have an indirect effect, altering the (surrounding) snowpack after crust formation. Vertical temperature gradients can enhance mass transport upwards during clear sky weather conditions with lower air temperatures than snow temperatures (Fegyveresi et al., 2018). This mass transport from the snow layer (or layers, dependent on the thickness and permeability) can create layers of low density and high porosity below crusts with increased grain size. This was also observed in radar profiles in West Antarctica (Arcone et al., 2004). The crust on top in turn absorbs the transported mass and increases in density and decreases in porosity. Similar effects are observed at the formation of firnspiegel (Schlatter, 1984).
But also the opposing effect of hard depth hoar is possible, dependent on the original snow type and density. An additional exposure to a temperature gradient of 20°C m−1 or higher was observed to produce a hard and cohesive snow layer (Pfeffer and Mrugala, 2002), while high temperature gradients can lead to a preferred crystal growth in vertical direction (Calonne et al., 2017).
Over half of the layers (56%) between 0.2 cm and 3 cm below crusts in our samples from Antarctica have a lower density than the average 1 m density of the snow profiles. This is a higher percentage as we report for Greenland (43%), where the mean surface snow density is generally lower and a seasonal cycle in density (Figure 9) may be stronger than the postdepositional formation of low porosity layers. The formation of (low density) depth hoar seems to be more likely on the East Antarctic Plateau than on the Greenlandic plateau [but has also been observed there, see Alley et al. (1990)]. Also the relative contribution of crust formation to density variations within the snowpack is potentially larger on the East Antarctic Plateau than on the Greenlandic Plateau. In both ways, crusts can influence the stratigraphy significantly even after their formation. We see our results as a good starting point for snowpack models that can capture these processes.
These findings can have impact on remote sensing techniques as both, passive and active remote sensing methods reveal a sensitivity to accumulation rate (e.g. Winebrenner et al., 2001; Flach et al., 2005; Arthern et al., 2006; Dierking et al., 2012). The reason for this relationship is assumed in the density layering of firn (Liang et al., 2008) as the density stratification affects the polarization of the horizontally polarized microwave radiation (Winebrenner et al., 2001; Macelloni et al., 2007). Even more, a few millimeters thin and high-density crusts can influence the polarization considerably as the density gradients at layer boundaries can be huge (Winebrenner et al., 2001; Arthern et al., 2006). For example, Surdyk (2002) interpreted local differences in measured brightness temperatures with the appearance of windcrusts. However, the effect will be limited by the considered wavelength of the sensor, as at lower frequencies the influence of the surface meter(s) are small (Macelloni et al., 2007). It is beyond the scope of this study to go into the physical explanation and the possible effect of crusts on the microwave signal. Nevertheless, we see potential for further studies on this topic based on our records.
The Potential of Crusts as Dating Proxy
We tested a correlation between ion peaks (SO42−, Cl−/Na+) and crusts, which has also been done by Moser et al. (2020). Nevertheless, crusts only make a small amount of the 1 cm thick samples and a direct conclusion between the ion concentration of the sample and the crust cannot be made. A potential solution based on sampling and measuring the crust only is technically very difficult. While the detection of crusts with the μCT is fairly precise, spotting the crusts by eye working in the field or in the ice lab is not very straightforward. While cutting the crust still might work technically, the volume is not sufficient for an IC measurement.
For a better understanding of the discussion of crusts as a climatic or temporal proxy, we show the annual layer thicknesses for the profiles presented in Figures 9 and 10 in Table 1. At this point we want to mention, that crusts are interpreted as markers for a specific point (or interval) in time. This structural information is in principle independent from an impurity or stable water isotope signal in deposited snow. Still, both structural and chemical components can of course indicate the same point in time (season or year).
Case Study at EGRIP (Greenland)
Interpreting Cl−/Na+ and NH4+ as a clear summer signal and assuming that accumulation is to some extent evenly distributed, then in Greenland the majority of the crusts seems to form in late summer or autumn. A formation in spring seems less likely. Weather conditions or lack of exposition time at the snow surface might be reasons why less crusts form in that period. In general we conclude that crusts in Greenland have the potential to indicate seasonal transitions, i.e. could be used as an annual marker, but should remain second priority for dating. In between single deposition events there seems to be enough time for a crust to form. Whether crusts can be used as an annual marker for firn core records from other regions in Greenland and in future studies in general, requires the investigation of additional data.
Case Study in DML (Antarctica)
Snow profiles at Kohnen Station indicate the presence of a seasonal cycles in some impurities there (Göktas et al., 2002; Weller and Wagenbach, 2007; Moser et al., 2020), but going further inland (increasing distance to the coast and decreasing accumulation rate), this seasonal signal vanishes. In profile 9 the clarity of the ion peaks is good and also the correlation between ions and crusts is fine, therefore we tried to assign summer periods there (Figure 10C, red shaded areas). We interpret a combination of at least two proxies (SO42−, Cl−/Na+ or crust) as summer marker and find 16-18 summer periods from surface to 2 m depth, which is reasonable comparing it to the approximate annual layer thickness (Table 1). In contrast in profile 2 (Figure 10A), which is close to Kohnen Station and the accumulation rate can be derived with lower uncertainty, it is hard to assign four to five clear peaks per meter. In profile 14 (Figure 10D), the SO42− signal shows rather a constant value over 2 m depth instead of clear peaks and we cannot assign summer or winter periods to specific layers. This profile in turn is an excellent example for dating problems of chemical signals (stable water isotopes, impurities) in low accumulation areas as well. Structural elements in the snow column (density, anisotropy, crusts) have the potential for an additional annual marker when chemical signals fail to show a clear seasonality. They are not biased by the physico-chemical exchange reactions between snow and atmosphere like diffusion, sublimation or volatilization. But, of course, they are also subject to erosion and probably sensitive to specific weather conditions. We assume that the potential for crust destruction is higher for a lower annual accumulation rate. For a reliable dating application in low accumulation areas we suggest a combination of several parameters derived from a sufficiently large amount of samples.
Conclusion
In this study, we presented for the first time a crust record derived from radioscopic scan images using X-rays. With this method, we can detect weak crusts as well as crust clusters and also the density of horizontal crusts and the surrounding layers can be determined. We investigated samples from the East Antarctic Plateau and the Greenland interior. Although the lateral extent of crusts is limited to few meters and the small-scale variability is high, in Antarctica we find a clear trend of decreasing cm (crusts per meter) going from Kohnen Station (75.00°S, 0.06°E) to the interior Antarctic Plateau (79.24°S, 40.33°E). Looking at samples from both ice sheets and taking the annual layer thickness into account, cal (crusts per annual layer) decreases constantly from high to low accumulation rate areas. A linear relationship between cal and the logarithmic accumulation rate seems likely on the spatial scale, as well as on the temporal scale as shown for firn core B40. We recommend further studies to test this positive correlation, especially to decouple the crust destruction with increasing depth from an accumulation rate (or climate) driven temporal variability of crusts. This crust abundance (and variability) might play a role for firn ventilation and pore close-off at the firn-ice transition, especially in the diffusive zone (Birner et al., 2018).
Assessing the formation theory for glazed surfaces by Fegyveresi et al. (2018) and observations by Sommer et al. (2018b) in combination with our data, we conclude that the most important factor for crust formation is time with absence of persistent snow deposition. Due to the reduced metamorphism under cold temperatures, on the interior Antarctic plateau the surface snow is rather soft and remains mobile even under moderate winds. It prevents longer residence times at the surface and therefore crust formation. In addition, less annual accumulation reduces the seasonal supply of snow leading to a further reduction of formed crusts. It is shown that crusts on the East Antarctic plateau are more frequently associated with porous layers below them than at the investigated sites in Greenland. We conclude that the contribution of crusts to the overall stratigraphy of the snowpack is therefore stronger on the East Antarctic plateau.
Future studies could deal with a microstructure analysis of crusts (e.g. grain size distribution), the thickness of depth hoar layers in consequence of temperature and vapor pressure gradients and the mass loss within these layers and the mass gain at crusts. Our crust record can serve as a physically constrained dataset on which radiation of scattering modeling can build, both, subscribing vertical distribution as well as horizontal variations. The observations in this study indicate that crusts might have a direct (stratification through crusts) as well as an indirect effect (stratification through low porosity layers below crusts), but this topic needs further investigation.
The distribution of crusts over depth from several samples and the combination of crusts with chemical data at EGRIP, where seasonal signals of impurities are clearly visible, have shown that structural elements can be used for dating on a seasonal scale, although several samples are necessary for a reliable result. If the accumulation rate is completely unknown, it is difficult to identify the annual layer thickness in low accumulation areas just based on a crust record. A multitude of different mechanisms interact for crust formation, the general formation mechanism is not limited to one specific season only and a correlation to ions cannot be seen in all investigated profiles. But stable water isotopes and some impurities face postdepositional, physico-chemical alterations in their concentration at the snow-atmosphere interphase (i.e. diffusion, sublimation, chemical reactions) and redistribution by wind (i.e. change of the stratigraphic order). Crusts, which form at the snow surface and are advected downwards by snow accumulation unless they are eroded, can be seen as a rather immobile proxy and can support dating approaches with other proxies.
Data Availability Statement
The crust dataset of this study and another dataset containing the impurity data are available from the open-access repository PANGAEA at https://www.pangaea.de/.
Author Contributions
The CoFi project was initialized by SK and JF. AW sampled the snow profiles along the CoFi traverse and the OIR trench, analysed the profiles and created the dataset. AW prepared the manuscript and discussed the first results with JF and SK. MH supervised the chemical measurements, OE improved the statistical analysis. All authors contributed to revising the manuscript.
Funding
AW is funded by the German environmental foundation (Deutsche Bundesstiftung Umwelt). SK has received support from the Villum Investigator Project IceFlow (no. 16572).
Conflict of Interest
The authors declare that the research was conducted in the absence of any commercial or financial relationships that could be construed as a potential conflict of interest.
Acknowledgments
We are grateful to the AWI logistic team for their support during the field work and to the AWI workshop for the production of the snow cutting device. We thank Birthe Twarloh for the conduct of IC measurements. Accumulation rate of core B54 has been calculated from continuous flow measurements at Desert Research Institute lead by Joe Mcconnell. A part of the Greenland samples were obtained in the framework of the EGRIP—directed and organized by the Center for Ice and Climate at the Niels Bohr Institute, University of Copenhagen. It is supported by funding agencies and institutions in Denmark (A. P. Møller Foundation, University of Copenhagen), USA (US National Science Foundation, Office of Polar Programs), Germany (Alfred Wegener Institute, Helmholtz Centre for Polar and Marine Research), Japan (National Institute of Polar Research and Arctic Challenge for Sustainability), Norway (University of Bergen and Bergen Research Foundation), Switzerland (Swiss National Science Foundation), France (French Polar Institute Paul-Emile Victor, Institute for Geosciences and Environmental research) and China (Chinese Academy of Sciences and Beijing Normal University). The authors used available datasets of the Automatic Weather Station Program (NSF grants number ARC-0713843, ANT-0944018 and ANT-1141908).
References
Adolph, A. C., and Albert, M. R. (2014). Gas diffusivity and permeability through the firn column at Summit, Greenland: measurements and comparison to microstructural properties. The Cryosphere 8, 319–328. doi:10.5194/tc-8-319-2014
Albert, M., Shuman, C., Courville, Z., Bauer, R., Fahnestock, M., and Scambos, T. (2004). Extreme firn metamorphism: impact of decades of vapor transport on near-surface firn at a low-accumulation glazed site on the East Antarctic plateau. Ann. Glaciol. 39, 73–78. doi:10.3189/172756404781814041
Alley, R. B., Saltzman, E. S., Cuffey, K. M., and Fitzpatrick, J. J. (1990). Summertime formation of depth hoar in central Greenland. Geophys. Res. Lett. 17, 2393–2396. doi:10.1029/gl017i013p02393
Anschütz, H., Sinisalo, A., Isaksson, E., Mcconnell, J. R., Hamran, S. E., Bisiaux, M. M., et al. (2011). Variation of accumulation rates over the last eight centuries on the East Antarctic Plateau derived from volcanic signals in ice cores. J. Geophys. Research-Atmospheres 116, 12. doi:10.1029/2011jd015753
Arcone, S. A., Spikes, V. B., Hamilton, G. S., and Mayewski, P. A. (2004). “Stratigraphic continuity in 400 MHz short-pulse radar profiles of firn in West Antarctica,” in Annals of glaciology. Editor J. Jacka (Cambridge: Int Glaciological Soc)), 39, 195–200.
Arthern, R. J., Winebrenner, D. P., and Vaughan, D. G. (2006). Antarctic snow accumulation mapped using polarization of 4.3-cm wavelength microwave emission. J. Geophys. Research-Atmospheres 111, 10. doi:10.1029/2004jd005667
Arthern, R. J., and Wingham, D. J. (1998). The natural fluctuations of firn densification and their effect on the geodetic determination of ice sheet mass balance. Climatic Change 40, 605–624. doi:10.1023/a:1005320713306
Birnbaum, G., Freitag, J., Brauner, R., König-Langlo, G., Schulz, E., Kipfstuhl, S., et al. (2010). Strong-wind events and their influence on the formation of snow dunes: observations from Kohnen station, Dronning Maud Land, Antarctica. J. Glaciol. 56, 891–902. doi:10.3189/002214310794457272
Birner, B., Buizert, C., Wagner, T. J. W., and Severinghaus, J. P. (2018). The influence of layering and barometric pumping on firn air transport in a 2-D model. The Cryosphere 12, 2021–2037. doi:10.5194/tc-12-2021-2018
Calonne, N., Montagnat, M., Matzl, M., and Schneebeli, M. (2017). The layered evolution of fabric and microstructure of snow at Point Barnola, Central East Antarctica. Earth Planet. Sci. Lett. 460, 293–301. doi:10.1016/j.epsl.2016.11.041
Champollion, N., Picard, G., Arnaud, L., Lefebvre, É., Macelloni, G., Rémy, F., et al. (2019). Marked decrease in the near-surface snow density retrieved by AMSR-E satellite at Dome C, Antarctica, between 2002 and 2011. The Cryosphere 13, 1215–1232. doi:10.5194/tc-13-1215-2019
Craven, M., and Allison, I. (1998). Firnification and the effects of wind-packing on Antarctic snow. A. Glaciology. 27, 239–245. doi:10.3189/1998aog27-1-239-245
Curran, M. A. J., Palmer, A. S., Van Ommen, T. D., Morgan, V. I., Phillips, K. L., McMorrow, A. J., et al. (2002). Post-depositional movement of methanesulphonic acid at Law Dome, Antarctica, and the influence of accumulation rate. Ann. Glaciol. 35, 333–339. doi:10.3189/172756402781816528
Das, I., Bell, R. E., Scambos, T. A., Wolovick, M., Creyts, T. T., Studinger, M., et al. (2013). Influence of persistent wind scour on the surface mass balance of Antarctica. Nat. Geosci 6, 367–371. doi:10.1038/ngeo1766
Dierking, W., Linow, S., and Rack, W. (2012). Toward a robust retrieval of snow accumulation over the Antarctic ice sheet using satellite radar. J. Geophys. Research-Atmospheres 117, 17. doi:10.1029/2011jd017227
Du, Z., Xiao, C., Zhang, Q., Li, C., Wang, F., Liu, K., et al. (2019). Climatic and environmental signals recorded in the EGRIP snowpit, Greenland. Environ. Earth Sci. 78. doi:10.1007/s12665-019-8177-4
Eisen, O., Frezzotti, M., Genthon, C., Isaksson, E., Magand, O., Van Den Broeke, M. R., et al. (2008). Ground-based measurements of spatial and temporal variability of snow accumulation in East Antarctica. Rev. Geophys. 46, 39. doi:10.1029/2006rg000218
Endo, Y., and Fujiwara, K. (1973). Characteristics of the snow cover in East Antarctica along the route of the JARE South Pole traverse and factors controlling such characteristics. JARE Sci. Rep. 7, 1–27.
Epica Community Members (2006). One-to-one coupling of glacial climate variability in Greenland and Antarctica. Nature 444, 195–198. doi:10.1038/nature05301
Fegyveresi, J. M., Alley, R. B., Muto, A., Orsi, A. J., and Spencer, M. K. (2018). Surface formation, preservation, and history of low-porosity crusts at the WAIS Divide site, West Antarctica. The Cryosphere 12, 325–341. doi:10.5194/tc-12-325-2018
Fisher, D. A., Reeh, N., and Clausen, H. B. (1985). Stratigraphic noise in time series derived from ice cores. A. Glaciology. 7, 76–83. doi:10.3189/s0260305500005942
Flach, J. D., Partington, K. C., Ruiz, C., Jeansou, E., and Drinkwater, M. R. (2005). Inversion of the surface properties of ice sheets from satellite microwave data. IEEE Trans. Geosci. Remote Sensing 43, 743–752. doi:10.1109/tgrs.2005.844287
Freitag, J., Kipfstuhl, S., and Laepple, T. (2013). Core-scale radioscopic imaging: a new method reveals density-calcium link in Antarctic firn. J. Glaciol. 59, 1009–1014. doi:10.3189/2013jog13j028
Frezzotti, M., Gandolfi, S., and Urbini, S. (2002). Snow megadunes in Antarctica: sedimentary structure and genesis. J. Geophys. Research-Atmospheres 107. doi:10.1029/2001jd000673
Furukawa, T., Kamiyama, K., and Maeno, H. (1996). Snow surface features along the traverse route from the coast to Dome Fuji station, queen Maud Land, Antarctica. Proc. NIPR Symp. Polar Meteorology Glaciology 10, 13–24.
Furukawa, T., Watanabe, O., Seko, K., and Fujii, Y. (1992). Distribution of surface conditions of ice sheet in enderby Land and east queen Maud Land, east Antarctica. Proc. NIPR Symp. Polar Meteorol. Glacil 5, 140–144.
Göktas, F., Fischer, H., Oerter, H., Weller, R., Sommer, S., and Miller, H. (2002). A glacio-chemical characterization of the new EPICA deep-drilling site on Amundsenisen, Dronning Maud Land, Antarctica. Ann. Glaciol. 35, 347–354. doi:10.3189/172756402781816474
Gregory, S. A., Albert, M. R., and Baker, I. (2014). Impact of physical properties and accumulation rate on pore close-off in layered firn. The Cryosphere 8, 91–105. doi:10.5194/tc-8-91-2014
Herron, M. M., and Langway, C. C. (1980). Firn densification: an empirical model. J. Glaciol. 25, 373–385. doi:10.1017/s0022143000015239
Holme, C., Gkinis, V., Lanzky, M., Morris, V., Olesen, M., Thayer, A., et al. (2019). Varying regional δ18O-temperature relationship in high-resolution stable water isotopes from east Greenland. Clim. Past 15, 893–912. doi:10.5194/cp-15-893-2019
Hörhold, M., Kipfstuhl, S., Wilhelms, F., Freitag, J., and Frenzel, A. (2011). The densification of layered polar firn. J. Geophys. Research-Earth Surf. 116. doi:10.1029/2009jf001630
Hoshina, Y., Fujita, K., Nakazawa, F., Iizuka, Y., Miyake, T., Hirabayashi, M., et al. (2014). Effect of accumulation rate on water stable isotopes of near-surface snow in inland Antarctica. J. Geophys. Res. Atmos. 119, 274–283. doi:10.1002/2013jd020771
Jonsell, U., Hansson, M. E., and Mörth, C.-M. (2007). Correlations between concentrations of acids and oxygen isotope ratios in polar surface snow. Tellus B 59, 326–335. doi:10.1111/j.1600-0889.2007.00272.x
Karlsson, N. B., Binder, T., Eagles, G., Helm, V., Pattyn, F., Van Liefferinge, B., et al. (2018). Glaciological characteristics in the Dome Fuji region and new assessment for "oldest ice". The Cryosphere 12, 2413–2424. doi:10.5194/tc-12-2413-2018
Laepple, T., Werner, M., and Lohmann, G. (2011). Synchronicity of Antarctic temperatures and local solar insolation on orbital timescales. Nature 471, 91–94. doi:10.1038/nature09825
Laepple, T., Hörhold, M., Münch, T., Freitag, J., Wegner, A., and Kipfstuhl, S. (2016). Layering of surface snow and firn at Kohnen Station, Antarctica: noise or seasonal signal? J. Geophys. Res. Earth Surf. 121, 1849–1860. doi:10.1002/2016jf003919
Landais, A., Barnola, J. M., Kawamura, K., Caillon, N., Delmotte, M., Van Ommen, T., et al. (2006). Firn-air δ15N in modern polar sites and glacial-interglacial ice: a model-data mismatch during glacial periods in Antarctica? Quat. Sci. Rev. 25, 49–62. doi:10.1016/j.quascirev.2005.06.007
Liang, D., Xu, X., Tsang, L., Andreadis, K. M., and Josberger, E. G. (2008). The effects of layers in dry snow on its passive microwave emissions using dense media radiative transfer theory based on the quasicrystalline approximation (QCA/DMRT). IEEE Trans. Geosci. Remote Sensing 46, 3663–3671. doi:10.1109/tgrs.2008.922143
Macelloni, G., Brogioni, M., and Santi, E. (2007). Retrieval from AMSR-E data of the snow temperature profile at Dome-C Antarctica, IEEE International Geoscience and Remote Sensing Symposium, Barcelona, Spain 4233–4236. doi:10.1109/IGARSS.2007.4423785
Medley, B., Mcconnell, J. R., Neumann, T. A., Reijmer, C. H., Chellman, N., Sigl, M., et al. (2018). Temperature and snowfall in western queen Maud Land increasing faster than climate model projections. Geophys. Res. Lett. 45, 1472–1480. doi:10.1002/2017gl075992
Mitchell, L. E., Buizert, C., Brook, E. J., Breton, D. J., Fegyveresi, J., Baggenstos, D., et al. (2015). Observing and modeling the influence of layering on bubble trapping in polar firn. J. Geophys. Res. Atmos. 120, 2558–2574. doi:10.1002/2014jd022766
Moser, D. E., Horhold, M., Kipfstuhl, S., and Freitag, J. (2020). Microstructure of snow and its link to trace elements and isotopic composition at kohnen station, dronning Maud Land, Antarctica. Front. Earth Sci. 8, 13. doi:10.3389/feart.2020.00023
Münch, T., Kipfstuhl, S., Freitag, J., Meyer, H., and Laepple, T. (2016). Regional climate signal vs. local noise: a two-dimensional view of water isotopes in Antarctic firn at Kohnen Station, Dronning Maud Land. Clim. Past 12, 1565–1581. doi:10.5194/cp-12-1565-2016
Neem Community Members (2013). Eemian interglacial reconstructed from a Greenland folded ice core. Nature 493, 489–494. doi:10.1038/nature11789
Nghiem, S. V., Hall, D. K., Mote, T. L., Tedesco, M., Albert, M. R., Keegan, K., et al. (2012). The extreme melt across the Greenland ice sheet in 2012. Geophys. Res. Lett. 39, 6. doi:10.1029/2012gl053611
Oerter, H., Graf, W., Wilhelms, F., Minikin, A., and Miller, H. (1999). Accumulation studies on Amundsenisen, Dronning Maud Land, Antarctica, by means of tritium, dielectric profiling and stable-isotope measurements: first results from the 1995-96 and 1996-97 field seasons. Ann. Glaciol. 29, 1–9. doi:10.3189/172756499781820914
Pfeffer, W. T., and Mrugala, R. (2002). Temperature gradient and initial snow density as controlling factors in the formation and structure of hard depth hoar. J. Glaciol. 48, 485–494. doi:10.3189/172756502781831098
Picard, G., Domine, F., Krinner, G., Arnaud, L., and Lefebvre, E. (2012). Inhibition of the positive snow-albedo feedback by precipitation in interior Antarctica. Nat. Clim Change 2, 795–798. doi:10.1038/nclimate1590
Reijmer, C. H., and van den Broeke, M. R. (2003). Temporal and spatial variability of the surface mass balance in Dronning Maud Land, Antarctica, as derived from automatic weather stations. J. Glaciol. 49, 512–520. doi:10.3189/172756503781830494
Ren, J. W., Sun, J. Y., and Qin, D. H. (2004). Preliminary results of ionic concentrations in snow pits along the Zhongshan-Dome A traverse route, Antarctica. Ann. Glaciology 39 (39), 155–160.
Rotschky, G., Rack, W., Dierking, W., and Oerter, H. (2006). Retrieving snowpack properties and accumulation estimates from a combination of SAR and scatterometer measurements. IEEE Trans. Geosci. Remote Sensing 44, 943–956. doi:10.1109/tgrs.2005.862524
Scambos, T. A., Frezzotti, M., Haran, T., Bohlander, J., Lenaerts, J. T. M., Van Den Broeke, M. R., et al. (2012). Extent of low-accumulation 'wind glaze' areas on the East Antarctic plateau: implications for continental ice mass balance. J. Glaciol. 58, 633–647. doi:10.3189/2012jog11j232
Schaller, C. F., Freitag, J., and Eisen, O. (2017). Critical porosity of gas enclosure in polar firn independent of climate. Clim. Past 13, 1685–1693. doi:10.5194/cp-13-1685-2017
Schaller, C. F., Freitag, J., Kipfstuhl, S., Laepple, T., Steen-Larsen, H. C., and Eisen, O. (2016). A representative density profile of the North Greenland snowpack. The Cryosphere 10, 1991–2002. doi:10.5194/tc-10-1991-2016
Schlatter, T. (1984). Weather queries: firnspiegel: an “ice mirror”. Weatherwise 37, 317. doi:10.1080/00431672.1984.9933268
Simonsen, M. F., Baccolo, G., Blunier, T., Borunda, A., Delmonte, B., Frei, R., et al. (2019). East Greenland ice core dust record reveals timing of Greenland ice sheet advance and retreat. Nat. Commun. 10, 4494. doi:10.1038/s41467-019-12546-2
Sommer, C. G., Lehning, M., and Fierz, C. (2018a). Wind tunnel experiments: influence of erosion and deposition on wind-packing of new snow. Front. Earth Sci. 6. doi:10.3389/feart.2018.00004
Sommer, C. G., Wever, N., Fierz, C., and Lehning, M. (2018b). Investigation of a wind-packing event in queen Maud Land, Antarctica. The Cryosphere 12, 2923–2939. doi:10.5194/tc-12-2923-2018
Sommer, S., Wagenbach, D., Mulvaney, R., and Fischer, H. (2000). Glacio-chemical study spanning the past 2 kyr on three ice cores from Dronning Maud Land, Antarctica: 2. Seasonally resolved chemical records. J. Geophys. Res. 105, 29423–29433. doi:10.1029/2000jd900450
Steen-Larsen, H. C., Masson-Delmotte, V., Sjolte, J., Johnsen, S. J., Vinther, B. M., Breon, F. M., et al. (2011). Understanding the climatic signal in the water stable isotope records from the NEEM shallow firn/ice cores in northwest Greenland. J. Geophys. Research-Atmospheres 116. doi:10.1029/2010jd014311
Sugiyama, S., Enomoto, H., Fujita, S., Fukui, K., Nakazawa, F., Holmlund, P., et al. (2012). Snow density along the route traversed by the Japanese-Swedish Antarctic Expedition 2007/08. J. Glaciol. 58, 529–539. doi:10.3189/2012jog11j201
Surdyk, S. (2002). “Low microwave brightness temperatures in central Antarctica: observed features and implications,” in Annals of glaciology. Editors J. G. Winther, and R. Solberg (Cambridge: Int Glaciological Soc)), 34, 134–140.
Tran, N., Remy, F., Feng, H., and Femenias, P. (2008). Snow facies over ice sheets derived from envisat active and passive observations. IEEE Trans. Geosci. Remote Sensing 46, 3694–3708. doi:10.1109/tgrs.2008.2000818
Vallelonga, P., Christianson, K., Alley, R. B., Anandakrishnan, S., Christian, J. E. M., Dahl-Jensen, D., et al. (2014). Initial results from geophysical surveys and shallow coring of the Northeast Greenland Ice Stream (NEGIS). The Cryosphere 8, 1275–1287. doi:10.5194/tc-8-1275-2014
van Geldern, R., and Barth, J. A. C. (2012). Optimization of instrument setup and post-run corrections for oxygen and hydrogen stable isotope measurements of water by isotope ratio infrared spectroscopy (IRIS). Limnol. Oceanogr. Methods 10, 1024–1036. doi:10.4319/lom.2012.10.1024
Weinhart, A. H., Freitag, J., Hörhold, M., Kipfstuhl, S., and Eisen, O. (2020). Representative surface snow density on the East Antarctic plateau. The Cryosphere 14, 3663–3685. doi:10.5194/tc-14-3663-2020
Weller, R., Traufetter, F., Fischer, H., Oerter, H., Piel, C., and Miller, H. (2004). Postdepositional losses of methane sulfonate, nitrate, and chloride at the European Project for Ice Coring in Antarctica deep-drilling site in Dronning Maud Land, Antarctica. J. Geophys. Research-Atmospheres 109. doi:10.1029/2003jd004189
Weller, R., and Wagenbach, D. (2007). Year-round chemical aerosol records in continental Antarctica obtained by automatic samplings. Tellus B: Chem. Phys. Meteorology 59, 755–765. doi:10.1111/j.1600-0889.2007.00293.x
Whitlow, S., Mayewski, P. A., and Dibb, J. E. (1992). A comparison of major chemical species seasonal concentration and accumulation at the South Pole and summit, Greenland. Atmos. Environ. A. Gen. Top. 26, 2045–2054. doi:10.1016/0960-1686(92)90089-4
Wilheit, T. T. (1978). Radiative transfer in a plane stratified dielectric. IEEE Trans. Geosci. Electron. 16, 138–143. doi:10.1109/tge.1978.294577
Winebrenner, D. P., Arthern, R. J., and Shuman, C. A. (2001). Mapping Greenland accumulation rates using observations of thermal emission at 4.5-cm wavelength. J. Geophys. Res. 106, 33919–33934. doi:10.1029/2001jd900235
Keywords: Antarctica, Greenland, polar snow, snow stratigraphy, crusts, snow properties, accumulation rate
Citation: Weinhart AH, Kipfstuhl S, Hörhold M, Eisen O and Freitag J (2021) Spatial Distribution of Crusts in Antarctic and Greenland Snowpacks and Implications for Snow and Firn Studies. Front. Earth Sci. 9:630070. doi: 10.3389/feart.2021.630070
Received: 16 November 2020; Accepted: 09 February 2021;
Published: 25 March 2021.
Edited by:
Markus Michael Frey, British Antarctic Survey (BAS), United KingdomReviewed by:
Martin Schneebeli, WSL Institute for Snow and Avalanche Research SLF, SwitzerlandAmaelle Adeline Landais, Centre National de la Recherche Scientifique (CNRS), France
Copyright © 2021 Weinhart, Kipfstuhl, Hörhold, Eisen and Freitag. This is an open-access article distributed under the terms of the Creative Commons Attribution License (CC BY). The use, distribution or reproduction in other forums is permitted, provided the original author(s) and the copyright owner(s) are credited and that the original publication in this journal is cited, in accordance with accepted academic practice. No use, distribution or reproduction is permitted which does not comply with these terms.
*Correspondence: Alexander H. Weinhart, alexander.weinhart@awi.de; Johannes Freitag, johannes.freitag@awi.de