Controls on Gas Emission Distribution on the Continental Slope of the Western Black Sea
 Michael Riedel1*
  Line Hähnel1,2
  Jörg Bialas1 Anna Katharina Bachmann3,4 Stefanie Gaide3
  Paul Wintersteller3
  Ingo Klaucke1 Gerhard Bohrmann3
- 1GEOMAR Helmholtz Centre for Ocean Research Kiel, Kiel, Germany
- 2GeoZentrum Nordbayern, Friedrich-Alexander University Erlangen-Nürnberg, Erlangen, Germany
- 3University Bremen, MARUM–Center for Marine Environmental Sciences and Faculty of Geoscience, Bremen, Germany
- 4Wageningen University and Research, Wageningen, Netherlands
The continental slopes of the Black Sea show abundant manifestations of gas seepage in water depth of <720 m, but underlying controls are still not fully understood. Here, we investigate gas seepage along the Bulgarian and Romanian Black Sea margin using acoustic multibeam water column, bathymetry, backscatter, and sub-bottom profiler data to determine linkages between sub-seafloor structures, seafloor gas seeps, and gas discharge into the water column. More than 10,000 seepage sites over an area of ∼3,000 km2 were identified. The maximum water depth of gas seepage is controlled by the onset of the structure I gas hydrate stability zone in ∼720 m depth. However, gas seepage is not randomly distributed elsewhere. We classify three factors controlling on gas seepage locations into depositional, erosional, and tectonic factors. Depositional factors are associated with regionally occurring sediment waves forming focusing effects and mass-transport deposits (MTDs) with limited sediment drape. Elongated seafloor depressions linked to faulting and gas seepage develop at the base between adjacent sediment waves. The elongated depressions become progressively wider and deeper toward shallow water depths and culminate in some locations into clusters of pockmarks. MTDs cover larger regions and level out paleo-topography. Their surface morphology results in fault-like deformation patterns of the sediment drape on top of the MTDs that is locally utilized for gas migration. Erosional factors are seen along channels and canyons as well as slope failures, where gas discharge occurs along head-scarps and ridges. Sediment that was removed by slope failures cover larger regions down-slope. Those regions are devoid of gas seepage either by forming impermeable barriers to gas migration or by removal of the formerly gas-rich sediments. Deep-rooted tectonic control on gas migration is seen in the eastern study region with wide-spread normal faulting promoting gas migration. Overall, gas seepage is widespread along the margin. Gas migration appears more vigorous in shallow waters below ∼160 m water depth, but the number of flare sites is not necessarily an indicator of the total volume of gas released.
Introduction
Studies on Gas Hydrates and Gas Venting in the Black Sea
In 1974, sampling of natural gas hydrates has been described for the first time in the Black Sea (Yefremova and Zhizchenko, 1974). Since then, many research expeditions and projects were undertaken to study the occurrence and distribution of methane gas and gas hydrates along the continental margins of the Black Sea (see e.g., Ginsburg, 1998; Vassilev and Dimitrov, 2002; Bohrmann et al., 2003; Starostenko et al., 2010; Haeckel et al., 2017).
Over the course of the past 20 years of research on gas hydrates conducted in the Black Sea, numerous active gas expulsion sites, mud volcanoes, and indicators for gas and hydrate distribution have been found (e.g., Ergün et al., 2002; Vassilev and Dimitrov 2002; Greinert et al., 2006; Klaucke et al., 2006; Naudts et al., 2006; Popescu et al., 2007; Sahling et al., 2009; Greinert et al., 2010; Pape et al., 2010; Starostenko et al., 2010; Römer et al., 2012; Römer et al., 2019; Körber et al., 2014; Hillman et al., 2018a; Wu et al., 2019; Zander et al., 2019).
According to current temperature and salinity conditions in the Black Sea gas hydrate of structure I is stable in water depth greater than 720 m (e.g., Pape et al., 2011; Riboulot et al., 2017). Depending on the depth of the seafloor and the temperature gradient in the sediments, gas hydrates are expected to be stable within 200 m–300 mbsf (Bialas et al., 2014; Zander et al., 2017; Riboulot et al., 2018), defining upper and lower limits of the bottom-simulating reflector (BSR) distribution as initially shown by Popescu et al. (2006). As part of these investigations, several authors identified that gas seepage sites are not necessarily randomly distributed, but show some association to structural and seafloor morphological features, such as slump scars, canyon flanks, or ridges (Naudts et al., 2006; Naudts et al., 2009; Riboulot et al., 2017; Römer et al., 2019). In a study along the Bulgarian slope in the south-western Black Sea, Xu et al. (2018) reported on active gas expulsion above the gas hydrate stability field that appears in unique elongated, slope-parallel depressions. Similar observations were made at other margins where elongated depressions are either interpreted as merging of pockmark-chains (e.g., Pilcher and Argent, 2007; Çifi̧ et al., 2003; Reiche et al., 2011) or as a result of extensional cracking and linked to slope failures (e.g., Driscoll et al., 2000; Mienert et al., 2010; Laberg et al., 2013). All these studies highlighted the need of multibeam bathymetry and water column data for the identification of gas seepages.
In our new study, we refer specifically to gas hydrate-related studies based on the expeditions from the French-Romanian BlaSON project (e.g., Popescu et al., 2006; Popescu et al., 2007), the French GHASS expedition (Ker and Riboulot, 2015), the German MSM34 expedition (Bialas et al., 2014) and the most recent expeditions M142 (Bohrmann, 2018) and M143 (Riedel et al., 2018) with the latter three conducted as part of the German SUGAR-III program. Using the MARUM MeBo200 seafloor drilling system (Freudenthal and Wefer, 2013), two deep drill sites up to 146 m below seafloor (mbsf) and to the depth of the base of gas hydrate stability were accomplished (Bohrmann, 2018; Freudenthal et al., 2020) into the Danube deep sea fan (Site GeoB22603–1, MeBo-16; GeoB22605–1, MeBo-17, Figure 1). A summary of many of these activities and findings in the Black Sea was recently provided by Minshull et al. (2020) as part of the European Union-funded project “Marine gas hydrate–an indigenous resource of natural gas for Europe” (MIGRATE). Bialas et al. (2020) jointly summarized seismic and electromagnetic results achieved for the north-western margin within the SUGAR III project.
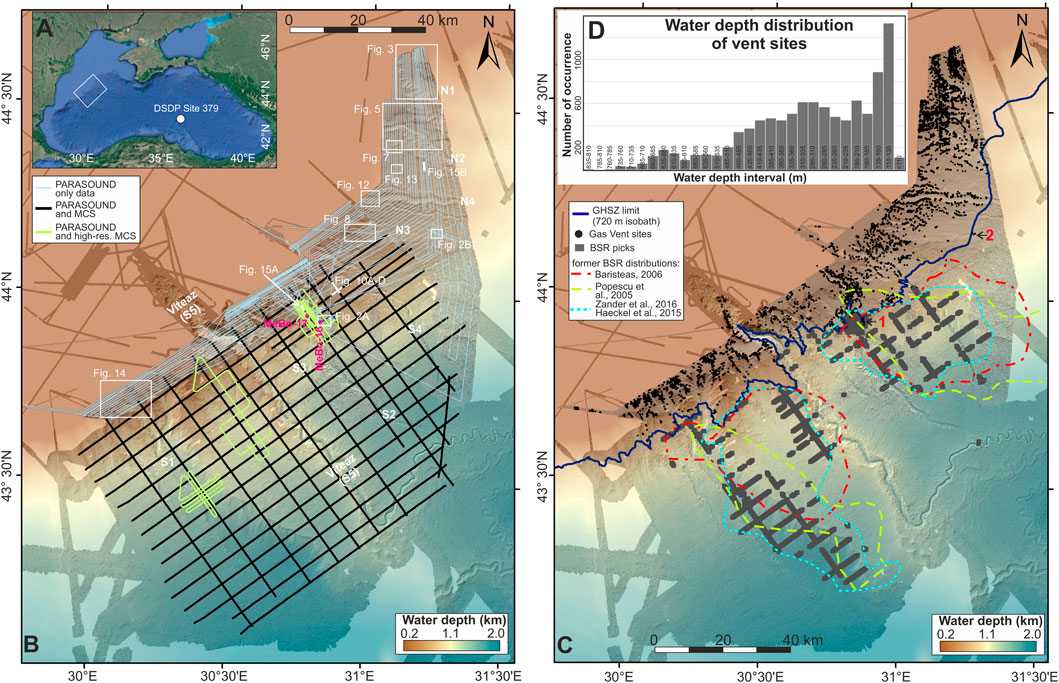
FIGURE 1. (A) Study region of expeditions MSM34, M142, and M143 (white rectangle) in the western Black Sea. (B) Seafloor bathymetry of the study region and outline of data utilized in this study with naming of channel systems. Following Winguth et al. (2000) the S1–S4 channels are linked to the Danube fan and the N1–N4 channels are linked to the Dnepr fan. Location of areas studied in detail in this study are indicated by white rectangles. (C) Seafloor bathymetry overlain with location of gas seeps. The seismically determined bottom-simulating reflector (BSR) occurs exclusively deeper than 720 m which is the inferred limit of the gas hydrate stability zone (GHSZ). In comparison, earlier outlines of BSR-distributions are shown. Two sites of gas venting deeper than the 720 m isobath (labeled in red) are linked to vent sites with gas hydrate occurrences. (D) Histogram of the water depth distribution of all vent sites mapped in the region. Water depth at the vent site locations was taken from the newly acquired bathymetry of expeditions M142 and M143.
As part of R/V Meteor expeditions M142 and M143 seafloor mapping along the Romanian shelf and slope was expanded from the initial coverage achieved during R/V Maria S. Merian expedition MSM34 (Bialas et al., 2014) and the GHASS expedition onboard R/V Pourquoi pas? (Ker and Riboulot, 2015). Discoveries of clustered gas seepage as reported by Riboulot et al. (2017) were confirmed and observations were expanded further West and East along the slope in water depths of 200–800 m up to the Ukrainian border (Figure 1). As a result of these new surveys, a total region of ∼3,400 km2 was additionally mapped with multibeam echosounder systems and combined with ∼4 kHz sub-bottom profiler data acquisition.
Understanding the regional distribution and amount of gas venting is an important element in estimating the geological methane budget at continental margins and implications on the global climate (e.g., Judd et al., 2002; Ruppel and Kessler, 2017 and references therein). How much of the methane that is emitted at the seafloor actually reaches the atmosphere is still poorly constrained (e.g., McGinnis et al., 2006) and depends on many factors (other than water depth) including bubble size and rise rates (e.g., Greinert et al., 2010). The shallower the water depth of a given gas seep, the higher the percentage of methane transfer to the atmosphere (e.g., Schmale et al., 2010; Ruppel and Kessler, 2017). In our study we first show a comprehensive, regional inventory of gas accumulation and seepage manifestations including the outer continental shelf. From this we determine three levels of control of venting distribution: physical-chemical controls, sedimentological controls, and structural controls. While the presence of gas vents was previously mapped in sub-regions of our study area and mostly explained by canyon and slope failure head-scarps exposing gas-bearing sediment layers or providing structural focusing for gas migration (e.g., Naudts et al., 2006; Riboulot et al., 2017), our new data show 1) large regions of the study area in water depths shallower than the upper limit of GHSZ that are devoid of gas vents, 2) widespread mass transport deposits without clear correlation to gas venting, and 3) the continental shelf to be the region with the highest gas flare density. Possible explanations for these observations are discussed in the light of morpho-sedimentological interpretations of the newly acquired geo-acoustical data. In particular, we show that paleo-topography and older structures have a strong deterministic influence on the distribution of gas seepage irrespective of more recent sediment deposition (drape).
Geological Background
The Black Sea Basin is a back-arc basin that formed due to the closure of the Thetys Ocean and has undergone several phases of extension and closure since the Neogene (Robinson et al., 1996). Our study region in the North-Western Black Sea (Figure 1) is a typical passive margin setting with wide continental shelves (Ryan et al., 1997), and dominated by several large-scale submarine channel systems, with the Viteaz or Danube channel being the largest system seen (Winguth et al., 2000). Nine channel systems have been identified in our study region (Figure 1). The S1 to S5 channels are linked to the Danube river, whereas the N1 to N4 channels have been linked to the Dnepr river (Wong et al., 1994; Wong et al., 1997; Winguth et al., 2000). The sediments found in the two associated deep-sea fans consist of mainly fine-grained turbidites and form stacks of alternating channel and levees deposits interspersed with mass-transport deposits (Popescu et al., 2001; Popescu et al., 2004; Hillman et al., 2018a). The deep-sea fans began to develop ∼900 ka BP (Winguth et al., 2000) and the Viteaz Channel is the most recently active channel. It began to develop around 25 ka BP during the last glacial maximum (LGM) when sea-level in the Black Sea was 100–150 m lower than today (e.g., Lericolais et al., 2009; Lericolais et al., 2013). During the LGM, sea water in the Black Sea was also fresher with a salinity of 3–4 PSU (practical salinity unit) compared to today’s value of ∼22 PSU (Özsoy and Ünlüata, 1997). Bottom-water temperatures during the LGM were ∼4°C (e.g., Soulet et al., 2010) compared to today’s temperature of ∼9°C (Degens and Ross, 1974; Vassilev and Dimitrov, 2002). Implications of this drastic change in temperature and pressure conditions on the gas hydrate regime of the Black Sea have been described by Poort et al. (2005), Riboulot et al. (2018), and Ker et al. (2019) and the equilibration process in the sub-surface is still ongoing (e.g., Hillman et al., 2018b). The temperature increase at the sea floor has resulted in an up-dip migration of the upper limit (feather edge) of the base of gas hydrate stability zone, which is one of the primary controls on the limits of gas venting occurrences in the region (e.g., Riboulot et al., 2017).
Data and Methods
Multibeam and Water-Column Data
During expeditions M142 and M143 onboard the R/V Meteor the hull-mounted Kongsberg EM710 (1°/1° beam angle and 70–100 kHz operating frequency) multibeam echosounder (MBES) system was the primary acquisition system in water depths <600 m. The ping rate (dependent on water depth) was up to 40 Hz. In water depth of >600 m, a hull-mounted Kongsberg EM122 12 kHz MBES system was used during cruises MSM34 (2°/2° beam angle), M142, and M143 (1°/2° beam angle). The EM122 ping rate was also adjusted dependent on water depth with a maximum rate of 5 Hz. In both systems, the maximum swath angle was set to 130° (Bohrmann, 2018), running in equidistance mode for spacing the beams across track. Survey speed during acquisition was varying between 3 and 8 kn. Motion data and static offsets were recorded by the ship’s internal sensors and directly applied to the two MBES data sets. Weather conditions during multibeam data acquisition were often severe with significant wave heights, deteriorating data quality. Manual editing of the data was therefore performed to clean the data using the open-source software MB-System (Caress et al., 2017). The multibeam data from both surveys were corrected post-expedition to include the measured sound velocity profiles (Bohrmann, 2018) prior to merging the data sets into one bathymetric depth map. A tide correction by utilizing the Oregon State University (OSU) Tidal Prediction Software OTPS (http://volkov.oce.orst.edu/tides/otps.html) was also performed. The various multibeam data sets were ultimately gridded with a 10 m by 10 m regular spacing. Additional details on the physical settings of the two multibeam systems installed on the R/V Meteor can be found in the M142 cruise report available online (Bohrmann, 2018).
Water column data from the two MBES of all expeditions were displayed post-acquisition using the QPS Fledermaus™ FM-Midwater-Tool to detect gas flares. Individual gas flares are seen as semi-vertical high-amplitude anomalies in the water-column data and are traced from swath to swath until the gas flare can be traced to the actual outlet at the seafloor. If this was not possible, the best projection of seafloor position is made according to the survey conditions (direction and speed of travel). Gas flares may be detected during multiple passes over the same region but the manual pick of the exact seafloor location may be somewhat different between overlapping lines, also due to the nature of gas venting changing over time. In order to avoid false counting of gas flares, picks within a critical distance from each other from overlapping lines were treated as one gas vent location and presented as such in the maps. This distance is water-depth dependent linked to the range in the beam-angle and swath width. In water depths of <200 m, the critical distance is 25 m, and this increases to 50 m for larger water depths.
Backscatter
Seafloor backscattering strength was determined from both shipborne multibeam systems EM122 and EM710 operated during expeditions M142 and M143. We processed the data using MB-system routine “mbbackangle” (Caress et al., 2017) to generate average seafloor backscatter values by binning them according to their grazing angle and averaging the amplitudes within each bin. The number of grazing angle bins was set to 81 and the maximum angle considered was set to 80. The grazing angle has been corrected for varying across-track bottom slopes, and amplitude correction tables within MB-system have been applied using a reference angle of 60°. The resulting backscatter mosaic grids have a resolution of 10 m by 10 m regular spacing. Mainly due to the different frequencies utilized for the EM710 and EM122 MBES, the resulting seafloor backscatter maps cannot be merged. In fact, the products highlight different aspects of the seafloor. While EM710 backscatter illuminates the seafloor morphology but less sediment specific characteristics, EM122 backscatter emphasizes the sediment differences by penetrating into the sub-surface on a meter scale. Partial severe weather conditions during data acquisition effected the data quality due to a significantly lower signal to noise ratio, especially the EM710 data. Therefore, we only use seafloor backscatter derived from the EM122 system, as it was overall less affected by the severe weather conditions.
PARASOUND Sub-Bottom Profiler Data
The PARASOUND echosounder installed on board the R/V Meteor and R/V Maria S. Merian utilizes the parametric effect which results from the nonlinear relation of pressure and density during sonar propagation. Two high-intensity acoustic waves with frequencies of 18–20 kHz (primary high frequency, PHF) and 22–24 kHz were used to create a secondary high (40–42 kHz, SHF) and a secondary low-frequency (∼4 kHz, SLF) pulse. The opening angle of the transducer is 4° by 5°, which corresponds to a footprint size of about 7% of the water depth. While the SLF is used for the sub-bottom profiling, the PHF can be used to image gas bubbles in the water column. The PHF data have been used occasionally to verify gas flare detection in the EM122 data, mainly for data from expedition MSM34. For the purpose of this study, we mostly focus on the SLF data for sub-seafloor imaging, as water column imaging for gas flare detection was made primarily with the EM710 and EM122 multibeam systems. The SLF during the M142 was set to 3.6 kHz to limit the interference with the EM122 signal. The pulse shape was set to continuous wave mode with one period per pulse and a pulse length of 0.25 ms. The sub-bottom profiler data show penetration depths varying from only 20 m across the shelf region to >100 m in deeper water settings. For display purposes we always use the instantaneous amplitude (envelope) attribute, and where required to highlight deeper occurrences, we used a time-varying gain function with 50 ms window length. The PARASOUND data are used to describe the sedimentary environment. The acoustic data are further used to identify the presence of free gas in the subsurface. The presence of free gas was identified either from high-amplitude reflections (bright-spots) and/or from acoustic masking of sediment reflections underneath the bright spot.
Multichannel Seismic Data
During expedition MSM34 (Bialas et al., 2014) a grid of 27 regional 2-D multichannel seismic (MCS) data was acquired covering the area of the Danube deep-sea fan with the S1–S5 channel systems (Figure 1B). The regional 2-D MCS data were acquired using a single GI gun (volume ∼4 L, 250 in3) as acoustic source and a single streamer with a total active length of 1050 m (168 channels). A high-resolution subset of 2-D MCS lines was acquired but with a smaller-sized GI gun (1.5 L, 90 in3) and shorter streamer (237.5 m active length, 76 channels). Additional high-resolution 3-D seismic data were acquired with the P-cable system in two regions linked to the SUGAR program activities (details see e.g., Zander et al., 2017; Hillman et al., 2018a; Hillman et al., 2018b; Bialas et al., 2020). Processing of the 2-D regional and high-res MCS data included geometry definition and sorting to common-mid-point locations, band-pass filtering (10–180 Hz), followed by velocity analysis with normal move-out (NMO) correction, and stacking. Post-stack time migration was performed subsequently using the MCS-derived NMO-velocities.
Gas Hydrate Stability Zone and Methane Solubility Calculations
Methane is the dominant gas in the sedimentary system of the Danube deep-sea fan as shown by previous work (Riboulot et al., 2018; Ker et al., 2019) and new drilling with the MARUM MeBo200 system during the M142 expedition (Pape et al., 2020). No significant amounts of other hydrocarbons were detected so that we assume a pure methane system in the modeling of the gas hydrate stability in our study region following the theory described by Tishchenko et al. (2015). Temperature data in the water column are used from multiple water-column measurements during the M142 expedition (Bohrmann, 2018). The sub-seafloor temperature gradient is assumed to follow an average of 24°C/km for the regional extrapolation of the base of gas hydrate stability. Local variations in the temperature gradient may occur and topographic effects could add complexity to the sub-surface temperature regime (as noted by Hillman et al., 2018b), but can be neglected here as we do not derive site-specific properties.
Gas venting and free gas within sediments were observed mostly above the feather edge of the GHSZ (∼720 m water depth). In order to investigate the nature of free gas occurrences in the sediments and their acoustic character in sub-bottom profiler data, we model methane gas solubilities for methane in seawater following the equation provided by Duan and Mao (2006) and implemented in the SUGAR toolbox (KosselBigalke et al., 2013). Two generic diagrams of solubility as function of pressure (at constant temperature and salinity) as well as solubility as function of temperature (at constant pressure and salinity) are shown in Supplementary Figure S1.
Results
General Locations of Bottom-Simulating Reflectors Relative to the Limit of GHSZ
Figure 1 shows an overview of observations of the BSR in the MCS data set available and previous outlines of BSR occurrences from Baristeas (2006), Popescu et al. (2006), Haeckel et al. (2015), and Zander et al. (2016). The BSR is identified from the data as a prominent reflection that is sub-parallel to the seafloor but crossing deeper stratigraphy and has a reflection polarity opposite to the seafloor. In some areas, up-dip truncations of high-amplitude reflections align in a BSR-like pattern. The up-dip extent of the BSR coincides with the 720 m isobath (Figure 1C) which is the shallow-water limit of the methane hydrate stability zone for the current bottom-water conditions (9°C, 22 PSU). The BSR is distributed across the Danube deep-sea fan in a non-uniform pattern. Three main patches of BSR occurrences are seen closely tied to the channel-levee deposits.
Controls on Gas Seepage Distribution
Gas venting is not randomly distributed in water depths <720 m across the study region (Figure 1C). On first inspection, the gas vent locations are closely aligned to the ridges of the sub-marine canyons and channels. They also occur at head-scarps of slope-failures. Additionally, the densest occurrence of venting is seen on the outer continental shelf in the western-most region upslope of the S1 channel/canyon system and the eastern-most region linked to the N1 channel system. With few exceptions, there are no gas vents seen deeper than the 720 m isobath limit (Figure 1C). A histogram of the depth-distribution of all mapped vents is given in Figure 1D. The highest abundance of mapped flares is in 110–135 m of water depth on the outer continental shelf. Two prominent exceptions (Figure 2) are sites of active gas discharge with known near-seafloor gas hydrate occurrences recovered in gravity cores. The first example is near the MeBo200 drilling Site MeBo-16 and gas hydrate was seen in the cored sediment (Figure 2A, Bohrmann, 2018), which was also previously reported from the GHASS expedition (Ker and Riboulot, 2015). A second example is linked to a site of mud volcanoes observed in ∼760 m water depth, just SE of the feather-edge of gas hydrate stability (Figure 2B). Here, recovery of gas hydrates in sediment cores was reported by Akhmetzhanov and Falkenstein (2017) as part of reconnaissance surveys conducted in the region by industry.
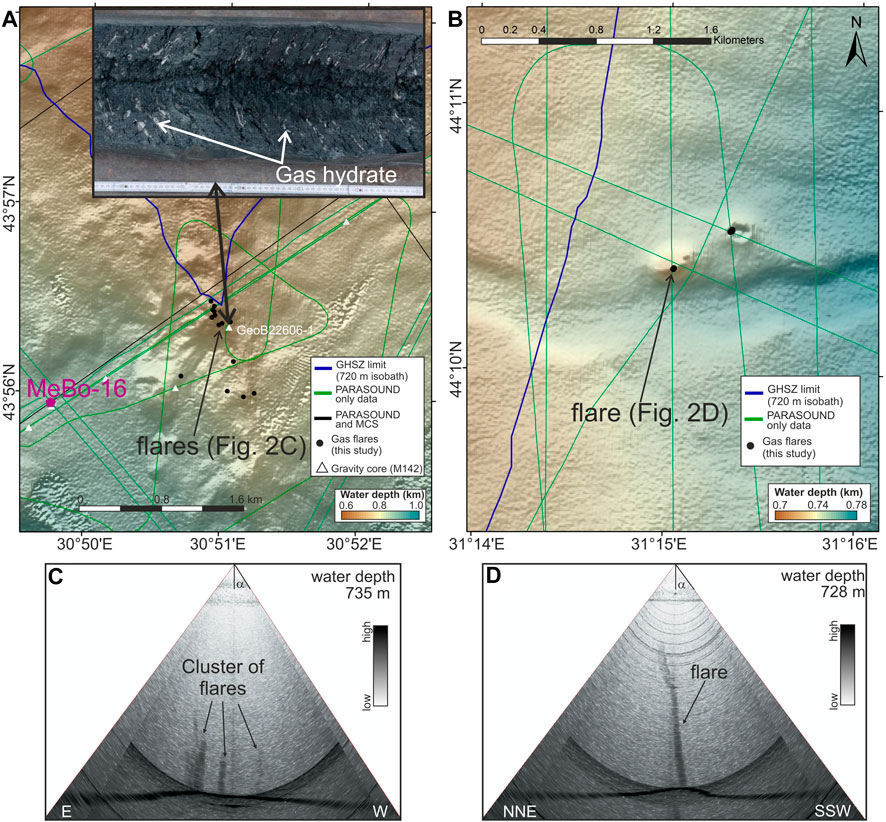
FIGURE 2. Example of two sites with gas hydrate recovery investigated during M142: (A) Site close to drill site MeBo-16 with gas hydrate recovered in gravity core (station GeoB22606–1, inset image) and (B) site of two mud volcanoes, 500–800 m west of the hydrate feather edge (720 m isobath). (C,D) are examples of gas flares seen in the EM710 water column data. Beam-opening angle α is 60°.
In the following, we present several examples of gas venting patterns typical for the region offshore Bulgaria and Romania (see Figure 1 for an overview of these areas). We include venting-occurrences at canyons (Canyons–Sediment Erosion, Head-Scarps and Mass Flows), faults (Gas Venting and Fault Occurrences), sediment waves and elongated depressions (Sediment Wave Patterns and Elongated Depressions), mass-transport deposits (MTDs, Mass-Transport Deposits), isolated occurrences or chains of pockmarks (Pockmarks), and at the western-most shelf region (Shelf Region With Highest Gas Flare Occurrence). Occurrences of chimney-like structures are described in Seismic Chimney Structures. The nature of the acoustic reflectivity from the top of free gas occurrence is described in Step-Wise Top of Gas Reflection. In all these settings, multibeam seafloor mapping is combined with water-column acoustic imaging of the gas flares, backscatter imagery, and sub-bottom profiler imaging.
Canyons–Sediment Erosion, Head-Scarps and Mass Flows
The northern-most region of our study area is dominated by the large N1 channel and canyon system (Figure 3). Although only partially imaged, the canyon starts as a NS-oriented incision, which turns eastwards at a latitude of approximately 44° 35′N. Due to its location, the canyon was defined to belong to the Dnepr river-fan system (Winguth et al., 2000) rather than the Danube deep-sea fan which is located further to the west. The canyon is ∼2,500 m wide at its flat base, but spans a total width of nearly 10 km between the eastern and western canyon head-scarps (Figure 3A). The inner base of the canyon shows an overall smooth seafloor that deepens eastwards. The western and eastern flanks are dominated by numerous head-scarps and tributary canyons feeding into the main drainage system (Figure 3B). Backscatter intensity increases from the head-scarps into the main channel floor and subsequently decreases down-slope along the channel floor. Gas venting across this canyon system is almost exclusively associated with scarps, with the gas vent sites outlining the canyon walls.
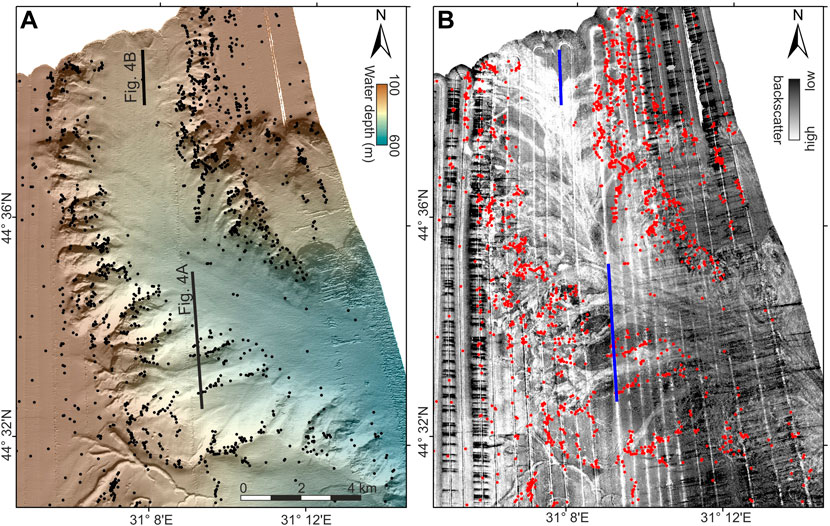
FIGURE 3. Northern-most N1 canyon system, associated with the Dnepr river system. (A) Multibeam data with overlay of gas vent sites (black dots). (B) Seafloor backscatter with overlay of gas vents (red dots) highlighting individual chutes of mass-transport material removed from the canyon walls. These deposits overlap and merge in the talweg of the canyon. Gas seeps are tightly linked to the head-scarps and remaining ridges in the canyon walls. Two examples of sub-bottom profiler data are given in Figure 4. Poor weather conditions created the black-and-white striping pattern on some of the lines.
The canyon floor is covered with a homogenous sediment drape of ∼3–5 m thickness above an acoustically turbid unit, interpreted as a small MTD (Figure 4A) that also shows high backscatter intensity on the EM122 backscatter data. Furthermore, the entire region around the canyon is characterized by a thick package of relatively uniform sedimentary layers. The sub-bottom profiler data image up to 100 m of sediment (∼120 ms two-way time) of seafloor-parallel layers that at the canyon walls are heavily faulted in response to slope instability and mass-failure (Figure 4B). Gas venting occurs almost exclusively where the faults crop out at the seafloor.
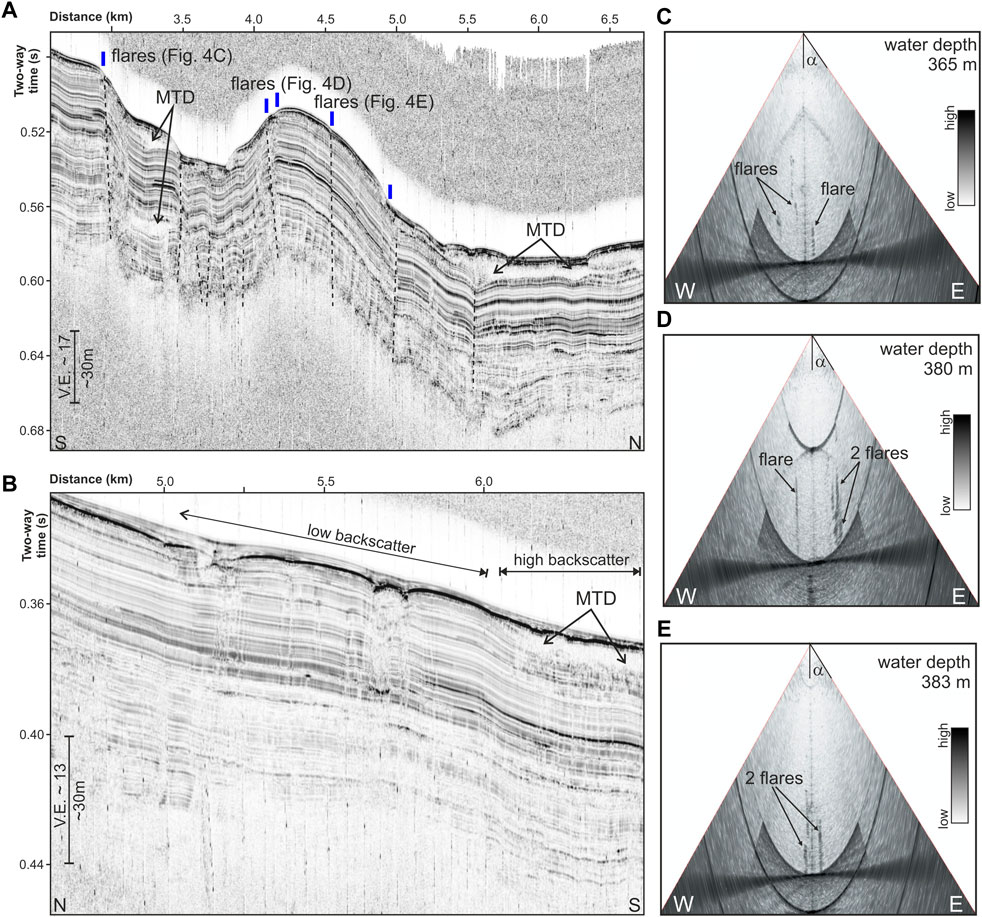
FIGURE 4. Acoustic sub-bottom profiler data of features of the northern-most N1 canyon. (A) Section across the canyon wall showing in the southern half a faulted sedimentary package with gas seeps (location indicated by blue lines). Faults are indicated by dashed black lines. The northern half of the section is within the talweg of the canyon with a shallow mass-transport deposit (MTD) near the seafloor. Although the MTD is covered by 3–5 m thick layered (recent) sediment, seafloor backscatter is high only where the MTD occurs. This is seen especially in the section shown in (B). (C–E) Examples of gas flares from the EM710 water column data along section shown in (A). Beam-opening angle α is 60°.
Gas Venting and Fault Occurrences
South of the N1 northern canyon system, a smaller, E-W oriented canyon system (N2, Winguth et al., 2000) is observed between 44° 30.4′N and 44° 22.5′N (Figure 5). Here, the canyon is only ∼1 km wide at its base and is covered with a homogenous drape of 3–5 m thick sediments (Figure 5C). The most significant feature across this canyon system is the occurrence of E-W oriented normal faults with a seafloor offset of up to 20 m (Figure 6A). Individual fault traces can be followed for nearly 20 km in E-W extent. The region of normal faulting stretches N-S for almost 16 km. At the western edge of the data coverage, the talweg of this canyon has been cut by one of the normal faults after the canyon has ceased being active (Figure 5C). Gas venting is abundant along the canyon walls and is strikingly linked to the fault outcrops (Figures 5E,F, Figures 6D,F). High backscatter zones indicate several smaller mass-failures at the head-scarps of the outer canyon walls (Figure 6B). As seen at the N1 canyon, the high backscatter intensity stems from buried mass-transport deposits that are covered by a homogenous sediment drape of 3–5 m thickness (Figure 6B). On top of the northern plateau of this N2 canyon, a series of pockmarks and smaller fault-scarps are seen, many of which show gas venting. Wider depressions can be identified from the sub-bottom profiler data as erosional gullies (Figure 6C).
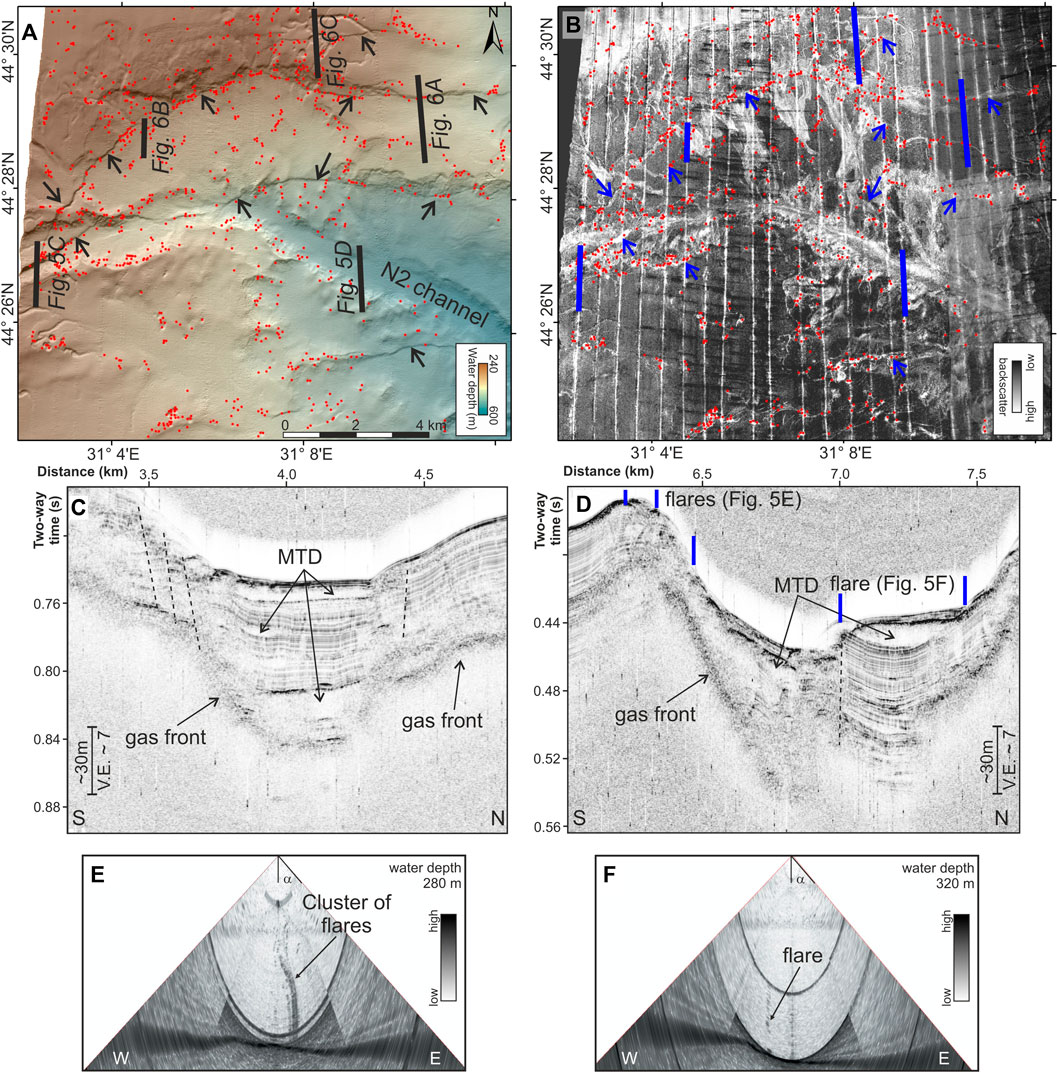
FIGURE 5. Examples from the N2 channel systems: (A) multibeam bathymetry and (B) seafloor backscatter. Location of gas seeps are shown as red dots. Dominant E-W trending normal faults are indicated by arrows. Buried, small-scale mass-transport deposits show high seafloor backscatter. Sub-bottom profiler data (black/blue thick lines in (A,B)) across the talweg of the EW-canyon system showing (C) 3–5 m thick drape on top of the youngest mass-transport deposit from the time when the canyon was last active, (D) fault cutting the talweg. Faults are indicated by dashed black lines. (E,F) are examples of gas flares from the EM710 water column data along section shown in (D). Beam-opening angle α is 60°.
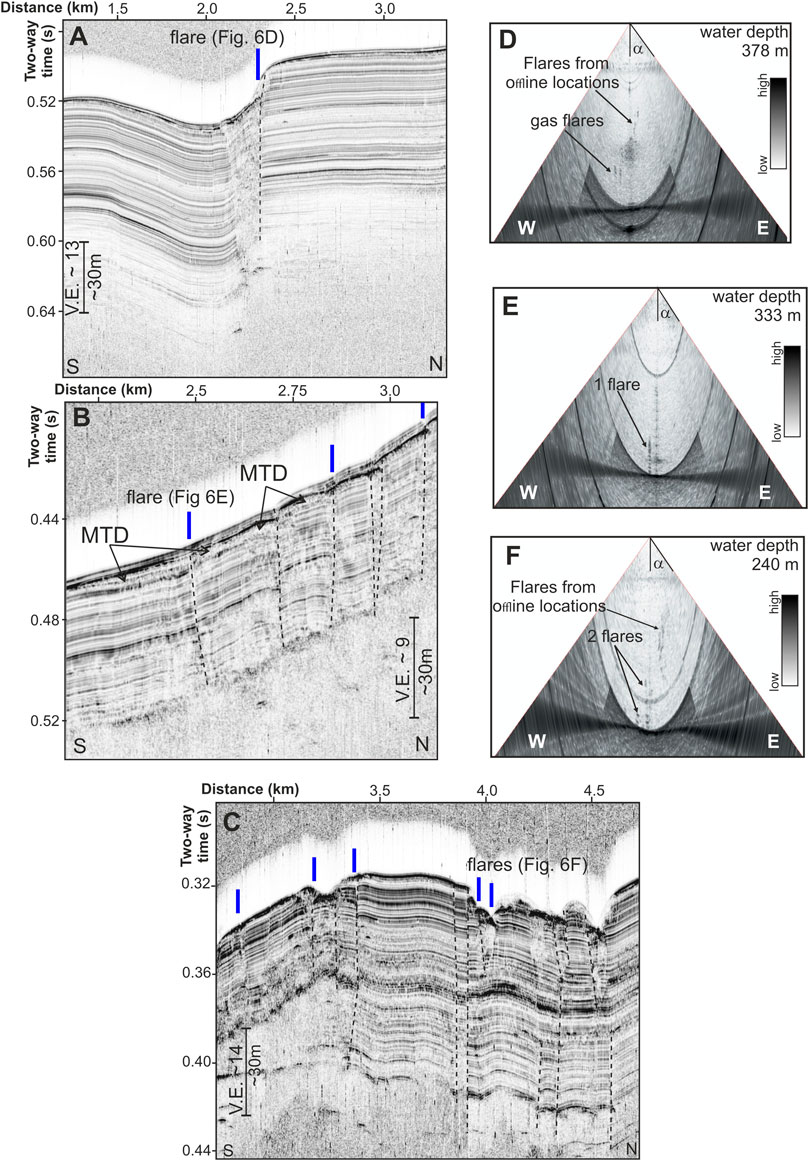
FIGURE 6. Sub-bottom profiler showing (A) ∼20 m vertical offset at E-W trending normal fault, (B) mass-transport deposit (MTD) sluffed off the canyon wall creating high seafloor backscatter although it is covered by 3–5 m thick sediment drape, and (C) fault-related erosional gullies (elongated depressions) on top of the N2 canyon plateau. Location of gas venting sites are shown as vertical blue lines. Selected faults are indicated by dashed black lines. (D–F) Examples of gas flares from the EM710 water column data. Beam-opening angle α is 60°.
Prominent normal faults in this region frequently split laterally into smaller sub-faults (Figure 7A) often only few 10 s of meters apart. They appear in multibeam bathymetry data as lineaments with a small depression. The backscatter return is higher than background along the entire fault traces. Gas vents are seen along these fault traces that are as narrow as 15 m (Figure 7B) but cut the entire sediment package imaged by the sub-bottom profiler (Figure 7C). At some locations along these faults, gas venting forms semi-circular pockmarks, mostly on elevated topographic features (Figure 7A).
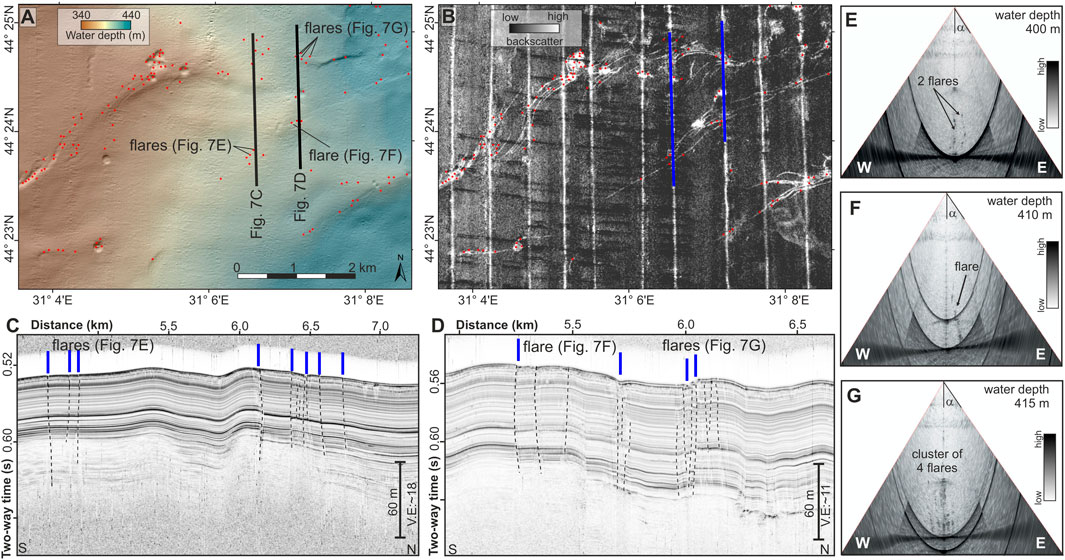
FIGURE 7. Normal faults in the region of the N2-channel system show branching into several smaller sub-faults as seen in (A) the multibeam bathymetry and (B) as high seafloor backscatter return. (C) Sub bottom profiler data (black/blue line in (A,B)) show small-offset faults (black dashed lines) cutting the entire sediment sequence. Gas seepage shown as red dots in (A,B) correlate to the fault location as shown by blue lines in (C,D). (E–G) Examples of gas flares from the EM710 water column data. Beam-opening angle α is 60°.
Sediment Wave Patterns and Elongated Depressions
The multibeam data reveal a smooth but regularly undulating topography in many regions of the study area (Figure 8), that may be described as “hummocky terrain” and was previously interpreted as sediment wave crests (Riboulot et al., 2017). Elongated depressions that develop between crests are narrow with steep edges and the depressions are linked to sub-seafloor faulting penetrating at least 100 m (Figure 9). These features are associated with gas discharge and occur in a predominant direction (10°–25° clockwise from North) following the overall orientation of crests (Figure 8). We observe a progressive evolution in these features. In deep water depth (∼500 m) the depressions start as thin sinusoidal lineaments on the seafloor (Figure 8A) linked to individual small-offset faults (Figure 9A). The fault offset itself is often below the resolution of the acoustic data but reflectivity is characteristically reduced (or blurred) at the fault location itself in a cone-shaped pattern. In shallower water (300–400 m) the depressions widen and deepen with each depression including several of these small-offset faults. Gas accumulation in the subsurface is generally identified by increased seismic or acoustic reflection amplitudes. Focusing of the gas is controlled by the topography, where gas accumulates underneath the crest (Figures 9C,D), but upward migration is facilitated by faults at the knick-point between neighboring crests. Seafloor backscatter is high along the small fault patterns and in the depressions, not only where gas is seen escaping at the seafloor (Figure 8B). Gas venting along the elongated depression continues across head-scarps into the region of mass wasting.
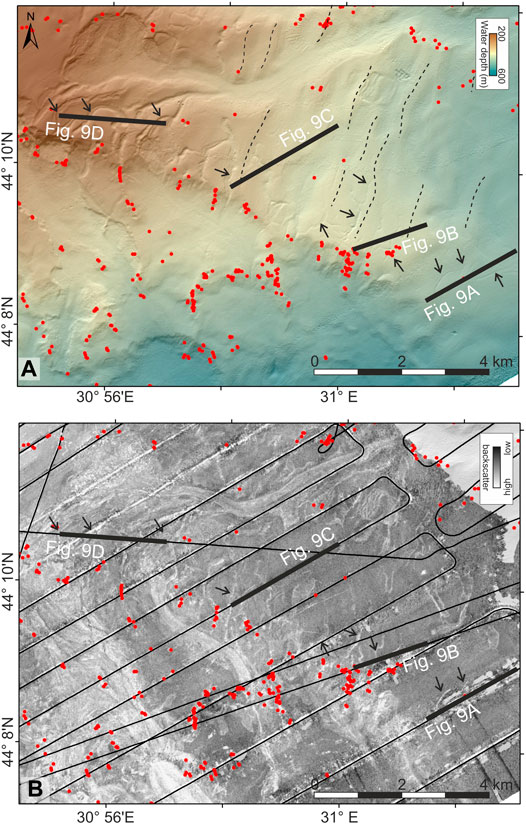
FIGURE 8. Example of the seafloor morphology in a region with old sediment-wave crests (now draped) creating sub-seafloor pathways for upward migrating gas (red dots are seep sites). (A) multibeam bathymetry and (B) seafloor backscatter. Dotted lines in (A) are some examples of the old wave-crest outline. Solid black lines are sections of sub-bottom profiler data shown in Figure 10.
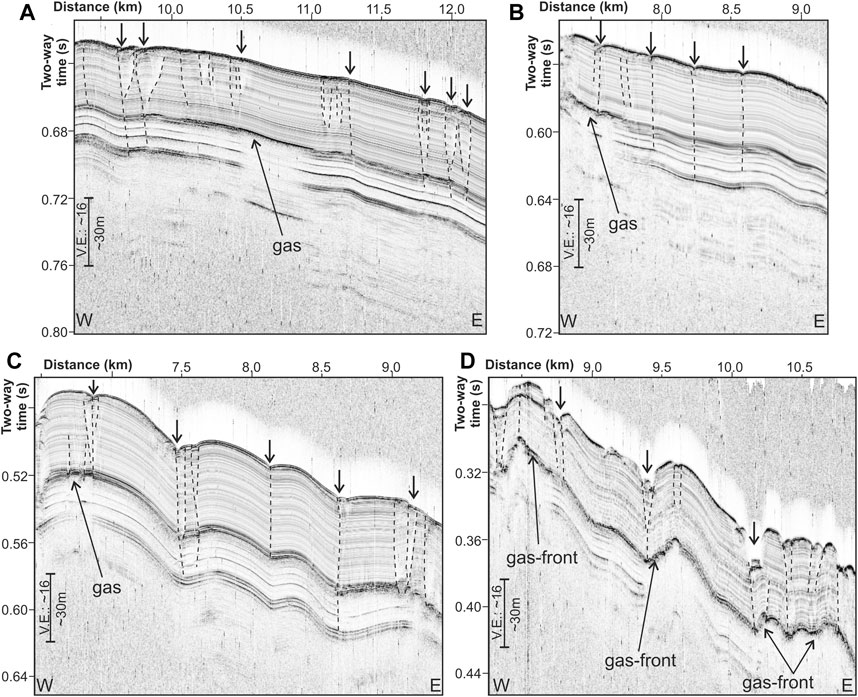
FIGURE 9. Examples of sub-bottom profiler data showing evolution of elongated depressions (marked with arrows) and faults (black dashed lines). (A) In deeper water the fault-offsets between adjacent sediment layers are below resolution limit of acoustic data and acoustic reflectivity is only blurred or generally decreased, (B) upward migrating gas creates slightly larger seafloor depressions, (C) several faults merge and, (D) create wider elongated depressions.
Low-frequency airgun seismic data with coincident high-resolution sub-bottom profiler data are available for only a sub-region of the zones with elongated depressions and crests. The seismic data show a deeper set of sediment waves now covered in parts by an MTD that levels out the paleo (initial) sediment wave topography (Figure 10). The old sediment wave structure and MTDs are both subsequently draped by a relatively homogenous sediment package of ∼30 m thickness. Gas has migrated upward and accumulates in the crests creating local bright spots and velocity-reduction related sags underneath. In some instances, this gas has been able to migrate through the MTD and accumulates at the top of the MTD layer. Gas seeps out at the seafloor only where gas has accumulated at greater depth and migration to the seafloor is facilitated by a set of small-offset faults that are imposed by the rough topography of the MTD into the veneer of layered sediments.
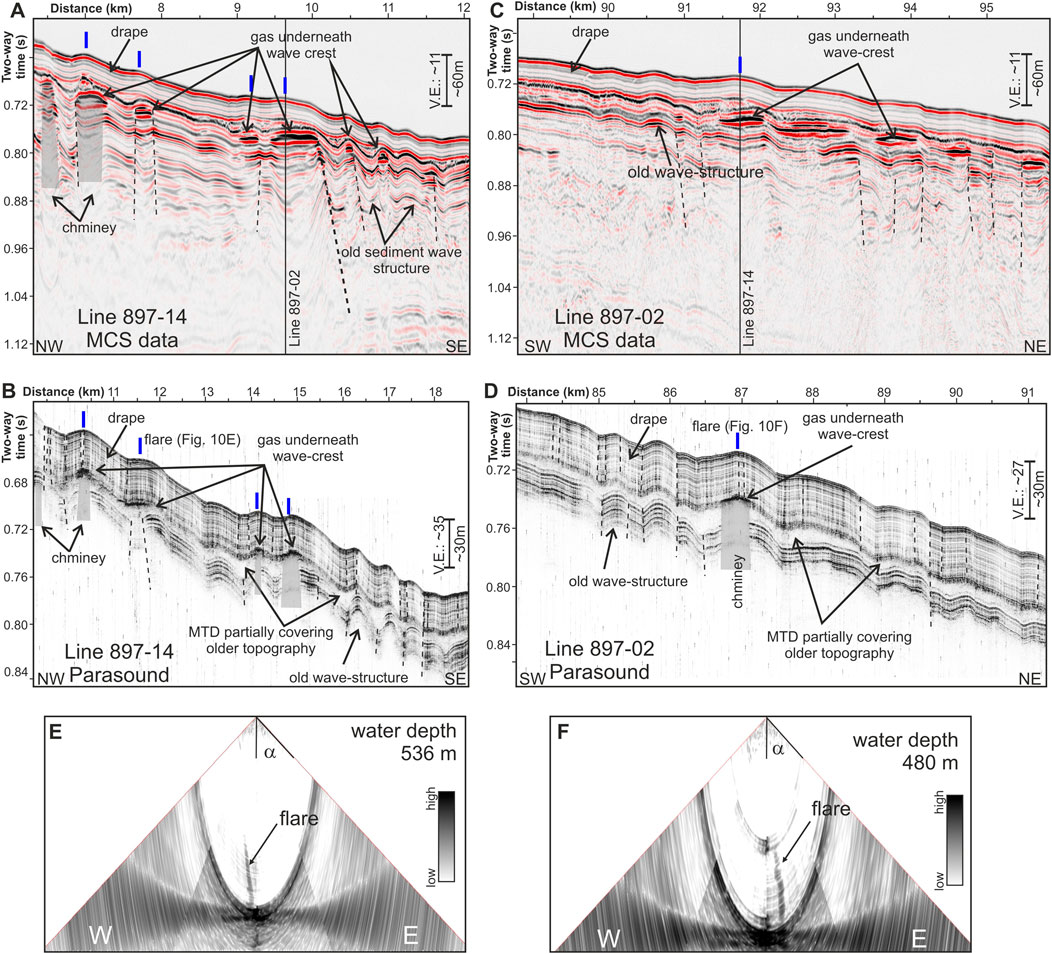
FIGURE 10. Examples of airgun multichannel seismic data showing deeper (older) sediment-waves structure, that are draped by the veneer of sediment imaged in sub-bottom profiler data. (A,B) are coincident along line 897–14, (C,D) are coincident on line 897–02. Gas accumulates underneath the wave crests and in part penetrates the mass-transport deposit (MTD). Gas venting (vertical blue lines) occurs at the seafloor where upward gas migration from the lower accumulation is facilitated by small-offset discontinuities (faults) in the overlying veneer (drape) of layered sediments. These faults (black dashed lines) are created from the rough topography of the MTD. (E,F) Examples of gas flares from the EM122 water column data (expedition MSM34). Beam-opening angle α is 60°.
Mass-Transport Deposits
Large-scale MTDs occur at several locations (Figure 11). The MTDs are characterized by a chaotic to transparent seismic reflection pattern and the absence of any clear layering. The lower boundary can be either conformable to the underlying strata, or irregular and incised into them. The upper boundary is often irregular and lacks a coherent reflection. MTDs show a positive impedance contrast at the top, but a negative impedance contrast at the base (Riedel et al., 2020), which indicates that they are of denser material than the surrounding sediment layers. One could infer that the MTDs are therefore less permeable than hemipelagic sediments (as e.g. described by Hillman et al., 2018a). These MTDs almost all originate at erosional head-scarps at the slope edge in water depths ∼120–200 m. The MTDs cover deeper sediment-wave topography but their own rough surface still impacts gas migration. The rough topography from small-scale heterogeneities results in a fault-like pattern in the sediment drape which can be locally exploited for gas migration (Figure 10B). Where the MTDs are only covered by recent post-glacial Holocene sediments and are buried by 3–5 m of sediment at most, we observe no gas venting at all (marked as Regions 1 – 3 in Figure 11).
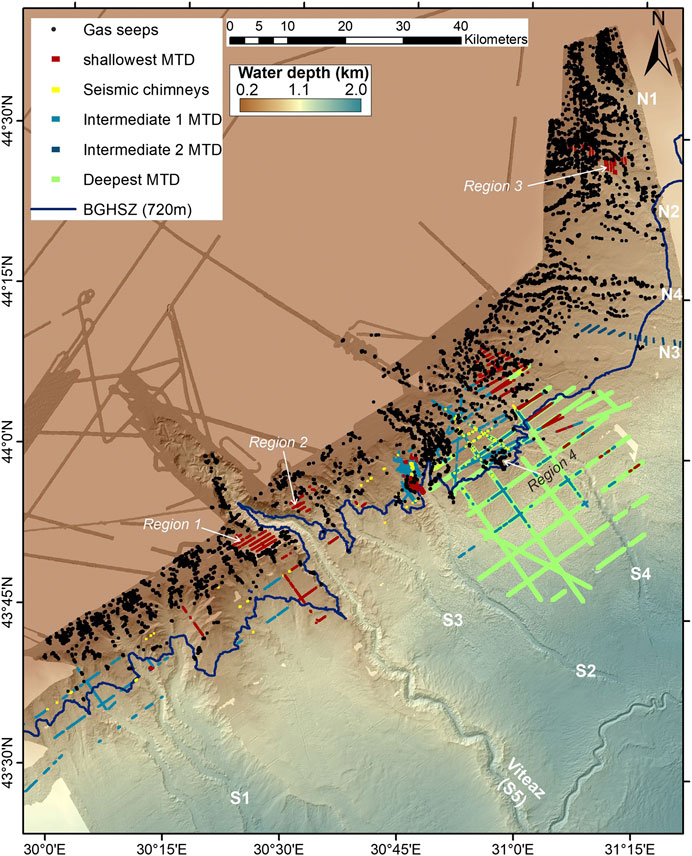
FIGURE 11. Overview of mass-transport deposits (MTDs) within the uppermost ∼100 m below seafloor correlating to occurrences of gas vent sites. Three regions devoid of vents are linked to recent mass-transport deposits and seafloor failure (Regions 1–3). In the central region between the S2 and S4 channel, up to three MTDs are stacked. Here, the highest density of seismic chimneys (vertical columns of gas accumulation, Hillman et al., 2018a) are observed (Region 4).
Pockmarks
More than 340 individual pockmarks, typically 40–50 m wide, occur unevenly distributed in the study area. Pockmarks are only seen east of the S2 channel (30° 46′E) and are most abundant around the upper canyon-segments of the S4, N3, and N4 channels in water depth <480 m. Most of these pockmarks are semi-circular depressions and several of these features merged into larger elongated depressions. The pockmarks often cluster and occur in chains along structural highs or morphological features such as canyon walls (Figure 12A). Within this type of pockmark occurrence, the largest pockmarks are up to 350 m in diameter (measuring the width of the depressions). Gas venting is constrained to the outer rims of the pockmark, but given the uncertainty in the location of an individual vent (25–50 m), no clear correlation in vent outlet to pockmark morphology can be defined. Not all pockmarks have shown active gas discharge at the time of data acquisition but our backscatter data show that these structures usually are associated with high backscatter indicative of gas-rich sediments (Figure 12B). The typical structure of these pockmarks shows doming at the rim and a central depression (10–20 m deep) from where material has been eroded (Figure 12C). The pockmark and surrounding topographic ridges also show normal faulting, all promoting upward gas migration.
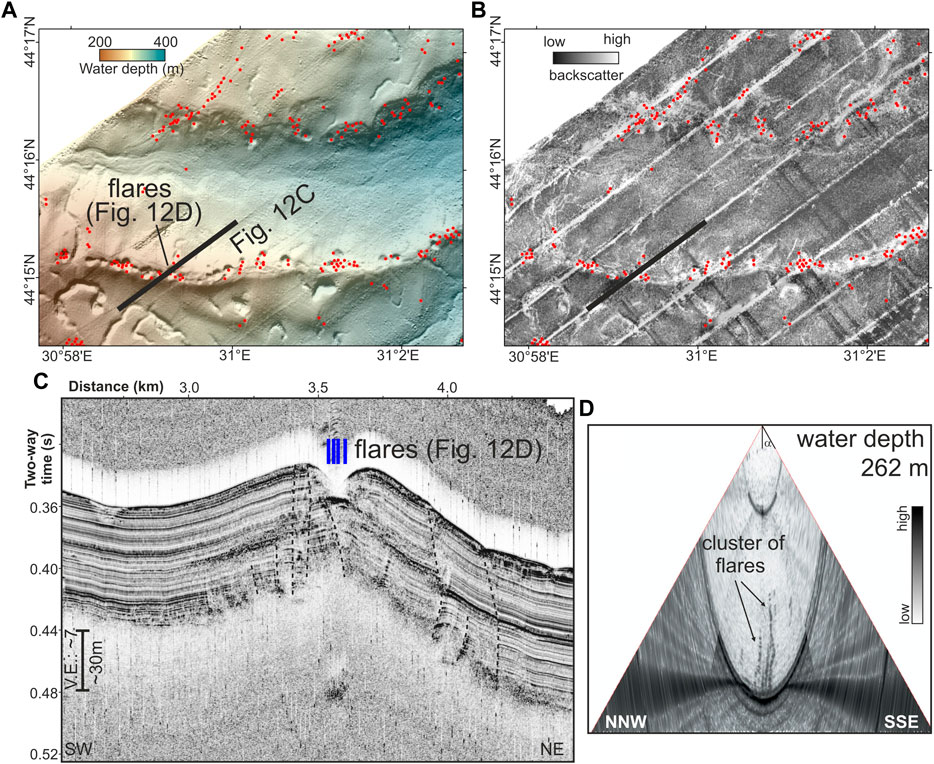
FIGURE 12. Examples of pockmark-chains along ridges and canyon wall at the upper-slope portion of the N4 channel: (A) multibeam bathymetry and (B) seafloor backscatter. Structural focusing of gas migration toward the highest elevation creates gas outlets on top of the ridges. Additional gas venting comes from faulting associated with seafloor instabilities and slumping at the canyon walls. The sub-bottom profiler data (C) show small offset faults (black dashed lines) around a pockmark and that sediments are removed from the central portion of the (circular) depression. (D) Inside the pockmark several gas vents are seen in the EM710 water column data. Beam-opening angle α is 60°.
Some pockmarks occur isolated and are not associated to underlying topographic highs (Figure 13A). These are also the largest pockmarks seen and their diameter can be up to 1000 m. A characteristic feature of these pockmarks is the occurrence of ring-faults that also show high backscatter (Figure 13B). Gas venting is strictly associated to the ring faults although gas is seen trapped in sedimentary layers everywhere underneath the pockmark. Although free gas occurs within these sediment layers, concentration may not be high as acoustic wipe-outs masking deeper sediment stratigraphy are not created. The inner depression of these pockmarks is only ∼5 m deeper than the surrounding topography and no erosion has removed any of the sediments (Figure 13C). The isolated pockmarks are, however, linked to larger fault-segments (Figures 3D, 13B) that often can be traced over several kilometers.
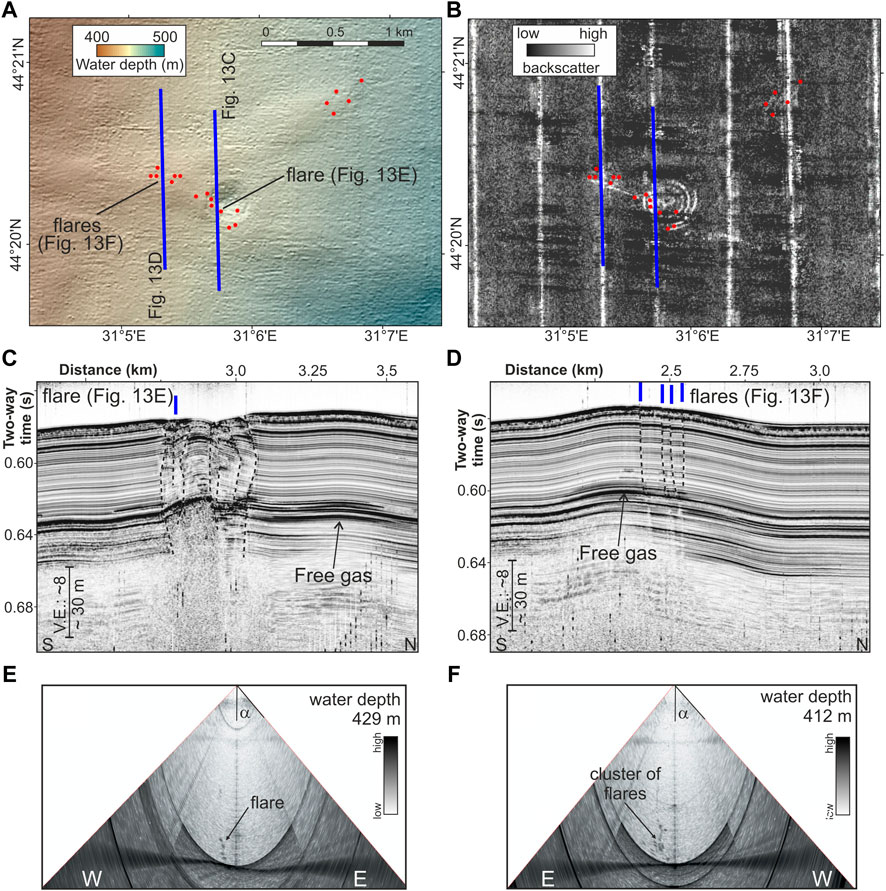
FIGURE 13. Example of ring-faults around isolated pockmarks. (A) Multibeam bathymetry, (B) seafloor backscatter, with gas seepage shown as red dots. Blue lines indicate location of sub-bottom data shown in (C,D). A nearly E-W trending fault cuts the pockmark and is identified by high backscatter signal along which gas escape is seen NW of the pockmark, tightly linked to small-offset fault-branches. Black dashed lines on sub-bottom profiler data show faults. (E,F) Examples of gas flares from the EM710 water column data (expedition MSM34). Beam-opening angle α is 60°.
Shelf Region With Highest Gas Flare Occurrence
Dense clusters of gas vents on the shelf in water depths <150 m were observed in the western-most portion of the study region (Figure 14). Here, gas flares are associated with a characteristic speckled backscatter signal of the seafloor. Gas detection from the water column multibeam data is often limited to a small region long the track line but the backscatter data reveal a wide-spread occurrence of the speckled high-amplitude seafloor backscatter intensity. Sub-bottom profiler imaging reveals a veneer of layered sediment draping an erosional unconformity (Figure 14C) of a former anticlinal structure. Free gas is seen in the sub-surface sediments from numerous small pockets of high amplitude reflections that sometimes merge into continuous gas-fronts acoustically masking underlying structures. The clusters of gas venting and high backscatter speckles at the seafloor are associated with topographic variations on that unconformity, in particular where dipping strata crop out at the unconformity.
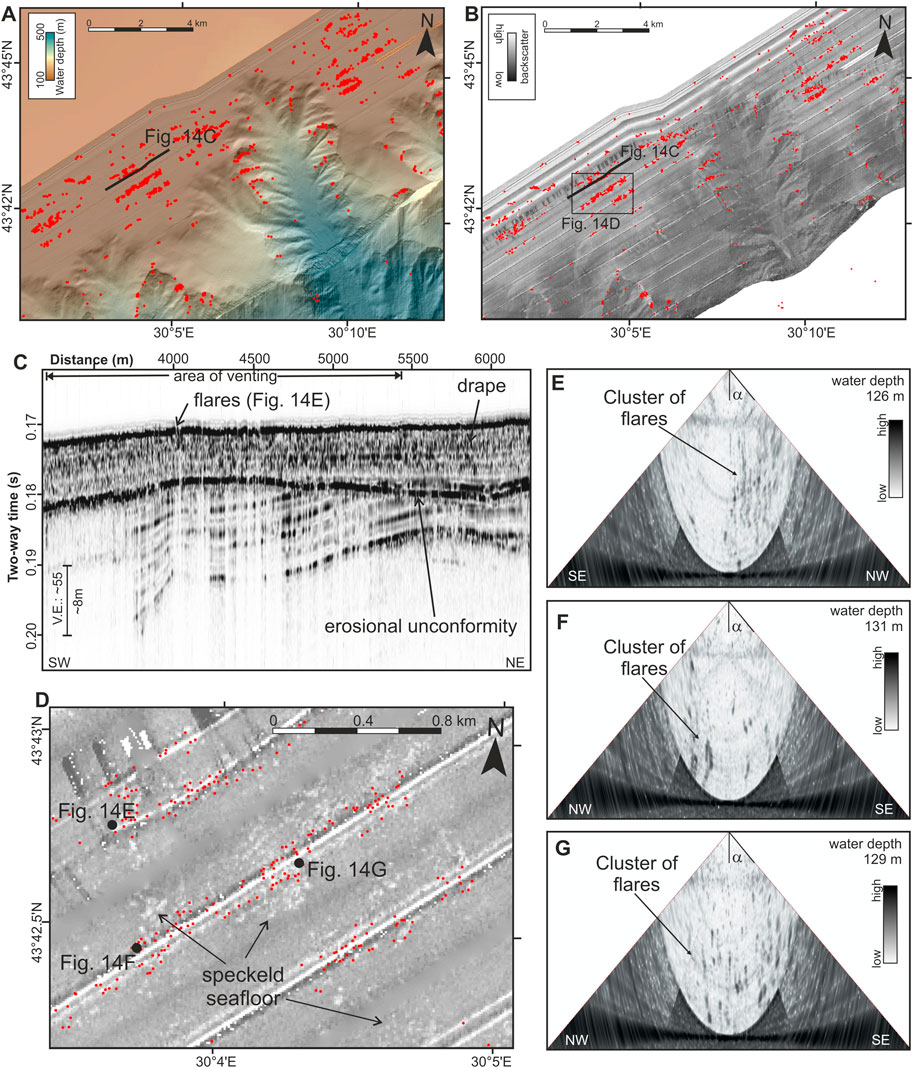
FIGURE 14. Examples of gas vent occurrences (red dots) along the western portion of the shelf region in our study area. Shown are (A) water depth, and (B) seafloor backscatter near the S1 channel head. (C) The sub-profiler data reveal a drape of post-glacial sediments (∼10 m thick) above an erosional unconformity. Here, the gas flares are occurring in dense clusters that also can be seen in the backscatter data as high-amplitude patches, described as speckled seafloor (D). (E–G) are examples of EM710 multibeam data showing abundant gas flares in the water column above the speckled seafloor.
Seismic Chimney Structures
Some of the gas accumulations are forming structures called seismic chimneys (e.g., described previously for our research region by Hillman et al., 2018a), with a high-reflectivity top and semi-vertical acoustic wipe-out underneath (Figure 10). More than 50 of these chimneys have been detected in the seismic and sub-bottom profiler data to date. They occur along the slope only in the region up to the S4 channel system (Figure 11). No such vertical chimneys are seen further to the east linked to channels N1–N4. Examples of chimney structures seen in the region are included in Figure 10.
Step-wize Top of Gas Reflection
In many cases the occurrence of free gas is creating a diffuse front in the acoustic sub-bottom profiler data (see e.g., Figures 6A,B or 9 days). Acoustic imaging beneath such a gas front may be limited (reduced reflectivity) or completely masked. Free gas within the sediment can also create isolated bright spots or enhance the reflectivity of individual reflectors for some distance without diminishing acoustic penetration (e.g., Figures 3D, 13C). A different observation of free gas occurrence in layered sediments can be made across topographic changes. Here, the top of free gas is mimicking seafloor topography, but still appears to be discretely bound to individual sedimentary layers creating a step-wize pattern (Figure 15). This bottom-simulating nature is best observed across larger topographic changes and when the acoustic data is acquired up/down slope. The free gas enhances the acoustic reflectivity of a given sediment layer at a critical depth (Figure 15). The layer remains acoustically bright for some distance before returning to a normal reflectivity as seen elsewhere along the profile. Several bright reflections can be stacked on top of each other (Figure 15B).
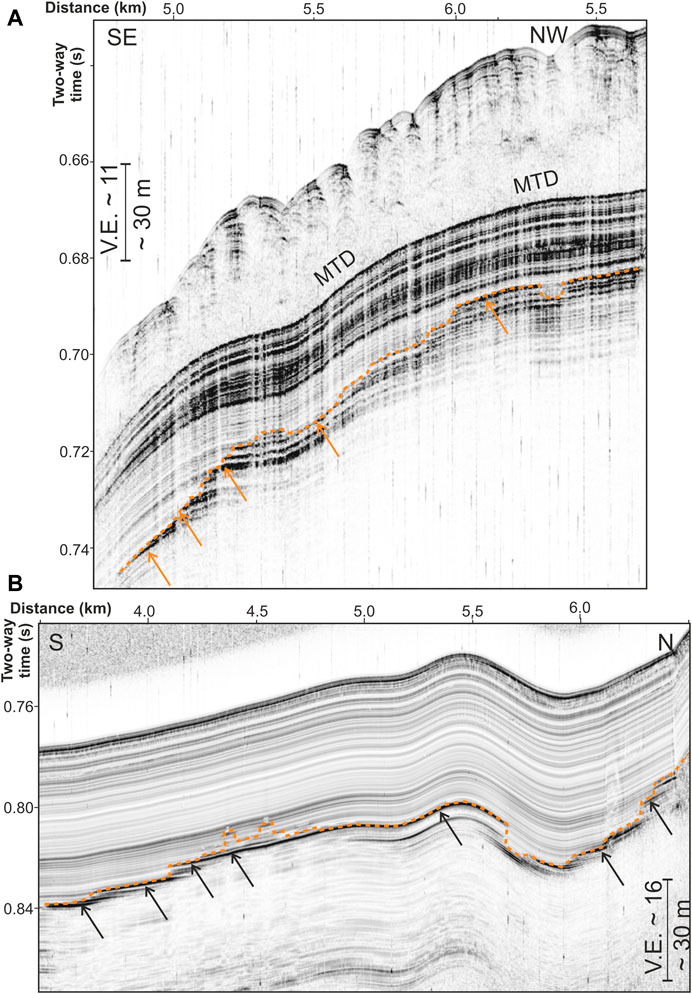
FIGURE 15. Two examples of free gas in sediments enhancing the layer’s reflectivity without creating gas-masking. (A) Example near the S2 channel, (B) example from the eastern study region around the N2 channel. The free gas occurrences are marked by an increase in reflectivity (orange arrows and dotted line) of individual layers. As seafloor depth decreases, the top of free gas jumps to the next shallower sedimentary layer without forming a continuous (diffuse) gas front as observed in other locations (compare to Figure 14D). This bottom-simulating nature is explained by the pressure and temperature dependence of methane gas solubility (see Supplementary Figure S1 for schematic functions). The mass-transport deposit (MTD) seen in (A) is also mapped across the region (compare to Figure 11, referred to as intermediate MTD 1).
Discussion
Combining data from several research expeditions, we identified >10,100 individual vent sites within the Romanian and Bulgarian margin linked to the Danube deep-sea fan and eastern extension to the Dnepr fan (up to the Ukrainian exclusive economic zone). Gravity coring and gas sampling indicate that the gas may originate from in situ microbial production or from deeper (upward migrating) biogenic sources. Deep drilling in 2017 (Bohrmann, 2018) also showed little amounts of thermogenic gases and methane was the dominant gas sampled in sediments of the upper ∼150 mbsf (Pape et al., 2020). Thus, all references made to gas hydrate stability are for a methane-only structure I gas hydrate system.
Separation of Bottom-Simulating Reflector and Gas Venting
The limitation of gas vents to water depths above the depth-limit of the GHSZ at ∼720 m water depth (Figure 1) was previously discussed as primary controlling factor in the occurrence of gas vents (e.g., Riboulot et al., 2017; Hillman et al., 2018a). Two prominent exceptions of gas vents in water depths >720 m were identified. These two locations are associated with shallow sub-surface gas hydrate occurrences (Figure 2). Gas venting may here be linked to deeper-rooted gas-migration pathways that can circumvent the GHSZ-limit by advection of warm-fluid, thus locally creating a warped GHSZ as e.g., described at vent systems in the Gulf of Mexico (Macelloni et al., 2015) or Lake Baikal (De Batist et al., 2002). Alternatively, larger fluid-pressure may lead to sediment fracturing and release of gas to the seafloor (e.g., Daigle et al., 2011; PaullCaress et al., 2015).
The 720 m isobath is also strongly correlated to the onset of the BSR in seismic data. Several previous BSR-distributions were proposed (Popescu et al., 2006; Baristeas, 2006; Haeckel et al., 2015; Zander et al., 2016) as summarized in Figure 1C. All these previous analyses are in general agreement with each other but differ slightly from our new interpretation. All previous maps seemingly interpolated occurrences across regions of clear BSR absences, especially between the eastern levee of the S1-channel and western levee of the Viteaz channel. The absence of a BSR reflection or amplitude truncations at the BGHSZ is an important indication for the general absence of free gas in the system, either due to a lack of in situ microbial production or advection of gas from below. The BSR correlates with the 720 m isobath and no discrepancies exist between a theoretical GHSZ and seismic observations. Previously, apparent discrepancies were discussed by Riboulot et al. (2017) and explained by a possible evolution of the degassing zone between individual expeditions (spanning >10 years) or differences in the data analyses (acoustic gas flare detection vs. seismic data acquisition). Yet, the discrepancies most likely resulted from optimistic interpolation of sparse data.
The BSR is generally interpreted to be the seismic expression of the BGHSZ and mark the onset of free gas below hydrate-bearing sediments (e.g., Spence et al., 2010). Thus, the nearly complete regional separation of BSR and gas vent occurrences indicates that gas hydrate may form a seal for upward migration of gas. In regions with gas hydrate occurrences, gas migration may be deflected and occur more horizontally along the BGHSZ up to the upper depth limit of gas hydrate stability in ∼720 m water depth. From this location onwards into shallower water, gas can then also migrate upwards along structural pathways and form vents at the seafloor. Alternatively, the separation of the BSRs and vent sites may indicate that any free gas that migrates upwards from greater depth is not deflected horizontally at a hydrate-permeability boundary but is instead incorporated into the sediment pore space either by forming additional gas hydrate or being dissolved in the pore water if the system is undersaturated relative to methane.
Structural and Sedimentological Controls on Gas Vent Distribution
Additional controls on venting by canyon erosion and slope failure head-scarps exposing gas-bearing sediment layers or providing structural focusing for gas migration were previously discussed by Riboulot et al. (2017) for the Danube deep-sea fan region or by Naudts et al. (2006) for the Dnepr fan system. However, several intriguing observations in our new data warrant some additional explanations.
Buried Sediment Waves
The depositional history of the study region has a much larger impact on the occurrence of gas venting than previously thought. Sediment waves associated with channel-levee systems are seen along all major channels where not removed by mass wasting events. We can observe the sediment wave pattern in MCS data up to a depth of ∼250 mbsf (Figure 10A) although MCS data coverage is not uniform across all regions mapped and some gaps in observations exist. The observations shown in Figure 10 act as type-example for the other occurrences and linkages of sediment waves and patterns of gas migration and gas venting at the seafloor. The paleo sediment wave topography defines a structural control (trap) for gas accumulations at depths of typically 60–80 mbsf (Figure 10A). The old topography has only partially been leveled out by MTDs and was subsequently draped by a veneer of layered sediments leaving a remaining morphology on the current seafloor. That residual wave-like pattern influences the development of faulting (ultimately, they merge and develop into larger elongated depressions) and thus the location of gas discharge at the seafloor.
Mass Transport Deposits
Large scale MTDs occur in the study area (Figure 12) and were proposed to act as an impermeable barrier (Hillman et al., 2018a). However, the rough topography of an MTD and associated small-scale heterogeneities create a fault-like pattern in the sediment drape which can be locally exploited for gas migration (Figures 1D, 11B). There are incidences, where gas has clearly pierced through the entire MTD (see e.g., Figure 13; Region 4 marked in Figure 12). Since the piercements of MTDs by gas all occur within much older (deeply buried) MTDs, the gas may have had more time to accumulate and thus create sufficient pressure to overcome an impermeable barrier imposed by the MTD. This may explain the notable cluster of seismic chimney structures in a region of wide-spread MTD occurrence (Region 4 in Figure 12).
Where the MTDs are only covered by recent (post-glacial) Holocene sediments and are buried by 3–5 m of sediment at most (Figures 4, 6), we observe no gas venting at all (e.g., Region 1–3 marked in Figure 12). This may be the result of the MTD acting as a permeability barrier. Another reason for the absence of gas vents at locations of the youngest MTDs may be that gas-rich sediments were simply removed. Thus, gas may have escaped during the failure and there was not enough time since the failure and new deposition to accumulate new gas that could then overcome the permeability barrier of the MTD.
Faulting
Around the N1 and N2 channel systems we identified abundant mostly E-W oriented normal faults, all strongly associated with gas seepage. This region lies within the tectonic realm of the Histria Depression (e.g., Dinu et al., 2005). The latest sequence of sediment deposited in the region of these two channels are of Miocene age (referred to as Pontian deposits by Dinu et al., 2005) and are described as being highly affected by normal faults that are either controlled by extension or differential compaction within the thick sediment wedge. Thus, the normal faulting we observe may be linked to those large-scale tectonic fault patterns in the Western Black Sea.
The faulting imaged around the N1 and N2 channels is characteristically associated with high backscatter intensity on the seafloor along the often only 15 m wide individual fault traces (e.g., Figures 5, 7B). Gas vents are seen tied to the fault traces at some locations. We therefore interpret the high backscatter signal to reflect generally abundant gas within the sediment. Gas venting may be episodic in time and therefore venting is not always seen when faults were crossed. This close association of faults with high seafloor backscatter intensity and venting is highlighted at the ring-faults around pockmarks (Figure 13).
A similar association of gas in sediments and high backscatter intensity along small faults is seen at the region of elongated depressions (Figure 8). However, here, the faults are not primarily a result of a large-scale tectonic stress regime, but linked to patterns within a sediment drape deposited above paleo-sediment wave crests.
The Shelf Region
Along the shelf portion of the study area imaged, the highest density of gas flares is seen (depth-bin from 110–135 m, Figure 1D) but here, seafloor is mostly flat with no obvious erosional cuts from channels or canyons or faulting (Figure 14). However, the sub-bottom profiler imaging revealed that the flat seafloor with apparently no structural features visible is a result of a homogenous drape of post-glacial sediment above an erosional unconformity. The thickness of the drape and layering within it varies along the region but it is not controlling the gas occurrences. The gas venting activity across the shelf is best visualized by the speckled nature of the seafloor in the backscatter data. Although we could not image gas flares in the water column across all of the individual patches (in part due to the beam-angle limits of the EM systems or weather state), whenever we saw a gas flare in the water column, it corresponds to a patch of high backscatter with a 1:1 correlation. Therefore, we interpreted all these features to be gas vent outlets. The sub-region shown in Figure 14D alone with an area of ∼3.5 km2 hosts a total of 250 gas flares from the water column data analysis and about half of the seafloor is marked by high-amplitude speckles in the backscatter image. The area most affected by gas venting matches regions where the sub-bottom profiler data show dipping strata eroded at the unconformity. From those crop-out locations gas migrates through the drape (mostly vertical) to the seafloor. As no faulting was identified on the shelf associated with the speckled seafloor, gas may be able to migrate through the drape of sediments simply by its own buoyancy as the supposedly high-porosity sediments (no cores available) are not forming a permeability barrier. Although we lack direct age control, it is likely that the drape of sediments is younger than the LGM and represents the depositional history since sea-level started to rise after the last glaciation. Thus, gas venting is controlled by the paleo-seafloor structure and not recent processes.
From these observations, we propose that most gas venting seen at the seafloor may be from a deeper source that has seen some distance of upward migration (though it still is of microbial origin) and not from in situ production.
The general shelf to deep-water trend of reduction in the number of gas flares (Figure 1D, also noted by Naudts et al. (2006) in the Dnepr fan region) may be linked to the distance to source of organic material (river input). Additionally, it may be associated with an overall change in sediment grain size, with finer material in deeper water creating a less permeable layer (veneer) that requires hydro-fracturing where simple gas buoyancy is insufficient.
The fact that apparently most gas venting is seen on the shelf adds to other studies world-wide (e.g., Schmale et al., 2005; Shakhova et al., 2010; Borges et al., 2016; Ruppel and Kessler, 2017; Johnson et al., 2019) proposing that gas emission on continental shelf regions are a significant contributor of methane to the atmosphere as gas is not fully consumed or dissolved into the ocean on its path through the water column.
Temperature and Pressure Control on Solubility
The gas occurrence within the sediments is further controlled by gas solubility (general dependencies of solubility with pressure and temperature are shown in Supplementary Figure S1). Where no advection from below adds methane to overcome the solubility threshold, free gas can only form when temperature and pressure conditions are allowing free gas bubbles to form. In this depth interval above the GHSZ, we deal with a two-phase system (salt-water and gas) only (Riboulot et al., 2018; Ker et al., 2019). Below a depth of ca. 20 mbsf, we observe low pore-fluid salinities near 3-4 with little variation with greater depth (Bohrmann, 2018; Riedel et al., 2020). Salinity increases toward the seafloor to the average value of ∼22 of the Black Sea water body (Özsoy and Ünlüata, 1997). If temperature increases with sub-seafloor depth, solubility is reduced (at constant hydrostatic pressure) and free gas bubbles can form assuming the same in situ methane concentrations. If pressure increases, more methane can be dissolved in the pore water, thus free gas bubble formation is prohibited.
The bottom-simulating nature of the depth of the top of free gas in sediment layers and its lateral change is likely the result of this dependency of gas solubility on temperature and pressure. Following e.g., a specific layer from greater water depth (at constant burial below seafloor, thus same sub-seafloor temperature and salinity), hydrostatic pressure slowly decreases along this layer until free gas bubbles can form. Similarly, when following a layer to deeper water, gas solubility decreases until free gas content becomes too low to be imaged at this sub-seafloor depth and the apparent top of free gas jumps to the next layer at greater depth where temperatures are higher (Figure 15). Gas solubility can be further limited by pore-shape and capillary effects, which are grain-size and pore-shape dependent. Those effects would ride on top of the main pressure/temperature (P/T) controls and could locally modify the top of free gas. However, without additional sediment grain size information, no further explanations to this effect can be given and the step-wize and semi-bottom-simulating nature of the top of free gas is well explained with the main P/T effects on solubility. We observe this behavior mostly in sub-seafloor depths of 30–50 m. At these depths, in situ salinity is around 3–4, sub-seafloor temperature may only be ∼1 °C warmer than at the seafloor given regional thermal gradients measured (Hillman et al., 2018a). With drastically changing salinity toward the seafloor, no clear bottom-simulating effect may be created at shallower sub-seafloor depths in shallower water.
Concluding Summary
Gas venting has been observed along several portions of the continental margin of the Black Sea region from offshore western Bulgaria (e.g,. Xu et al., 2018) to the Romanian sector (Riboulot et al., 2017) of the Danube deep-sea fan, as well as offshore Crimea (Naudts et al., 2006) and the Kerch peninsula (e.g,. Römer et al., 2019). Our new study using newly collected data off Bulgaria and Romania closes a gap between previously mapped regions and complements previous work and augments the knowledge of the structural and sediment depositional control on gas migration. While confirming the observations and conclusions made by previous researchers especially on the general limitation of gas venting to shallower water depths above the GHSZ outcrop at ∼720 m water depths, we show additional controls on gas migration and gas vent formation at the seafloor. Three levels of additional control were identified:
1) A first-order control is governed from sediment depositional styles and character that has imposed a specific topography of sediment waves linked to channel and levee systems. Gas accumulates beneath sediment wave crests (forming a structural trap) after migration from the deeper subsurface. Further migration to the seafloor and venting is facilitated through small-scale sediment heterogeneities. Mass-transport deposits level out some of the deeper (initial) sediment-wave topography but seem not to impose a strict permeability barrier for upward gas migration. In regions of shallow MTDs with <5 m burial depths gas venting is absent. Large-scale tectonic normal faulting with offsets visible at the seafloor also sets a general pattern for upward gas migration as seen in particular in the north-eastern portion of the study region that is associated to the Dnepr fan system.
2) A second-order control is from seafloor-shaping processes such as canyon formation and slope failures cutting through the drape of the uppermost 100 m of sediment. Here, gas migration is promoted from local removal of sediment and exposure of permeable strata at outcrops.
3) A third level of control is given by small-scale faulting (meter to sub-meter scale) that provides pathways for further upward gas migration from deeper accumulations. In all instances, we observe normal faulting either from the large-scale tectonic regime or from gravitational collapse and instability of the formations.
A chemical control on free gas (bubble) formation and occurrence within sediment layers that then may get further funnelled to the seafloor through structural controls is determined by the general temperature and pressure effect on methane solubility. Here, we observe a characteristic bottom-simulating gas charging (and associated enhanced acoustic reflectivity without an acoustic wipe-out) in sediment layers at depth of ∼30–50 mbsf.
Data Availability Statement
The multibeam seafloor and water-column acoustic data analyzed for this study can be found in the PANGAEA data base (https://www.pangaea.de/). EM122 bathymetry data for expedition MSM34 (https://doi.org/10.1594/PANGAEA.860486); EM122 raw data for expedition MSM34 (https://doi.org/10.1594/PANGAEA.894399); EM710 raw data for expedition M142 (https://doi.org/10.1594/PANGAEA.895530); EM122 raw data for expedition M142 (https://doi.org/10.1594/PANGAEA.895506); EM710 raw data for expedition M143 (https://doi.org/10.1594/PANGAEA.895497); EM122 raw data for expedition M143 (https://doi.org/10.1594/PANGAEA.895437).
Author Contributions
Detection of gas flare locations was done by MR, LH, and AB. SG and PW provided gridded multibeam bathymetry and backscatter data for expeditions M142 and M143. MR and LH conducted main analysis and interpretation of multibeam and PARASOUND data. Funding for expeditions from which data were used was obtained by JB and IK (MSM34), GB (M142), as well as JB and MR (M143). IK, JB, GB, and MR were chief scientists of expeditions MSM34/1, MSM34/2, M142, and M143, respectively.
Funding
Expeditions MSM34 and M142 were fully integrated into the German collaborative gas hydrate program SUGAR, which also provided the funding for scientific work of the cruise (BMWi 03SX20A, BMBF 03SX381F, BMBF 03G0819A, and 03G0856). Cruise MSM34 was further supported by project MIDAS (EU grant 603418). Additional funds came from the Bremen DFG-Research Center/Excellence Cluster “The Ocean in the Earth System”.
Conflict of Interest
The authors declare that the research was conducted in the absence of any commercial or financial relationships that could be construed as a potential conflict of interest.
Acknowledgments
The authors would like to thank all ship-crews, support staff, and scientific personnel involved in conducting ship-based work and analyses during expeditions onboard R/V Maria S. Merian (MSM34) and R/V Meteor (M142, M143).
Supplementary Material
The Supplementary Material for this article can be found online at: https://www.frontiersin.org/articles/10.3389/feart.2020.601254/full#supplementary-material.
References
Akhmetzhanov, A., and Falkenstein, B. (2017). The power of high-tech: unlocking the black sea’s potential, 336. Available at: https://oiljournal.info/en/content/nv/336/the-power-of-high-tech-unlocking-the-black-sea-s-potential/ (Accessed July 10, 2020).
Baristeas, N. (2006). Seismische fazies, tektonik und gashydratvorkommen im nordwestlichen schwarzen meer. Diploma Thesis. Hamburg: University Hamburg, 110.
Bialas, J., Klaucke, I., and Haeckel, M. (2014). GEOMAR Report No. 15. Fs maria s. merian fahrtbericht/cruise report MSM‐34/1 & 2–sugar site. Kiel: GEOMAR Helmholtz Centre for Ocean Research Kiel, 109 (Accessed January 5, 2021).
Bialas, J., Bohlen, T., Dannowski, A., Eisenberg-Klein, G., Gassner, L., Gehrmann, R., et al. (2020). Joint interpretation of geophysical field experiments in the danube deep-sea fan, black sea. J. Mar. Pet. Geol 121, 15. doi:10.1016/j.marpetgeo.2020.104551
Bohrmann, G. (2018). R/V METEOR cruise report M142, drilling gas hydrates in the danube deep-sea fan, black sea, varna–varna–varna, 04 november–22 november–09 december 2017. berichte, MARUM–zentrum für marine umweltwissenschaften, fachbereich geowissenschaften, universität bremen. Available at: http://publications.marum.de/id/eprint/3698 (Accessed January 5, 2021), Vol. 320, 121.
Bohrmann, G., Ivanov, M., Foucher, J. P., Spieß, V., Bialas, J., Weinrebe, W. R., et al. (2003). Mud volcanoes and gas hydrates in the black sea–new data from dvurechenskii and odessa mud volcanoes. Geo Mar. Lett 23 (3-4), 239–249. doi:10.1007/s00367-003-0157-7
Borges, A. V., Champenois, W., Gypens, N., Delille, B., and Harlay, J. (2016). Massive marine methane emissions from near-shore shallow coastal areas. Sci. Rep 6, 27908. doi:10.1038/srep27908 |
Caress, D. W., Chayes, D. N., and dos Santos Ferreira, C. (2017). MB-system: mapping the seafloor. Available at: http://www.mbari.org/products/research-software/mb-system/ (Accessed January 5, 2021).
Çifi̧, G., Dondurur, D., and Ergün, M. (2003). Deep and shallow structures of large pockmarks in the turkish shelf, eastern black sea. Geo Mar. Lett 23, 311–322. doi:10.1007/s00367-003-0138-x
Daigle, H., Bangs, N. L. B., and Dugan, B. (2011). Transient hydraulic fracturing and gas release in methane hydrate settings: a case study from southern hydrate ridge. G-cubed 12 (12), 12022. doi:10.1029/2011GC003841
De Batist, M., Klerkx, J., Van Rensbergen, P., Vanneste, M., Poort, J., Golmshtok, A., et al. (2002). Active hydrate destabilization in lake baikal, siberia ?. Terra. Nova 14 (6), 436–442. doi:10.1046/j.1365-3121.2002.00449.x
Degens, E. T., and Ross, D. A. (1974). The black sea–geology, chemistry, and biology Tulsa, USA: The American Association of Petroleum Geologists.
Dinu, C., Wong, H. K., Tambrea, D., and Matenco, L. (2005). Stratigraphic and structural characteristics of the romanian black sea shelf. Tectonophysics 410, 417–435. doi:10.1016/j.tecto.2005.04.012
Driscoll, N. W., Weissel, J. K., and Goff, J. A. (2000). Potential for large-scale submarine slope failure and tsunami generation along the U.S. mid-Atlantic coast. Geology 28, 407–410. doi:10.1130/0091-7613(2000)28<407: PFLSSF>2.0.CO;2
Duan, Z., and Mao, S. (2006). A thermodynamic model for calculating methane solubility, density and gas phase composition of methane-bearing aqueous fluids from 273-523 K and from 1 to 2000 bar. Geochem. Cosmochim. Acta 70, 3369–3386. doi:10.1016/j.gca.2006.03.018
Ergün, M., Dondurur, D., and Çifi̧, G. (2002). Acoustic evidence for shallow gas accumulations in the sediments of the eastern black sea. Terra. Nova 14 (5), 313–320. doi:10.1046/j.1365-3121.2002.00434.x
Freudenthal, T., Bohrmann, G., Gohl, C., Klages, J. P., Riedel, M., Wallmann, K., et al. (2020). More than ten years of successful operation of the MARUM-MeBo sea bed drilling technology: highlights of recent drilling campaigns. EGU General Assembly [Epub ahead of print]. doi:10.5194/egusphere-egu2020-5089
Freudenthal, T., and Wefer, G. (2013). Drilling cores on the sea floor with the remote-controlled sea floor drilling rig MeBo. Geosci. Instrum. Methods Data Syst 2 (2), 329–337. doi:10.5194/gi-2-329-2013
Ginsburg, G. D. (1998). “Gas hydrate accumulation in deep-water marine sediments,” in Gas hydrates: relevance to world margin stability and climate change Editors J.-P. Henriet, and J. Mienert (London, United Kingdom: Geological Society, London, Special Publications), Vol. 137, 51–62. Available at: https://sp.lyellcollection.org/content/specpubgsl/137/1/51.full.pdf (Accessed June 25, 2020).
Greinert, J., Artemov, Y., Egorov, V., De Batist, M., and McGinnis, D. (2006). 1300-m-high rising bubbles from mud volcanoes at 2080 m in the black sea: hydroacoustic characteristics and temporal variability. Earth Planet Sci. Lett 244 (1–2), 1–15. doi:10.1016/j.epsl.2006.02.011
Greinert, J., McGinnis, D. F., Naudts, L., Linke, P., and De Batist, M. (2010). Atmospheric methane flux from bubbling seeps: spatially extrapolated quantification from a black sea shelf area. J. Geophys. Res. Oceans 115, C01002. doi:10.1029/2009JC00538
Haeckel, M., Bialas, J., Klaucke, I., Wallmann, K., Bohrmann, G., Schwalenberg, K., et al. (2015). Gas hydrate occurrences in the black sea–new observations from the german sugar project Fire in the ice US department of energy (UD DoE) methane hydrate newsletter, (Morgantown, WV: NETL). Available at: http://oceanrep.geomar.de/30761/1/Haeckel%20et.al.pdf (Accessed July 10, 2020), Vol. 15, 6–9.
Haeckel, M., Zander, T., Burwicz, E., Bialas, J., Berndt, C., Dannowski, A., et al. (2017). “The gas hydrate system of the danube deep-sea fan in the black sea”, in 9th international conference on gas hydrates, Denver, CO, June 15–30, 2017 (Colorado School of Mines).
Hillman, J. I. T., Klaucke, I., Bialas, J., Feldman, H., Drexler, T., Awwiller, D., et al. (2018a). Gas migration pathways and slope failures in the danube fan, black sea. Mar. Petrol. Geol 92, 1069–1084. doi:10.1016/j.marpetgeo.2018.03.025
Hillman, J. I. T., Burwicz, E., Zander, T., Bialas, J., Klaucke, I., Feldman, H., et al. (2018b). Investigating a gas hydrate system in apparent disequilibrium in the danube fan, black sea. Earth Planet Sci. Lett 502, 1–11. doi:10.1016/j.epsl.2018.08.051
Johnson, H. P., Merle, S., Salmi, M., Embley, R., Sampaga, E., and Lee, M. (2019). Anomalous concentration of methane emissions at the continental shelf edge of the northern Cacadia margin. J. Geophys. Res. Solid Earth 124 (3), 2829–2843. doi:10.1029/2018JB016453
Judd, A. G., Hovland, M., Dimitrov, L. I., Gil, S. G., and Jukes, V. (2002). The geological methane budget at continentla margins and its influence on climate change. Geofluids 2, 109–126. doi:10.1046/j.1468-8123.2002.00027.x
Ker, S., and Riboulot, V.GHASS Cruise Team (2015). GHASS cruise report. Available at: https://archimer.ifremer.fr/doc/00300/41141/last (Accessed June 25, 2020), 53.
Ker, S., Thomas, Y., Riboulot, V., Sultan, N., Bernard, C., Scalabrin, C., et al. (2019). Anomalously deep BSR related to a transient state of the gas hydrate system in the western black sea. G-cubed 20, 442–459. doi:10.1029/2018GC007861
Klaucke, I., Sahling, H., WeinrebeBlinova, W. V., Bürka, D., Lursmanashvili, N., and Bohrmann, G. (2006). Acoustic investigation of cold seeps offshore georgia, eastern black sea. Mar. Geol 231 (1–4), 51–67. doi:10.1016/j.margeo.2006.05.011
Körber, J. H., Sahling, H., Pape, T., dos Santos Ferreira, C., MacDonald, I. R., and Bohrmann, G. (2014). Natural oil seepage at kobuleti ridge, eastern black sea. Mar. Petrol. Geol 50, 68–82. doi:10.1016/j.marpetgeo.2013.11.007
KosselBigalke, E. N., Piñero, E., and Haeckel, M. (2013). The SUGAR Toolbox–a library of numerical algorithms and data for modelling of gas hydrate systems and marine environments. Geomar Rep 8, 160. doi:10.3289/geomar_rep_ns_8_2013
Laberg, J. S., Baeten, N. J., Lågstad, P., Forwick, M., and Vorren, T. O. (2013). Formation of a large submarine crack during the final stage of retrogressive mass wasting on the continental slope offshore northern norway. Mar. Geol 346, 73–78. doi:10.1016/j.margeo.2013.08.008
Lericolais, G., Bulois, C., Gillet, H., and Guichard, F. (2009). High frequency sea level fluctuations recorded in the black sea since the LGM. Global Planet. Change 66 (1–2), 65–75. doi:10.1016/j.gloplacha.2008.03.010
Lericolais, G., Bourget, J., Popescu, I., Jermannaud, P., Mulder, T., Jorry, S., et al. (2013). Late Quaternary deep-sea sedimentation in the western Black Sea: new insights from recent coring and seismic data in the deep basin. Global Planet. Change 103, 232–247. doi:10.1016/j.gloplacha.2012.05.002
Macelloni, L., Lutken, C. B., D’Emidio, M., Sleeper, K., McGee, T. M., GargSimonetti, S. A., et al. (2015). Heat-flow regimes and the hydrate stability zone of a transient, thermogenic, fault-controlled hydrate system (Woolsey Mound northern Gulf of Mexico). J. Mar. Pet. Geol 59, 491–504. doi:10.1016/j.marpetgeo.2014.09.010
McGinnis, D. F., Greinert, J., Artemov, Y., Beaubien, S. E., and Wuest, A. (2006). Fate of rising methane bubbles in stratified waters: how much methane reaches the atmosphere?. J. Geophys. Res 111, C09007. doi:10.1029/2005JC003183
Mienert, J., Vanneste, M., Haflidason, H., and Bünz, S. (2010). Norwegian margin outer shelf cracking: a consequence of climate-induced gas hydrate dissociation?. Int. J. Earth Sci 99, 207–225. doi:10.1007/s00531-010-0536-z
Minshull, T. A., Marín-Moreno, H., Betlem, P., Bialas, J., Buenz, S., Burwicz, E., et al. (2020). Hydrate occurrence in Europe: a review of available evidence. J. Mar. Pet. Geol 111, 735–764. doi:10.1016/j.marpetgeo.2019.08.014
Naudts, L., Greinert, J., Artemov, Y., Staelens, P., Poort, J., Van Rensbergen, P., et al. (2006). Geological and morphological setting of 2778 methane seeps in the Dnepr paleo-delta, northwestern black sea. Mar. Geol 227, 177–199. doi:10.1016/j.margeo.2005.10.005
Naudts, L., Greinert, J., Artemov, Y., and De Batist, M. (2009). Geo- and hydro-acoustic manifestations of shallow gas and gas seeps in the Dnepr paleodelta, northwestern black sea. Lead. Edge 28 (9), 51–63. doi:10.1190/1.3236372
Özsoy, E., and Ünlüata, Ü. (1997). Oceanography of the black sea: a review of some recent results. Earth Sci. Rev 42 (4), 231–272. doi:10.1016/S0012-8252(97)81859-4
Pape, T., Bahr, A., Rethemeyer, J., Kessler, J. D., Sahling, H., Hinrichs, K-U., et al. (2010). Molecular and isotopic partitioning of low-molecular-weight hydrocarbons during migration and gas hydrate precipitation in deposits of a high-flux seepage site. Chem. Geol 269 (3-4), 350–363. doi:10.1016/j.chemgeo.2009.10.009
Pape, T., Bahr, A., Klapp, S. A., Abegg, F., and Bohrmann, G. (2011). High-intensity gas seepage causes rafting of shallow gas hydrates in the southeastern black sea. Earth Planet Sci. Lett 307 (1-2), 35–46. doi:10.1016/j.epsl.2011.04.030
Pape, T., Haeckel, M., Riedel, M., Kölling, M., Schmidt, M., Wallmann, K., et al. (2020). Formation pathways of light hydrocarbons in deep sediments of the danube deep-sea fan, western black sea. Mar. Petrol. Geol 122, 104627. doi:10.1016/j.marpetgeo.2020.104627
PaullCaress, C. K. D. W., Thomas, H., Lundsten, E., Anderson, K., Gwiazda, R., Riedel, M., et al. (2015). Seafloor geomorphic manifestations of gas venting and shallow subbottom gas hydrate occurrences. Geosphere 11 (2), 491–513. doi:10.1130/GES01012.1
Pilcher, R., and Argent, J. (2007). Mega-pockmarks and linear pockmark trains on the west african continental margin. Mar. Geol 244, 15–32. doi:10.1016/j.margeo.2007.05.002
Poort, J., Vassilev, A., and Dimitrov, L. (2005). Did postglacial catastrophic flooding trigger massive changes in the black sea gas hydrate reservoir?. Terra. Nova 17 (2), 135–140. doi:10.1111/j.1365-3121.2005.00599.x
Popescu, I., De Batist, M., Lericolais, G., Nouzé, H., Poort, J., Panin, N., et al. (2006). Multiple bottom-simulating reflections in the black sea: potential proxies of past climate conditions. Mar. Geol 227, 163–176. doi:10.1016/j.margeo.2005.12.006
Popescu, I., Lericolais, G., Panin, N., Wong, H., and Droz, L. (2001). Late quaternary channel avulsions on the danube deep-sea fan, black sea. Mar. Geol 179, 25–37. doi:10.1016/S0025-3227(01)00197-9
Popescu, I., Lericolais, G., Panin, N., Normand, A., Dinu, C., and Le Drezen, E. (2004). The danube submarine canyon (Black Sea): morphology and sedimentary processes. Mar. Geol 206, 249–265. doi:10.1016/j.margeo.2004.03.003
Popescu, I., Lericolais, G., Panin, N., De Batist, M., and Gillet, H. (2007). Seismic expression of gas and gas hydrates across the western black sea. Geo Mar. Lett 27, 173–183. doi:10.1007/s00367-007-0068-0
Reiche, S., Hjelstuen, B. O., and Haflidason, H. (2011). High-resolution seismic stratigraphy, sedimentary processes and the origin of seabed cracks and pockmarks at nyegga, mid-norwegian margin. Mar. Geol 284, 28–39. doi:10.1016/j.margeo.2011.03.006
Riboulot, V., Cattaneo, A., Scalabrin, C., Gaillot, A., Jouet, G., Ballas, G., et al. (2017). Control of the geomorphology and gas hydrate extent on widespread gas emissions offshore romania. Bull. Soc. Géol. Fr 188 (4), 26. doi:10.1051/bsgf/2017182
Riboulot, V., Ker, S., Sultan, N., Thomas, Y., Marsset, B., Scalabrin, C., et al. (2018). Freshwater lake to salt‐water sea causing widespread hydrate dissociation in the black sea. Nat. Commun 9 (1). doi:10.1038/s41467-017-02271-z
Riedel, M., Gausepohl, F., Gazis, I., Hähnel, L., Kampmeier, M., Urban, P., et al. (2018). Report of Cruise M143 SLOGARO–slope failures and active gas expulsion along the Romanian margin–investigating relations to gas hydrate distribution, Varna (Romania) – heraklion (Greece) 12.02.-22.12.2017, Berichte aus dem GEOMAR Helmholtz-Zentrum für Ozeanforschung Kiel Nr. 42. Available at: https://www.geomar.de/en/research/publications-oceanrep/geomar-report (Accessed January 5, 2021), 43–8113.
Riedel, M., Freudenthal, T., Bergenthal, M., Haeckel, M., Wallmann, K., Spangenberg, E., et al. (2020). Physical properties and core-log seismic integration from drilling at the danube deep sea fan, black sea. Mar. Petrol. Geol 114, 104192. doi:10.1016/j.marpetgeo.2019.104192
Robinson, A. G., Rudat, J. H., Banks, C. J., and Wiles, R. L. F. (1996). Petroleum geology of the black sea. Mar. Petrol. Geol 13, 195–223. doi:10.1016/0264-8172(95)00042-9
Römer, M., Sahling, H., Pape, T., Bahr, A., Feseker, T., Wintersteller, P., et al. (2012). Geological control and magnitude of methane ebullition from a high-flux seep area in the black sea–the kerch seep area. Mar. Geol 319, 57–74. doi:10.1016/j.margeo.2012.07.005
Römer, M., Sahling, H., dos Santos Ferreira, C., and Bohrmann, G. (2019). Methane gas emissions of the black sea—mapping from the crimean continental margin to the kerch peninsula slope. Geo Mar. Lett 40, 467–480. doi:10.1007/s00367-019-00611-0
Ruppel, C. D., and Kessler, J. D. (2017). The interaction of climate change and methane hydrates. Rev. Geophys 55 (1), 126–168. doi:10.1002/2016RG000534
Ryan, W. B., Pitman, W. C., Major, C. O., Shimkus, K., Moskalenko, V., Jones, G. A., et al. (1997). An abrupt drowning of the black sea shelf. Mar. Geol 138, 119–126. doi:10.1016/S0025-3227(97)00007-8
Sahling, H., Bohrmann, G., Artemov, Y. G., Bahr, A., Brüning, M., Klapp, S. A., et al. (2009). Vodyanitskii mud volcano, sorokin trough, black sea: geological characterization and quantification of gas bubble streams. J. Mar. Pet. Geol 26 (9), 1799–1811. doi:10.1016/j.marpetgeo.2009.01.010
Schmale, O., Greinert, J., and Rehder, G. (2005). Methane emission from high-intensity marine gas seeps in the black sea into the atmosphere. Geophys. Res. Lett 32, L07609. doi:10.1029/2004GL021138
Schmale, O., Beaubian, S., Rehder, G., Greinert, J., and Lombardi, S. (2010). Gas seepage in the Dnepr paleo-delta area (NW-Black Sea) and its regional impact on the water column methane cycle. J. Mar. Syst 80 (1-2), 90–100. doi:10.1016/j.jmarsys.2009.10.003
Shakhova, N. E., and AlekseevSemiletov, V. A. I. P. (2010). Predicted methane emission on the east siberian shelf. Dokl. Earth Sci 430, 190–193. doi:10.1134/S1028334X10020091
Soulet, G., Delaygue, G., and Vallet-Coulomb, C. (2010). Glacial hydrologic conditions in the Black Sea reconstructed using geochemical pore water profiles. Earth Planet Sci. Lett 296 (1-2), 57–66. doi:10.1016/j.epsl.2010.04.045
Spence, G. D., Haacke, R. R., and Hyndman, R. D. (2010). “Seismic indicators of natural gas hydrate and underlying free gas,” in Geophysical characterization of gas hydrates. Editors M. Riedel, E. C. Willoughby, and S. Chopra (Tulsa, OK: SEG Geophysical Developments), Vol. 14, 39–71.
Starostenko, V., Rusakov, O., Shnyukov, E., Kobolev, V., and Kutas, R. (2010). Methane in the northern black sea: characterization of its geomorphological and geological environments. J. Geol. Soc. London Spec. Publ 340, 57–75. doi:10.1144/SP340.5
Tishchenko, P., Hensen, C., Wallmann, K., and Wong, C. S. (2005). Calculation of the stability and solubility of methane hydrate in seawater. Chem. Geol 219 (1-4), 35–52. doi:10.1016/j.chemgeo.2005.02.008
Vassilev, A., and Dimitrov, L. I. (2002). Spatial and quantity evaluation of the black sea gas hydrates. Russ. Geol. Geophys 43, 672–684.
Winguth, C., Wong, H. K., PaninDinu, N. C., Georgescu, P., Ungureanu, G., Kruglikov, V. V., et al. (2000). Upper quaternary water level history and sedimentation in the northwestern black sea. Mar. Geol 167 (1), 127–146. doi:10.1016/S0025-3227(00)00024-4
Wong, H. K., Panin, N., Dinu, C., Georgescu, P., and Rahn, C. (1994). Morphology and post-chaudian (Late Pleistocene) evolution of the submarine danube fan complex. Terra. Nova 6, 502–511. doi:10.1111/j.1365-3121.1994.tb00894.x
Wong, H. K., Winguth, C., Panin, N., Dinu, C., Wollschlager, M., Georgescu, P., et al. (1997). The Danube and Dniepr fans, morphostructure and evolution. GeoEcoMarina 2, 77–102.
Wu, T., Sahling, H., Feseker, T., Rendle-Bühring, R., Wei, J., Wintersteller, P., et al. (2019). Morphology and activity of the helgoland mud volcano in the sorokin trough, northern black sea. Mar. Petrol. Geol 99, 227–236. doi:10.1016/j.marpetgeo.2018.10.017
Xu, C., Greinert, J., Haeckel, M., Bialas, J., Dimitrov, L., and Zhao, G. (2018). The character and formation of elongated depressions on the upper bulgarian slope. J. Ocean Univ. China 17 (3), 555–562. doi:10.1007/s11802-018-3460-7
Yefremova, A. G., and Zhizchenko, B. P. (1974). Occurrence of crystal hydrates of gases in the sediments of modern marine basins. Akademii Nauk SSSR 214, 1179–1181.
Zander, T., Deusner, C., Garziglia, S., Kossel, E., Haeckel, M., Gupta, S., et al. (2016). Seismic and geotechnical characterization of hydrated sediments in a sand-rich setting: field work and lab experiment results report for MIDAS, managing impacts of deep-sea resource exploitation, 53. Available at: https://www.eu-midas.net/sites/default/files/deliverables/MIDAS_D1.5_FINAL_lowres.pdf (Accessed August 25, 2020).
Zander, T., Haeckel, M., Berndt, C., Chi, W-C., Klaucke, I., Bialas, J., et al. (2017). On the origin of multiple BSRs in the danube deep-sea fan, black sea. Earth Planet Sci. Lett 462, 15–25. doi:10.1016/j.epsl.2017.01.006
Keywords: black sea, gas venting, structural control, faulting, gas hydrates, Danube deep-sea fan
Citation: Riedel M, Hähnel L, Bialas J, Bachmann AK, Gaide S, Wintersteller P, Klaucke I and Bohrmann G (2021) Controls on Gas Emission Distribution on the Continental Slope of the Western Black Sea. Front. Earth Sci. 8:601254. doi: 10.3389/feart.2020.601254
Received: 31 August 2020; Accepted: 15 December 2020;
Published: 23 February 2021.
Edited by:
Martin Scherwath, University of Victoria, CanadaReviewed by:
Jeffrey Beeson, Oregon State University, United StatesMarc De Batist, Ghent University, Belgium
Copyright © 2021 Riedel, Hähnel, Bialas, Bachmann, Gaide, Wintersteller, Klaucke and Bohrmann. This is an open-access article distributed under the terms of the Creative Commons Attribution License (CC BY). The use, distribution or reproduction in other forums is permitted, provided the original author(s) and the copyright owner(s) are credited and that the original publication in this journal is cited, in accordance with accepted academic practice. No use, distribution or reproduction is permitted which does not comply with these terms.
*Correspondence: Michael Riedel, mriedel@geoamr.de