Long-Term Changes of Particle Flux in the Canary Basin Between 1991 and 2009 and Comparison to Sediment Trap Records Off Mauritania
 Gerhard Fischer1,2*
  Susanne Neuer3
  Simon Ramondenc2,4
  Thomas J. Müller5
  Barbara Donner2
  Götz Ruhland2 Volker Ratmeyer2 Gerrit Meinecke2
  Nico Nowald2 Marco Klann2 Gerold Wefer2
- 1Department of Geosciences, University of Bremen, Bremen, Germany
- 2MARUM, Center of Marine and Environmental Sciences, University of Bremen, Bremen, Germany
- 3School of Life Sciences, Arizona State University, Tempe, AZ, United States
- 4Alfred Wegener Institute for Polar and Marine Research, Bremerhaven, Germany
- 5GEOMAR Helmholtz Centre for Ocean Research Kiel, Kiel, Germany
Eastern Boundary Upwelling Ecosystems (EBUEs) are associated with high biological productivity, high fish catch and they highly contribute to marine carbon sequestration. Whether coastal upwelling has intensified or weakened under climate change in the past decades is controversially discussed and different approaches (e.g., time-series of chlorophyll, wind, sea surface temperature, modeling experiments) have been considered. We present a record of almost two decades of particle fluxes (1991–2009) from ca. 600 to 3100 m water depth in the Canary Basin at site ESTOC (European Station for Time series in the Ocean Canary Islands; ca. 29°N, 15°30.W, ca. 3600 m water depth), located in the offshore transition zone of the northern Canary Current-EBUE. We compare these flux records with those measured at a mesotrophic sediment trap site further south off Cape Blanc (Mauritania, ca. 21°N). The deep ocean fluxes at ESTOC in ca. 3 km recorded the evolution of the coastal Cape Ghir filament (30–32°N, 10–12°W) due to lateral advection of particles, whereas the upper water column sediment traps in ca. 1 km reflected the oligotrophic conditions in the overlying waters of ESTOC. We observed an increased emphasis in spring-time fluxes since 2005, associated with a change in particle composition, while satellite chlorophyll biomass did not show this pattern. Due to its northern location in the CC-EBUEs, spring biogenic fluxes at ESTOC provide a better relationship to the forcing of the North Atlantic Oscillation than those recorded further south off Cape Blanc. Off Cape Blanc, deep fluxes showed the best overlap with the deep ESTOC fluxes during the spring season before 2005. On the long-term, both chlorophyll and particle fluxes showed an increasing trend at ESTOC which was not observed further south at the mesotrophic Cape Blanc site. This might indicate that, depending on their location along the NW African margin, coastal upwelling systems react differently to global change.
Introduction
Eastern Boundary Upwelling Ecosystems (EBUEs) are among the most productive ecosystems in the world oceans and are economically important. The nutrient-rich upwelled waters along the coastal shelves sustain large phytoplankton blooms that play a crucial role in the marine carbon cycle and sequestration. Therefore, EBUEs are discussed also in the context of global warming. Bakun (1990) and Bakun et al. (2010, 2015) proposed a scenario of a general intensification of coastal upwelling due to increasing pressure gradients and wind fields associated with global warming. This hypothesis is under discussion and differing findings were recently summarized by Garcìa-Reyes et al. (2015); Bonino et al. (2019), and Sylla et al. (2019). Bonino et al. (2019) stressed that each EBUEs is unique in terms of forcings and climate variability and that the Canary Current (CC) system reveals a negative trend in upwelling intensity. Even the various sub-systems of the EBUEs defined by Cropper et al. (2014; Figure 1) could react differently to global warming (Lathuilière et al., 2008; Arístegui et al., 2009; Sydeman et al., 2014; Garcìa-Reyes et al., 2015; Bonino et al., 2019). A progressive warming and decreasing productivity over the last two decades was suggested for the CC-EBUEs as a whole (Arístegui et al., 2009).
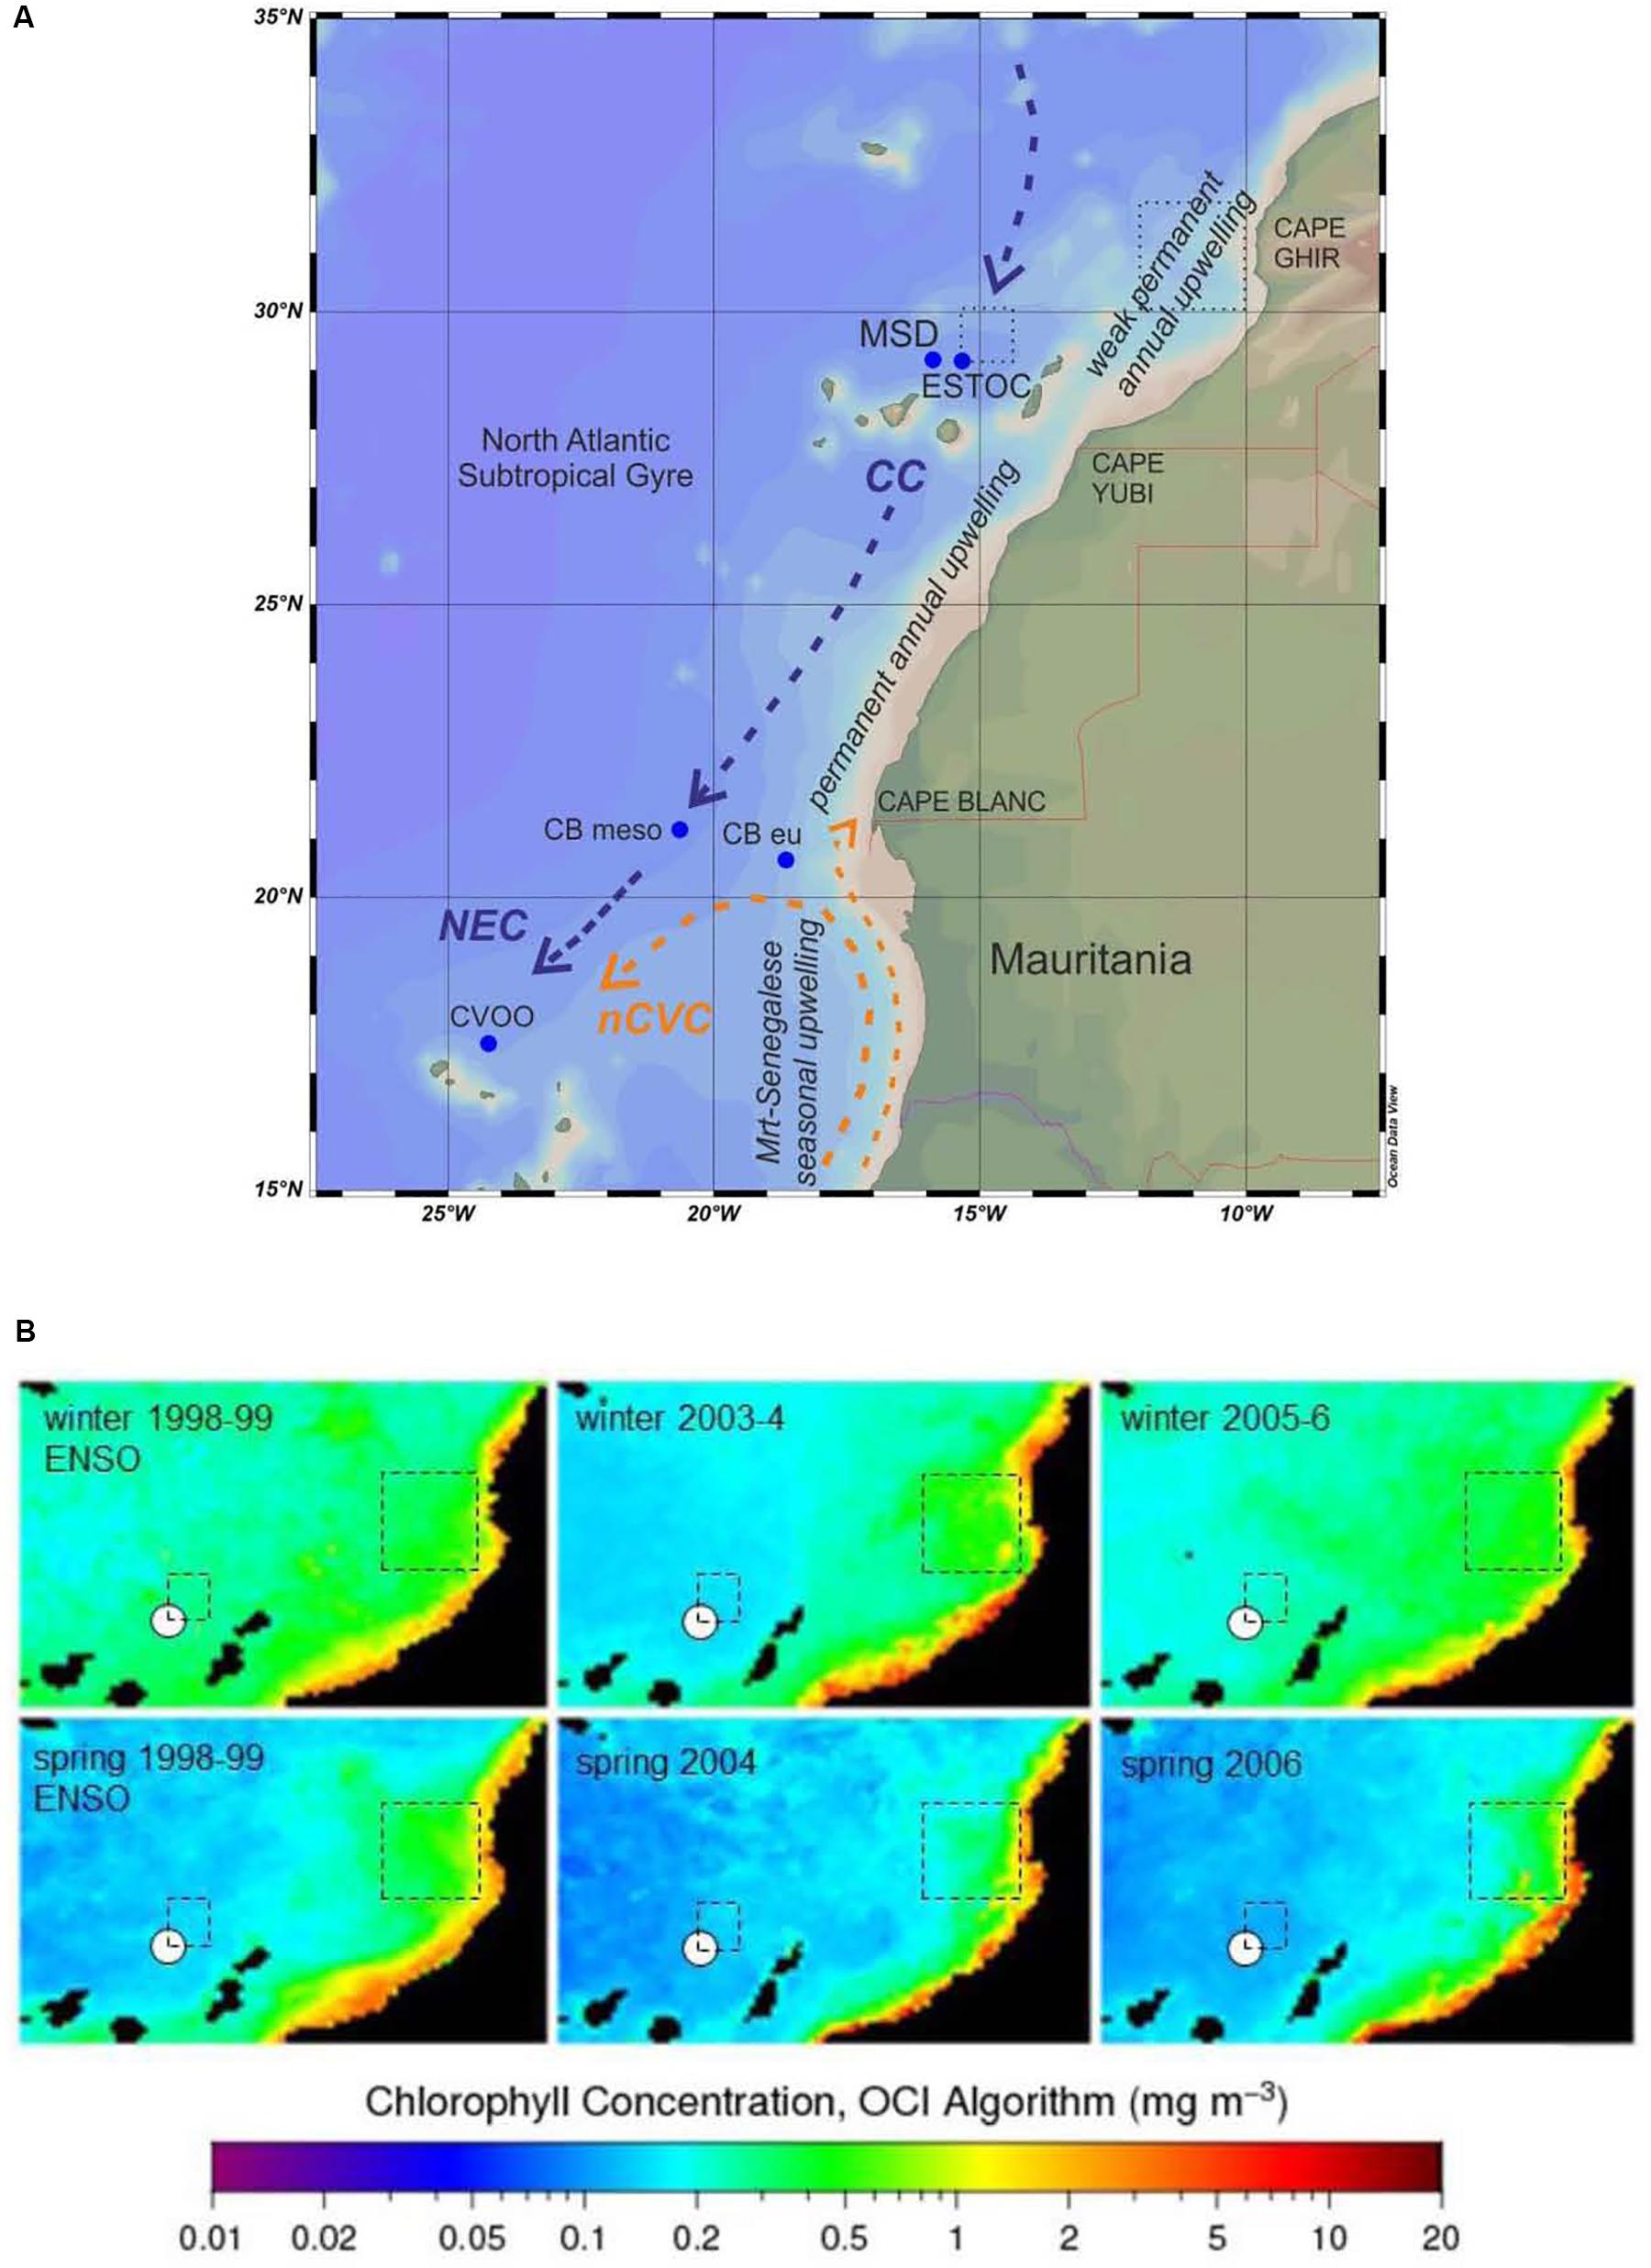
Figure 1. (A) Location of ESTOC and MSD traps in the Canary Basin and other relevant time series flux sites [Cape Blanc (CBmeso, CBeu), CVOO (Cape Verde Ocean Observatory, GEOMAR)] within the Canary Current system. General currents and the upwelling zones defined by Cropper et al. (2014) are indicated. Boxes at ESTOC and Cape Ghir where environmental data have been extracted from GIOVANNI are shown as well (stippled lines). CC, Canary Current; NEC, North Equatorial Current; nCVC, northern Cape Verde Current; the northward moving coastal current is the Mauritanian Current. (B) Examples of winter and spring surface chlorophyll from SeaWiFs and MODIS (9 km resolution) for the extreme ENSO year 1999 (La Niña phase), the years 2004 and 2006 (as examples for the years before and after 2005). The ESTOC study site is marked with a white dot, the ESTOC and Cape Ghir boxes are shown.
Over decadal time scales, the NW African coastal upwelling can be influenced by the North Atlantic Oscillation (NAO, e.g., González-Dávila et al., 2007; Narajan et al., 2010; Cianca et al., 2012), the Atlantic Meridional Overturning (AMO, Bonino et al., 2019), the AMOC (e.g., Vélez-Belchí et al., 2017) and the El Niño Southern Oscillation (ENSO). ENSO related teleconnections have been discussed by e.g., Behrenfeld et al. (2001) and Pradhan et al. (2006) and can be illustrated by the negative correlation of sea level pressure (SLP) with eastern tropical Pacific SST (Fischer et al., 2016). According to Fischer et al. (2016), correlations during winter show that NAO and ENSO may have opposite effects on the NW African/eastern Atlantic region for coastal upwelling. A positive phase of the NAO is associated with anomalously high pressure in the Azores region and stronger northeasterly winds along the NW African coast, and vice versa. However, the correlation is larger for the NAO than for ENSO as shown by modeling approaches (Fischer et al., 2016).
The times series site ESTOC is located in the eastern subtropical North Atlantic about 110 km north of Gran Canaria (Canary Basin, ca. 29°N/15°30.W, ca. 4 km water depth) and about 255 km off the African shelf. A sediment trap station to which results from ESTOC will be compared lies further south off Cape Blanc ca. 550 km off the shelf (CB mesotrophic, ca. 21°N/21° W, ca. 4 km water depth; Figure 1A). Both, the ESTOC and CB stations are within the influence of the Canary Current-EBUEs. In the depth range from the surface down to ca. 800 m, the Canary Current (CC) carries North Atlantic Central Water (NACW) southwards and dominates the geostrophic contribution to the wind-driven subtropical gyre (see Neuer et al., 2007, for a seasonally repeated survey along 29°N via ESTOC). To a large part, it is fed in the north at ca 34°N by the eastward flowing Azores Current. The CC closes the North Atlantic’s subtropical gyre in the east off the West African shelf, and starts to leave the shelf edge further south with a more westward component at about 21°N (e.g., Stramma, 1984; Figure 1A).
The trade winds and the seasonal signal dominate the directly wind-driven contribution to the subtropical gyre’s flow pattern. The wind is directed southward, almost parallel to the general coastline, and is strongest over the annual mean off Cape Blanc with a maximum in July. Further north at Cape Ghir at 30°N, it is weaker in the annual mean, but with a late spring to August summer maximum (Mittelstaedt, 1991). The component parallel to the coast with its maximum in spring and summer creates the strongest coastal upwelling, with maxima depending regionally on the wind maxima in summer (Van Camp et al., 1991). The offshore Ekman transport is confined to the near surface and has two further effects. First, it may create thin filaments of nutrient-rich upwelled water observed by satellites that reach from the coast toward southwest up to several hundred kilometers far into the oligotrophic open ocean. Permanently and strongest, these filaments occur at coastal capes, e.g., Cape Ghir at ca. 30°N and Cape Blanc at ca. 21°N (Nykjaer and Van Camp, 1994; Davenport et al., 1999). They vary seasonally with the wind system, and they may contribute to particle transport to more oligotrophic regions like ESTOC and the mesotrophic Cape Blanc site through lateral advection (Neuer et al., 2002b; Helmke et al., 2005; Fischer et al., 2009). Secondly, the offshore Ekman transport induces a geostrophic poleward undercurrent (PUC) along the shelf edge (Mittelstaedt, 1991). North of 25°N and during the wind maximum in summer and fall, this undercurrent is confined to 500–1050 m water depth (Knoll et al., 2002). On the shelf edge, the PUC supports the enrichment of lithogenic and biogenic particles through erosion and interaction with the Canary Current. The associated meso-scale eddy field also supports the horizontal dispersion of suspended materials further offshore.
The ESTOC site has phytoplankton biomass typical for oligotrophic conditions of the subtropical gyre (Davenport et al., 2002) with satellite-derived and in situ chlorophyll concentrations ranging from 0.03 to 0.20 mg m–3, sometimes reaching 0.4 mg m–3 (Neuer et al., 2007). Neuer et al. (1997, 2002b) found a clear seasonality in biomass with maxima following the breakup of the seasonally stratified mixed layer in winter. The historical CZCS data from 1979 to 1985 showed maximal pigment concentrations in December and January, declining in February (Davenport et al., 1999).
Deep ocean fluxes generally follow the seasonal signal of phytoplankton biomass with a high mineral (ballast) component from mostly coccolithophore sedimentation (Abrantes et al., 2002; Sprengel et al., 2002). Roughly one third of the flux is due to non-biogenic (lithogenic) particles mostly from Saharan dust. Biogenic silica (BSi) is of minor importance due to low silicate availability in the upwelling waters of the ENACW (=Eastern North Atlantic Central Water; ca. 200–800 m water depth) (Ragueneau et al., 2000). Neuer et al. (1997) observed an increase of particulate fluxes with depth at ESTOC and attributed the increased flux to the productive Cape Ghir filament to the northeast as a potential particle source region; this hypothesis was supported by CZCS satellite imagery (Davenport et al., 1999, 2002) and by nitrogen isotope studies carried out by Freudenthal et al. (2001). Satellite derived chlorophyll concentration is more than twice as high (0.4 ± 0.18 mg m–3; SeaWifs 1997–2009) in that filament compared to the ESTOC area (Figure 2).
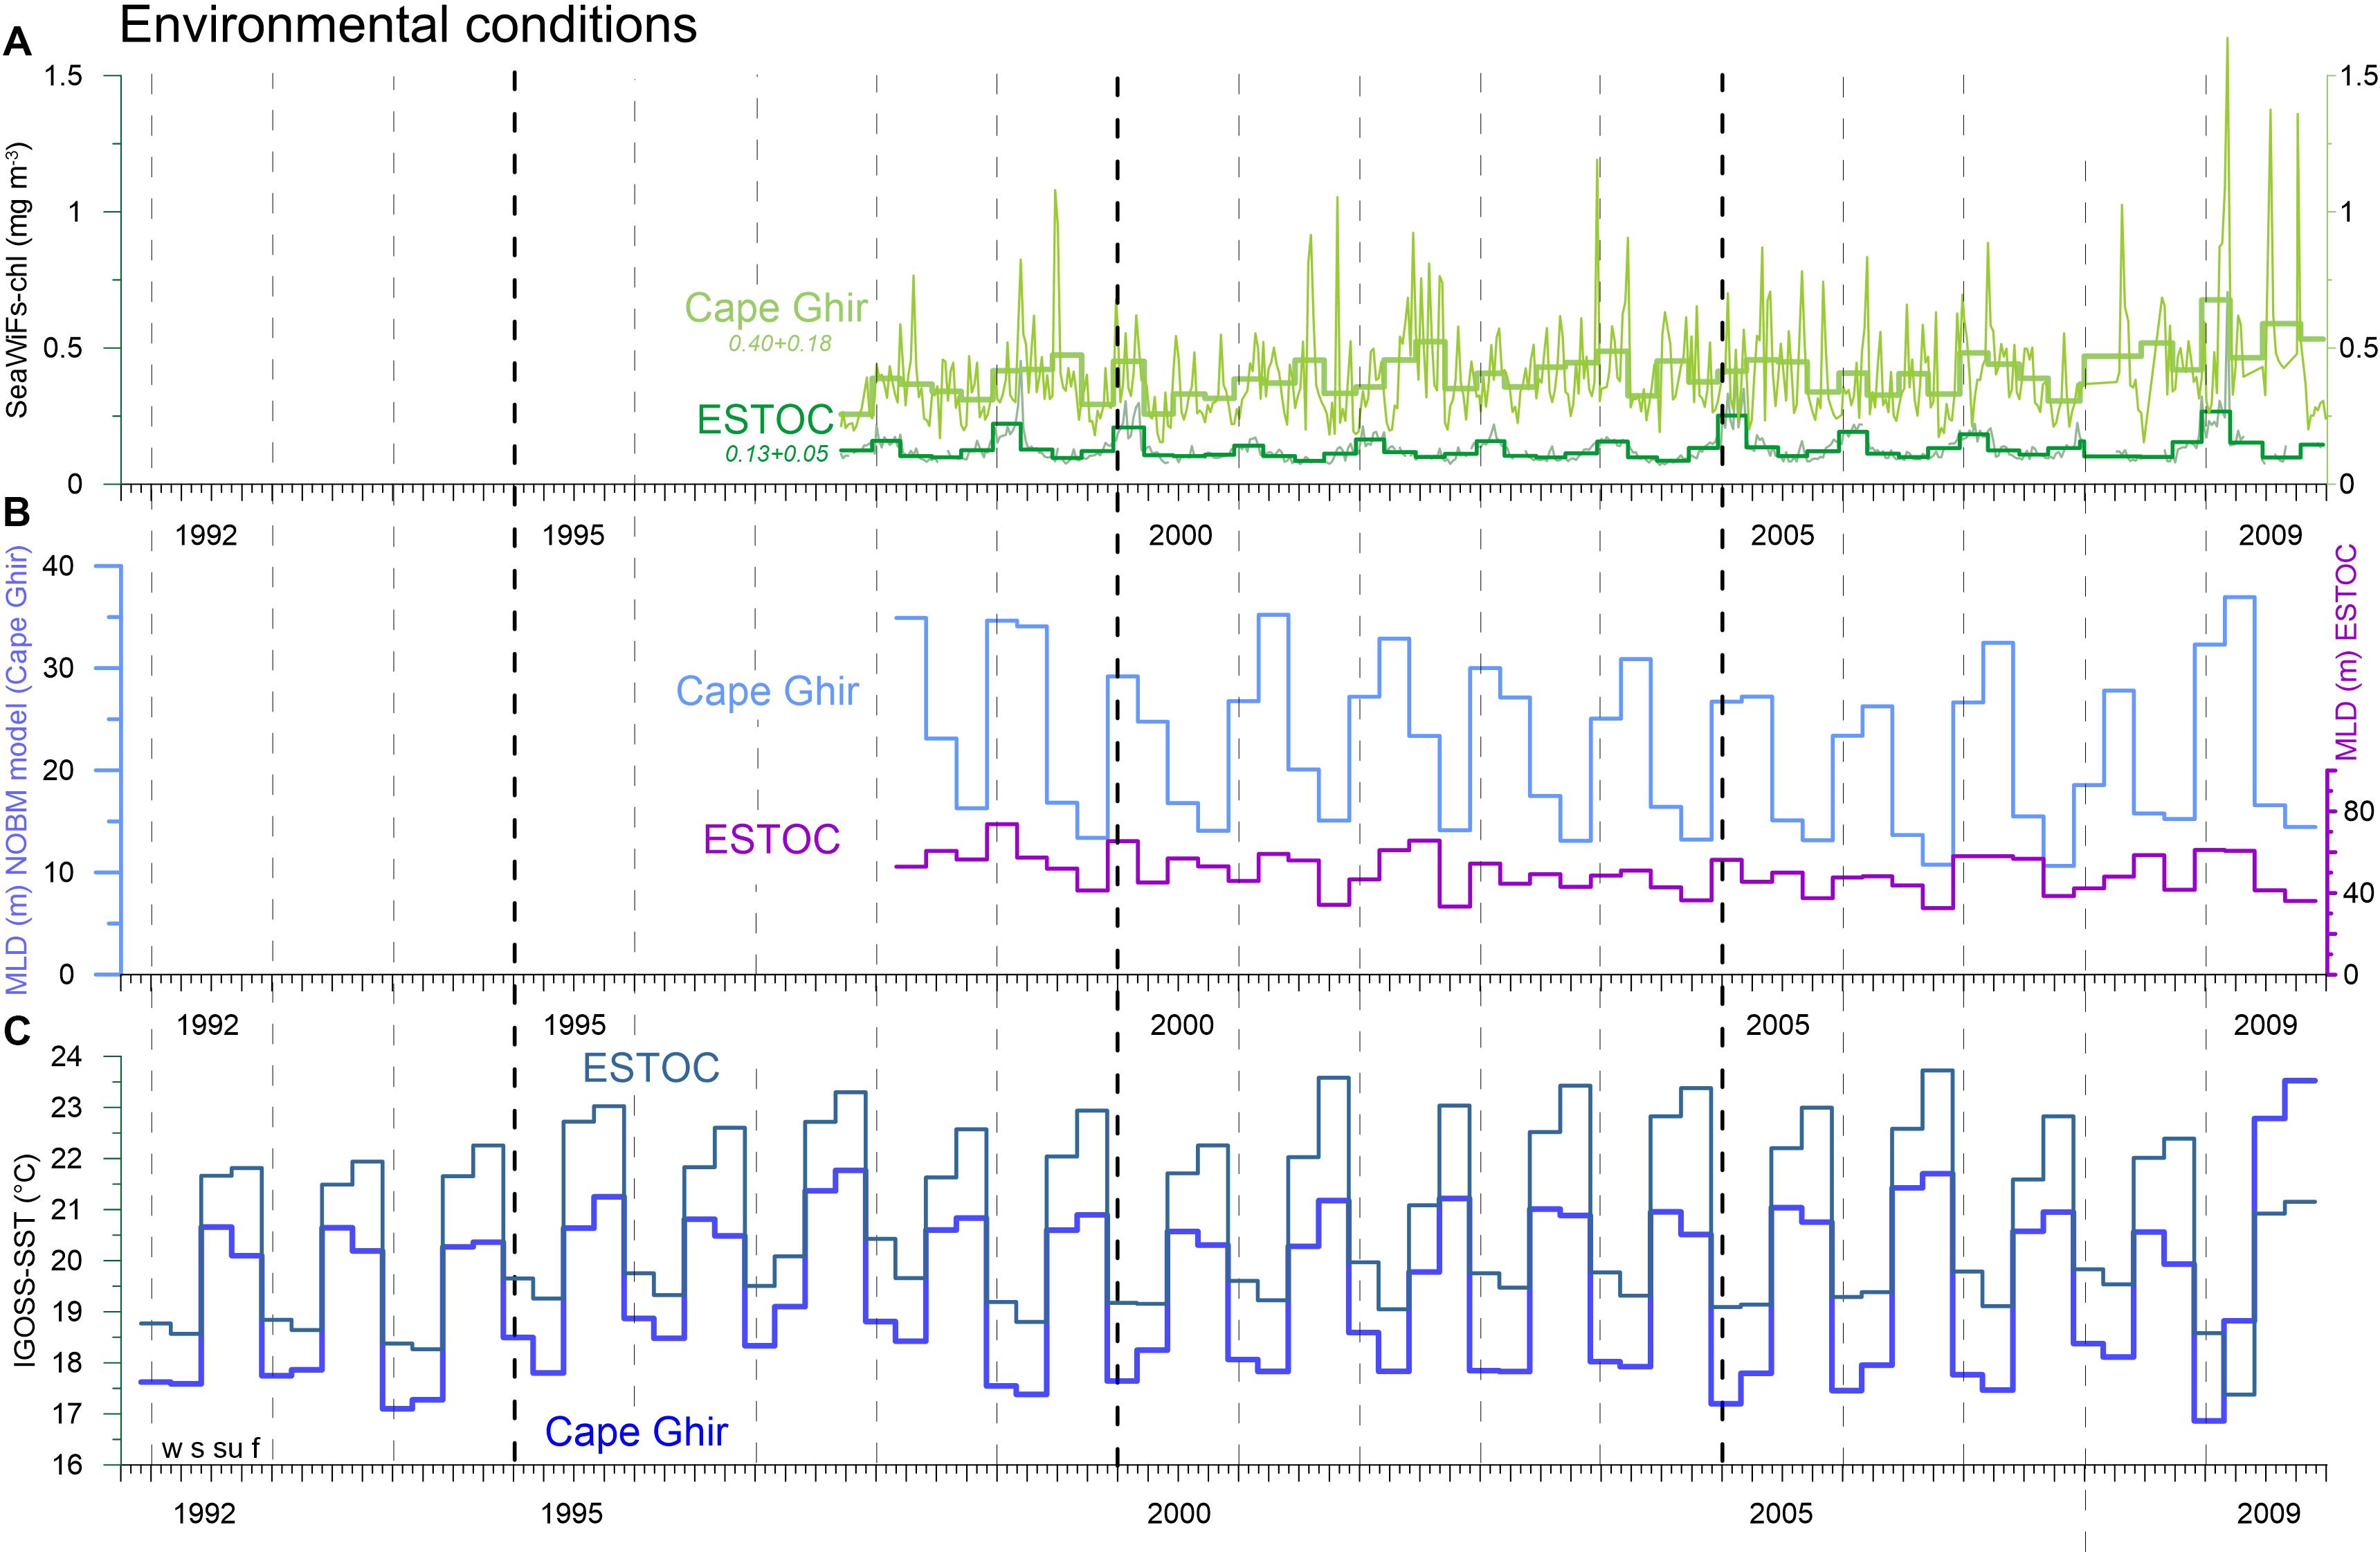
Figure 2. Time series of major environmental variables. (A) Weakly and seasonal (DJF) SeaWiFs-chlorophyll (mg m–3); seasonal (DJF), model-based MLD (m) (B) (NASA Ocean Biological Model, NOBM, from GIOVANNI); seasonal (DJF) IGOSS-SST (°C) (C). Note the long-term increasing trend for chlorophyll at the coastal Cape Ghir filament box which is statistically significant. Vertical hatched lines indicate years (with the four seasons winter = w, spring = s, summer = su, fall = f; starting on Jan. 1), thick hatched lines indicate a 5-year mark.
Here, we present a synthesis of the existing particle flux data collected between ca. 600 and ca. 3 km water depth at the ESTOC time series site [1991–2009, ESTOC (1–22), ca. 3600 m water depth]. We further add high-resolution trap data from the nearby site MSD 1–5 (2002–2005; Figure 1A). We strongly build on studies conducted by Neuer et al. (1997, 2002a,b, 2004, 2007) on upper ocean flux data from Oct 1992 to April 2001 (CI-2 to CI-13). We use the ESTOC fluxes to evaluate potential long-term changes and trends of the strength of the biological carbon pump within the CC-EBUEs. Secondly, we will provide a synchronous overlap of deep ocean fluxes at ESTOC with the mesotrophic Cape Blanc study site in the southern part of the CC-EBUEs (Fischer et al., 2016, 2019). Both sites are located in similar settings offshore the coastal upwelling and influenced by larger upwelling filaments (Pelegrí et al., 2005).
Materials and Methods
Sediment Traps Moorings
We deployed Kiel-type time-series sediment traps (Kremling et al., 1996) at sites ESTOC and MSD (Figure 1A) in meso- and bathypelagic depths between ca. 600 and ca. 3 km (Supplementary Material). The average sampling depths of the traps were ca. 750 m (upper), 1050 m (middle), and 3060 m (lower). Mooring site MSD slightly to the west of ESTOC (Figure 1) was equipped with high-resolution sediment traps (40 cups). Detailed mooring and sampling dates for the sediment traps are listed in the Supplementary Material. Mooring data from Cape Blanc are given in Fischer et al. (2016, 2019). Prior to the deployments, the sampling cups were poisoned with HgCl2 and pure NaCl was used to increase the salinity and density in the sampling cups to 40‰. Upon recovery, samples were stored at 4°C and wet-splitted in the home laboratory. All flux data here refer to the size fraction of <1 mm. For a more detailed description of materials and methods we refer to Fischer et al. (2016). Analysis of the fraction <1 mm, using 1/4 or 1/5 wet splits, was performed according to Fischer and Wefer (1991). Samples were freeze-dried and the homogenized samples were analyzed for bulk (total mass), organic carbon, total nitrogen, carbonate and biogenic opal (BSi = biogenic silica). Organic carbon, nitrogen and calcium carbonate were measured by combustion with a CHN-Analyzer (HERAEUS). Carbonate was obtained from non-acidified and organic carbon from acidified (1N HCl) samples through CHN measurements. BSi was determined with a sequential leaching technique with 1 M NaOH at 85°C (Müller and Schneider, 1993), measuring SiO2 (biogenic opal) without including the variable water content of biogenic opal (around 5–10%). For a detailed table of standard deviations for various samples we refer to Müller and Schneider (1993). Lithogenic fluxes or the non-biogenic material was estimated by the difference between the biogenic fluxes (organic matter, BSi, carbonate) and total material flux. Organic matter was estimated by multiplying organic carbon by a factor of two (Hedges et al., 2002). The lithogenic fluxes were estimated by subtracting the biogenic fluxes from total fluxes. We attribute the lithogenic flux to dust-derived material (=mineral dust flux) as no large rivers supply suspended material to the Canary Basin. Due to partly low sample amounts (low fluxes), only total and BSi/organic carbon fluxes were available for the entire period of study.
The sediment trap collections were carried out with different time resolutions (4.3–22 days, see Supplementary Material) which limit comparisons between seasons and years. Therefore, average daily fluxes for the seasons and years were calculated according to Fischer et al. (2016). Seasons were defined using the dates of opening and closure of the individual sampling cups closest to the start of the astronomical seasons (March 21, June 21, September 23, December 21). The annual fluxes refer to the period of ca. 21 December to about the same date of the following year.
Moored Current Measurements
During September 1994 to March 2002, current meters were moored in seven settings at ESTOC in safe distance of ca. 20 km to the ESTOC sediment trap deployments. The first four settings carried an upward looking 150 kHz Acoustic Doppler Profiler (ADCP, made by RDI) to resolve the upper layer between 200 m depth and the surface. The ADCP, for logistic reasons, later was replaced by an Aanderaa RCM-8, which were also used to cover the deeper major water masses in the water column: North Atlantic Central Water (NACW, nominal RCM-8 depths 300 m, 500 m, 800 m), the Mediterranean Outflow Water (MW, 1250 m), and the North Atlantic Deep Water (NADW, 2000, 3550 m). Data processing followed the procedures described by Müller and Waniek (2013) for a different site, in particular determining best estimates of instrumental depths. The instruments’ sampling frequency was at least every 2 h to allow resolving the semi-diurnal tide and inertial motions. For this study, we used a low-pass filter and calculated 1-day averaged values to remove high frequency signals. The daily values then were interpolated in the vertical to common depths close to measuring depths: 50, 100, 150, 200, 250, 350, 500, 1250, 2000, and 3500 m, and in time to close the gaps between recovery and follow-up deployment. Vector averaging over 30 days provided current speeds and directions making them comparable to the seasonal description of particle flux data. Note that current meter data at ESTOC were measured only between 1994 and 2002, thus covering only part of the period of the trap measurements (1991–2009). There are no current meter measurements available at the MSD site.
Environmental Data
We used several observational time-series datasets from the GIOVANNI website (chlorophyll, MLD). Due to earlier findings on particle transport and lateral advection of particles and chlorophyll (e.g., Neuer et al., 1997; Davenport et al., 1999), we extracted these additional data from an ESTOC particle source box (29–30°N/14°30′–15°30′W; Figure 1A) located to the northeast of the mooring due to the general current direction in the surface and subsurface waters. We used another source box of the Cape Ghir filament (30–32°N, 10–12°W) which is known to supply material laterally, mainly to the deeper ESTOC traps (e.g., Neuer et al., 1997; Davenport et al., 1999). The concept of particle source boxes above moored sediment traps and the statistical funnels above them are primarily based on studies by Siegel et al. (2008).
Data on chlorophyll, sea surface temperature (SST), mixed-layer depth (MLD, modeled), NAO winter (DJFM) station-based Hurrell North Atlantic Oscillation (NAO) Index were obtained using the following sources:
https://oceancolor.gsfc.nasa.gov/l3/
https://giovanni.gsfc.nasa.gov/giovanni/#service=TmAvMp&starttime=&endtime=&bbox=-19,20,-18,21
http://climatedataguide.ucar.edu/guidance/hurrell-north-atlantic-oscillation-nao-index-station-based (Hurrell, 1995)
https://crudata.uea.ac.uk/cru/data/nao/ (Jones et al., 1997)
Statistics
The chlorophyll time series recorded by satellites were regularized and interpolated. The global trends were tested by applying the seasonal Mann-Kendall test (Hirsch et al., 1982), which estimate a single pattern on each month, separately. In addition, the correlation between environmental variables and the winter BSi fluxes or winter NAO Hurrell Indices and spring BSi fluxes were analyzed by parametric Pearson tests or non-parametric Spearman tests following the normality and the homoscedasticity of the measurements.
Results
Our results span observations over nearly 20 years. In a first step, we investigated the relationships between the environmental data (e.g., SSTs, chlorophyll, modeled MLD), around ESTOC and Cape Ghir and the particle fluxes at ESTOC. A major focus was the investigation of the seasonal and interannual variability of environmental variables (e.g., chlorophyll) and the flux signals in the meso- and bathypelagic. During the observation period, several NAO cycles and ENSO events could be identified, and we will present the time-series also in the context of those events in the following paragraph. Particularly noticeable was the ENSO event during 1997–1999 (Figure 1B). Finally, we will compare synchronous fluxes from the bathypelagic at ESTOC and off Cape Blanc (mesotrophic site) from the southern CC system.
Environmental Changes and Trends at ESTOC and the Cape Ghir Box
The weekly chlorophyll time series from 1997 to 2009 provided by SeaWiFs for the ESTOC (14°30′–15°30′W, 29–30°N) and the Cape Ghir (30–32°N, 10–12°W) boxes (Figure 1A) reveal distinct peaks in March to April reaching almost 1.5 mg m–3 within the Cape Ghir box (Figure 2A). Partly, summer and fall maxima were found in the coastal box as well. In addition, there is a tendency of a chlorophyll biomass increase from 1997 to 2009 at the coastal upwelling at Cape Ghir but not for the ESTOC box (Figure 2A, p < 0.05 and p = 0.08 Mann-Kendall test). There, SeaWiFs chlorophyll values were about 2–3-fold lower with distinct seasonal maxima in winter providing highest values in 2005 and 2009 (Figure 2A). No chlorophyll summer peaks were observed in the ESTOC box. Mean SeaWiFs-derived chlorophyll values in the Cape Ghir box were 0.40 ± 0.18 mg m–3 and 0.13 ± 0.05 for the ESTOC box. For comparison, we show satellite-derived chlorophyll time series obtained by the CZCS sensor (1979–1985, Davenport et al., 1999) for almost similar areas that reveal lower mean values (0.06 at ESTOC and 0.14 mg m–3 at Cape Ghir) compared to the SeaWiFs data which show maxima in January in both areas (Figure 3). Compared to in situ values, these lower values seem to better match the measured chlorophyll data (Neuer et al., 2007). Using monthly SST values from IGOSS, we observed a SST increase both inshore at Cape Ghir and offshore at ESTOC between 1991 and 2009 in the order of 1°C (Figure 2C). Simultaneously, we observed a shallowing of the mean winter and spring modeled mixed layer depths (MLD) from ca. 35 to ca. 25 m from 1997 to 2005 at Cape Ghir, which then increased again (Figure 2B).
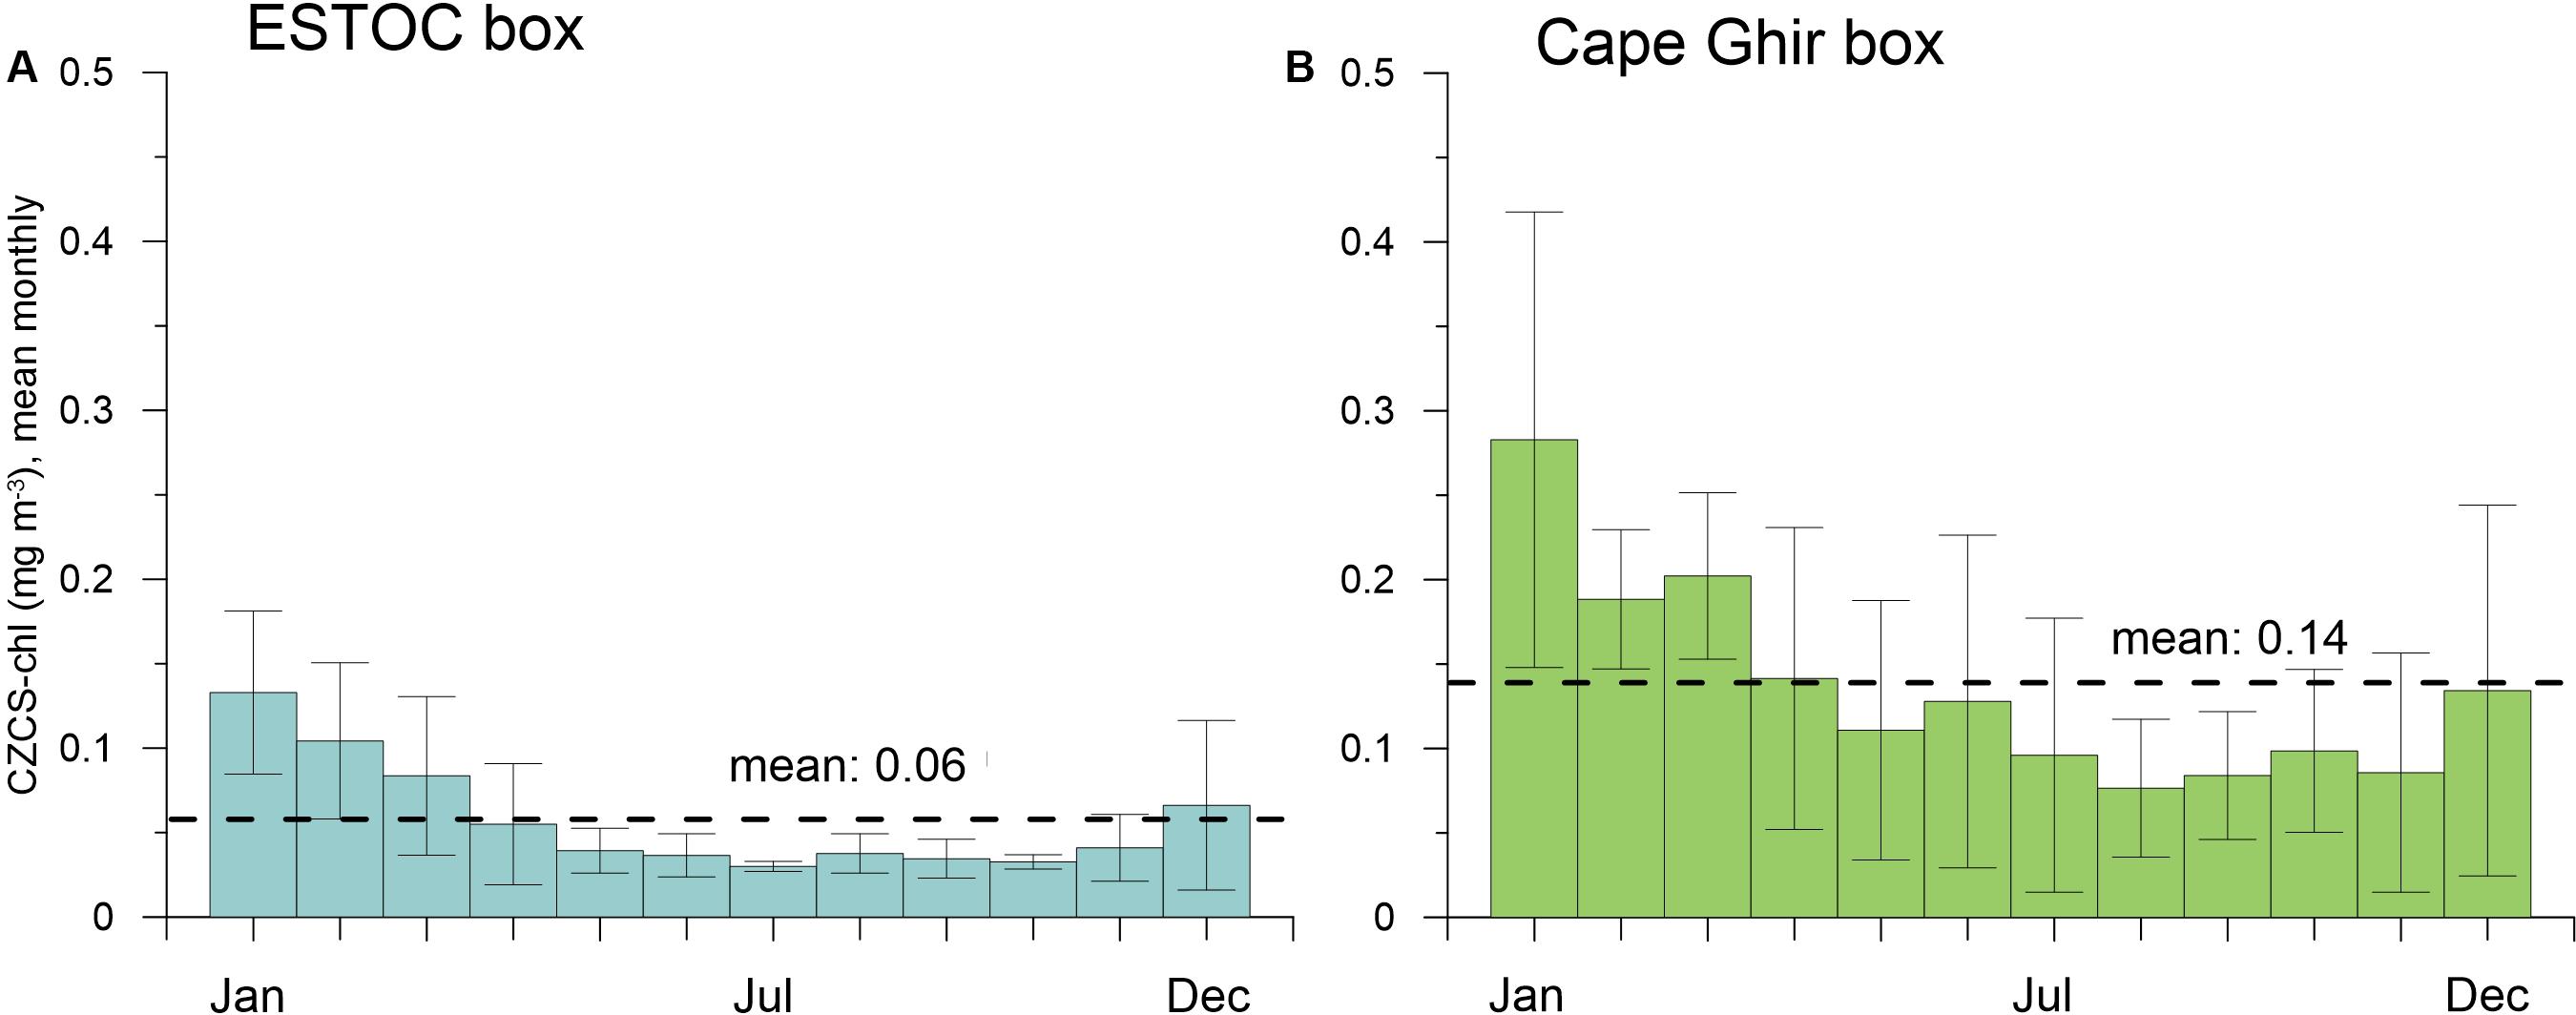
Figure 3. Mean monthly chlorophyll (mg m−3) from the satellite-CZCS sensor from 1979 to 1985 [Davenport et al. (1999) for (A) the ESTOC box and (B)] the Cape Ghir box. Annual means are shown by stippled lines. Values decline thereafter to a minimum in summer and increase again at the end of the year. Annual means are given as well. A distinct summer maximum at the Cape Ghir box (from SeaWiFs, Figure 2) cannot be found in these old CZCS records (B).
Current Strength and Directions in the Water Column
Current strengths are crucial to evaluate particle collection efficiencies of sediment traps (see Buesseler et al., 2007, for a review). Current speeds in the trap depths at ESTOC of 1 and 3 km were mostly below the critical values, around 10–12 cm s–1 (sampling interval of 2 h, data not shown). The available 8-year record (1994–2002) from GEOMAR shows that currents averaged over 30 days rarely exceeded 10 cm s–1; and in such cases generally were confined to depths shallower than 500 m (Figure 4). In very few cases, Mediterranean water lenses (Mediterranean Outflow Water) at around 1250 m depth (Siedler et al., 2005) may pass the mooring site as indicated by extremely high current anomalies (Figure 4A) accompanied by positive temperature anomalies around that depth, e.g., in early 1995 (not shown here). Also, current directions were more or less uniform over the water column, but changing rather regularly with time between all four 90-degree directional sectors (Figure 4B).
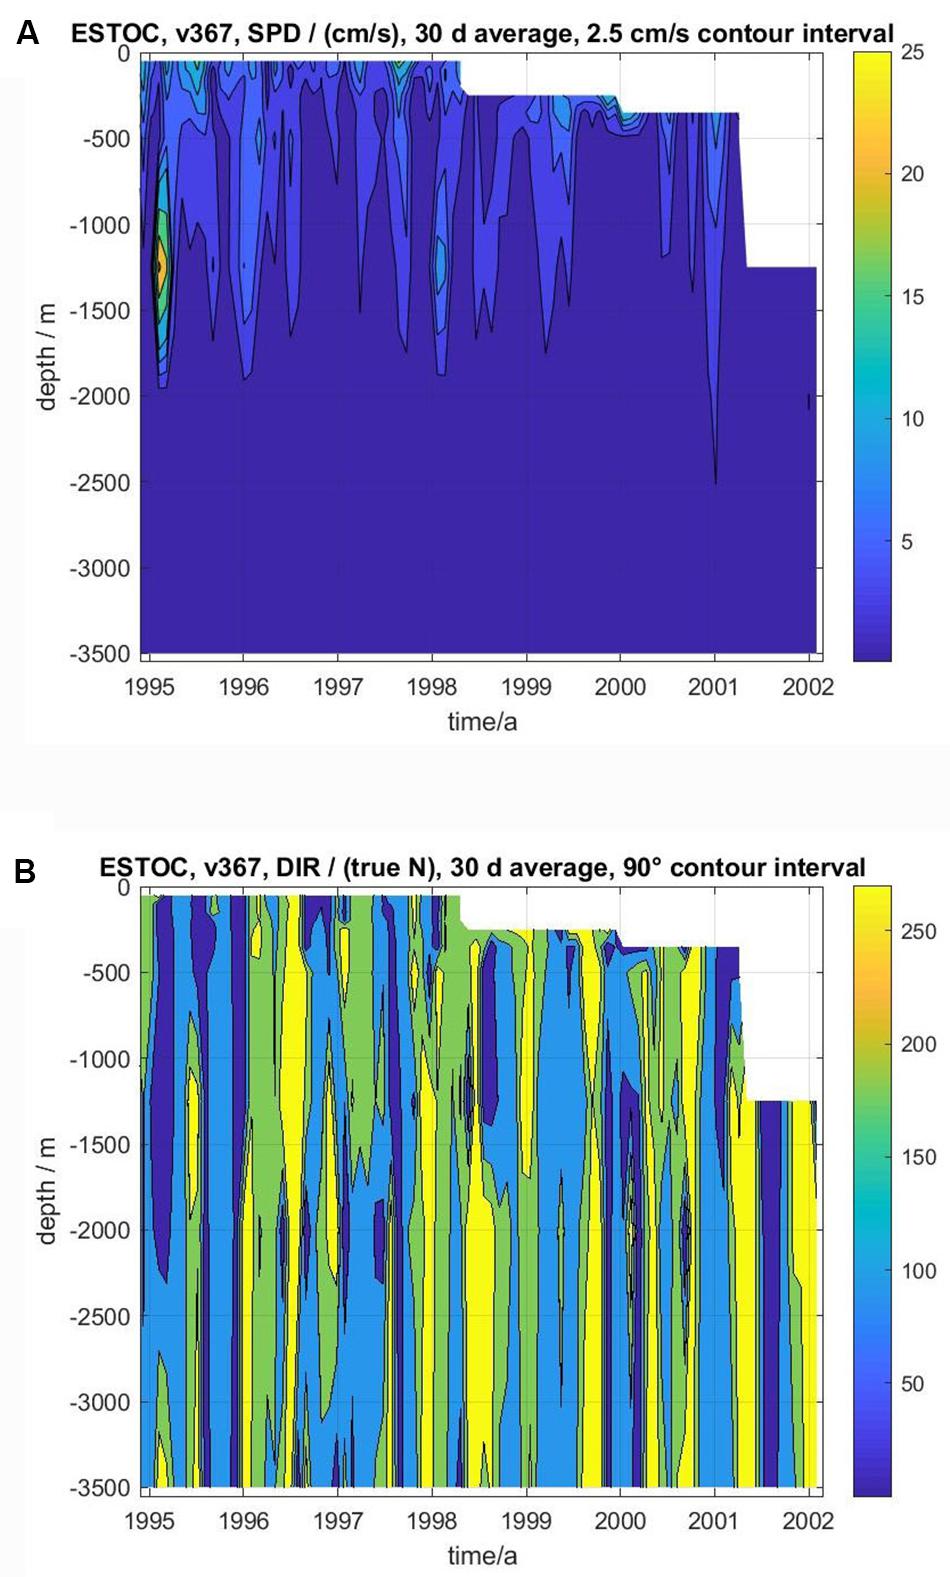
Figure 4. Vector averaged (30 days) current speeds (A, cm s–1) and directions (B, degree direction true north) at ESTOC from November 1994 to February 2002. Contour interval for current speed is 2.5 cm/s between 0 and 10 cm s–1, and 10 cm s–1 above. For direction, contour interval is 90 degrees between 0° and 360°, thus resolving average current directions toward the four sectors North-East NE (dark blue), SE (light blue), SW (green), and NW (yellow). Note that current meter data at ESTOC were measured only between 1994 and 2002, thus covering only part of the period of the trap measurements (1991–2009).
Amplitudes and Timings of Major Flux Peaks and Particle Composition
The cup-by-cup total particle fluxes in the upper (ca. 600–900 m, average ca. 750 m) and middle-depth traps (900–1300 m, average ca. 1050 m) and in the deeper water column (ca. 3060 m) showed a distinctive seasonality of fluxes with maxima mainly in winter and partly in spring, reaching almost 200 mg m–2 d–1 in the mesopelagic and slightly higher values in the bathypelagic (Figure 5). Fluxes at the nearby MSD site (Figure 6) largely followed the flux pattern of the deep ESTOC-traps (Figure 5) but were slightly lower in the bathypelagic as expected due to the greater distance to the coastal upwelling of the Cape Ghir filament (Figure 1A). Fluxes at site MSD decreased continuously from 2002 to 2004, then increased rather abruptly with a high and broad flux maximum in winter 2005 (Figure 6). The BSi fluxes as one indicator (e.g., besides organic carbon) of the efficiency of the biological pump (Dugdale et al., 1995) mirror the total flux patterns both at MSD and ESTOC. The average fraction of BSi of total flux was generally below 5% with the exception of the prominent peak in mid-March 2005 (MSD trap, ca. 10%, Figure 6B).
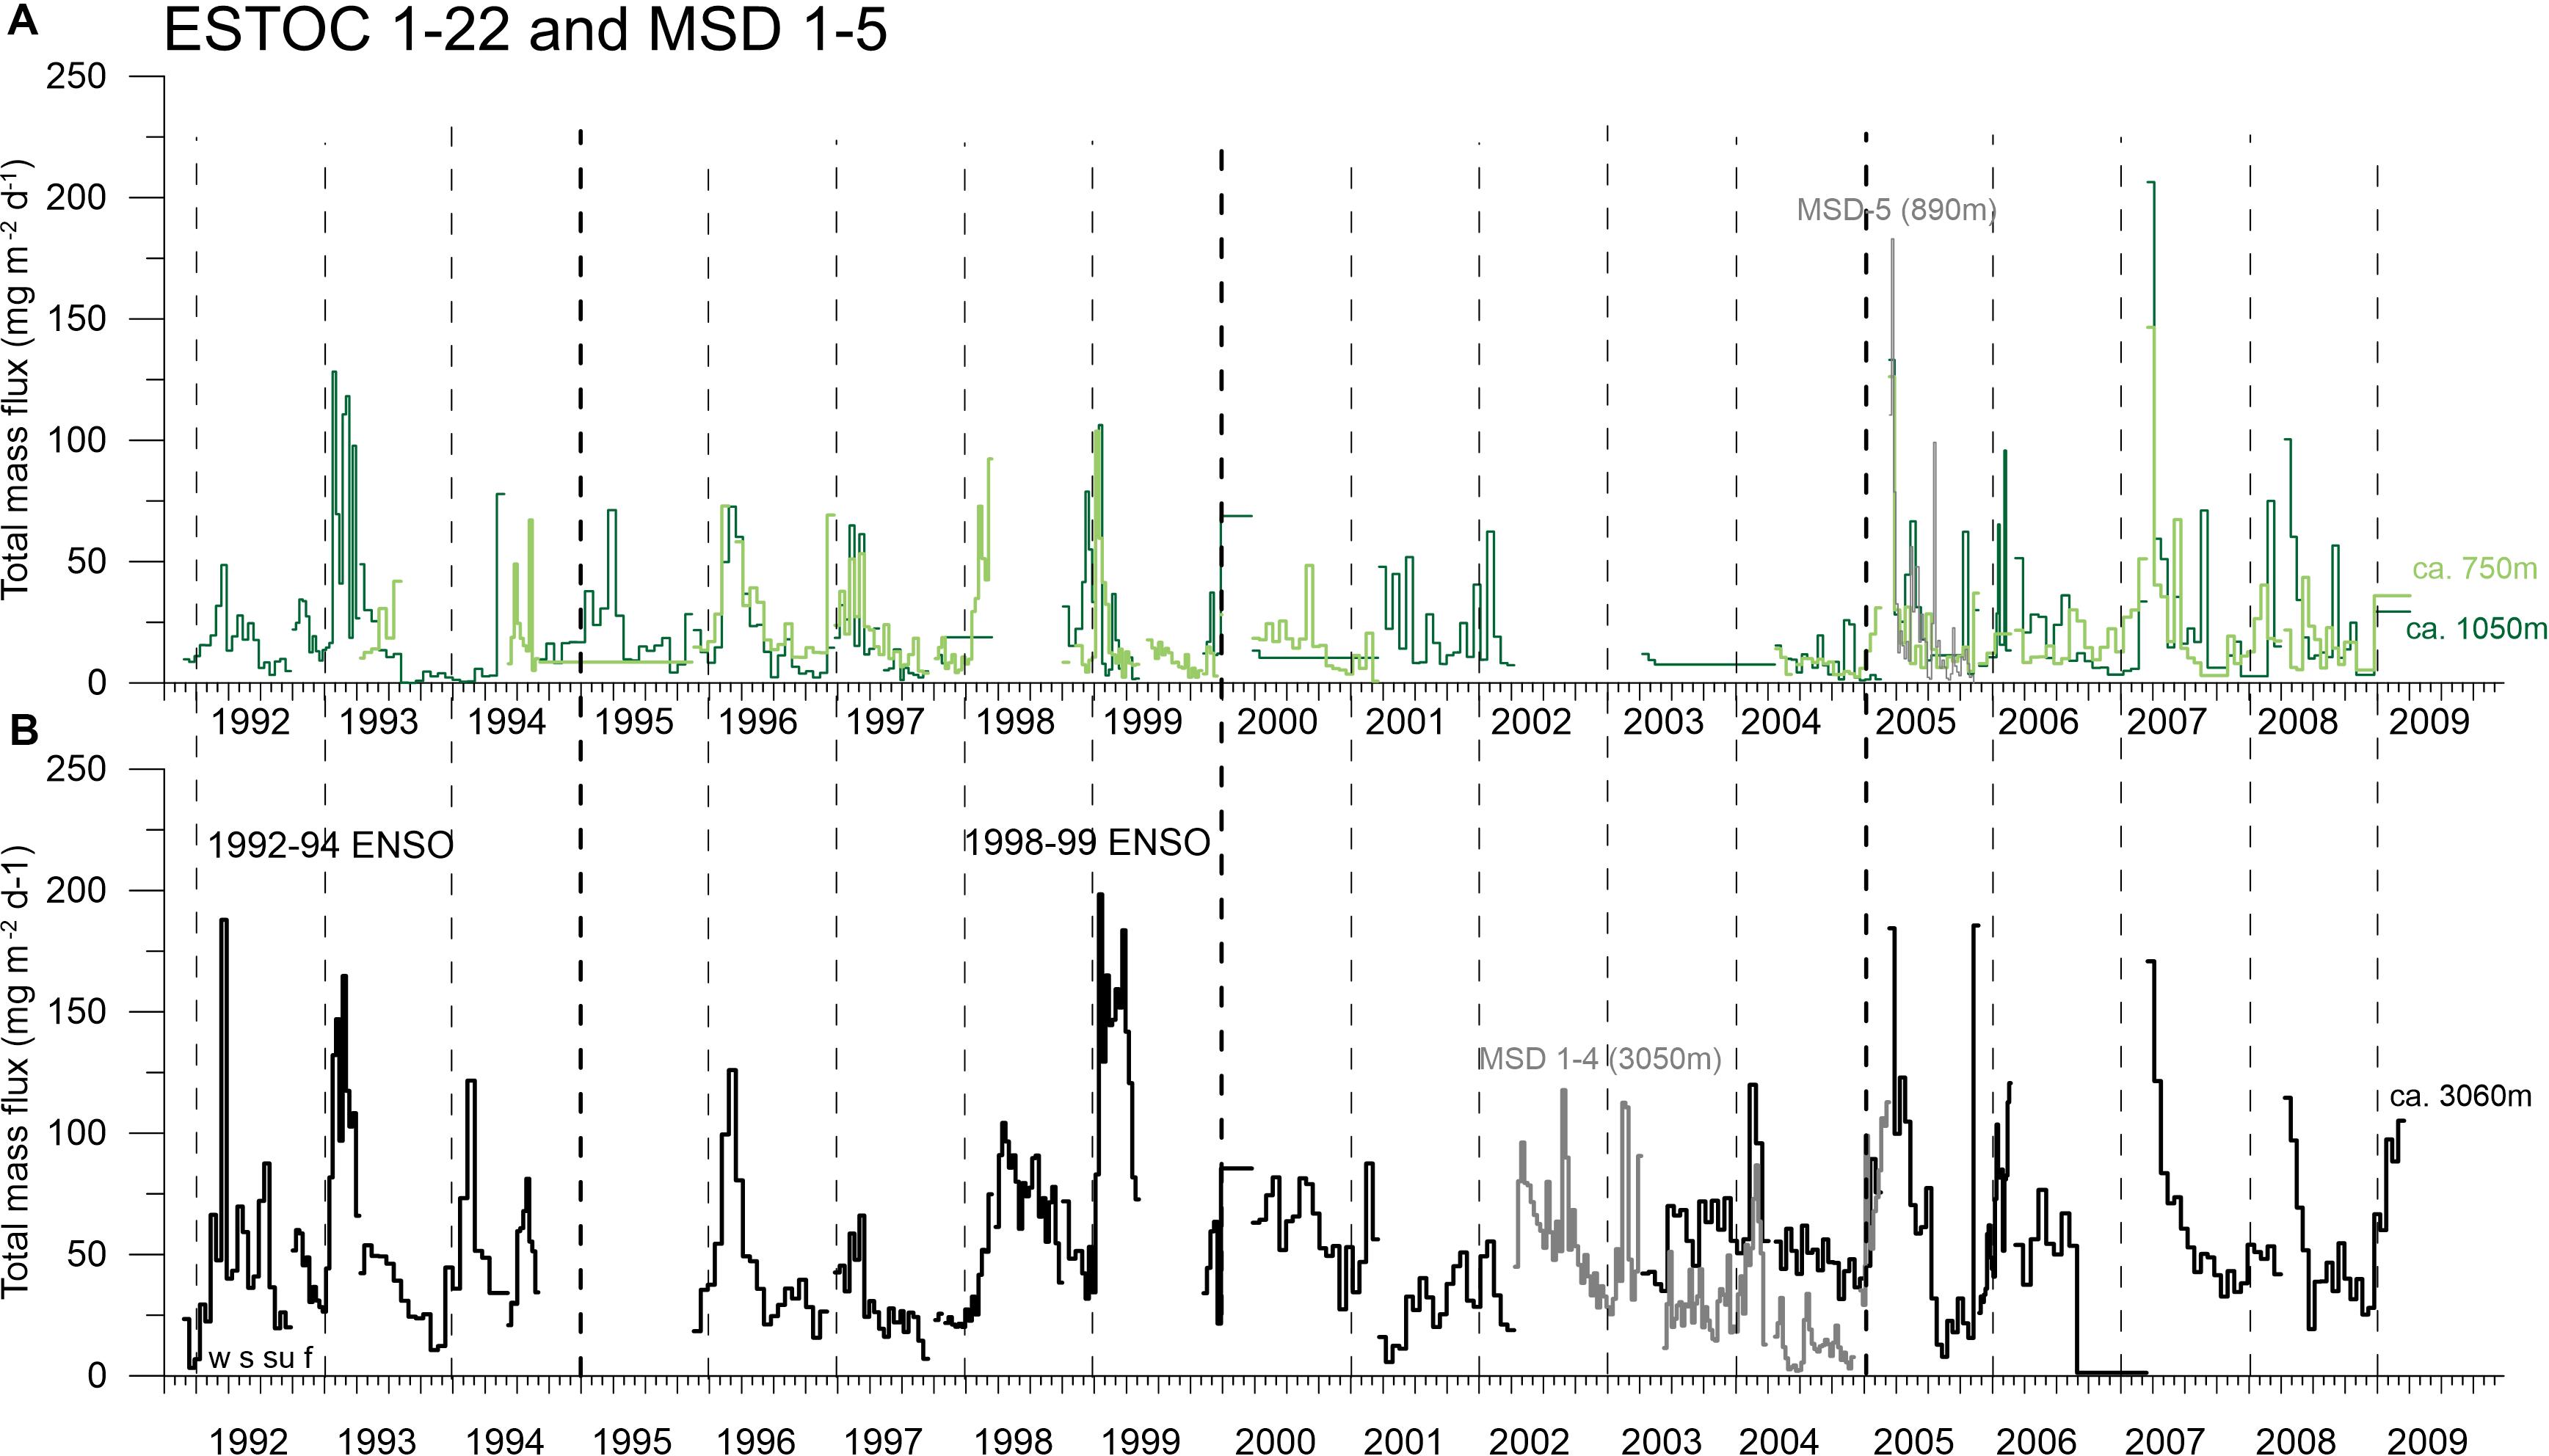
Figure 5. Cup-by-cup data of total particle flux (mg m–2 d–1) at ESTOC (1–22) and the MSD-site 1–5 (see Supplementary Material and Figure 1) for the mesopelagic (A: ca. 750 and 1050 m) and bathypelagic (B: ca. 3060 m). Fluxes in ca. 750 m are only shown here to fill the gaps in the upper water column but will not be used later on for the discussion of flux seasonality. Vertical hatched lines indicate the years (with the four seasons winter = w, spring = s, summer = su, fall = f, starting on Jan. 1), and bold hatched lines indicates the 5-year mark.
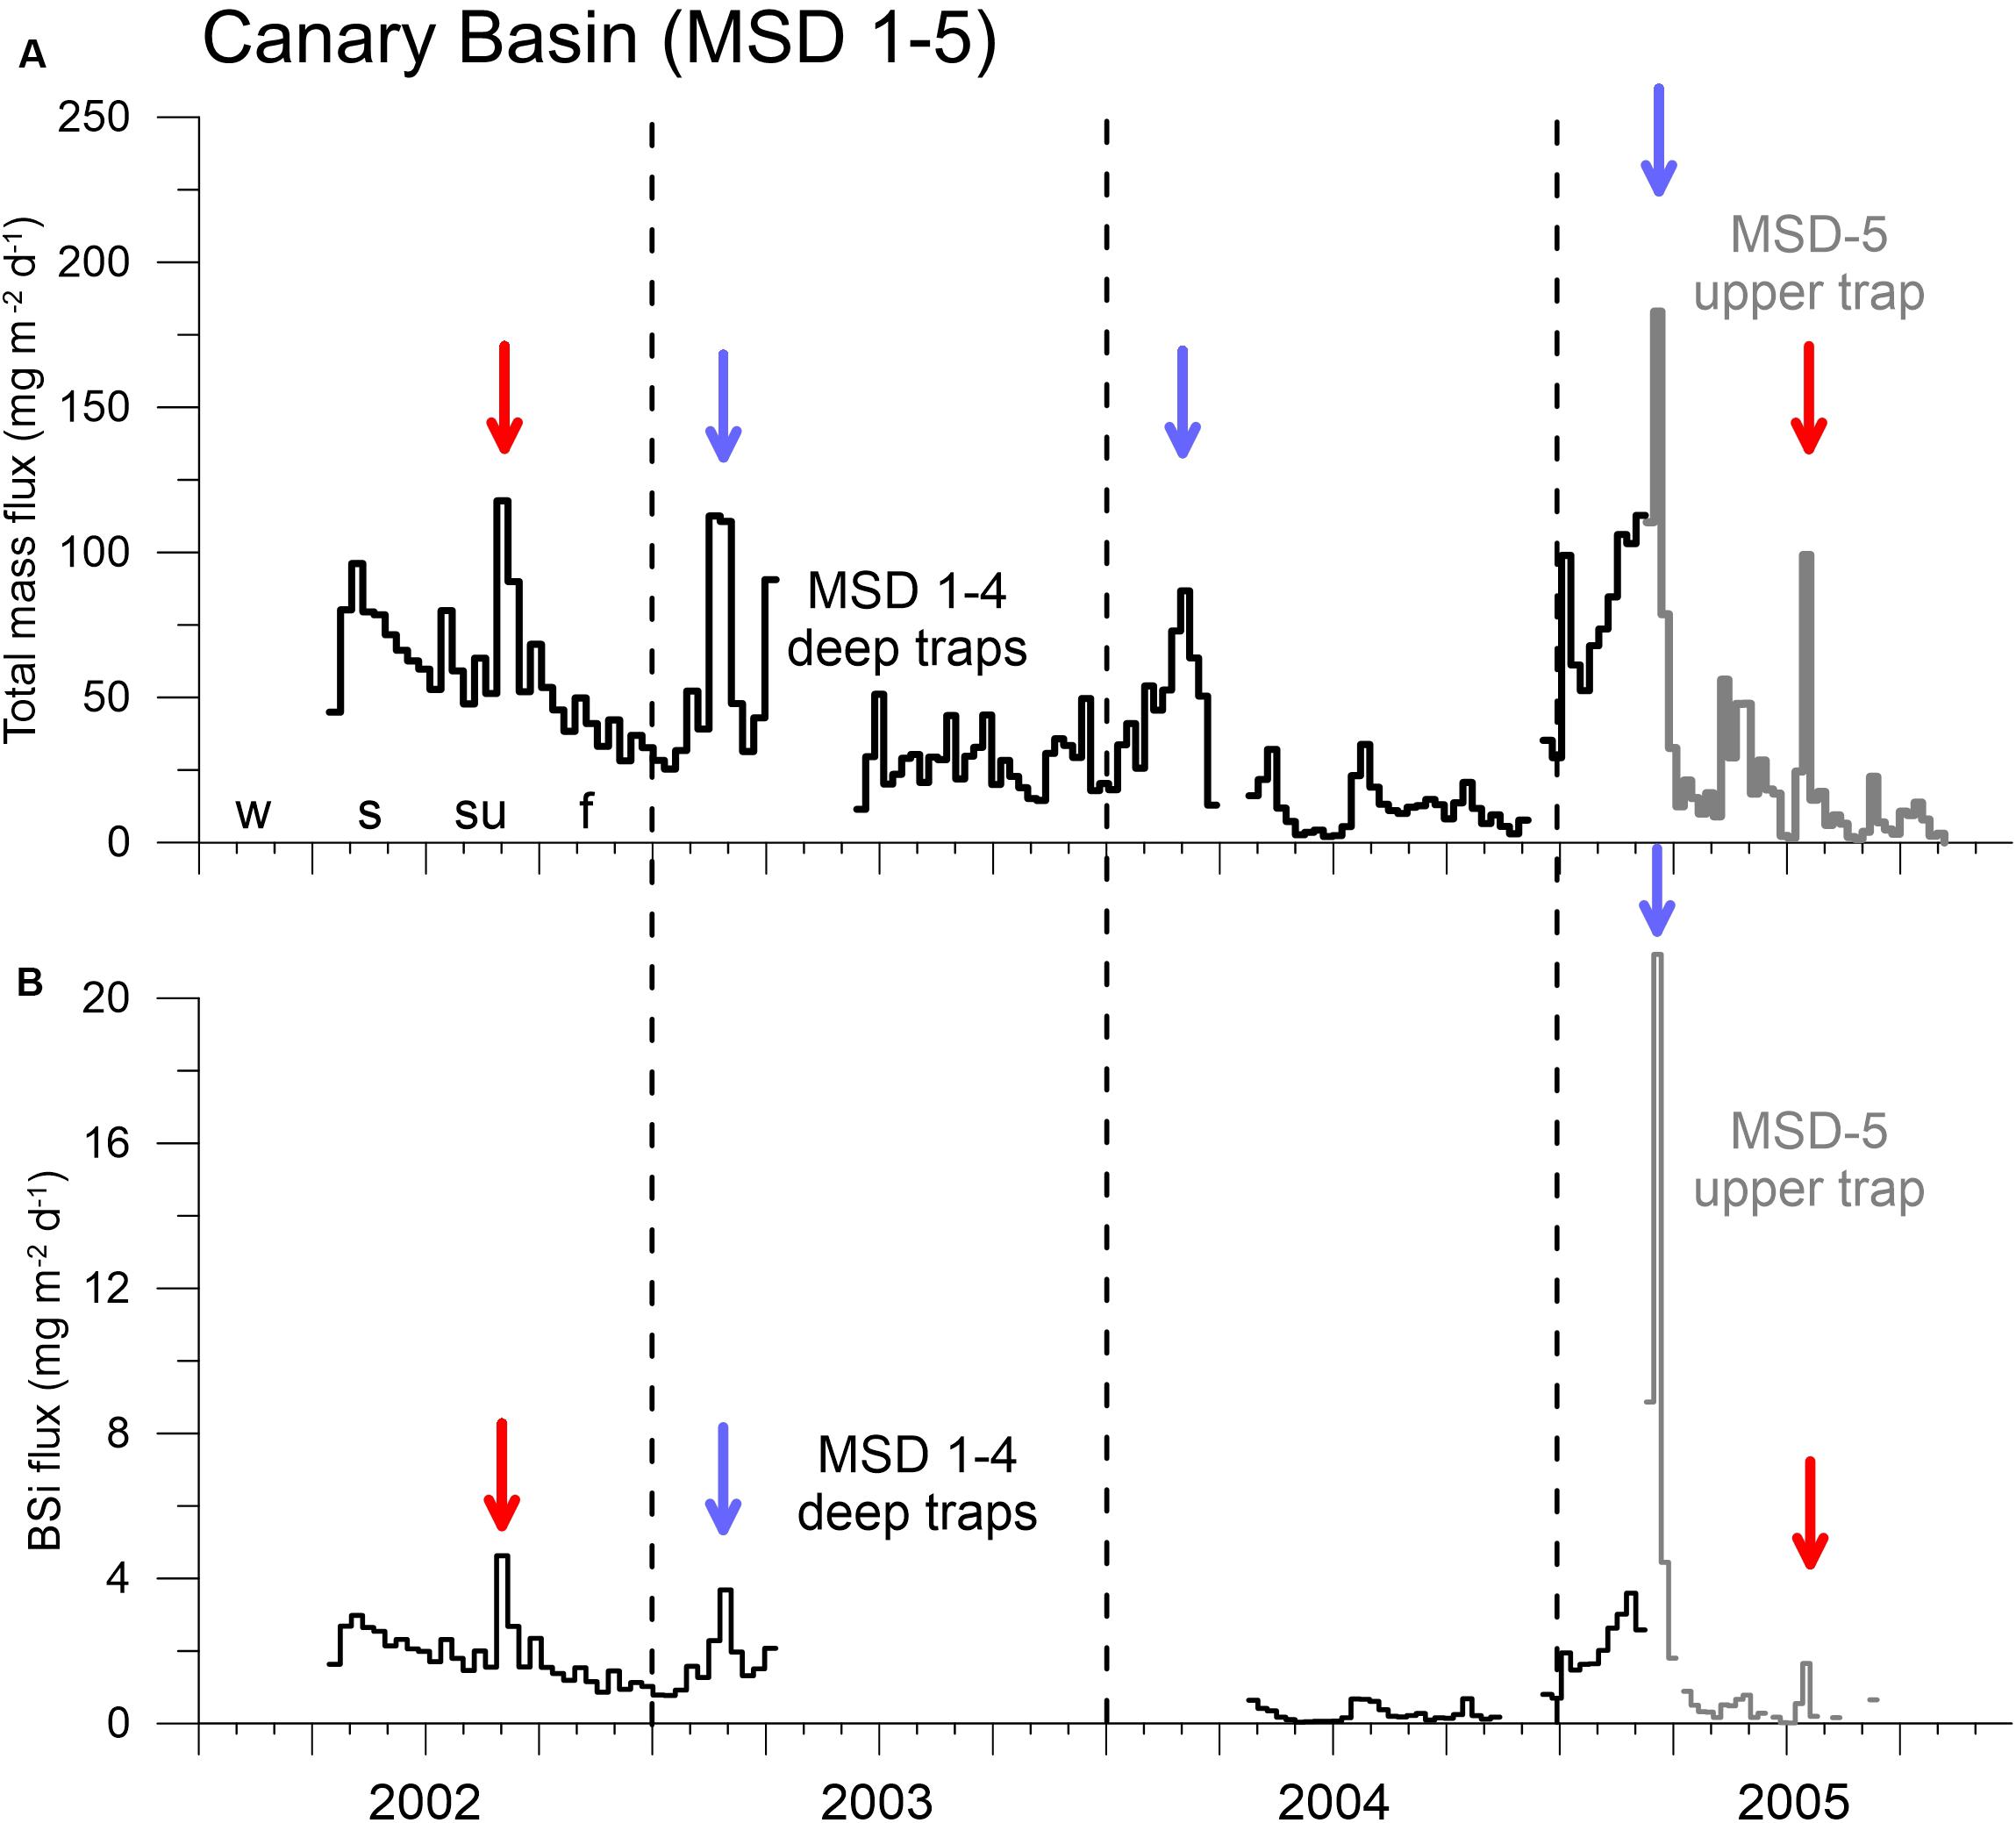
Figure 6. High resolution total mass (A, mg m–2 d–1) and BSi flux (B, mg m–2 d–1) record at the MSD site (MSD1–4 lower traps, MSD-5 upper trap, Supplementary Material) between 2002 and 2005, revealing regular winter peaks in February-March (blue arrows) and unusual high fluxes in winter 2005. Red arrows mark high summer fluxes. Vertical hatched lines indicate the years (with the four seasons winter = w, spring = s, summer = su, fall = f; starting on Jan. 1).
Peak particles fluxes may be almost twice as high in the deeper compared to the upper water column which was attributed previously to lateral advection of particles from the Cape Ghir filament (Figure 1; Neuer et al., 1997, 2002a; Davenport et al., 1999; Freudenthal et al., 2001). The overall correspondence of upper and lower water column fluxes indicates that the deeper traps obtain their material not only from the coastal environment of the Cape Ghir filament but from the oligotrophic setting above ESTOC as well, or that sinking particles from the two different source regions interact. Secondary flux maxima occurred in the summer season, e.g., in 1994, 2000, and 2002, and less clear in 2007 and 2008 (Figure 5). Before 2005, highest fluxes in winter during the major bloom were observed during the strongest ENSO event 1997–1999, but high values were also found during 1992–1993 at both depths levels. Within the time-series, 1992–1994 constituted the second most important ENSO event (Figure 5), all other ENSO events during the period of observation were less important.
Mostly, elevated fluxes in the upper water column and in the deep water appear without any cup/time delay, pointing to high particle settling velocities (200–430 m d–1, Fischer and Karakas, 2009). A time delay of about 1.5 months between surface ocean biomass peaks (chlorophyll-CZCS) and the timing of major winter peaks in the deep water column (Neuer et al., 1997) can be translated into particle settling rates of around 70 m d–1 for the entire water column. Considering the bathypelagic sinking rates of ca. 200–430 m d–1 (between ca. 1 and 3 km; Fischer and Karakas, 2009), this observation could indicate an increase of sinking rates with depths (Berelson, 2002; Fischer et al., 2016).
Using the high-resolution MSD flux record (Figure 6) nearby ESTOC (Figure 1A), we can define a detailed timing of the peak fluxes in the winter season with highest fluxes in February to March 2003 and 2004 in the deep traps and, slightly later, in mid-March in 2005 in the upper trap in the Canary Basin. Additionally, we may identify secondary summer peaks in September 2002 and July 2005 (Figure 6). In the ESTOC record, major peaks in winter were found from January to March (mostly in March) in ca. 1 km and from February to March in ca. 3 km water depths (Figure 5). Later, in 2007 and 2008, maxima occurred from March to April and from April to May in the ca. 3 km traps (Figure 5). During the strong ENSO cycle 1997–1999, maxima in both depth levels were identified in January 1999 and February/March (Figure 5). An unusual major peak occurred in November 2005 (Figure 5), this year was attributed by Fischer et al. (2016, 2019) to an exceptional year of coastal upwelling in the CC-EBUEs further south at Cape Blanc.
Particle Flux Patterns Before and After 2005
Considering the entire ESTOC record, we can observe a clear seasonality and interannual variability of BSi (and organic carbon) fluxes in both the mesopelagic (ca. 1 km) and the bathypelagic (ca. 3 km) water column with major flux peaks in winter and spring (Figures 5–8). In ca. 1 km, the record may be separated into the periods from 1992 to 2004 and 2005 to 2009, when winter flux maxima can be found during the first winter period, while spring maxima occurred thereafter (Figure 7A). This change in the pattern of the seasonal flux maxima from winter to spring was less clear in the 3 km depth level (Figure 7B). At 3 km, mean seasonal BSi fluxes showed winter (1992–2004) and spring maxima (2005–2009) and minima in fall (Figure 8). Note that the described changes of seasonality of fluxes from winter to spring in both depths and the standard deviations in the second period (2005–2009) as a measure for flux variability for each season is based on 4–5 values only and therefore on a lower level of statistical reliability (Figures 8D,H). For comparison to the period of 2005–2009, we showed the fluxes and standard deviations for the period directly before (2000–2004) as well, with a comparable number of observations (Figures 8C,G). The summer and fall variability remained almost the same in 2005–2009 compared to the first period of observation (1992–2004).
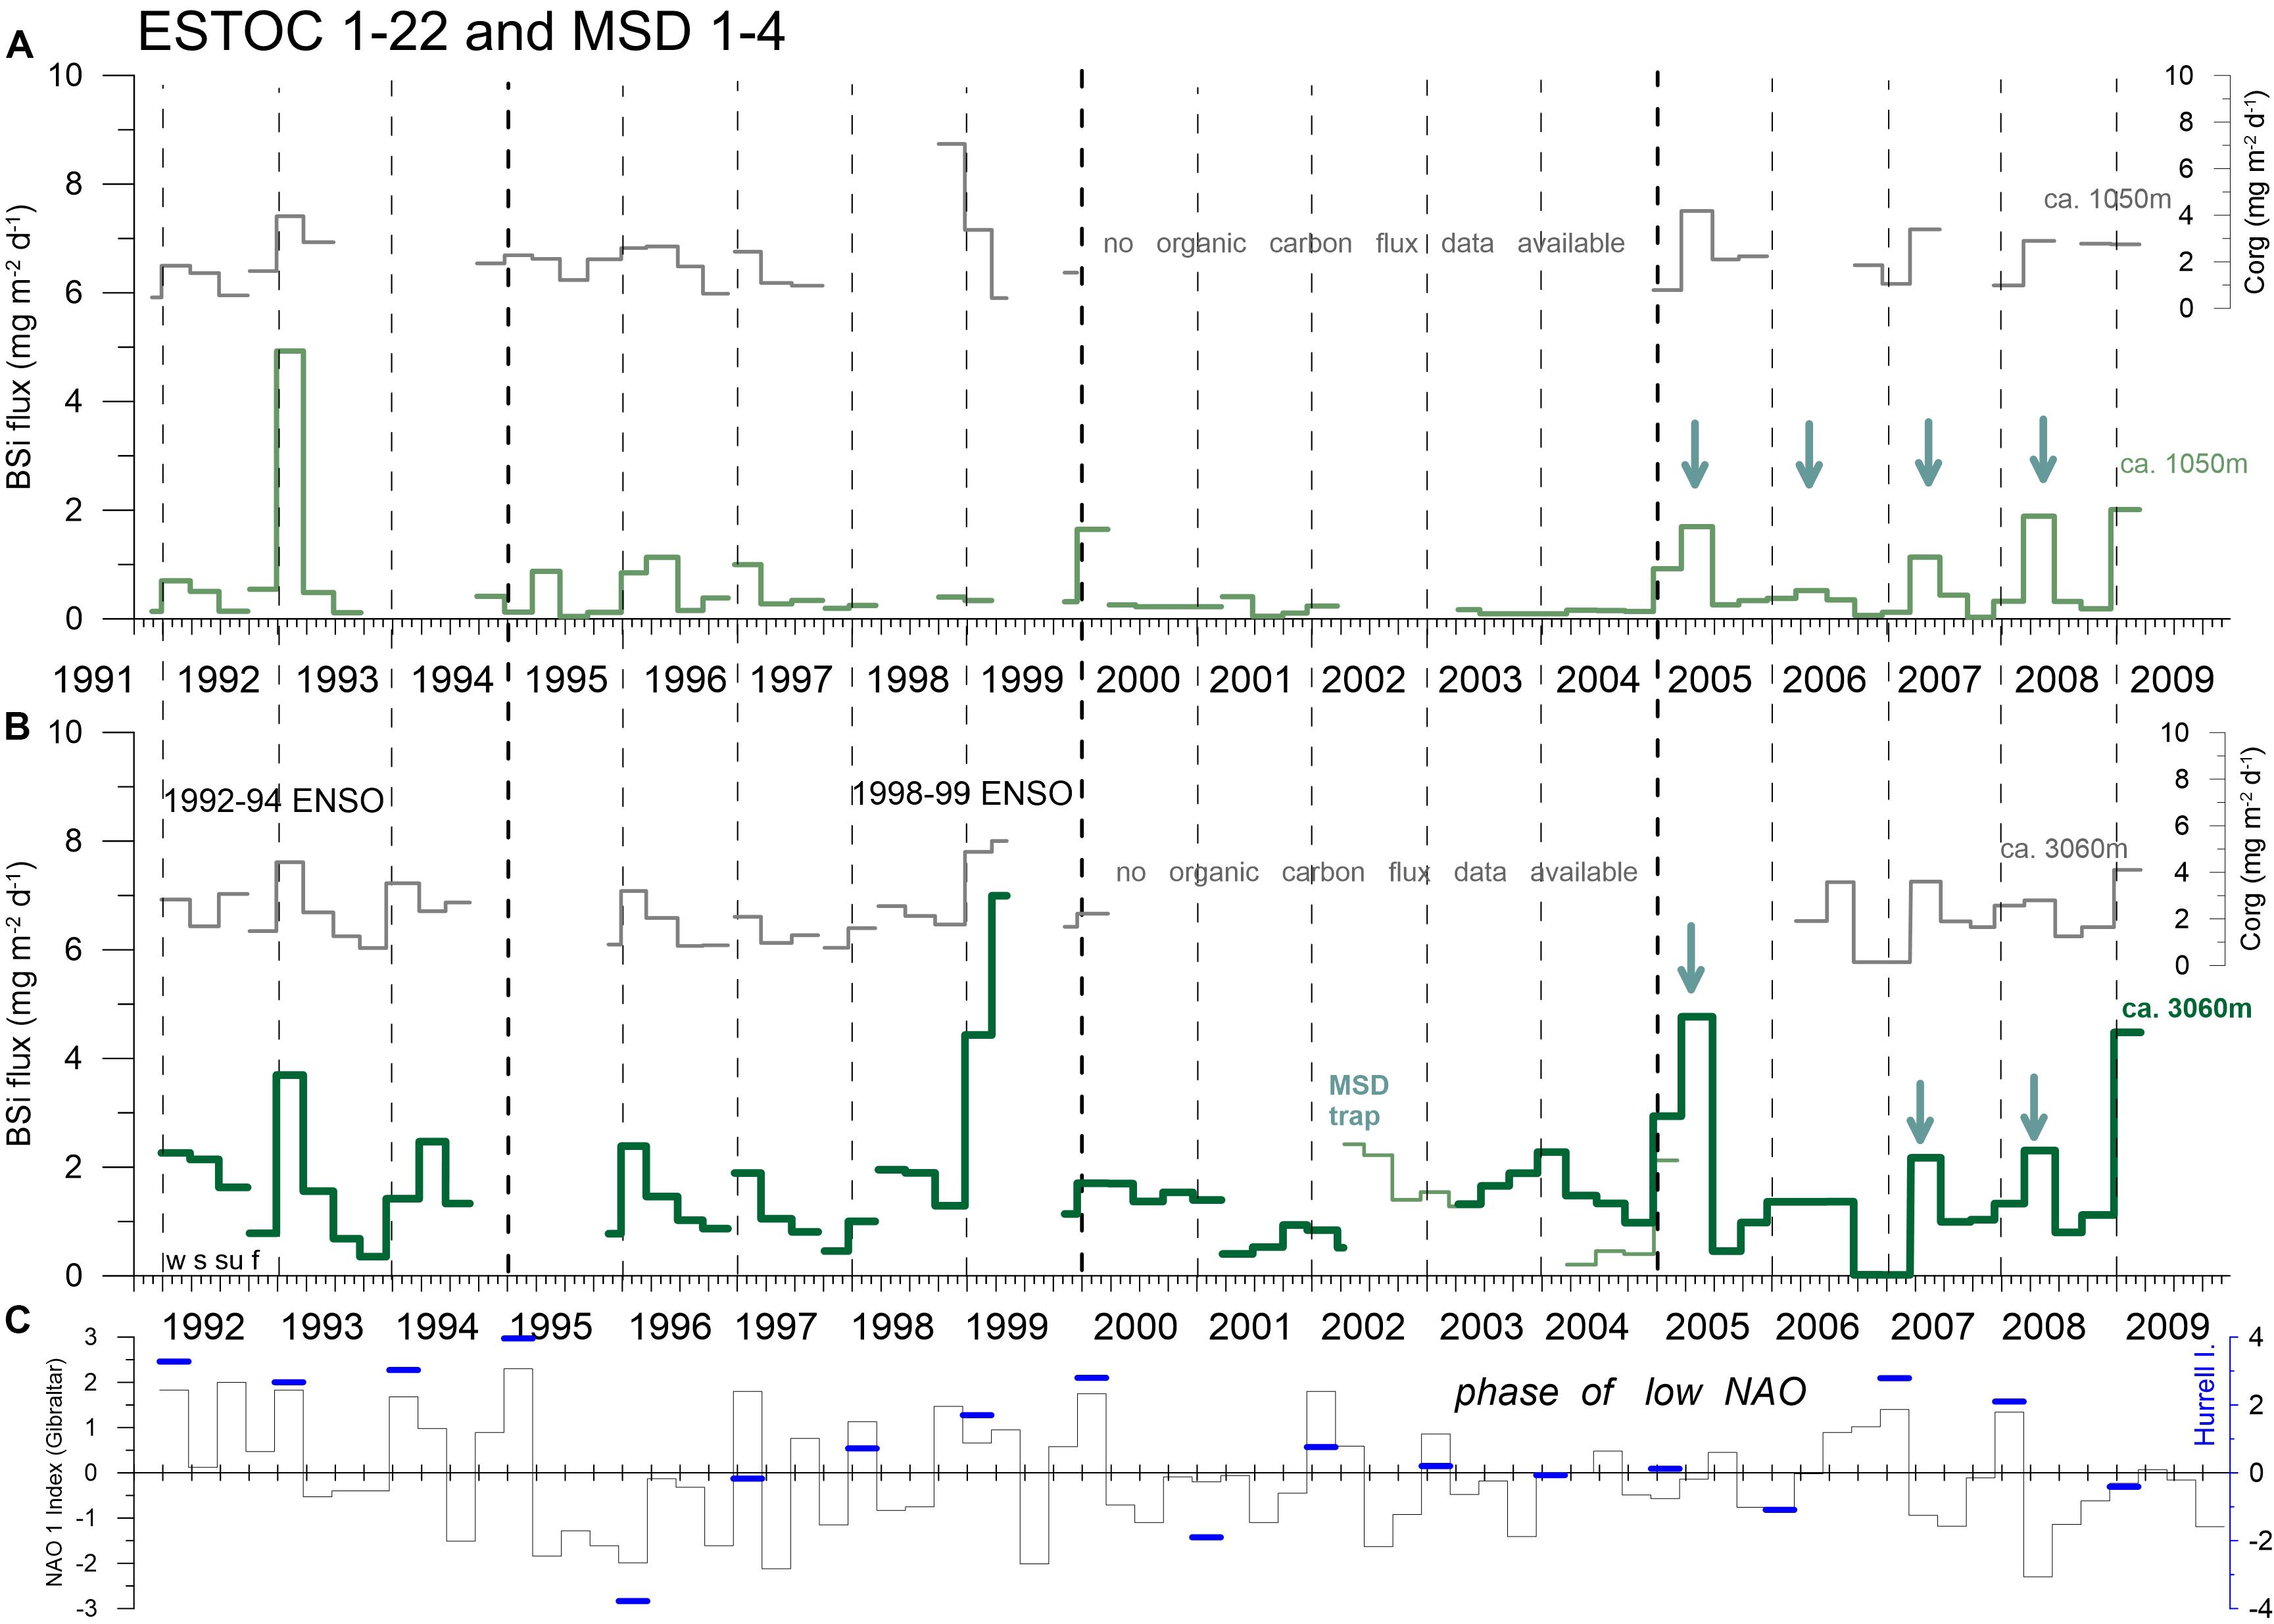
Figure 7. Seasonal fluxes of BSi (mg m–2 d–1) at ESTOC and MSD in the upper (A, ca. 1050 m) and lower water column (B, ca. 3060 m) together with two NAO indices (C). Available organic carbon fluxes are shown as well. Major spring peaks after 2005 are marked with green arrows. Vertical hatched lines indicate years (with the four seasons winter = w, spring = s, summer = su, fall = f; starting on Jan. 1), thick hatched lines indicate a 5-year mark.
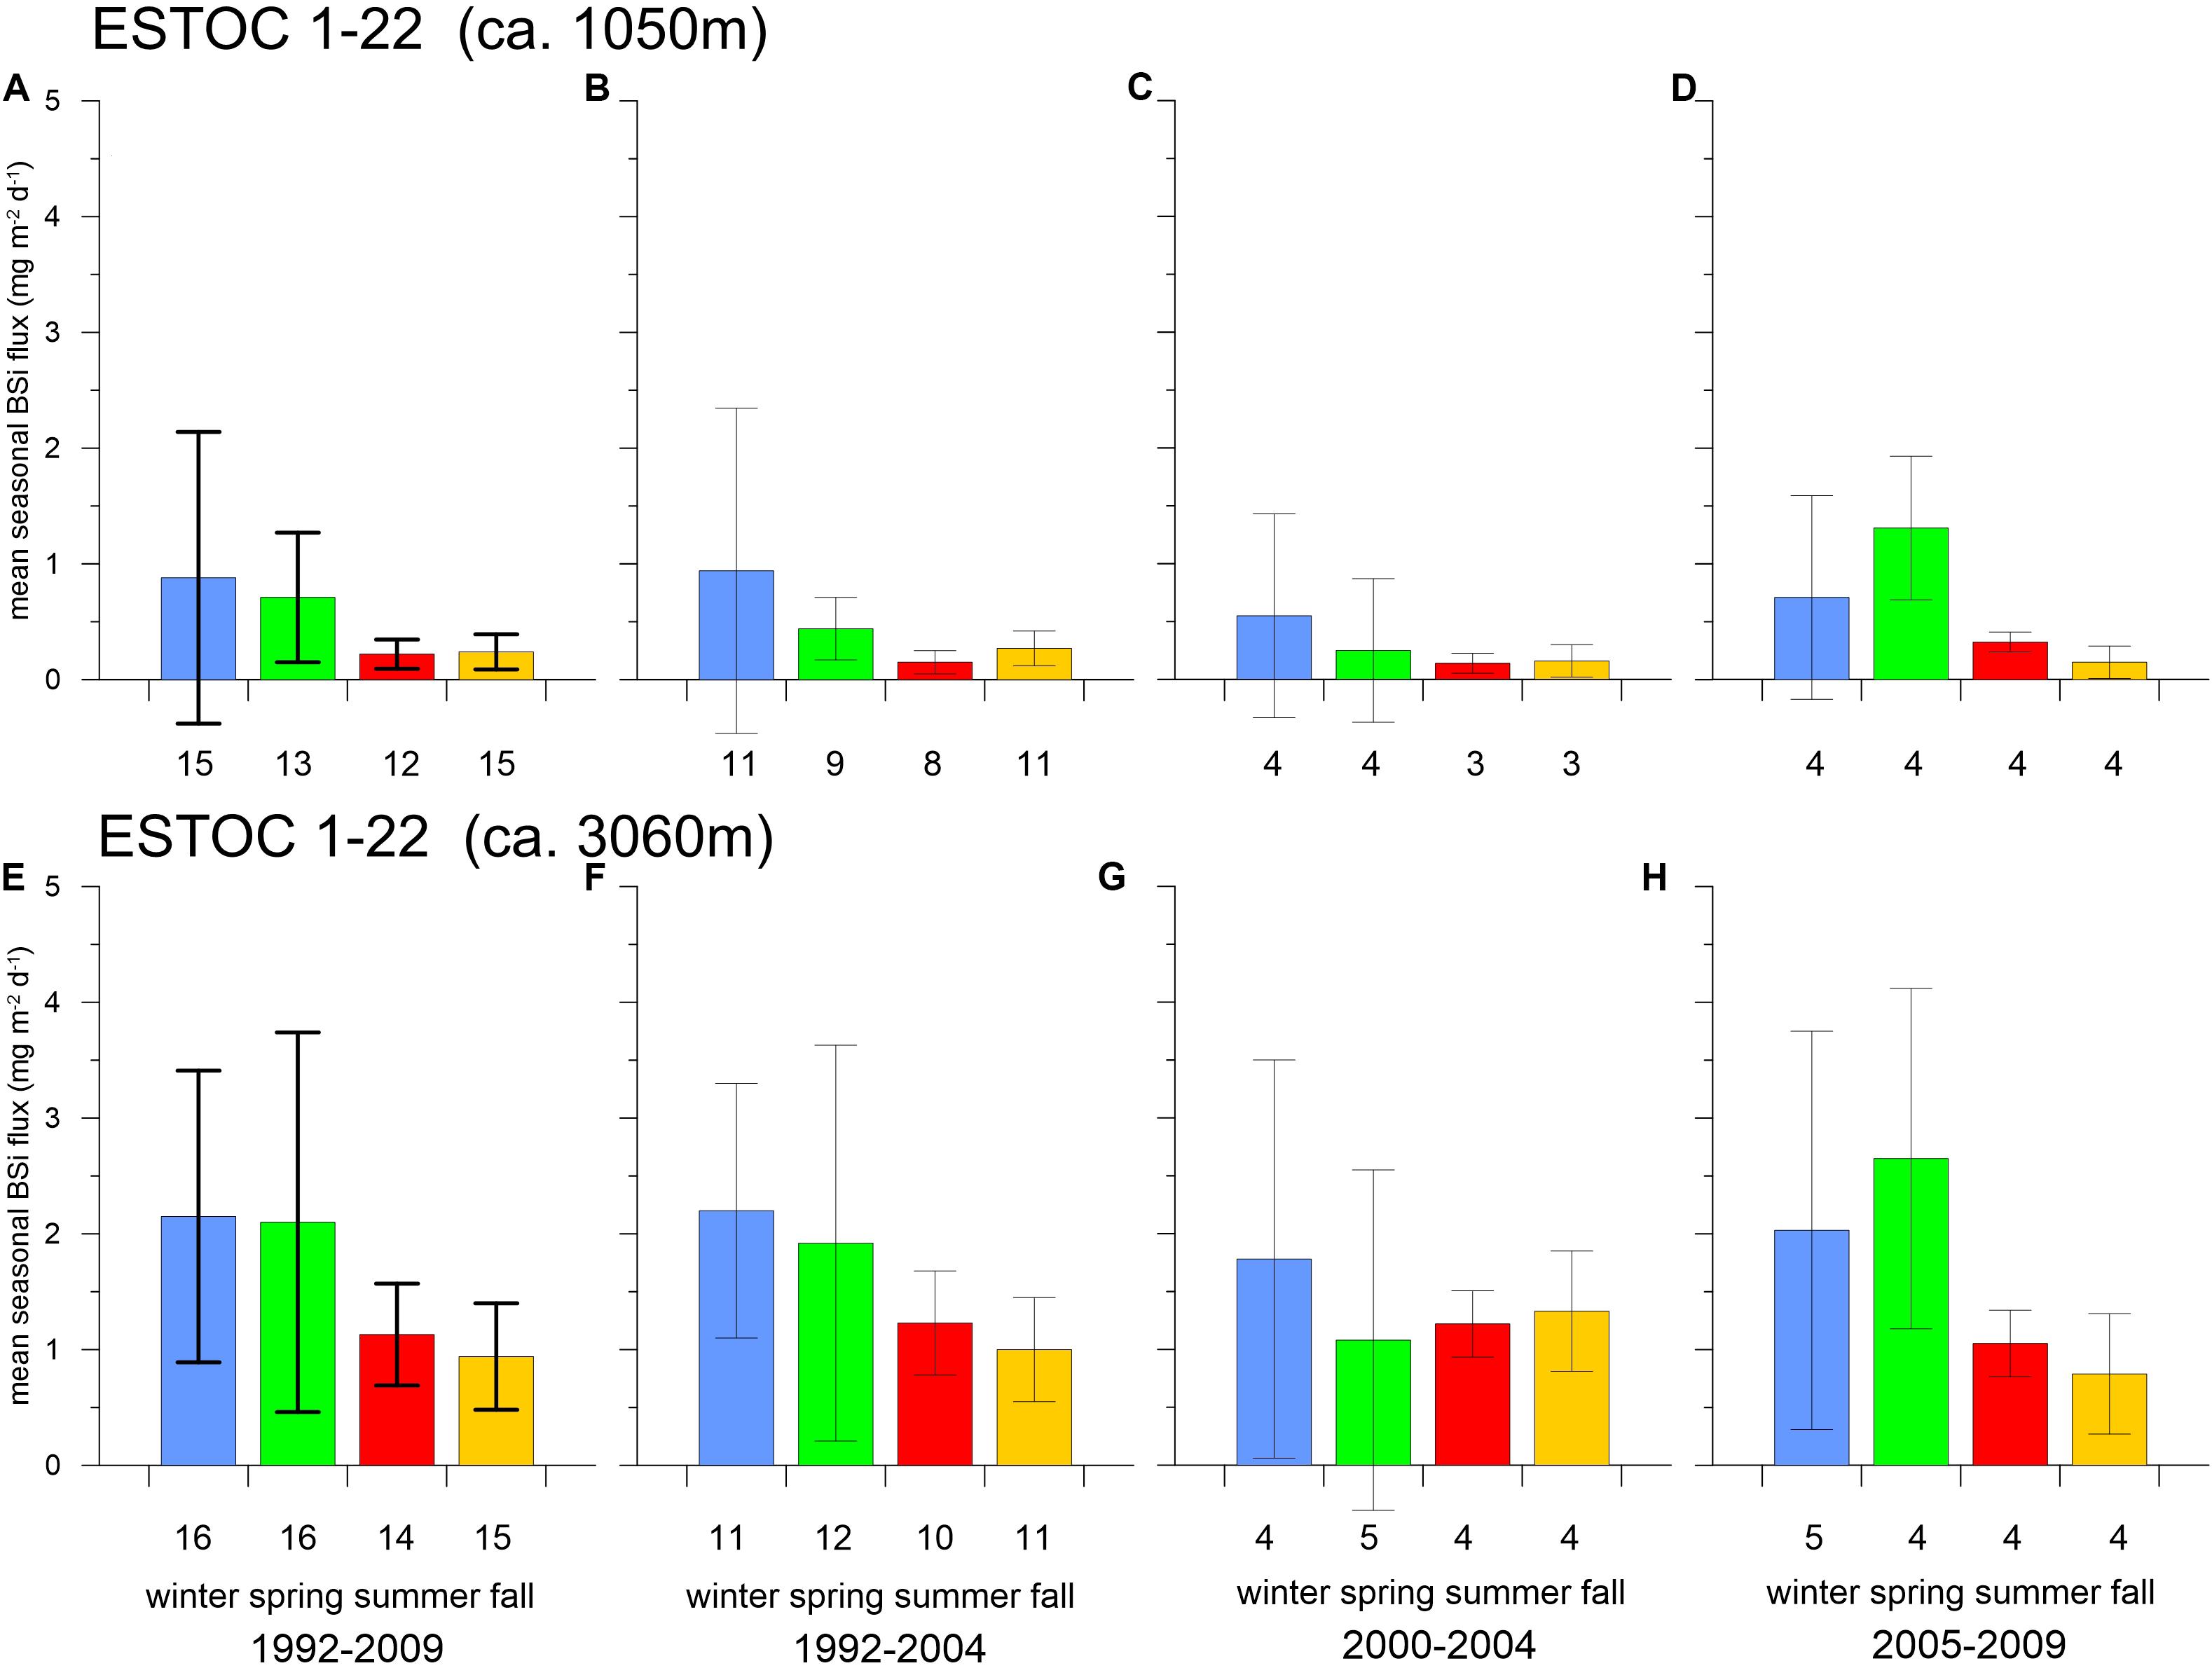
Figure 8. Seasonal means of BSi (mg m–2 d–1) and standard deviations (SD) for the total sampling period, for 1992–2004, 2000–2004, and 2005–2009 derived from the 1 km (A–D) and 3 km (E–H) ESTOC traps. The BSi flux patterns change from winter to spring since 2005. Number of observations are given in numbers below the x-axis; note the low numbers of observations (4–5) for fluxes since 2005.
Discussion
Long-term biogeochemical observations of the oceans are crucial to understand different marine ecosystems and the impacts of natural climate variability and climate change. EBUEs are potential hotspots for observing climate change impacts on oceanic systems (e.g., Garcìa-Reyes et al., 2015). However, distinguishing between natural climate variabilities such as the NAO and trends due to global change requires time series observations in the order of ca. 4 decades. Such observations are available for e.g., SSTs and wind data which are essential to analyze and understand coastal upwelling and test for instance the Bakun upwelling intensification hypothesis (Bakun, 1990; Bakun et al., 2010, 2015; Cropper et al., 2014). However, computed upwelling intensities (Bonino et al., 2019) do not necessarily result in increased primary production, elevated carbon export and deep carbon sequestration. Hence, in order to study the potential changes of the biological carbon pump over decades and over a larger area, time- and space-integrating flux measurements with sediment traps are a useful tool. Studies on interannual to decadal variations of particle fluxes from coastal upwelling areas (EBUEs) or locations influenced by coastal upwelling (i.e., ESTOC) are rare. Even more, research on the relationship of particle fluxes and deep ocean carbon sequestration to low frequency climate variability and climate change is lacking due to the limited observations of most flux studies and the complex forcings on the respective EBUEs (e.g., Bonino et al., 2019).
A long-term flux record (1989–2017) at ca. 4000 m from the northern Californian Current shows increasing POC flux events during the last decade (Smith et al., 2018). Additionally, a warming trend during the past 100 years can be observed influenced by ENSO and associated with an increasing importance of harmful algal blooms since 1985 (Checkley and Barth, 2009). In the southern CC-EBUEs off Cape Blanc (Mauritania), the biogenic flux records show no indications of a coastal upwelling intensification (Fischer et al., 2016, 2019) and the biogenic flux relationships to the NAO turned out to be biased by short-term episodic flux changes (Fischer et al., 2016). We will discuss in the following the two-decade long flux record of ESTOC in the offshore region of the northern CC-EBUEs (in comparison to the CB records in the southern part) with a focus on the development of the biological carbon pump which is strongly influenced by the coastal Cape Ghir filament and its environmental changes.
Influence of Chlorophyll SSTs and MLD on Particle Fluxes at ESTOC
The SeaWiFs time-series of chlorophyll point to a more distinct and different seasonality at ESTOC than at the coastal site Cape Ghir site (Figures 2, 9). A co-maximum in seasonal chlorophyll of both boxes can be seen during the major production seasons in winter (Figure 9). This suggests a connection between ESTOC and the Cape Ghir filament, either due to lateral advection of water masses with higher phytoplankton biomass or a coincidence of the occurrence of the spring bloom following deep winter mixing of the surface ocean. Lateral advection of chlorophyll (as a proxy of phytoplankton biomass) is evident in similar coastal upwelling filament settings such as the giant Cape Blanc filament (e.g., Helmke et al., 2005) or in other EBUEs (e.g., in the California Current; Barth et al., 2002). However, ESTOC is outside the direct impact of the Cap Ghir filament, as seen by the minima in chlorophyll at ESTOC in summer (ca. 0.1 mg chl m–3) but varied strongly in the Cape Ghir box with highest summer values of ca. 0.6 mg chl m–3 (Figure 2), indicative of episodic upwelling and filament activity in summer (Davenport et al., 1999). From 2005 on, chlorophyll peaks at ESTOC became increasingly higher and broader (Figure 2). In the ESTOC-chlorophyll time series (Figure 2), significant monthly trends were not observed (p > 0.05). However, concerning the Cape Ghir chlorophyll time series (Figure 2A), the overall trend was significant (p < 0.05) and was mainly driven by a positive trend in September (p < 0.05).
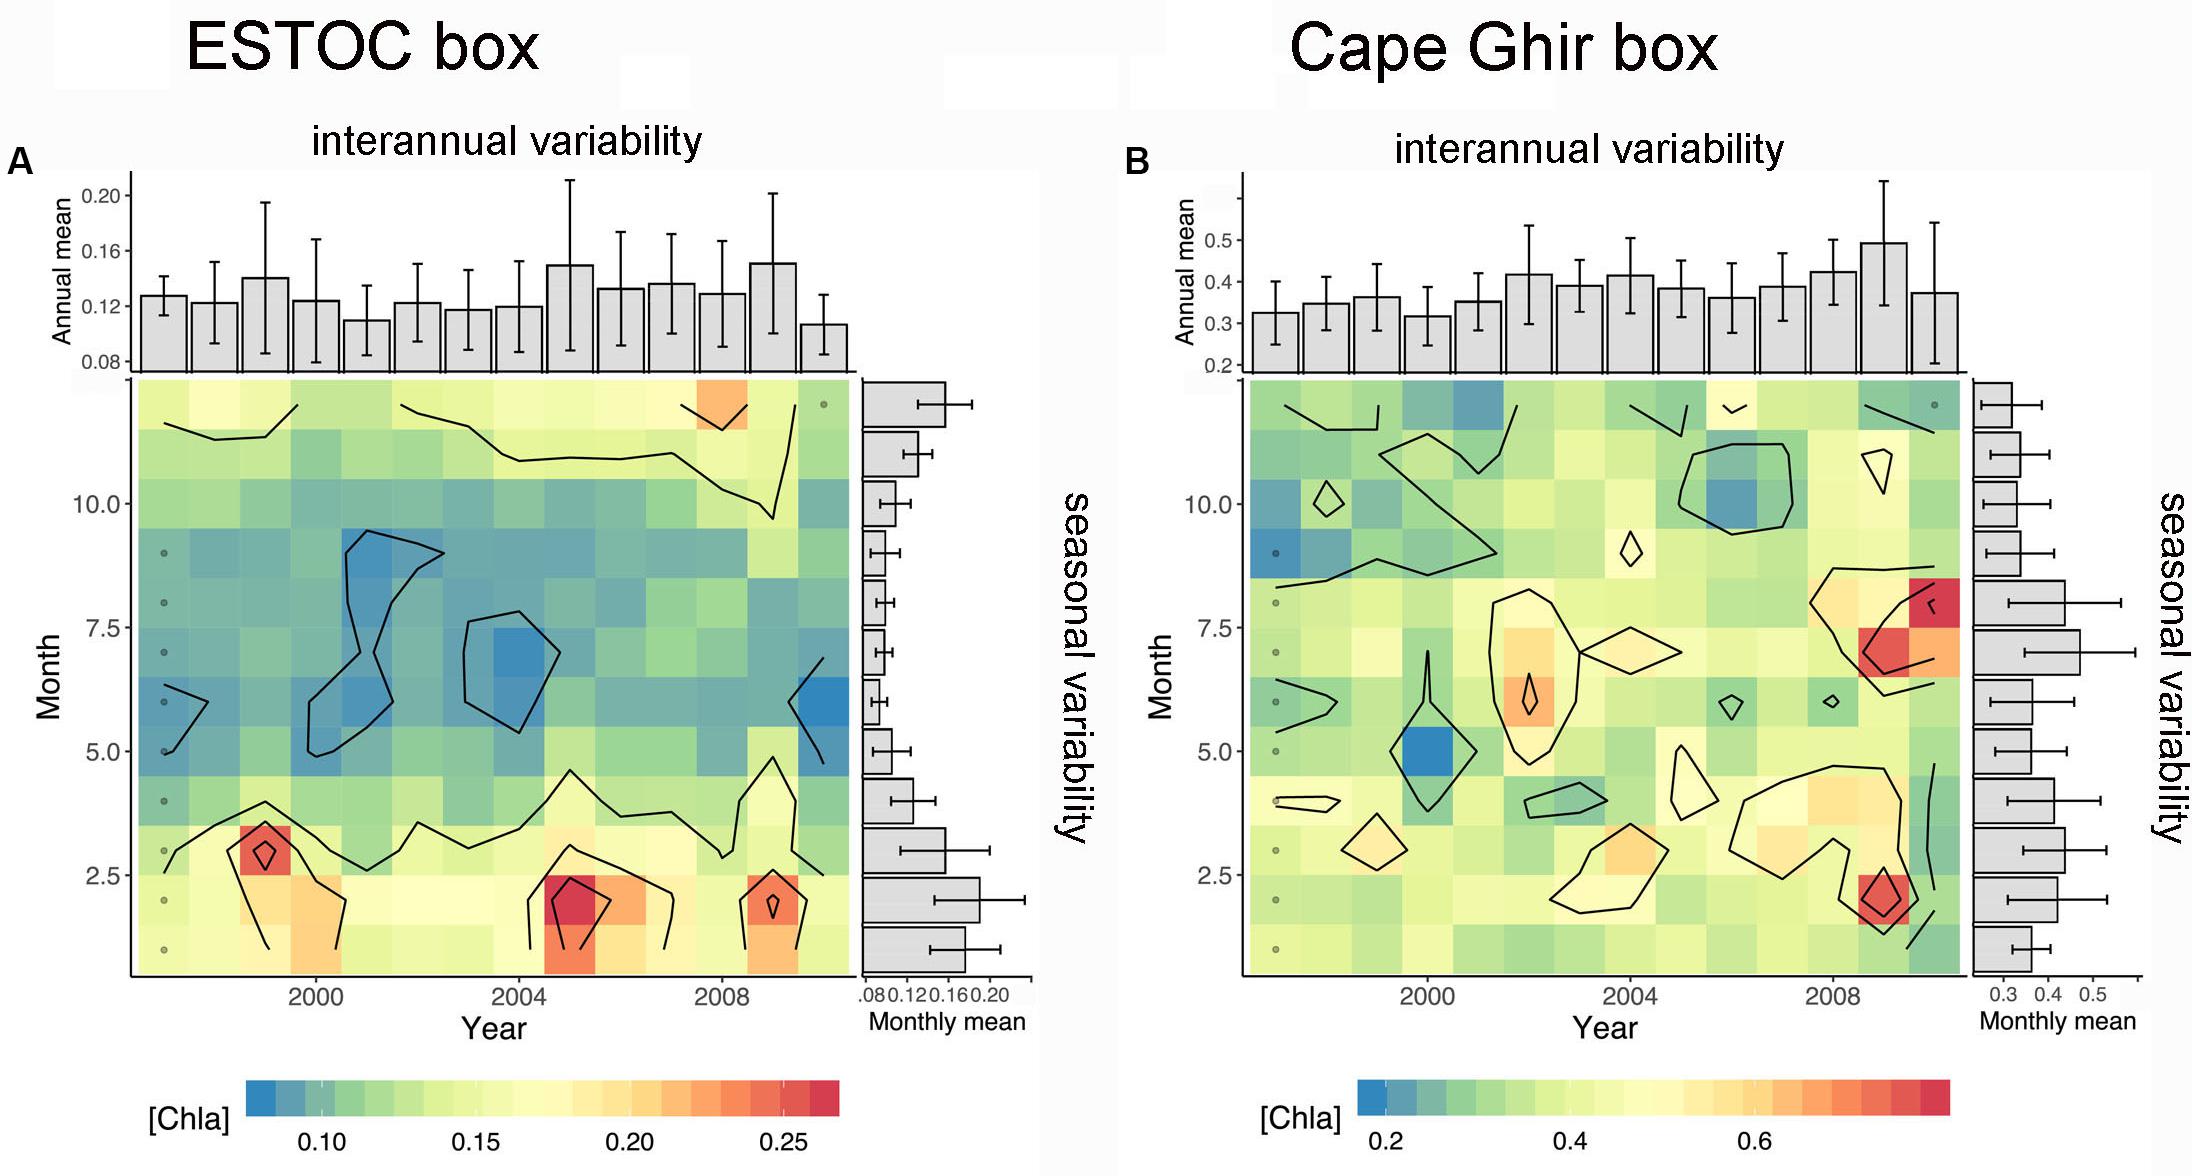
Figure 9. Seasonal vs. interannual variability of SeaWiFs-chlorophyll for the ESTOC (A) and the Cape Ghir box (B). Note the difference in seasonality between both boxes (summer maximum at Cape Ghir) and the long term increasing trend in chlorophyll from 1997 to 2010 mainly off Cape Ghir. Gray dots represent the squares interpolated by the Barnes method.
Neuer et al. (2007) found a clear seasonality in phytoplankton development at ESTOC with winter maxima, coinciding with the time of deepest winter MLD. We found the highest correlation coefficients between MLD and the strength of the biological carbon pump represented by the deep BSi fluxes (Dugdale et al., 1995) in winter (Table 1). However, these relationships are statistically insignificant (p > 0.05). We have to consider, that the modeled MLDs at ESTOC in winter (DJF) is shallower than the observed MLD at ESTOC (c.f. Neuer et al., 2007), in particular during the overlapping winters DJF 1997/1998, DJF 1998/1999, and DJF 1999/2000. We have no detailed explanation for this discrepancy. However, it is known that the present global and ocean scale models still lack accurate outputs, the more difficult the underlying physical processes (i.e., in a filamental zone with eddies) are to be described and the finer the scales the model has to resolve.
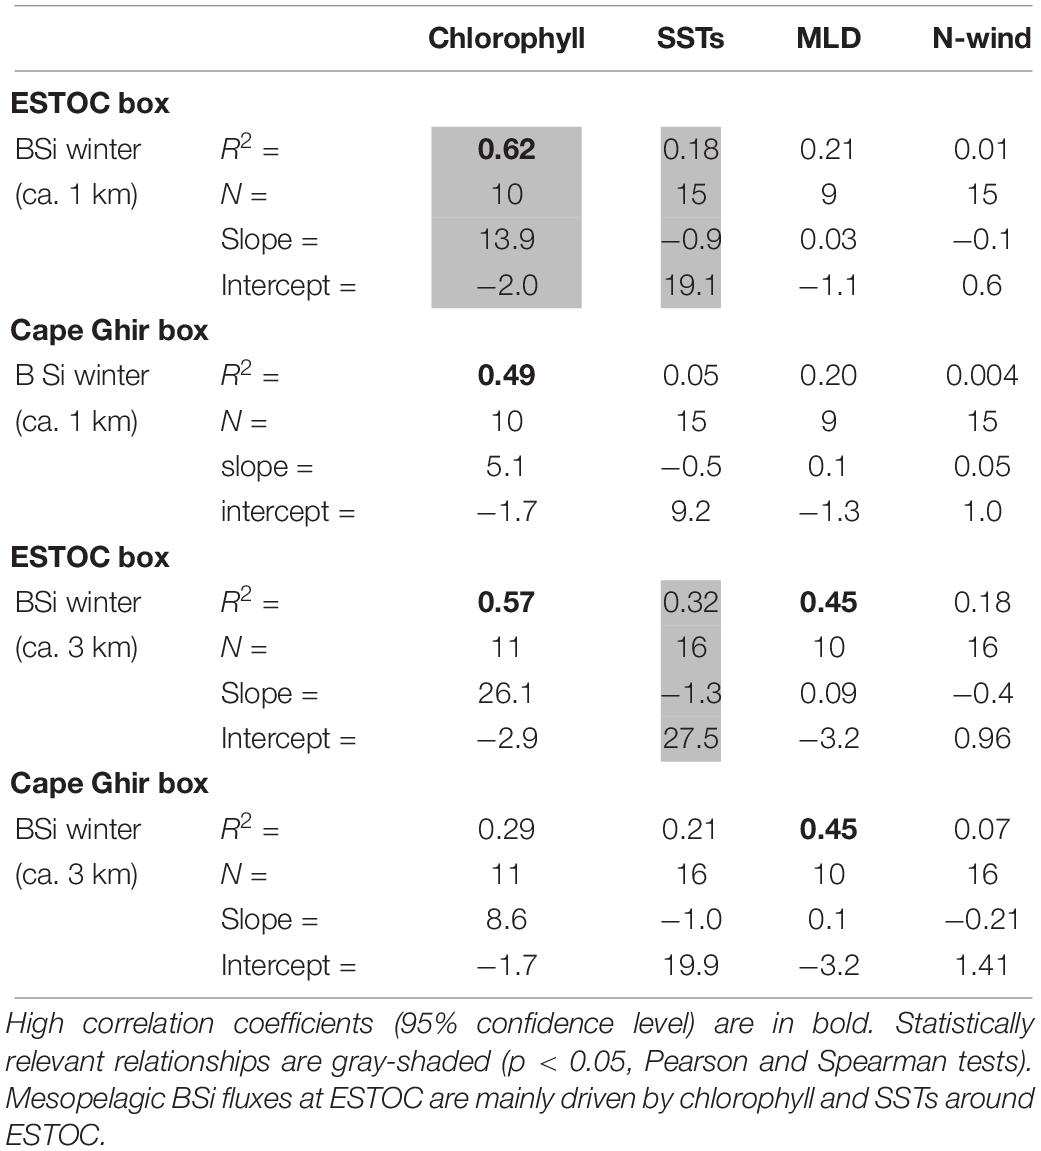
Table 1. Regression parameters of mean winter BSi fluxes measured at 1 km and 3 km depth vs. the environmental variables from both boxes.
Compared to the CZCS-chlorophyll time series (1979–1985; Figure 3), the SeaWiFs-chlorophyll (1997–2009; Figure 2) record points to an increasing importance of summer maxima since the 1980s in the Cape Ghir filament (Figure 9). CZCS- chlorophyll show clear winter maxima, mostly at the turn of the year or in January/February (Figure 3), whereas SeaWiFs-chlorophyll reveals major peaks in March to April (Figure 2). Further, there is a tendency of a biomass increase from 1997 to 2009 in the coastal Cape Ghir filament (Figures 2, 9) which is consistent with trends shown by Arístegui et al. (2009). A significant relationship is provided between the SST at ESTOC and the BSi fluxes in both depth levels (p < 0.05, Spearman Test, Table 1) which has implications for climate change scenarios with increasing temperatures.
For the 1 km traps, we observed a significant correlation (p < 0.05) between BSi and SeaWiFs-chlorophyll for the ESTOC box (Table 1). This suggests that the biogenic fluxes recorded in the bathypelagic at ESTOC were also determined by the area above ESTOC, in addition to the influence from the more remote coastal upwelling filament of Cape Ghir (Neuer et al., 1997; Davenport et al., 1999; Freudenthal et al., 2001). However, this lateral contribution could be more important during the winter-spring seasons with increasing wind fields as observed for the Cape Blanc area (Fischer et al., 2009). In a new modeling study conducted in this region of the Cape Ghir filament, Santana-Falcón et al. (2020) obtained highest lateral advection of POC and DOC in spring and summer. However, the distinct summer chlorophyll peaks observed at Cape Ghir (Figure 9) resulted only in a small increase in fluxes peaks in the deep ESTOC traps (Figure 10), pointing to reduced lateral advection of particles during this season when considering the particle flux records.
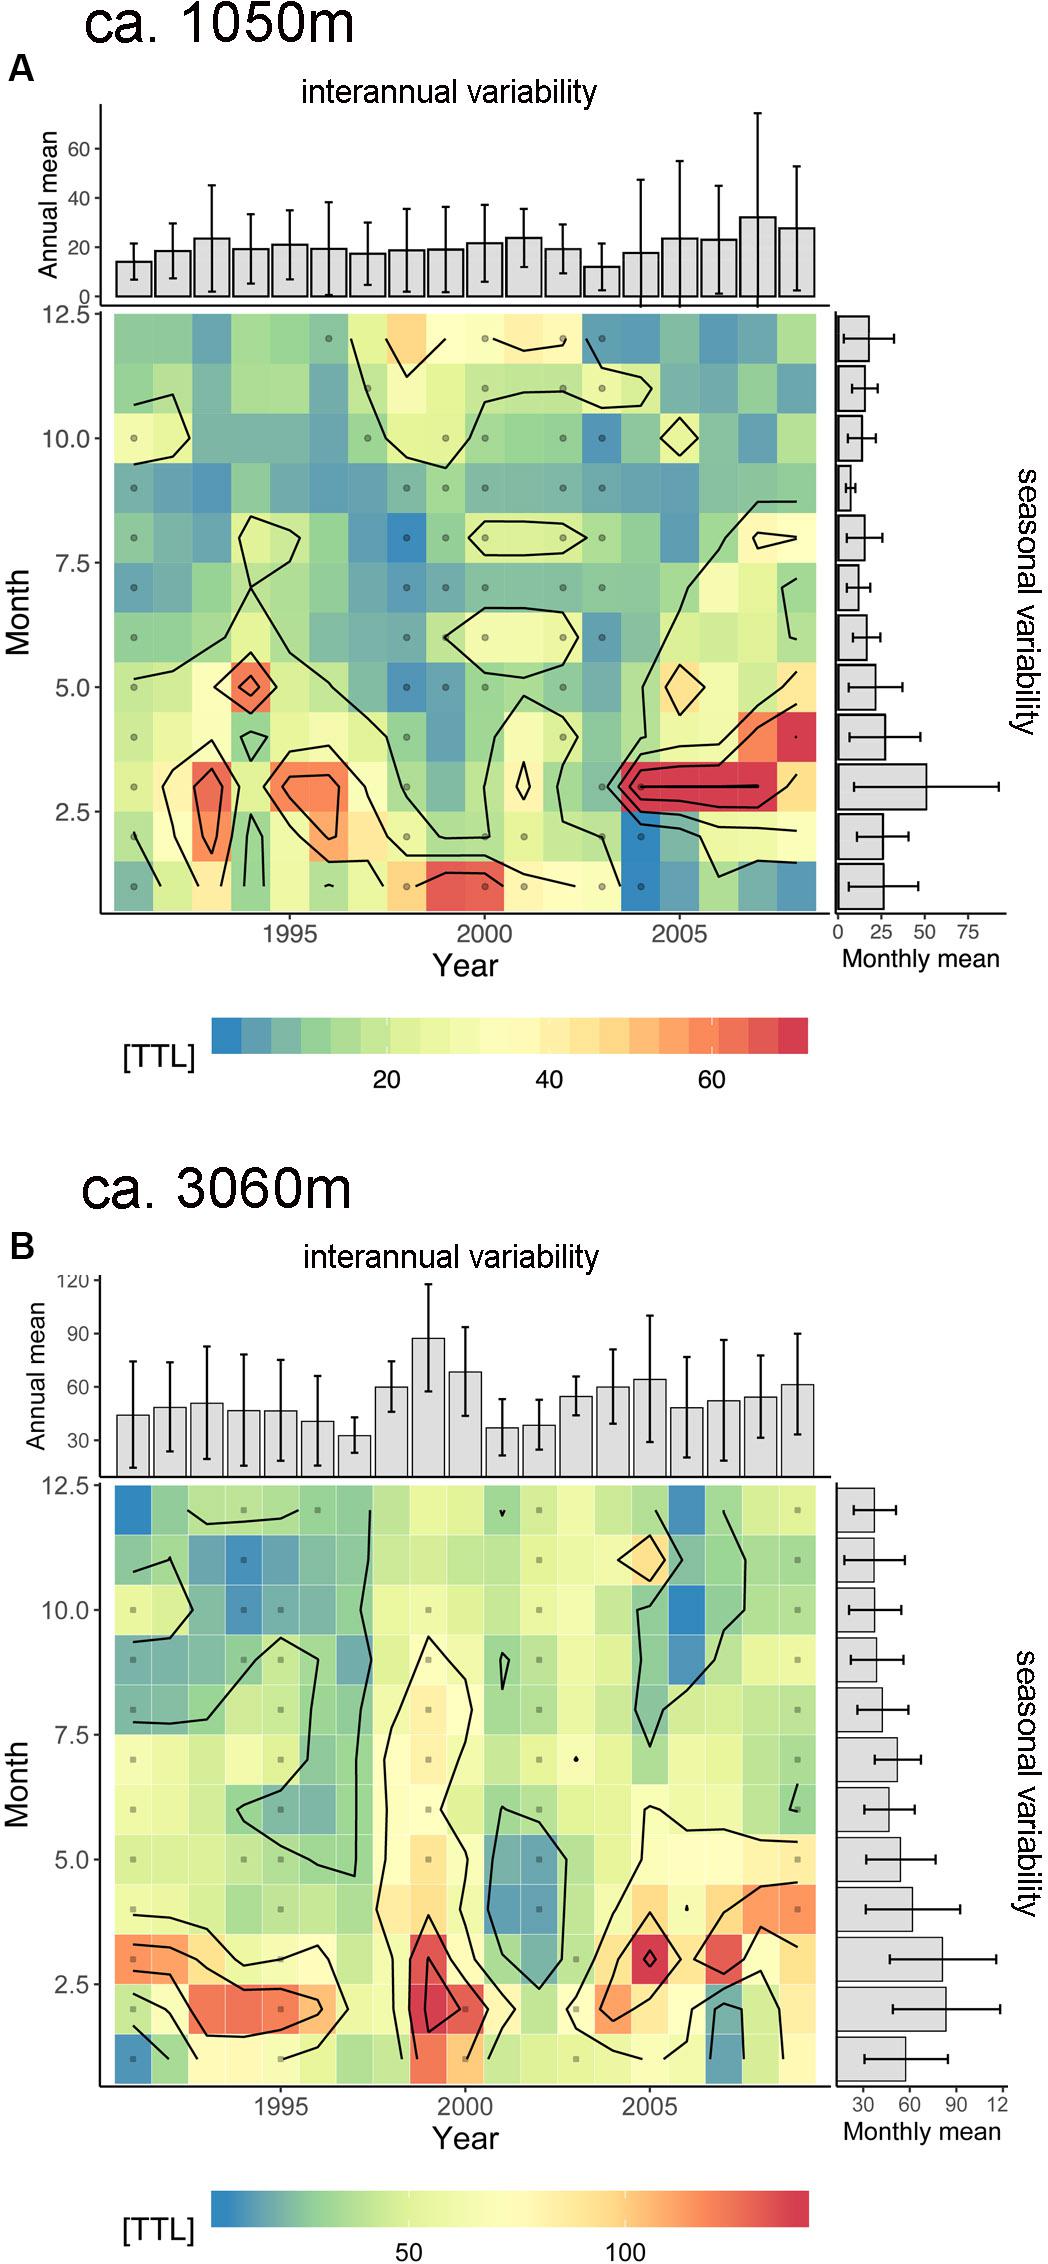
Figure 10. Seasonality vs. long-term variability of total mass flux (TTL, mg m–2 d–1) in the upper (A: ca. 1 km) and deeper (B: ca. 3 km) trap level. Note a change in seasonality from late winter to early spring (Feb/Mar to Mar/Apr) on the long-term (mainly in the 1 km trap) and the increasing fluxes. Extraordinary high fluxes from 1998 to 2000 in ca. 3 km (B) are hypothesized to be caused by the extreme ENSO event and its effect on coastal upwelling. Gray dots represent the squares interpolated by the Barnes method.
NAO Controls and an Increased Emphasis in Spring-Time Fluxes at ESTOC Since 2005
We observed increasing trends in the total and the BSi fluxes at both depth levels, which could point to an increase of coastal upwelling in the Cape Ghir and an increase at the oligotrophic ESTOC region (Figure 10). These trends can be seen in the chlorophyll as well (Figure 9). These overall changes in the Canary Basin could support the Bakun coastal upwelling intensification hypothesis (e.g., Bakun, 1990). However, these trends could be also due to the high NAO index (Figure 7C), resulting in intensified upwelling at the end of the sampling period in 2007 and 2008. In the region further south at Cape Blanc, Mauritania, there was no indication supporting the Bakun coastal upwelling intensification hypothesis (Bakun, 1990; Bakun et al., 2015; Cropper et al., 2014) when considering the deep ocean fluxes at the mesotrophic and the eutrophic study site (Fischer et al., 2016, 2019). Meanwhile, evidence increases pointing rather to upwelling relaxation or no variations due to climate change in the CC-EBUEs (e.g., Arístegui et al., 2009; Barton et al., 2013; Gómez-Letona et al., 2017; Sylla et al., 2019).
There is a statistically significant relationship between the spring BSi fluxes of the deeper sediment traps with the NAO-DJFM Hurrell Index (Hurrell, 1995) (excluding the extreme years 1999 (ENSO) and 2005) which we interpret to reflect the influence of the Cape Ghir coastal upwelling (R2 = 0.38, N = 14, p < 0.05, Spearman Test). The year 2005 was discussed by Fischer et al. (2016, 2019) as an exceptional year with high fluxes despite a low NAO. Romero and Fischer (2017) and Romero et al. (2020) found a change in diatom fluxes and composition at the coastal Cape Blanc site (CB eu) starting in 2005/2006. Unusually high particle fluxes in 2005 in the bathypelagic were also observed far offshore at site Kiel 276 (ca. 33°N/22°W; Fründt and Waniek, 2012). There are also indications of an overall change in circulation in the North Atlantic (i.e., the AMOC) and in the intensity and/or timing of coastal upwelling since 2005 (e.g., Haine, 2016).
In contrast, the relationship between winter NAO and winter BSi flux was weak. This suggests some delay between the NAO wind forcing and the biological response and/or the transport time of particles advected from the Cape Ghir filament to ESTOC. According to Pradhan et al. (2006), the biological response to changing alongshore wind stress is immediate. Therefore, we attribute the time lag between increased upwelling/high standing stock of chlorophyll at Cape Ghir and the arrival of this signal in the deep ESTOC fluxes to lateral particle advection.
The winter or spring biogenic fluxes of the mesopelagic traps (ca. 1 km), reflecting the oligotrophic area above ESTOC, do not reveal a connection to the NAO (e.g., Cianca et al., 2012). The extreme 1997–1999 ENSO might however impact on chlorophyll biomass (Pradhan et al., 2006) and on particle fluxes in the CC-EBUEs as described by Fischer et al. (2016, 2019) for the Cape Blanc coastal upwelling. Helmke et al. (2005) found 2.5 times higher organic carbon fluxes due to the 1997–1999 ENSO, compared to the regular/normal years. A similar increase in chlorophyll standing stock was observed by Pelegrí et al. (2005) for the same ENSO cycle 1997–1999 within the Mauritanian upwelling off Cape Blanc.
The most interesting feature at ESTOC is an increased emphasis in spring-time fluxes since 2005 (Figures 7, 8, 10, 11). A long-term change was also found in the timing of major biomass peaks from winter (CZCS record, Figure 3, Davenport et al., 1999) to spring (SeaWiFs record, Figures 2, 9). However, the pattern of SeaWiFs chlorophyll peaks at Cape Ghir and ESTOC did not reveal a change since 2005 in our record (Figure 9). Instead, when studying the available individual images of satellite-based chlorophyll from SeaWiFs and MODIS for the winter and spring seasons, we found no significant change in the spring chlorophyll patterns (Figure 1B), but an expansion of the high-chlorophyll (ca. 0.5–1 mg m–3) area in winter since 2005 (Figure 1B) and thereafter. Analyzing the major peaks of total and biogenic fluxes (e.g., for BSi and organic carbon) in detail using the original high resolution cup-by-cup data of the individual deployments, we found a small displacement of the BSi maxima between 1992–2004 and 2005–2009, mainly for the 1 km traps (Figure 11). However, these flux patterns are mainly driven by individual years [e.g., 1993 (ENSO), 2005]. Interestingly, the BSi flux pattern (and organic carbon as well, not shown) of the extreme 1997–1999 ENSO resembles the 2005–2009 picture recorded by the deep traps (Figure 11B), reflecting the Cape Ghir filament. However, applying statistical tests using the biogenic fluxes before and after 2005 revealed no significant change in the patterns.
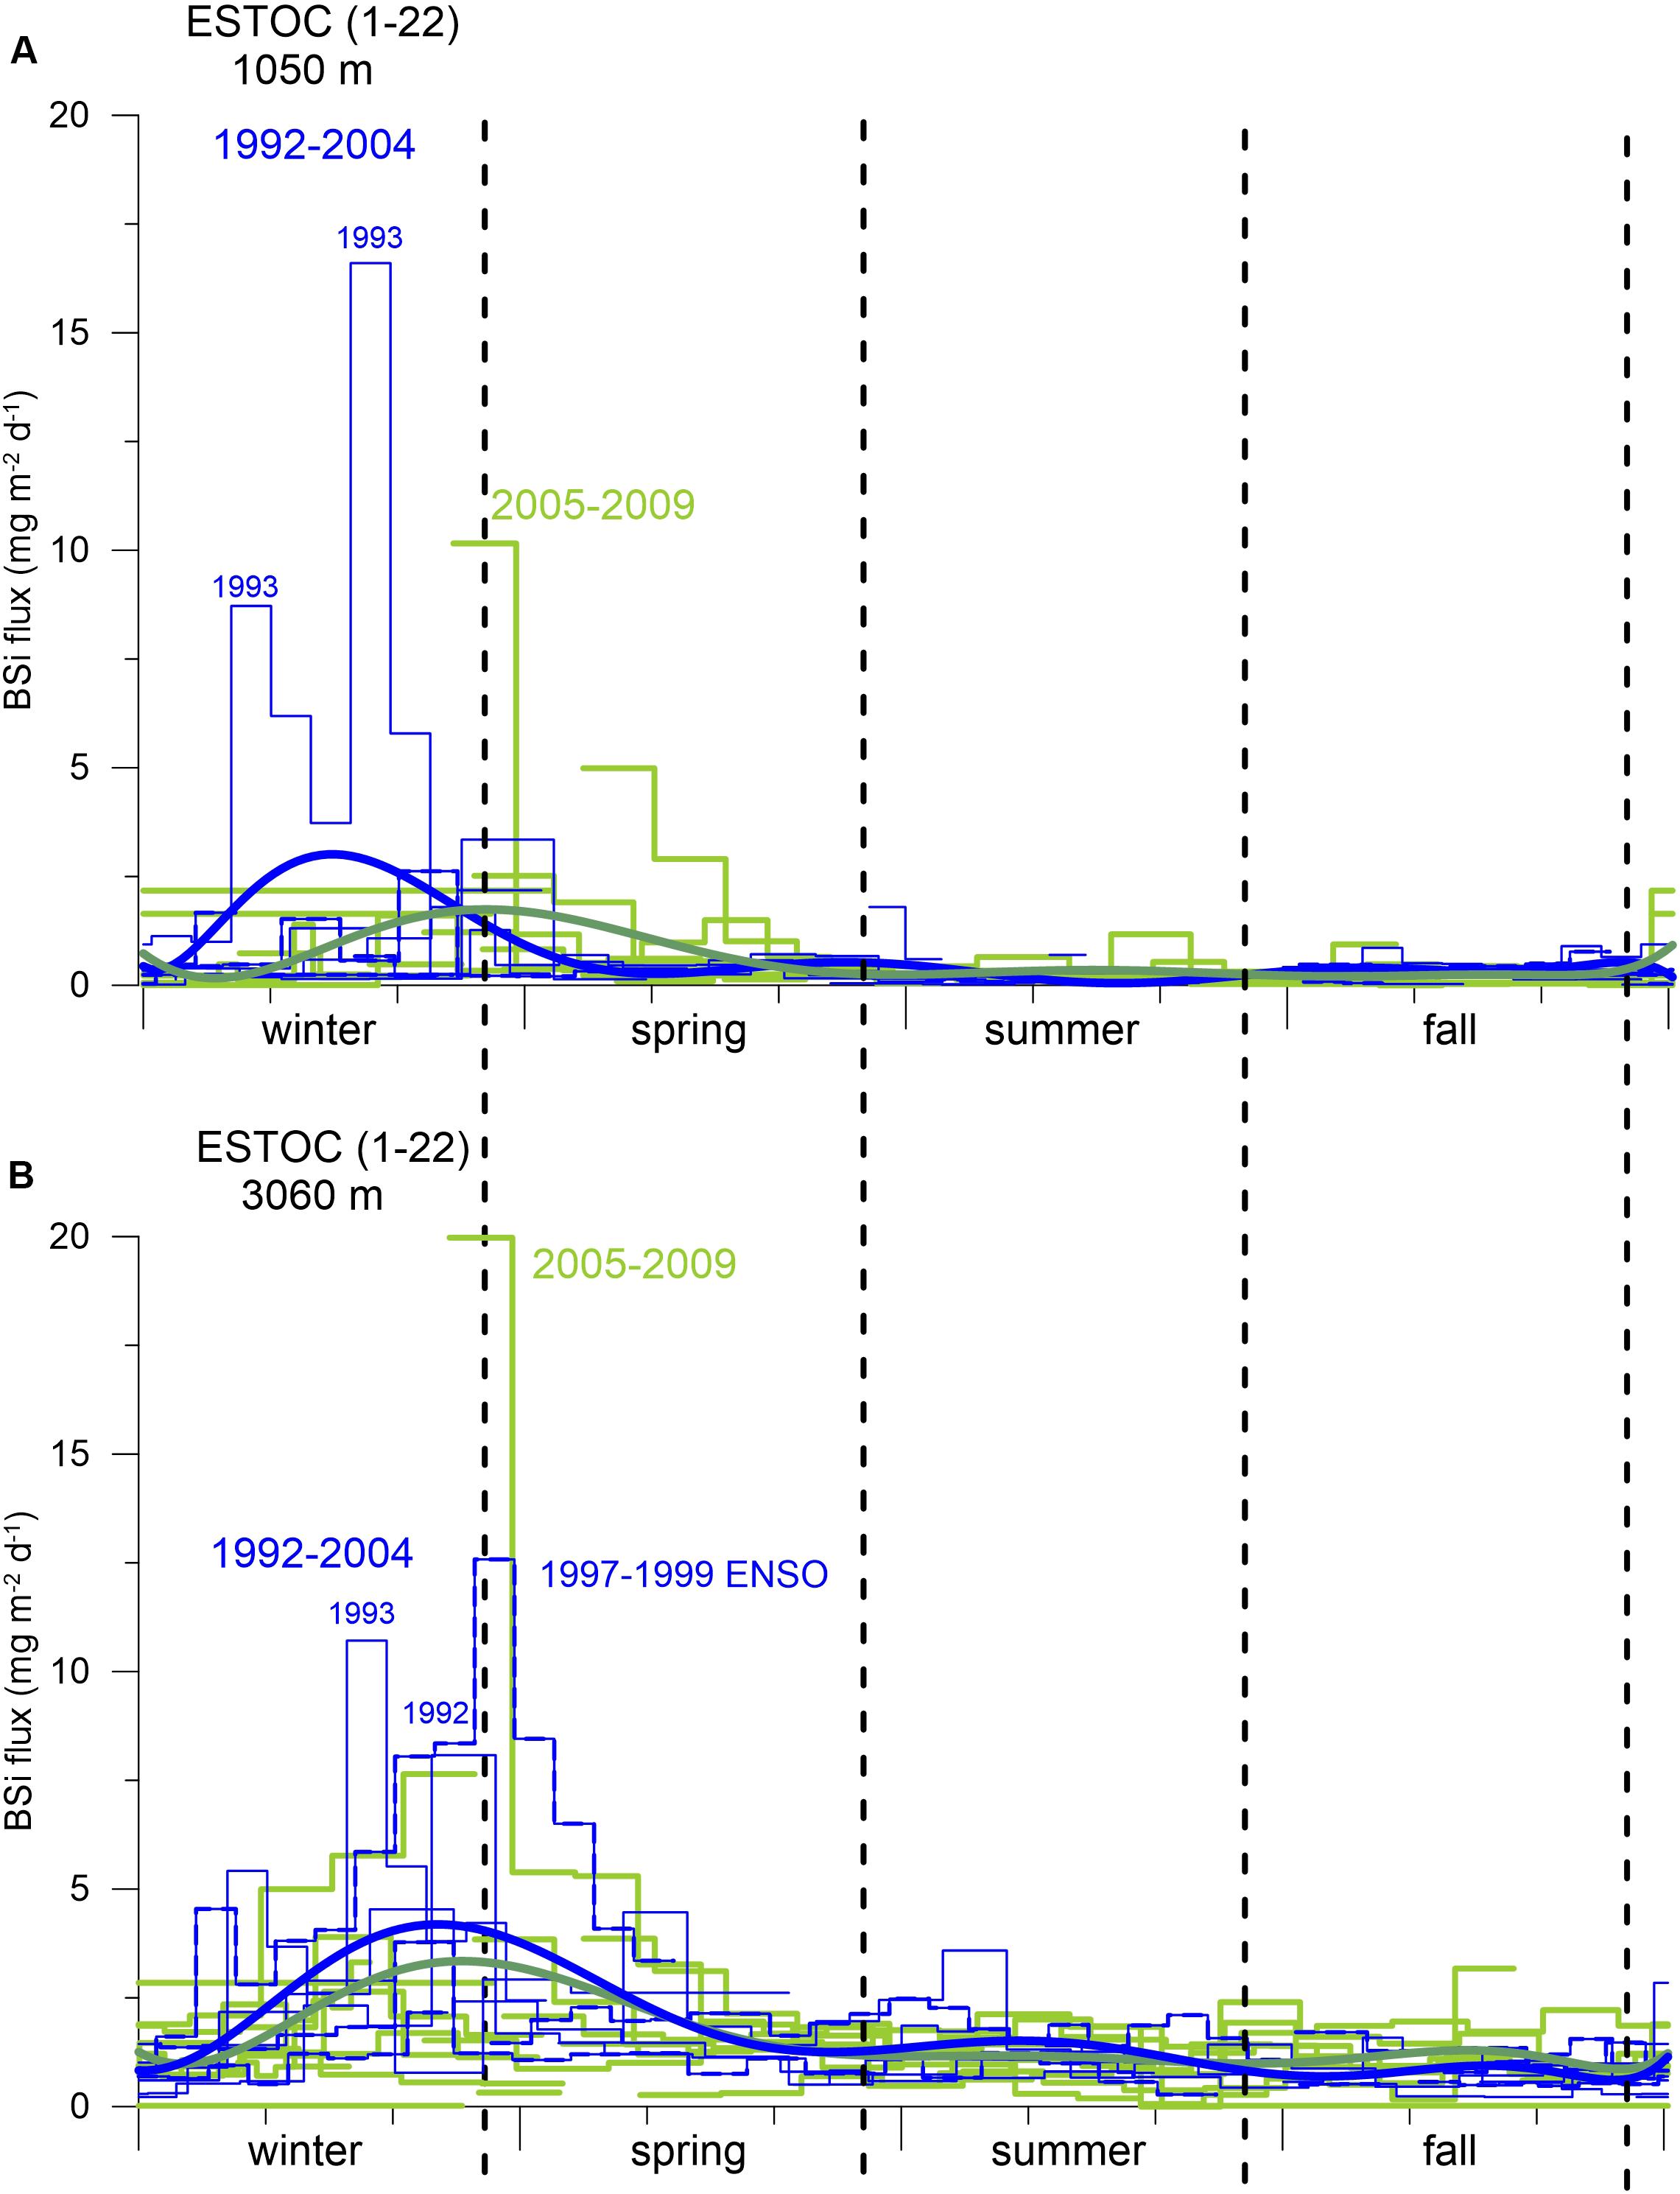
Figure 11. Annual cycles of BSi fluxes from the individual cup-by-cup data for the 1 km (A) and 3 km (B) traps from 1992 to 2004 (blue line) and for 2005–2009 (green line). The extreme 1997–1999 ENSO cycle is additionally marked with a stippled blue line. A polynomial fit (thick blue line for 1992–2004; thick green line for 2005–2009) indicates small displacements of the BSi flux maxima from winter to spring. Seasons are indicated by vertical hatched lines.
The reasons for the observed long-term changes of the timing of meso- and bathypelagic flux peaks remain elusive. Considering the unchanged chlorophyll patterns in spring since 2005 (Figure 1B), we hypothesize that this scenario implies a changing settling behavior of particles originated from the expanded winter blooms which almost reached ESTOC (Figure 1B). Lower particle settling rates of particles originating from the winter bloom could have resulted in delayed flux peaks in the 1 and 3 km traps, causing the change to higher spring-time fluxes since 2005. The changing BSi:Corg and C:N ratios in winter and spring discussed in the following paragraph underline this scenario and could point to a longer particle transport of a more diatom-enriched winter bloom leading to elevated spring-time fluxes.
An alternative scenario to explain the increase in the spring-time fluxes recorded in the traps might also be the increase in wet and dry dust deposition reflected by direct measurements on Gran Canaria (López-García et al., 2013). These authors found a marked seasonality of dry and wet dust deposition in spring during 2009–2012. However, if we analyze available satellite-derived AOT (from GIOVANNI: 2000–2015), we observe no long-term trend of the available dust nor is there any evidence of a change in seasonality (with normal peaks in late summer) in dust availability. On the other hand, these data only provide the potential dust availability in the lower atmosphere rather than the dust deposition at the ocean surface that is relevant for particle ballasting or fertilization processes in the surface waters.
Interestingly, we observed increasing summer flux peaks since 2005 at ESTOC but only for the upper traps, representing the oligotrophic conditions at ESTOC. However, this feature is only seen in the increasing dominance of chlorophyll peaks in summer at the Cape Ghir, but not in the ESTOC box (Figure 9). Summer flux peaks recorded by the 1 km-ESTOC traps might therefore be explained by lateral advection of biomass and particles within the Cape Ghir box and associated eddies via the ESTOC site (e.g., Davenport et al., 1999) as outlined by Helmke et al. (2005) for the Cape Blanc filament. An increase of lateral advection due to increasing winds and due to global change (e.g., Bakun, 1990) was suggested by Lluch-Cota et al. (2014). Alternatively, summer flux peaks at ESTOC might be explained by a nitracline uplift which might be responsible for episodic short term peaks in organic carbon during summer (Neuer et al., 2007).
Lateral Particle Advection From the Cape Ghir Filament and Changes of Flux Composition at ESTOC
The lithogenic fraction of particle flux can be used as a refractory component in the water column to estimate the amount of laterally contributed material to the deep ESTOC traps by comparing the bathypelagic to the mesopelagic trap data. We estimate a relative lateral contribution in the deep water column at 3 km between 52 and 81% with some seasonal variability (not shown). Using the total flux data (Table 2) which provide a more complete record, we estimate between 43 and 65% lateral advection with a slightly higher contribution in winter. The highest lateral contribution (65%) was measured in the winters 2005–2009. The calculated values for the lateral fluxes assume no flux changes with depth, in fact, fluxes decrease due to degradation, e.g., of organic matter. Therefore, our values are assumed to underestimate the true advective fluxes. Our values from the lithogenic component and the total material are within the range of estimates of lateral advection from stable nitrogen isotopes (Freudenthal et al., 2001) which indicate a lateral contribution between 50 and 75% at 3 km depth.
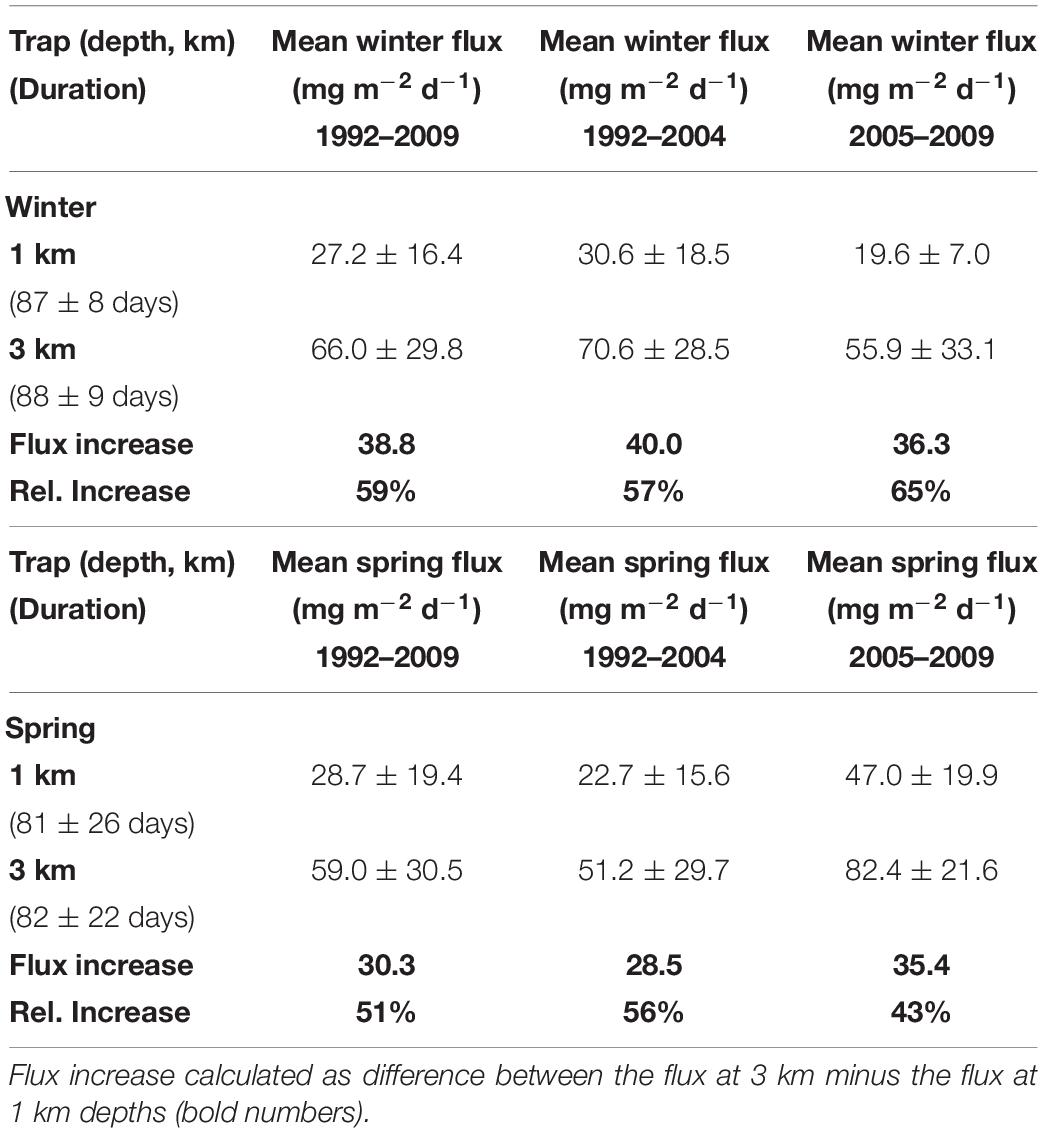
Table 2. Daily mean total fluxes (in mg m–2 d–1 with the standard deviations) for traps deployed in the Canary Basin for winter and spring seasons averaged over different yearly intervals.
The distance between the southwestern edge of the Cape Ghir and the ESTOC box is ca. 350 km (Figure 1A). Thus, without eddy field and considering a simple advective particle transport path, particles would reach the deep ESTOC trap in ca. 40 days, assuming an average horizontal current speed of 10 cm s–1 and an average particle settling rate of 75 m d–1. Such a delay matches the observed delay of ca. 1.5 months in the occurrence of chlorophyll peaks at Cape Ghir and the arrival of the flux signal in the deep ESTOC traps (e.g., Neuer et al., 1997; Davenport et al., 1999). However, while the required average particle settling rate corresponds to values estimated earlier (70 to a few 100 m d–1, Neuer et al., 1997), the required average horizontal advective speed in the order of ca. 10 cm s–1 does not match the generally much lower 30-day averaged currents observed at ESTOC (Figure 4). The slow settling velocities that Alonso-González et al. (2010) reported from a location just south of Gran Canaria, were measured at 260 m depth close to or within the production area, i.e., under conditions different from the ESTOC-Cape Ghir system. However, slowly settling particles could play a major role at ESTOC as well, besides the fast sinking particle pool (210–430 m day–1, between 1 and 3 km), estimated from particle flux patterns at ESTOC (Fischer and Karakas, 2009). In the Cape Blanc area, we were able to model (ROMS, Regional Ocean Modeling System) particle nepheloid layers using particle settling rates between 5 and 10 m per day (e.g., Fischer et al., 2009). These particles of the smaller size fraction constitute different nepheloid layers but may participate in the downward flux as well. The settling speeds applied at Cape Blanc were in the range of particle sizes discussed by Alonso-González et al. (2010) for the southern Canary Island region. It is reasonable to assume similar transport processes and particle characteristics in the ESTOC area, considering different particle pools with different particle settling rates, which constitute the sediment trap material.
The available 8-year record (1994–2002) of current speeds and directions (Figure 4) indicates that the flow at ESTOC is dominated by deep reaching coupled barotropic and first baroclinic mode meso-scale eddies, as it was observed earlier in other parts of the eastern subtropical North Atlantic (Müller and Siedler, 1992). Assuming that meso-scale eddy activity in the region north of ESTOC toward Cape Ghir may be of comparable intensity as at ESTOC, we follow Neuer et al. (2002b) that meso-scale eddy diffusion could explain the Cape Ghir filament as a long distance source for the observed increase in fluxes in the deep ESTOC sediment traps. Combining field observations and a statistical funnel model at ESTOC, e.g., similar to that of Siegel et al. (2008) for the ALOHA station near Hawaii would be needed for further confirmation, however, this is beyond the scope of this study.
Other comparable ocean areas with similar advective processes (e.g., in the Benguela Current; Inthorn et al., 2006) reveal lateral advection in the same order of magnitude as described above of the NW African continental slope (McCave et al., 2001; Hwang et al., 2009; Lovecchio et al., 2017). A high particulate organic carbon offshore transport of ca. 1050 km by mesoscale eddies is observed in other EBUEs such as the California Current (Amos et al., 2019). The estimated advective fluxes from ESTOC also fall in the range of values from the Cape Blanc area (Fischer et al., 2009, 2016, 2019), where winter was the most prominent season for lateral advection of particles. In a recent modeling study conducted in the region of the Cape Ghir filament, Santana-Falcón et al. (2020) obtained highest lateral advection of POC and DOC in spring and summer.
We found changes not only in the seasonality of fluxes since 2005 but also in the composition of sinking materials between the beginning (1992–2004) and the end of the ESTOC record (2005–2009; Table 3). The deep ESTOC traps showed highest lithogenic fluxes for the winter and spring seasons between 8.1 and 35 mg m–2 d–1, which are attributed to dust minerals and amount between 18 and 50% of the total flux (Table 3). Upper trap fluxes for the lithogenic fraction are clearly lower on average. The overall proportion of about one third of lithogenic material of total flux is comparable to estimates from the coastal upwelling off Cape Blanc, Mauritania (Fischer et al., 2016, 2019). A clear coupling between atmospheric dust occurrences and lithogenic particle fluxes at 2000 m water depth was suggested by Brust et al. (2011) for site Kiel 276 (33°N/22°W), an almost similar latitude but more offshore than ESTOC. The lithogenic component at site Kiel 276, however, amounts only about 15% on average and individual lithogenic flux peaks ranged between 0.2 and 42.5 mg m–2 d–1 (Brust et al., 2011). The individual values ranged from almost zero to ca. 181 mg m–2 d–1 in the bathypelagic at ESTOC. The individual maxima exceeded the values at Kiel 276 by more than a factor of four due to a much closer location of ESTOC to the African source regions of dust and the clear decline of dust deposition observed from the coast to the open ocean (e.g., Kaufman et al., 2005).
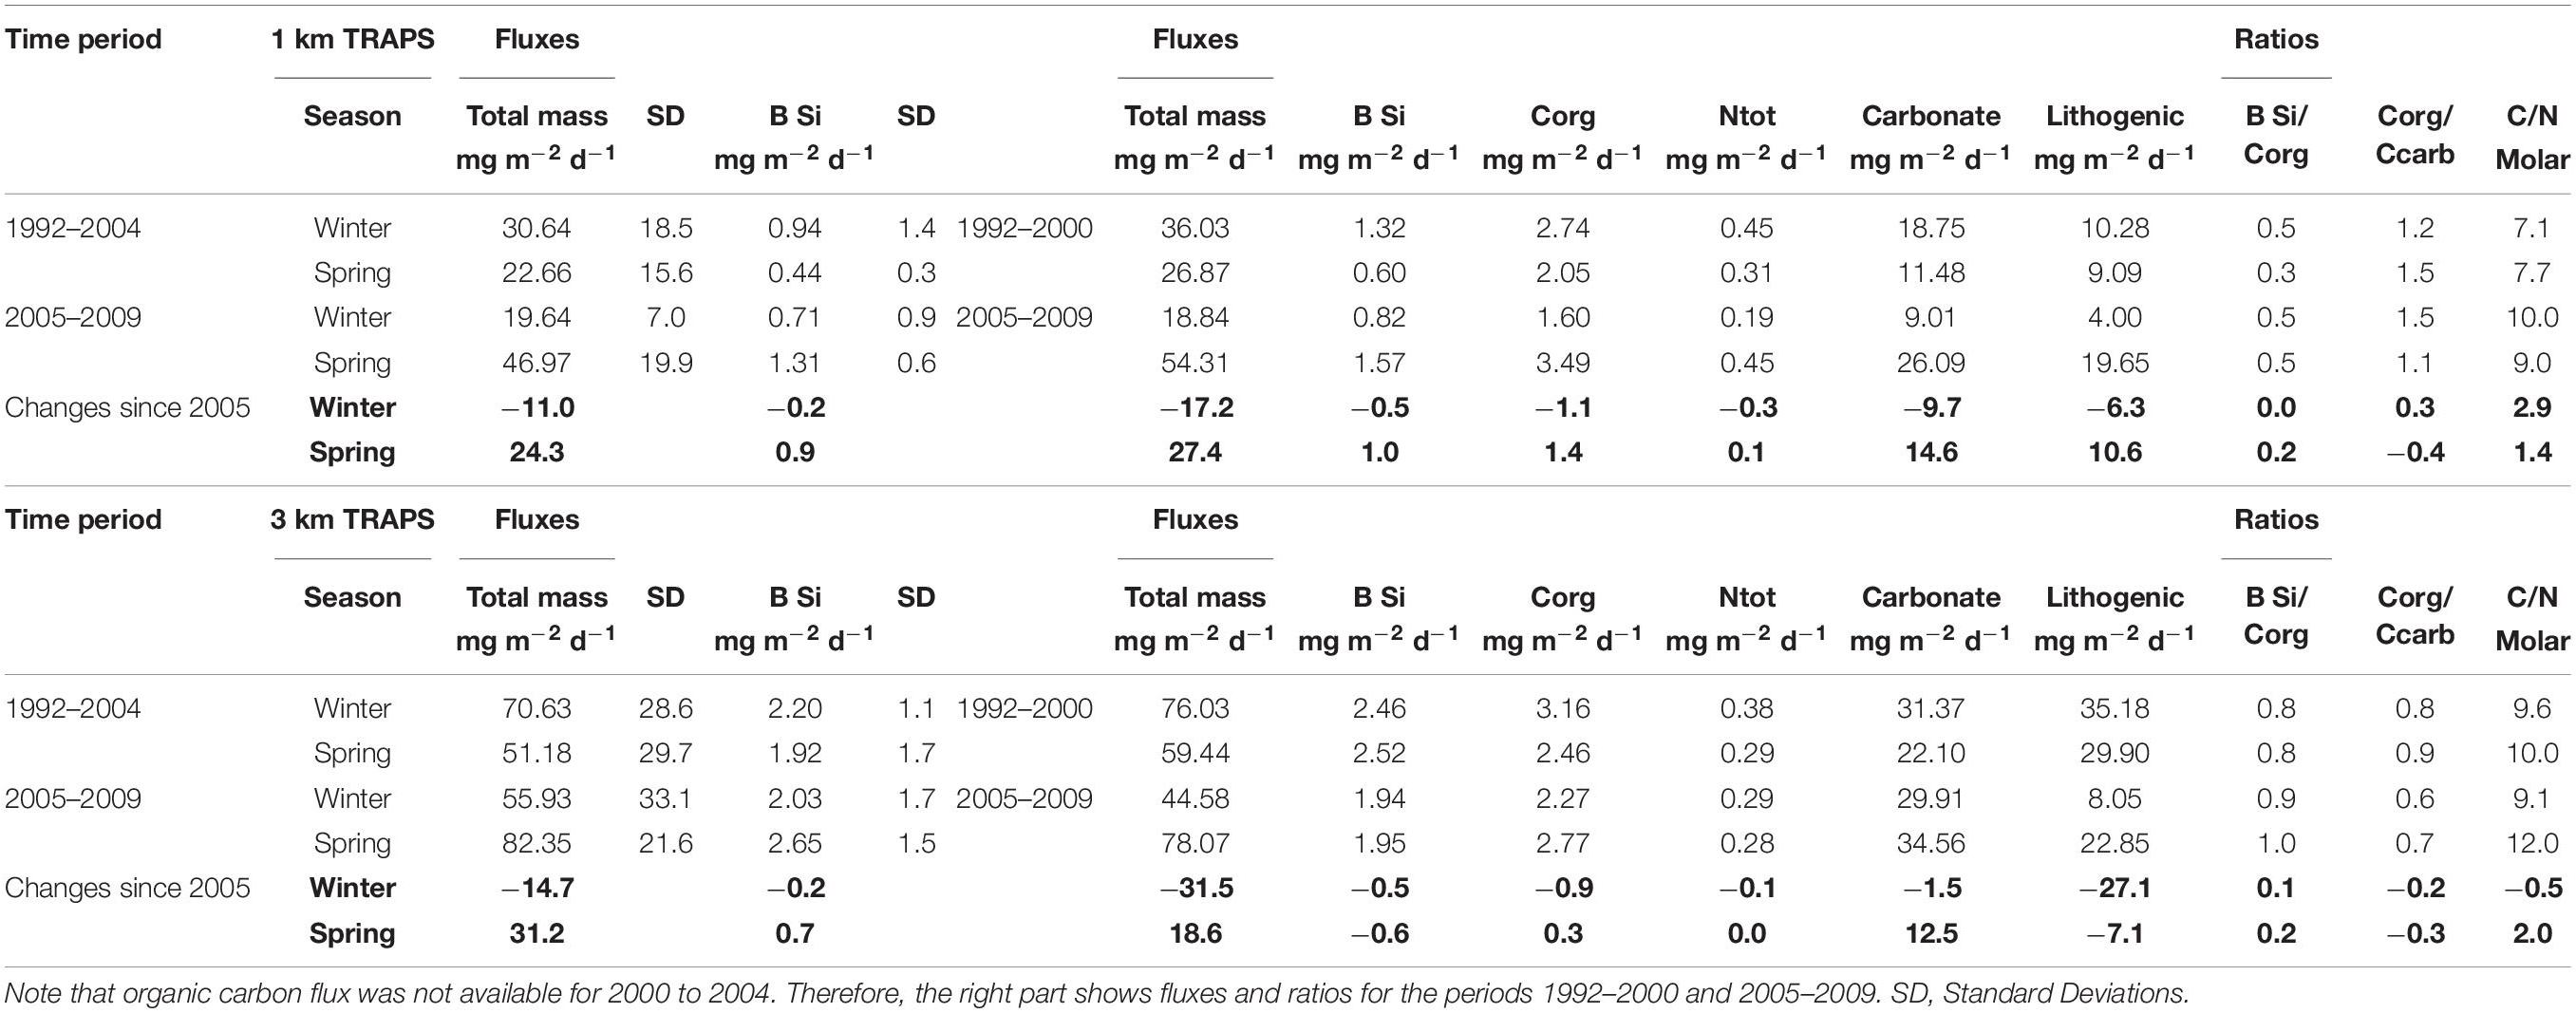
Table 3. Mean seasonal winter and spring fluxes (in mg m–2 d–1) and ratios and their seasonal changes since 2005 (bold numbers) measured at 1 km and 3 km depths in the Canary Basin.
The trap collections at ca. 1 and 3 km show a decrease of all biogenic fluxes (BSi, organic carbon and carbonate) in winter, accompanied by an increase of most fluxes in spring-time since 2005 (Table 3). In the 1 km trap collections, BSi increased 2–3-fold in spring-time between 1992–2004 and 2005–2009 (Table 3) while the winter fluxes decreased. In the deep traps, these changes were less clear. Additionally, increasing BSi:Corg ratios in spring-time (Table 3) may point to some change in the composition of sinking detritus, with a likely increase in diatoms since 2005. The increase of the C:N ratios by two molar units in the deeper trap collections in spring since 2005 (Table 3) points to a longer particle transport and, thus, a higher degradation of organic matter before arriving in the deep offshore traps. This scenario is in accordance with the assumption of a more diatom-enriched winter bloom, which settles with decreased rates and constitutes a higher spring signal in the sediment traps since 2005. It is known from laboratory and field studies that particles with higher BSi (more diatoms) may sink at lower rates (Ploug et al., 2008; Fischer and Karakas, 2009; Iversen and Ploug, 2010).
Total carbonate flux which constitutes roughly one half of the total flux (Table 3) increased in spring as well by more than 2-fold (1 km traps). However, as total carbonate is mainly constituted by planktonic foraminifera, pteropods, and coccolithophores, we do not know which fraction is most important in the entire record. An estimation of the contribution of coccolithophores to total carbonate flux revealed a value of about one third at ESTOC for individual deployments (Sprengel et al., 2002). Roughly three quarters of the yearly coccolithophore-carbonate settles in winter, indicating their importance for the seasonal bloom. Abrantes et al. (2002) associated 93% of the microplankton to coccolithophore cells in the northern Canary Islands region. Short term episodic sedimentation pulses (hours to days) with fecal pellets packed tightly with coccolithophores were found to be characteristic for the ESTOC site (deployments 1–2, Fischer et al., 1996), suggesting carbonate as an important ballast mineral (e.g., Klaas and Archer, 2002). More recent studies on the polysaccharide contents of coccolithophores indicate high organic carbon contents (Anderson et al., 2014; Lee et al., 2016) which might explain the tight correlations between coccolithophores and organic carbon at ESTOC (Fischer et al., 1996). The almost perfect coupling between organic carbon and carbonate sedimentation (Fischer et al., 1996; Neuer et al., 1997, 2007), however, did change during the sampling period, leading to different Carbon Rain Ratios (CRR = Corg/Ccarbonate) in the ESTOC trap samples (Table 3). During the exceptional ENSO 1997–1999 event for instance, deep organic carbon fluxes were much higher during the La Niña phase 1999, whereas carbonate fluxes were relatively low, resulting in an exceptional CRR of about 6.3. Overall, upper trap values were higher (CRR = 1.1–1.5) than the lower trap samples (CRR = 0.8–1.0), the latter show a decreasing tendency between 1992–2004 and 2005–2009 (Table 3). This could result in a lower efficiency to sequester CO2 by the biological pump. Increasing coccolithophore abundance in the euphotic zone of the western subtropical North Atlantic (BATS) between 1990 and 2014 was observed by Krumhardt et al. (2016) and was attributed to global change. A basin-wide increase in coccolithophore growth and biomass was found for the North Atlantic by Rivero-Calle et al. (2015) and could match our findings from ESTOC.
Synchronous Particle Flux Records at ESTOC and off Cape Blanc and Long Term Changes
As pointed out by Lluch-Cota et al. (2014), poleward coastal upwelling sites and the more equatorward locations (e.g., Cape Blanc upwelling) might react differently to climate change. ESTOC generally provides a more distinct seasonality of particle fluxes with regular winter peaks on the long term (see also Neuer et al., 2007) compared to the Cape Blanc study sites (Fischer et al., 2016, 2019). At the offshore site CBmeso, characterized by permanent annual upwelling (Figure 1; Cropper et al., 2014), seasonality of fluxes is less clear with winter peaks and additional late summer peaks occurring during certain years (e.g., 2002, Figure 12) due to the influence from northward flowing warm water Mauritanian Current (Figure 1A; Fischer et al., 2016, 2019). Figure 12 shows the deep mass fluxes at CBmeso compared to the synchronous deep ESTOC record as both sites were influenced by coastal upwelling, large filaments and eddies reaching far offshore (Davenport et al., 1999; Neuer et al., 2002b; Fischer et al., 2009, 2016, 2019). Both time series reveal some similarities in the overall variability of fluxes due to the overall NAO forcing of the Canary Current coastal upwelling (e.g., González-Dávila et al., 2007; Narajan et al., 2010; section “NAO Controls and an Increased Emphasis in Spring-Time Fluxes at ESTOC Since 2005”). Further, the strong 1997–99 ENSO appears to influence particle flux patterns at both sites and resulted in elevated fluxes in 1998–1999 during the La Niña cold phase (Figures 5, 7; Fischer et al., 2016, 2019). The best coincidence of particle flux variability at ESTOC and CBmeso is observed for the spring season, however, the correlation coefficient for the entire period is very low (R2 = 0.13, N = 10) (Figure 12). A detailed look shows that before 2005, major flux peaks occur earlier at ESTOC (winter, e.g., Figure 11), thus coinciding with the major peaks (in winter) at CBmeso (Figure 12; insert, N = 6, R2 = 0.66). However, statistical tests revealed no significant relationship (p > 0.05, Spearman Test). Due to a stronger emphasis of spring fluxes at ESTOC since 2005 (section “NAO Controls and an Increased Emphasis in Spring-Time Fluxes at ESTOC Since 2005”), we observed a large scatter of data points for the second sampling period between 2005 and 2009 (Figure 12).
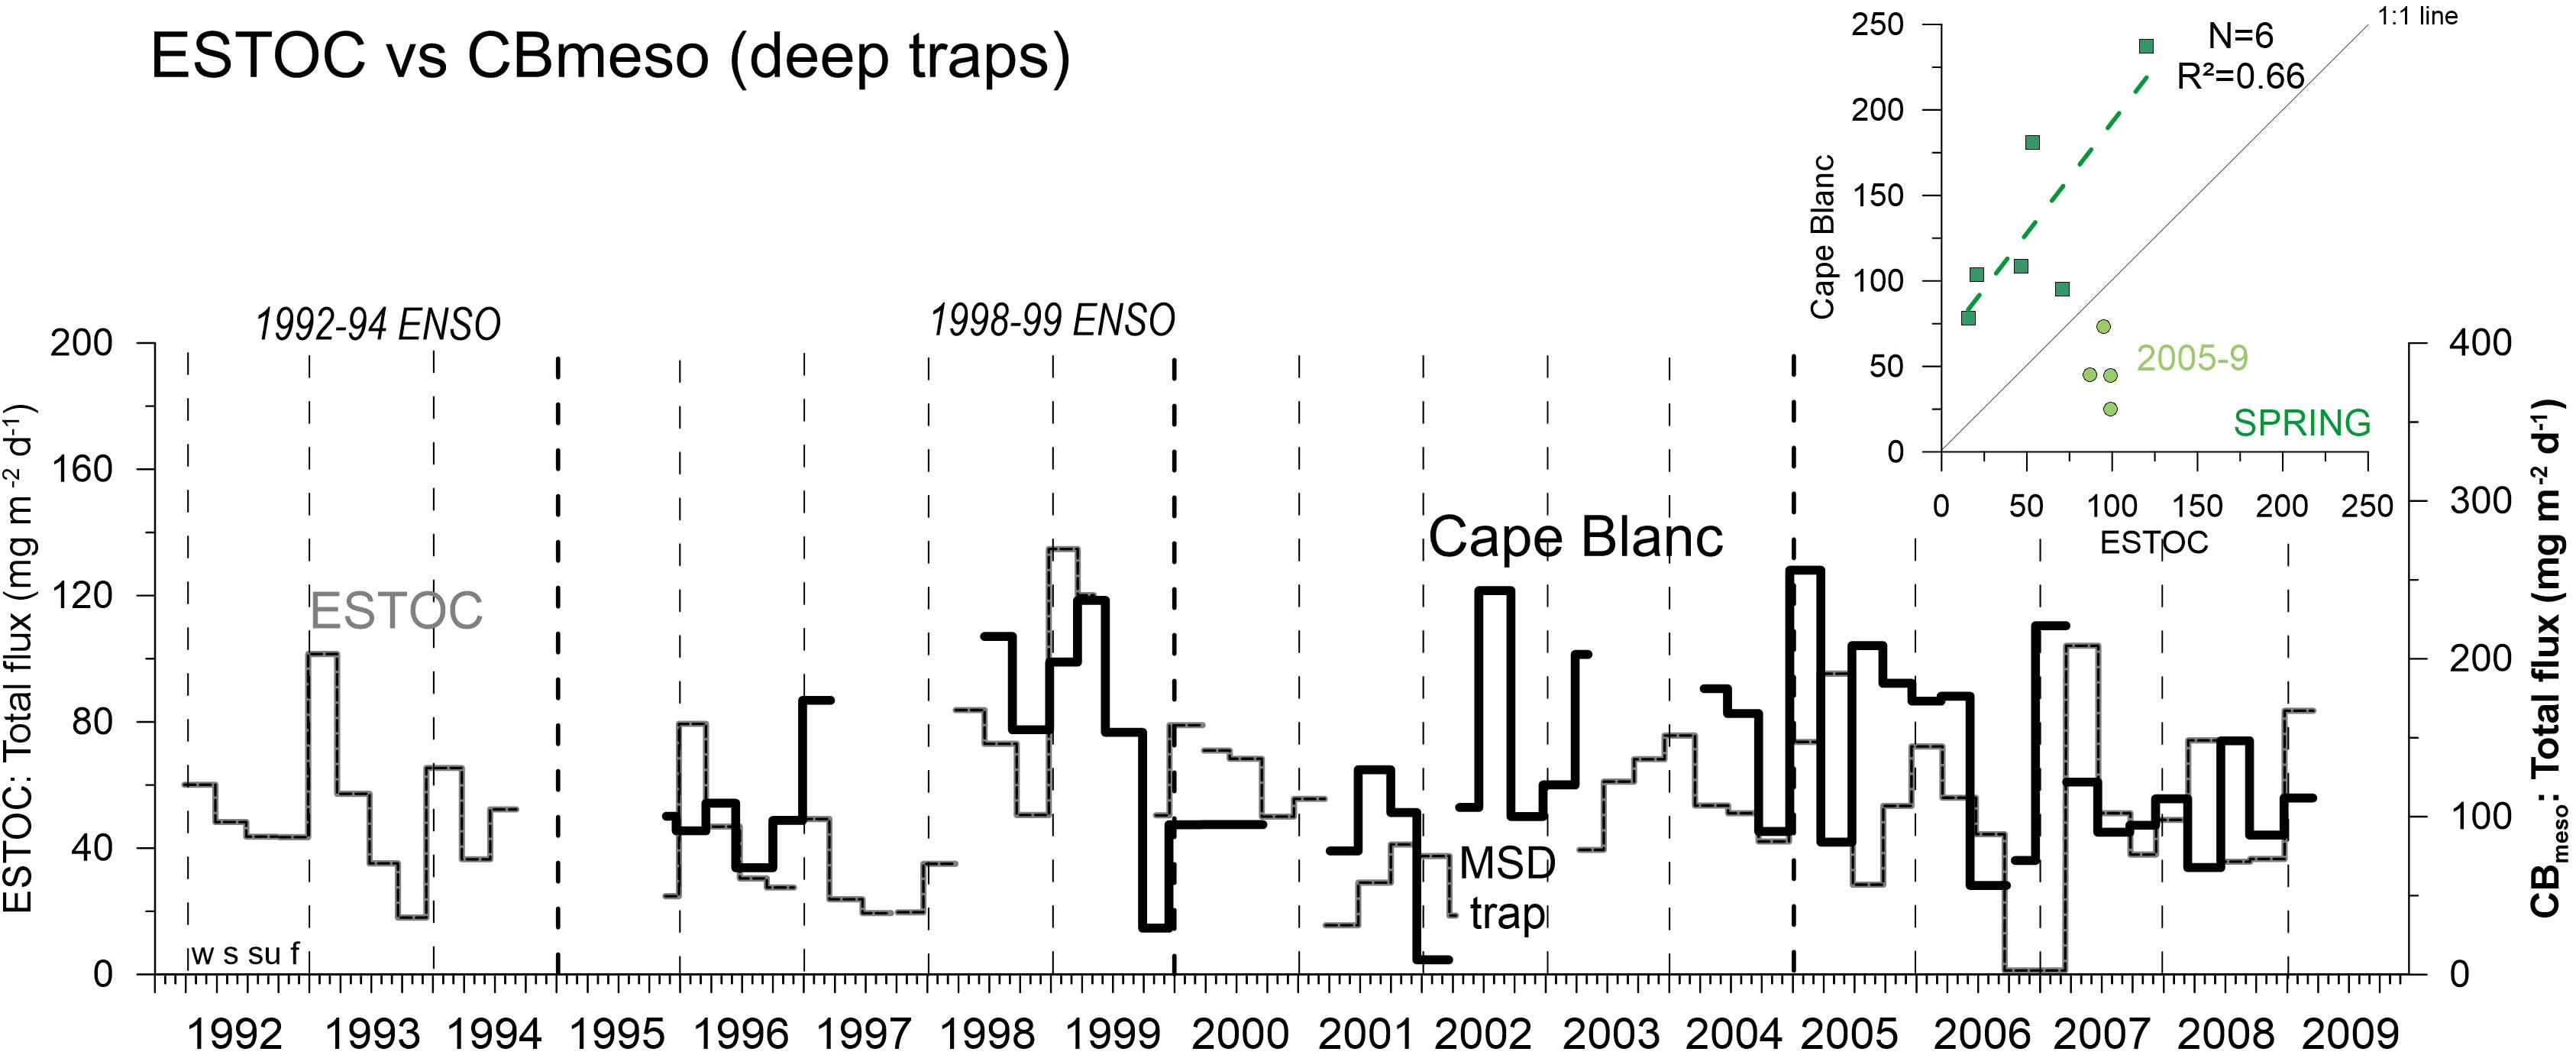
Figure 12. Comparison of deep ocean total mass fluxes between the ESTOC site (including MSD traps) and the Cape Blanc mesotrophic site. Note the different scales for fluxes. The correlation coefficient between fluxes is highest for spring (upper right panel) for 1996–2004 (R2 = 0.66, N = 6) but the relationship is not significant (p > 0.05). Between 2005 and 2009, data points show some scatter due to a shift in particle flux seasonality at ESTOC. Vertical hatched lines indicate years (with the four seasons winter = w, spring = s, summer = su, fall = f, starting on Jan. 1), thick hatched lines indicate the 5-year mark.
Romero and Fischer (2017), Fischer et al. (2019), and Romero et al. (2020) found a change in particle fluxes and composition at the coastal Cape Blanc site (CB eu) starting in 2005/2006. This could point to an overall change in circulation in the North Atlantic and in the intensity and/or timing of coastal upwelling. Such changes in the Atlantic are described for a major driver of the biogeochemistry and circulation in the North Atlantic Ocean, i.e., the AMOC (with an Ekman component) that could have decreased since 2005 in the eastern North Atlantic (Smeed et al., 2014; Srokosz and Bryden, 2015; Haine, 2016). Relaxation of Ekman upwelling might be responsible for the statistical significant decrease in carbon fluxes (p < 0.05) between 2003 and 2016 at the coastal Cape Blanc site CB eu (Fischer et al., 2019). However, an overall long-term decrease of the AMOC is doubted by many other oceanographers and climatologists and the observed circulation changes might be part of a natural climatic variability as well.
In summary, the time series of chlorophyll biomass (Figures 2, 9) and particle fluxes from ESTOC (Figures 5, 7, 10) point to an increase of coastal upwelling and/or a change in the advective flux (as proposed by Lluch-Cota et al., 2014) in the northern CC-EBUEs. Additionally, we observed a long-term increase of chlorophyll (Figure 2) in the Cape Ghir filament, pointing to an intensification of coastal upwelling. However, the individual seasonal patterns of satellite chlorophyll in the ESTOC area reveal an expansion of the high chlorophyll area (ca. 0.5–1 mg m–3) in the winter seasons since 2005 but no clear changes in spring (Figure 1B). Further, it seems that the summer chlorophyll peaks at the Cape Ghir filament became more prominent since 2005 (Figure 9) which is, however, not clearly reflected in the deep particle flux records at ESTOC (Figure 10). Increasing trends in chlorophyll and particle fluxes at ESTOC were not observed further south in the Mauritanian upwelling (Fischer et al., 2016, 2019).
Conclusion
An almost two-decade long flux record from ca. 1 and 3 km at the oligotrophic ESTOC site combined with environmental data and compared to the offshore flux record off Cape Blanc (Fischer et al., 2016, 2019) revealed the following major findings:
– SeaWiFs-chlorophyll from 1997 to 2009 showed an overall increasing trend at the Cape Ghir coastal upwelling box (p < 0.05) but not in the oligotrophic ESTOC region,
– over decadal time scales, satellite chlorophyll appeared to switch from peaks in winter (CZCS: 1979–1985, Davenport et al., 1999) to spring at ESTOC (SeaWiFs: 1997–2009),
– ESTOC is an oligotrophic time series station but bathypelagic fluxes were influenced by lateral advection of particles (between 43 and 65%) from the coastal Cape Ghir filament (Davenport et al., 1999). Mesopelagic fluxes revealed the more oligotrophic conditions at ESTOC with ca. 2–3-fold lower particle fluxes compared to the bathypelagic fluxes,
– SeaWiFs-chlorophyll from ESTOC shows a significant relationship to the mesopelagic BSi fluxes in winter,
– we found a stronger emphasis in spring-time fluxes since 2005 and BSi fluxes increased by 3-fold (1 km traps). However, this change in fluxes from 1992–2004 to 2005–2009 was statistically not significant,
– in association with the higher spring-time fluxes, the composition of the sinking material changed (e.g., BSi:Corg and C:N increased) between 1992–2004 and 2005–2009, which might point to a change in plankton composition and particle transport,
– the deep spring BSi fluxes (3 km, reflecting mainly the Cape Ghir filament) show a statistical significant relationship to the winter (DJFM) NAO Hurrell Index when excluding the extreme years 1999 (ENSO) and 2005,
– the best agreement between deep particle flux patterns at ESTOC (northern CC-EBUEs) and Cape Blanc (southern CC-EBUE, site CB mesotrophic) was during the spring season, but only before 2005.
The reasons for the observed higher spring-time fluxes since 2005 remain elusive. This change could be due to shift in productivity (and biomass), forced by upwelling favorable winds (in intensity or timing) in both the ESTOC and the Cape Ghir boxes. However, the stronger emphasis in spring-time fluxes since 2005 was not found in the satellite chlorophyll patterns. Instead, considering the larger winter bloom (satellite chlorophyll) and the compositional changes since 2005 in both traps, we conclude that lower particle settling rates of the winter bloom resulted in a higher spring-time signal recorded with the sediment traps.
There is an increasing trend of SeaWiFs-chlorophyll and particle fluxes in the oligotrophic ESTOC region which was not observed further south at the mesotrophic Cape Blanc site, located in the southernmost permanent upwelling zone close to the tropics (Figure 1A). At the eutrophic Cape Blanc site, we even observed statistically significant decreasing organic carbon fluxes (Fischer et al., 2019), which contradict the Bakun coastal upwelling intensification hypothesis (e.g., Bakun, 1990). Our observations from ESTOC and Cape Blanc are more in accordance with the concept of Lluch-Cota et al. (2014), who argued that coastal upwelling due to global change may be intensified in the poleward parts of the EBUEs (e.g., at ESTOC) rather than in the equatorward regions (e.g., off Cape Blanc). However, the flux records both at ESTOC and Cape Blanc are still not long enough to disentangle natural low frequency variability from long-term trends of fluxes which might be due to climate change, like the potential intensification of coastal upwelling (e.g., Bakun, 1990; Bakun et al., 2010, 2015; Cropper et al., 2014).
Data Availability Statement
The raw data supporting the conclusions of this article will be made available by the authors, without undue reservation, to any qualified researcher.
Author Contributions
GF and SN collected the data. GF mainly wrote the article with the help of SN and TM. SR carried out the statistical analyses. BD contributed to the data collection. GR, VR, GM, NN, and MK carried out the mooring work and analysis of the sediment trap data. GW contributed with the ideas and writing. All authors contributed to the article and approved the submitted version.
Conflict of Interest
The authors declare that the research was conducted in the absence of any commercial or financial relationships that could be construed as a potential conflict of interest.
Acknowledgments
We dedicate this contribution to the memory of our friend Dr. Helge Meggers whose contributions to paleoceanography and microfossil observations off NW Africa have been invaluable. We acknowledge the guidance of the expeditions with RV Meteor and RV Poseidon, in the later years by Tim Freudenthal. We are indebted to ships’ crews and masters of the relevant cruises (Supplementary Material). For discussion, we thank Oscar Romero, Holger Kuhlmann, and Gesine Mollenhauer. Thanks to colleagues from former ICBM in Telde, Gran Canaria (now PLOCAN) for the support during and before the ships’ cruises. Establishing such a long time series of fluxes and water column studies at ESTOC and off Cape Blanc was only possible due to a long-term funding by the Deutsche Forschungsgemeinschaft through the SFB 261, the RCOM, and the MARUM Excellence Cluster “The Ocean in the Earth System” at Bremen University. Further, the long financial support for the technologicl innovations and current meter moorings by the BMBF (also through JGOFS) and the EU is greatly acknowledged. We thank the three reviewers for helpful comments and the editorial staff of “Frontiers.”
Supplementary Material
The Supplementary Material for this article can be found online at: https://www.frontiersin.org/articles/10.3389/feart.2020.00280/full#supplementary-material
References
Abrantes, F., Meggers, H., Nave, S., Bollman, J., Palma, S., Sprengel, C., et al. (2002). Fluxes of micro-organisms along a productivity gradient in the Canary Islands region (29°N): implications for paleoreconstructions. Deep Sea Res. II 49, 3599–3629. doi: 10.1016/s0967-0645(02)00100-5
Alonso-González, I. J., Arístegui, J., Lee, C., Sanchez-Vidal, A., Calafat, A., Fabrés, J., et al. (2010). Role of slowly settling particles in the ocean carbon cycle. Geophys. Res. Lett. 37:L13608. doi: 10.1029/2010GL043827
Amos, C. M., Castelao, R. M., and Medeiros, P. M. (2019). Offshore transport of particulate organic carbon in the California Current System by mesoscale eddies. Nat. Commun. 10:4940. doi: 10.1038/s41467-019-12783-5
Anderson, M. P., Hem, C. P., Schultz, L. N., Nielsen, J. W., Pedersen, C. S., Sand, K. K., et al. (2014). Infrared spectroscopy and density functional theory investigation of calcite, chalk, and coccoliths - do we observe the mineral surface? J. Phys. Chem. A 2014, 10720–10729. doi: 10.1021/jp5053858
Arístegui, J., Barton, E. C., Álvarez-Salgado, X. A., Santos, A. M. P., Figueiras, F. G., Kifani, S., et al. (2009). Sub-regional ecosystem variability in the Canary Current upwelling. Prog. Oceanogr. 83, 33–48. doi: 10.1016/j.pocean.2009.07.031
Bakun, A. (1990). Global climate change and intensification of coastal ocean upwelling. Science 247, 198–201.
Bakun, A., Black, B. A., Bograd, S. J., García-Reyes, M., Miller, A. J., Rykaczewski, R. R., et al. (2015). Anticipated effects of climate change on coastal upwelling ecosystems. Curr. Clim. Change Rep. 1, 85–93. doi: 10.1007/s40641-015-0008-4
Bakun, A., Field, D., Redondo-Rodriguez, A., and Weeks, S. (2010). Greenhouse gas, upwelling-favourable winds, and the future of coastal ocean upwelling ecosystems. Glob. Change Biol. 16, 1213–1228.
Barth, J. A., Cowles, T. J., Kosro, P. M., Shearman, R. K., Huyer, A., and Smith, R. L. (2002). Injection of carbon from the shelf to offshore beneath the euphotic zone in the California current. J. Geophys. Res. 107:3057.
Barton, E. D., Field, D. B., and Roy, C. (2013). Canary current upwelling: more or less? Prog. Oceanogr. 116, 167–178. doi: 10.1016/j.pocean.2013.07.007
Behrenfeld, M. J., Randerson, J. T., McClain, C. R., Feldman, G. C., Los, S. O., Tucker, C. J., et al. (2001). Biospheric primary production during an ENSO transition. Science 291, 2594–2597. doi: 10.1126/science.1055071
Berelson, W. M. (2002). Particle settling rates increase with depth in the ocean. Deep Sea Res. II 49, 237–251. doi: 10.1016/s0967-0645(01)00102-3
Bonino, G., Di Lorenzo, E., Masina, S., and Iovino, D. (2019). Interannual to decadal variability within and across the major Eastern boundary upwelling systems. Sci. Rep. 9:19949. doi: 10.1038/s41598-019-56514-8
Brust, J., Schulz-Bull, D. E., Leipe, T., Chavagnac, V., and Waniek, J. J. (2011). Descending particles: from the atmosphere to the deep ocean: a time series study in the subtropical NE Atlantic. Geophys. Res. Lett. 38:L06603. doi: 10.1029/2010GL045399
Buesseler, K. O., Antia, A. A., Chen, M., Fowler, S. W., Gardner, W. D., Gustafsson, O., et al. (2007). An assessment of the use of sediment traps for estimating upper ocean particle fluxes. J. Marine Res. 65, 345–416. doi: 10.1357/002224007781567621
Checkley, D. M. Jr., and Barth, J. A. (2009). Patterns and processes in the California current systems. Prog. Oceanogr. 83, 49–64. doi: 10.1016/j.pocean.2009.07.028
Cianca, A., Godoy, J. M., Martin, J. M., Perez-Marrero, J., Rueda, M. J., Llinás, O., et al. (2012). Interannual variability of chlorophyll and the influence of low-frequency climate modes in the North Atlantic subtropical gyre. Glob. Biogeochem. Cycles 26:GB2002. doi: 10.1029/2010GB004022
Cropper, T., Hanna, E., and Bigg, G. R. (2014). Spatial and temporal seasonal trends in coastal upwelling off Northwest Africa, 1981–2012. Deep Sea Res. II 86, 94–111. doi: 10.1016/j.dsr.2014.01.007
Davenport, R., Neuer, S., Helmke, P., Perez-Marrero, J., and Llinas, O. (2002). Primary productivity in the northern Canary Islands region as inferred from SeaWiFS imagery. Deep Sea Res. II Top. Stud. Oceanogr. 49, 3481–3496. doi: 10.1016/S0967-0645(02)00095-4
Davenport, R., Neuer, S., Hernández-Guerra, A., Rueda, M. J., Linas, O., Fischer, G., et al. (1999). Seasonal and interannual pigment concentration in the Canary Islands region from CZCS data and comparison with observations from the ESTOC time-series station. Int. J. Remote Sens. 20, 1419–1433. doi: 10.1080/014311699212803
Dugdale, R. C., Wilkerson, F. P., and Minas, H. J. (1995). The role of a silicate pump in driving new production. Deep Sea Res. I Oceanogr. Res. Pap. 42, 697–719. doi: 10.1016/0967-0637(95)00015-X
Fischer, G., and Karakas, G. (2009). Sinking rates and ballast composition of particles in the Atlantic Ocean: implications for the organic carbon fluxes to the deep ocean. Biogeosciences 6, 85–102. doi: 10.5194/bg-6-85-2009
Fischer, G., Krause, G., Neuer, S., and Wefer, W. (1996). Short-term sedimentation pulses recorded with a chlorophyll sensor and sediment traps in 900 m water depth in the Canary Basin. Limnol. Oceanogr. 41, 1354–1359. doi: 10.4319/lo.1996.41.6.1354
Fischer, G., Reuter, C., Karakas, G., Nowald, N., and Wefer, G. (2009). Offshore advection of particles within the Cape Blanc filament, Mauritania: results from observational and modelling studies. Prog. Oceanogr. 83, 322–330. doi: 10.1016/j.pocean.2009.07.023
Fischer, G., Romero, O., Toby, E., Iversen, M., Donner, B., Mollenhauer, G., et al. (2019). Changes in the dust-influenced biological carbon pump in the Canary Current System: implications from a coastal and an offshore sediment trap record off Cape Blanc, Mauritania. Glob. Biogeochem. Cycl. 33, 1100–1128. doi: 10.1029/2019GB006194
Fischer, G., Romero, O. E., Merkel, U., Donner, B., Iversen, M., Nowald, N., et al. (2016). Deep ocean mass fluxes in the coastal upwelling off Mauritania from 1988 to 2012: variability on seasonal to decadal timescales. Biogeosciences 13, 3071–3090. doi: 10.5194/bg-13-3071-2016
Fischer, G., and Wefer, G. (1991). “Sampling, preparation and analysis of marine particulate matter,” in The Analysis and Characterization of Marine Particles, eds D. C. Hurd and D. W. Spencer (Washington DC: American Geophysical Union), 391–397. doi: 10.1029/gm063p0391
Freudenthal, T., Neuer, S., Meggers, H., Davenport, B., and Wefer, G. (2001). Influence of lateral particle advection and organic matter degradation on sediment accumulation and stable nitrogen isotope ratios along a productivity gradient in the Canary Islands region. Mar. Geol. 177, 93–109. doi: 10.1016/s0025-3227(01)00126-8
Fründt, B., and Waniek, J. (2012). Impact of the Azores front propagation on deep ocean particle flux. Cen. Eur. J. Geosci. 4, 531–544. doi: 10.2478/s13533-012-0102-2
Garcìa-Reyes, M., Sydeman, W. J., Schoeman, D. S., Rykaczewski, R. R., Black, B. A., Smit, A. J., et al. (2015). Under pressure: climate change, upwelling, and Eastern Boundary upwelling ecosystems. Front. Mar. Sci. 2:109. doi: 10.3389/fmars.2015.00109
Gómez-Letona, M., Ramos, A. G., Coca, J., and Arístegui, J. (2017). Trends in primary production in the Canary Current upwelling system-a regional perspective comparing remote sensing models. Front. Mar. Sci. 4:370. doi: 10.3390/fmars.2017.00370
González-Dávila, M., Santana-Casiano, J. M., and González-Dávila, E. F. (2007). Interannual variability of the upper ocean carbon cycle in the northeast Atlantic Ocean. Geophys. Res. Lett. 34:L07608. doi: 10.1029/2006GL028145
Haine, T. W. N. (2016). Vagaries of Atlantic overturning. Nat. Geosci. 9, 479–480. doi: 10.1038/ngeo2748
Hedges, J. I., Baldock, J. A., Gelinas, Y., Lee, C., Peterson, M. L., and Wakeham, S. G. (2002). The biochemical and elemental compositions of marine plankton: a NMR perspective. Mar. Chem. 78, 47–63. doi: 10.1016/s0304-4203(02)00009-9
Helmke, P., Romero, O., and Fischer, G. (2005). Northwest African upwelling and its effect on off-shore organic carbon export to the deep sea. Glob. Biogeochem. Cycl. 19:GB4015. doi: 10.1029/2004GB002265
Hirsch, R. M., Slack, J. R., and Smith, R. A. (1982). Techniques of trend analysis for monthly water quality data. Water Resour. Res. 18, 107–121. doi: 10.1029/WR018i001p00107
Hwang, J., Manganini, S. J., Montlucaon, D. B., and Eglington, T. E. (2009). Dynamics of particle export on the Northwest Atlantic margin. Deep Sea Res. I 56, 1792–1803. doi: 10.1016/j.dsr.2009.05.007
Inthorn, M., Wagner, T., Scheeder, G., and Zabel, M. (2006). Lateral transport controls distribution, quality, and burial of organic matter along continental slopes in high-productivity areas. Geology 34, 205–208.
Iversen, M. H., and Ploug, H. (2010). Ballast minerals and the sinking carbon flux in the ocean: carbon-specific respiration rates and sinking velocities of marine snow aggregates. Biogeosciences 7, 2613–2624. doi: 10.5194/bg-7-2613-2010
Jones, P. D., Jónsson, T., and Wheeler, D. (1997). Extension to the North Atlantic Oscillation using early instrumental pressure observations from Gibraltar and South-West Iceland. Int. J. Climatolol. 17, 1433–1450. doi: 10.1002/(sici)1097-0088(19971115)17:13<1433::aid-joc203>3.0.co;2-p
Kaufman, Y. J., Koren, I., Remer, L. A., Tanré, D., Ginoux, P., Fan, S., et al. (2005). Dust transport and deposition from the Terra-Moderate Resolution Imaging Spectroradiometer (MODIS) spacecraft over the Atlantic Ocean. J. Geophys. Res. 110:D10S12. doi: 10.1029/2003/JD004436
Klaas, C., and Archer, D. E. (2002). Association of sinking organic matter with various types of ballast in the deep sea: implications for the rain ratio. Glob. Biogeochem. Cycle 16:1116. doi: 10.1029/2001GB001765
Knoll, M., Hernández-Guerra, A., Lenz, B., López Laatzen, F., Machín, F., Müller, T. J., et al. (2002). The Eastern Boundary Current system between the Canary Islands and the African Coast. Deep Sea Res. II Top. Stud. Oceanogr. 49, 3427–3440. doi: 10.1016/S0967-0645(02)00105-104
Kremling, K., Lentz, U., Zeitzschell, B., Schulz-Bull, D. E., and Duinker, J. C. (1996). New type of time-series sediment trap for the reliable collection of inorganic and organic trace chemical substances. Rev. Sci. Instrument. 67, 4360–4363. doi: 10.1063/1.1147582
Krumhardt, K. M., Lovenduski, N. S., Freeman, N. M., and Bates, N. R. (2016). Apparent increase in coccolithophore abundance in the subtropical North Atlantic from 1990 to 2014. Biogeosciences 13, 1163–1177. doi: 10.5194/bg-13-1163-2016
Lathuilière, C., Echevin, V., and Levy, M. (2008). Seasonal and intraseasonal surface chlorophyll-a variability along the northwest African coast. J. Geophys. Res. Oceans 13:C05007. doi: 10.1029/2007/JC004433
Lee, R. B. Y., Mavridou, D. A. I., Papadakos, G., McClelland, H. L. O., and Rickaby, R. E. M. (2016). The uronic acid content of coccolith-associated polysaccharides provides insight into coccolithogenesis and past climate. Nat. Comm. 7:13144. doi: 10.1038/ncomms13144
Lluch-Cota, S. E., Hoegh-Guldberg, O., Karl, D., Pörtner, H.-O., Sundby, S., and Gattuso, J. P. (2014). “Cross-chapter box on uncertain trends in major upwelling ecosystems, in Impacts, Adaptation, and Vulnerability,” in Part A: Global and Sectoral Aspects. Contribution of Working Group II to the Fifth Assessment Report of the Intergovernmental Panel on Climate Change, ed. C. B. Field (Cambridge, MA: Cambridge University Press), 149–151.
López-García, P., Gelado-Caballero, M. D., Santana-Castellano, D., Suárez, de Tangil, M., Collado-Sánchez, C., et al. (2013). A three-year time-series of dust deposition flux measurements in Gran Canaria, Spain: a comparison of wet and dry surface deposition samplers. Atmos. Environ. 79, 689–694. doi: 10.1016/j.atmosenv.2013.07.044
Lovecchio, E., Gruber, N., Münnich, M., and Lachkar, Z. (2017). On the long-range offshore transport of organic carbon from the Canary Upwelling System to the open North Atlantic. Biogeosciences 14, 3337–3369. doi: 10.5194/bg-14-3337-2017
McCave, I. N., Halla, I. R., Antia, A. N., Chou, L., Dehairs, F., Lampitt, R. S., et al. (2001). Distribution, composition and flux of particulate material over the European margin at 47–50N. Deep Sea Res. II 48, 3107–3139. doi: 10.1016/s0967-0645(01)00034-0
Mittelstaedt, E. (1991). The ocean boundary along the northwest African coast: circulation and oceanographic properties at the sea surface. Prog. Oceanogr. 26, 307–355. doi: 10.1016/0079-6611(91)90011-a
Müller, P. J., and Schneider, R. (1993). An automated leaching method for the determination of opal in sediments and particulate matter. Deep Sea Res. I 40, 425–444. doi: 10.1016/0967-0637(93)90140-x
Müller, T. J., and Siedler, G. (1992). Multi-year current time series in the eastern North Atlantic Ocean. J. Mar. Res. 50, 63–98. doi: 10.1357/002224092784797755
Müller, T. J., and Waniek, J. J. (2013). KIEL276 time series data from moored current meters madeira abyssal plain 33°N, 22°W, 5285 m water depth March 1980 – April 2011 background information and data compilation. GEOMAR Rep. N. Ser. 13:65. doi: 10.3289/GEOMAR_REP_NS_13_2013
Narajan, N., Paul, A., and Schulz, M. (2010). Trends in coastal upwelling intensity during the late 20th century. Ocean Sci. 6, 815–823. doi: 10.5194/os-6-815-2010
Neuer, S., Cianca, A., Helmke, P., Freudenthal, T., Davenport, R., Meggers, H., et al. (2007). Biogeochemistry and hydrography in the eastern subtropical North Atlantic gyre. Results from the European time-series station ESTOC. Prog. Oceanogr. 72:1. doi: 10.1016/j.pocean.2006.08.001
Neuer, S., Davenport, R., Freudenthal, T., Wefer, G., Llinás, O., Rueda, M.-J., et al. (2002a). Differences in the biological carbon pump at three subtropical ocean sites. Geophys. Res. Lett. 29, 32/1–32/4.
Neuer, S., Freudenthal, T., Davenport, R., Llinás, O., and Rueda, M.-J. (2002b). Seasonality of surface water properties and particle flux along a productivity gradient off NW Africa. Deep Sea Res. II Top. Stud. Oceanogr. 49, 3561–3576. doi: 10.1016/S0967-0645(02)00098-X
Neuer, S., Ratmeyer, V., Davenport, R., Fischer, G., and Wefer, G. (1997). Deep water particle flux in the Canary Island region: seasonal trends in relation to long-term satellite derived pigment data and lateral sources. Deep Sea Res. 44, 1451–1466. doi: 10.1016/s0967-0637(97)00034-4
Neuer, S., Torres-Padron, M. E., Gelado-Caballeo, M. D., Rueda, M. J., Hernández-Brito, J., Davenport, R., et al. (2004). Dust deposition to the eastern subtropical North Atlantic gyre: does ocean’s biogeochemistry respond? Glob. Biogeochem. Cycle 18:GB4020. doi: 10.1029/2004GB002228
Nykjaer, L., and Van Camp, L. (1994). Seasonal and interannual variability of coastal upwelling along northwest Africa and Portugal from 1981 to 1991. J. Geophys. Res. 99, 14197–14207. doi: 10.1029/94JC00814
Pelegrí, J. L., Arístegui, J., Cana, L., González-Dávila, M., Hernández-Guerra, A., Hernández-León, S., et al. (2005). Coupling between the open-ocean and coastal upwelling region off northwest Africa: water circulation and offshore pumping of organic matter. J. Mar. Syst. 54, 3–7.
Ploug, H., Iversen, M. H., and Fischer, G. (2008). Ballast, sinking velocity, and apparent diffusivity within marine snow and zooplankton fecal pellets: implications for substrate turnover by attached bacteria. Limnol. Oceanogr. 53, 1878–1886. doi: 10.4319/lo.2008.53.5.1878
Pradhan, Y., Lavender, S. J., Hardman-Mountford, N. J., and Aiken, J. (2006). Seasonal and inter-annual variability of chlorophyll-a concentration in the Mauritanian upwelling: observation of an anomalous event during 1998–1999. Deep Sea Res. II 53, 1548–1559. doi: 10.1016/j.dsr2.2006.05.016
Ragueneau, O., Tréguer, P., Anderson, R. F., Brzezinski, M. A., DeMaster, D. J., Dugdale, R. C., et al. (2000). A review of the Si cycle in the modern ocean: recent progress and missing gaps in the application of biogenic opal as a paleoproductivity proxy. Glob. Planet. Change 26, 317–365. doi: 10.1016/s0921-8181(00)00052-7
Rivero-Calle, S., Gnanadesikan, A., Del Castillo, C. E., Balch, W. B., and Guikema, S. D. (2015). Multidecadal increase in North Atlantic coccolithophores and the potential role of rising CO2. Science 350, 1533–1537. doi: 10.1126/science.aaa8026
Romero, O., and Fischer, G. (2017). Shift in the species composition of the diatom community in the eutrophic Mauritanian coastal upwelling: results from a multi-year sediment trap experiment from 2003 to 2010. Prog. Oceanogr. 159, 31–44. doi: 10.1016/j.pocean.2017.09.010
Romero, O. E., Baumann, K.-H., Zonneveld, K. A. F., Donner, B., Hefter, J., Hamady, B., et al. (2020). Flux variability of phyto- and zooplankton communities in the Mauritanian coastal upwelling between 2003 and 2008. Biogeosciences 17, 187–214. doi: 10.5194/bg-17-187-2020
Santana-Falcón, Y., Mason, E., and Arístegui, J. (2020). Offshore transport of organic carbon by upwelling filaments in the Canary Current system. Prog. Oceanogr. doi: 10.1016/j.pocean.2020.102322 [Epub ahead of print].
Siedler, G., Armi, L., and Müller, T. J. (2005). Meddies and decadal changes at the Azores front from 1980 to 2000. Deep Sea Res. II Top. Stud. Oceanogr. 52, 583–604. doi: 10.1016/j.dsr2.2004.12.010
Siegel, D. A., Fields, E., and Buesseler, K. O. (2008). A bottom-up view of the biological pump: modeling source funnels above ocean sediment traps. Deep Sea Res. I 55, 108–127. doi: 10.1016/j.dsr.2007.10.006
Smeed, D. A., Josey, S. A., Beaulieu, C., Johns, W. E., Moat, B. I, Frajka-Williams, E., et al. (2014). The North Atlantic Ocean is in a state of reduced overturning. Geophys. Res. Lett. 45, 1527–1533. doi: 10.1002/2017GL076350
Smith, K. L., Ruhl, H. A., Huffard, C. L., Messié, M., and Kahru, M. (2018). Episodic organic carbon fluxes from surface ocean to abyssal depths during long-term monitoring in NE Pacific. Proc. Nat. Acad. Sci. U.S.A. 48, 12235–12240. doi: 10.1073/pnas.1814559115
Sprengel, C., Baumann, K.-H., Henderiks, J., Henrich, R., and Neuer, S. (2002). Modern coccolithophore and carbonate sedimentation along a productivity gradient in the Canary Islands region: seasonal export production and surface accumulation rates. Deep Sea Res. II 49, 3577–3598. doi: 10.1016/s0967-0645(02)00099-1
Srokosz, M. A., and Bryden, H. L. (2015). Observing the Atlantic Meridional Overturning Circulation yields a decade of inevitable surprises. Science 348:6241.
Stramma, L. (1984). Geostrophic transport in the Warm Water Sphere of the eastern subtropical North Atlantic. J. Mar. Res. 42, 537–558. doi: 10.1357/002224084788506022
Sydeman, W. J., Garcìa-Ryes, M., Schoeman, D. S., Rykaczewski, R. R., Thompson, S. A., Black, B. A., et al. (2014). Climate change and wind intensification in coastal upwelling systems. Science 345, 77–80. doi: 10.1126/science.1251635
Sylla, A., Mignot, J., Capet, X., and Gaye, A. T. (2019). Weakening of the Senegalo-Mauritanian upwelling system under climate change. Clim. Dyn. 53, 4447–4473. doi: 10.1007/s00382-019-04797-y
Van Camp, L., Nykjær, L., Mittelstaedt, E., and Schlittenhardt, P. (1991). Upwelling and boundary circulation off Northwest Africa as depicted by infrared and visible satellite observations. Prog. Oceanogr. 26, 357–402. doi: 10.1016/0079-6611(91)90012-b
Keywords: particle flux, sediment traps, Canary Current, ESTOC, Cape Blanc, biological pump, seasonality, climate change
Citation: Fischer G, Neuer S, Ramondenc S, Müller TJ, Donner B, Ruhland G, Ratmeyer V, Meinecke G, Nowald N, Klann M and Wefer G (2020) Long-Term Changes of Particle Flux in the Canary Basin Between 1991 and 2009 and Comparison to Sediment Trap Records Off Mauritania. Front. Earth Sci. 8:280. doi: 10.3389/feart.2020.00280
Received: 12 March 2020; Accepted: 17 June 2020;
Published: 14 July 2020.
Edited by:
Rut Pedrosa Pàmies, Marine Biological Laboratory (MBL), United StatesReviewed by:
Anna Sanchez-Vidal, University of Barcelona, SpainCathryn Ann Wynn-Edwards, University of Tasmania, Australia
Weifeng Yang, Xiamen University, China
Copyright © 2020 Fischer, Neuer, Ramondenc, Müller, Donner, Ruhland, Ratmeyer, Meinecke, Nowald, Klann and Wefer. This is an open-access article distributed under the terms of the Creative Commons Attribution License (CC BY). The use, distribution or reproduction in other forums is permitted, provided the original author(s) and the copyright owner(s) are credited and that the original publication in this journal is cited, in accordance with accepted academic practice. No use, distribution or reproduction is permitted which does not comply with these terms.
*Correspondence: Gerhard Fischer, gfischer@marum.de