Disentangling artificial and natural benthic weathering in organic rich Baltic Sea sediments
 Michael Fuhr1*
  Klaus Wallmann1
  Andrew W. Dale1 Isabel Diercks1
  Habeeb Thanveer Kalapurakkal1
  Mark Schmidt1
  Stefan Sommer1
  Stefanie Böhnke1
  Mirjam Perner1
  Sonja Geilert1,2
- 1GEOMAR Helmholtz Centre for Ocean Research Kiel, Kiel, Germany
- 2Department of Earth Sciences, Utrecht University, Utrecht, Netherlands
Enhanced mineral dissolution in the benthic environment is currently discussed as a potential technique for ocean alkalinity enhancement (OAE) to reduce atmospheric CO2 levels. This study explores how biogeochemical processes affect the dissolution of alkaline minerals in surface sediments during laboratory incubation experiments. These involved introducing dunite and calcite to organic-rich sediments from the Baltic Sea under controlled conditions in an oxic environment. The sediment cores were incubated with Baltic Sea bottom water. Findings reveal that the addition of calcite increased the benthic alkalinity release from 0.4 μmol cm−2 d−1 (control) to 1.4 μmol cm−2 d−1 (calcite) as well as other weathering products such as calcium. However, these enhanced fluxes returned to lower fluxes after approximately 4 weeks yet still higher than the un-amended controls. Microbial activity appeared to be the primary driver for lowering pore water pH and thus enhanced weathering. In several sediment cores, pH profiles taken at the start of the experiments indicated activity of sulfur oxidizing Beggiatoa spp, which was verified by RNA-profiling of 16S rRNA genes. The pH profiles transitioned to those commonly associated with the activity of cable bacteria as the experiments progressed. The metabolic activity of cable bacteria would explain the significantly lower pH values (~5.6) at sediment depths of 1–3 cm, which would favor substantial calcite dissolution. However, a high abundance of cable bacteria was not reflected in 16S rRNA sequence data. Total alkalinity (TA) fluxes in these cores increased by a factor of ~3, with excess TA/calcium ratios indicating that the enhanced flux originated from calcite dissolution. The dissolution of dunite or the potential formation of secondary minerals could not be identified due to the strong natural flux of silicic acid, likely due to biogenic silica dissolution. Furthermore, no accumulation of potentially harmful metals such as nickel was observed, as highlighted as a potential risk in other studies concerning OAE. Given the complexity of sediment chemistry and changes of the benthic conditions induced by the incubation, it remains challenging to distinguish between natural and enhanced mineral weathering. Further investigation, including the identification of suitable tracers for mineral dissolution, are necessary to assess the feasibility of benthic weathering as a practical approach for OAE and climate change mitigation.
1. Introduction
The 2018 IPCC (Intergovernmental Panel on Climate Change) special report “Global Warming of 1.5°C” and following reports clearly state that negative emissions will be necessary to keep global warming below 2°C compared to preindustrial levels (IPCC, 2018, 2021). Thus, many studies have tried to assess and evaluate different strategies to achieve these negative emissions via carbon dioxide removal (CDR) (Lackner, 2003; Iizuka et al., 2004; Lal, 2004; Feng et al., 2017; Fuss et al., 2018; Beuttler et al., 2019; Campbell et al., 2022). Among these methods, ocean alkalinity enhancement (OAE) via enhanced weathering (EW) of silicate and carbonate minerals was proposed, leading to an envisioned increase of CO2-uptake into the surface ocean and thus serving as an affordable and effective CDR method (Oelkers, 2001; Hartmann and Kempe, 2008; Montserrat et al., 2017; Renforth and Henderson, 2017; Caserini et al., 2021; Campbell et al., 2022).
For example, the dissolution of an idealized magnesium silicate mineral such as forsterite (Mg2SiO4) and carbonate (CaCO3) can be summarized as:
These equations demonstrate that CO2 uptake via forsterite, the Mg-endmember of olivine, is theoretically four times higher compared to CaCO3. Both reactions have been scrutinized with regards to their kinetics mainly in aqueous solutions, with only a few in seawater (Walter and Morse, 1985; Rimstidt et al., 2012; Subhas et al., 2015; Montserrat et al., 2017; Rigopoulos et al., 2018; Fuhr et al., 2022; Flipkens et al., 2023). During the dissolution of olivine, the release of nickel has been proposed as a potential toxicant (Flipkens et al., 2021) and as a potential proxy for olivine dissolution (Montserrat et al., 2017). Furthermore, the formation of secondary minerals such as CaCO3 and phyllosilicates has been described by Rigopoulos et al. (2018) and Fuhr et al. (2022). Their formation depends on the saturation state of the aqueous solution with respect to these minerals and diminishes the CO2 uptake (Burton and Walter, 1987; Sternbeck and Sohlenius, 1997; Lein, 2004; Béarat et al., 2006; King et al., 2010; Fuhr et al., 2022; Moras et al., 2022; Hartmann et al., 2023). Fuhr et al. (2022) subsequently proposed environments where bottom waters are undersaturated with respect to secondary minerals to avoid this negative effect. Since the dissolution of CaCO3, one of the major secondary phases, is driven by undersaturation, it appears sensible to also investigate the possible application of this material in such environments.
The Baltic Sea, where organic rich sediments release up to 80 Tg yr −1 of CO2 (Nilsson et al., 2019), might offer potential sites for benthic OAE research. Natural CO2 production results in high CO2 partial pressure (pCO2) and subsequently seasonally undersaturation with respect to calcite in bottom waters (ΩCal < 1) (Melzner et al., 2013) making parts of the Baltic Sea sediments a potential alkaline mineral application site for enhanced benthic weathering. Additionally, bioturbation might entrain added alkaline substrates into the surface sediments where microbial activity can lead to very low pH and subsequently low ΩCal values, which may enhance dissolution of both olivine and calcite (Meysman et al., 2015; Meysman and Montserrat, 2017; Montserrat et al., 2017). However, the shallow sedimentary depocenters in the Baltic Sea display strong biogeochemical and physical seasonality, which leads to a highly complex chemical system governed by variable oxygen availability, bottom water temperatures, microbial activities, and organic matter degradation rates (Dale et al., 2011; Melzner et al., 2013; Perner et al., 2022). Moreover, the large benthic background fluxes induced by natural CaCO3 input via continental erosion and diatom dissolution (Gasiunaite et al., 2005; Borawska et al., 2022; Wallmann et al., 2022) constitute further challenges for disentangling natural and enhanced weathering, as they might overprint potential fluxes induced by enhanced benthic weathering.
This experimental study examines the geochemical processes affecting enhanced benthic weathering of calcite and olivine, the major component of dunite, in intact sediment cores derived from Boknis Eck, a shallow depocenter (~28 m water depth) in Eckernförde Bay (southwestern Baltic Sea) under controlled laboratory conditions. The bottom waters of this region are subject to a strong seasonality. During winter, the entire water column is mixed leading to weak chemical and physical gradients. During summer and autumn, warm and brackish surface waters over-flow colder and saltier bottom waters. The increasing stratification induces continuous deoxygenation with depth leading to hypoxic to anoxic conditions with lower pH values and high pCO2 in late summer and early autumn (Melzner et al., 2013; Lennartz et al., 2014). In order to understand mineral dissolution processes and to quantify alkalinity enhancement via enhanced benthic weathering, bottom water and pore water chemistry combined with micro-profiling and microbial 16S rRNA gene data are used in this study to disentangle natural and enhanced weathering under predominantly aerobic winter conditions.
2. Materials and methods
2.1. Materials
Ten sediment cores (50 cm multi-corer) and 120 l of bottom water were recovered from 27 m water depth (below the euphotic zone) at Boknis Eck, Eckernförde Bay, with FK Littorina on January 13th 2022. These cores contained 20–24 cm of sediment and between 1.5 l and 2 l of bottom water. After recovery, the cores containing mainly fine-grained sediments of the clay to fine sand fraction, were sealed top and bottom with rubber plugs, held in upright position, and taken to a cool laboratory (12.5°C). One core was sliced for pore water and sediment analyses and one core was subsampled for bacterial 16S rRNA amplicon sequencing immediately after recovery. They served to provide data characteristic of the initial sediment conditions. Eight cores were kept for the incubation experiments. Dunite and calcite were used as alkaline materials to investigate their efficiency with respect to OAE. Dunite (Olivine AFS 80) was obtained from SibelcoTM that ultimately derives from several quarries in Årheim (Norway). Via sieving, the 20–30μm fraction was extracted. For the mineralogical composition see Supplementary Table 1S. Since the dunite used in this study contains 88.8% olivine (Supplementary Table 1S) and this mineral dissolves much faster than the other components (Pokrovsky and Schott, 2000), it was assumed that olivine is the major dissolving silicate phase. For correct nomenclature, though, dunite will be used to describe the added material, whereas olivine will be used to describe the dissolution kinetics and stoichiometry of this mineral. Ground limestone (CaCO3 > 99%, Jurassic, grain size < 0.1 mm) obtained from the German limestone association (Supplementary Table 2S) was first rinsed with deionized water (18.2 MΩ cm−1-Milli-Q system). In order to avoid an unknown fine fraction remaining in suspension during the experiment, the material was first mixed with deionized water in a settling column (height 20 cm), and particles that remained in suspension after 20 s were decanted. This procedure was repeated until the supernatant water was clear after 20 s to ensure that after adding the material to the sediment cores, all particles sink to the sediment surface after several minutes. Due to the high calcite content, this material will henceforth be referred to as calcite.
2.2. Determination of reactive surface
For dunite grains, the reactive surface was calculated as the surface of spherical grains as the majority of studies report dissolution kinetics based on this assumption (Rimstidt et al., 2012).
For calcite grains, the reactive surface was determined via gas adsorption using the Brunauer-Emmett-Teller (BET) method following Brunauer et al. (1938) on a StöhleinTM AREA-Meter II. For this method two equally sized vessels (see Figure 1), one containing the sample and the other empty, are filled with nitrogen at atmospheric pressure at room temperature. Subsequently, both adsorption flasks are immersed in liquid nitrogen, cooling them to the boiling point of liquid nitrogen. At this temperature, the sample adsorbs nitrogen, resulting in a pressure difference between the adsorption flask and the reference flask, which is measured using a differential manometer. The specific surface area is calculated from this pressure difference, the initial pressure, and the sample weight. Results of the measurements and calculations are summarized in Table 1.
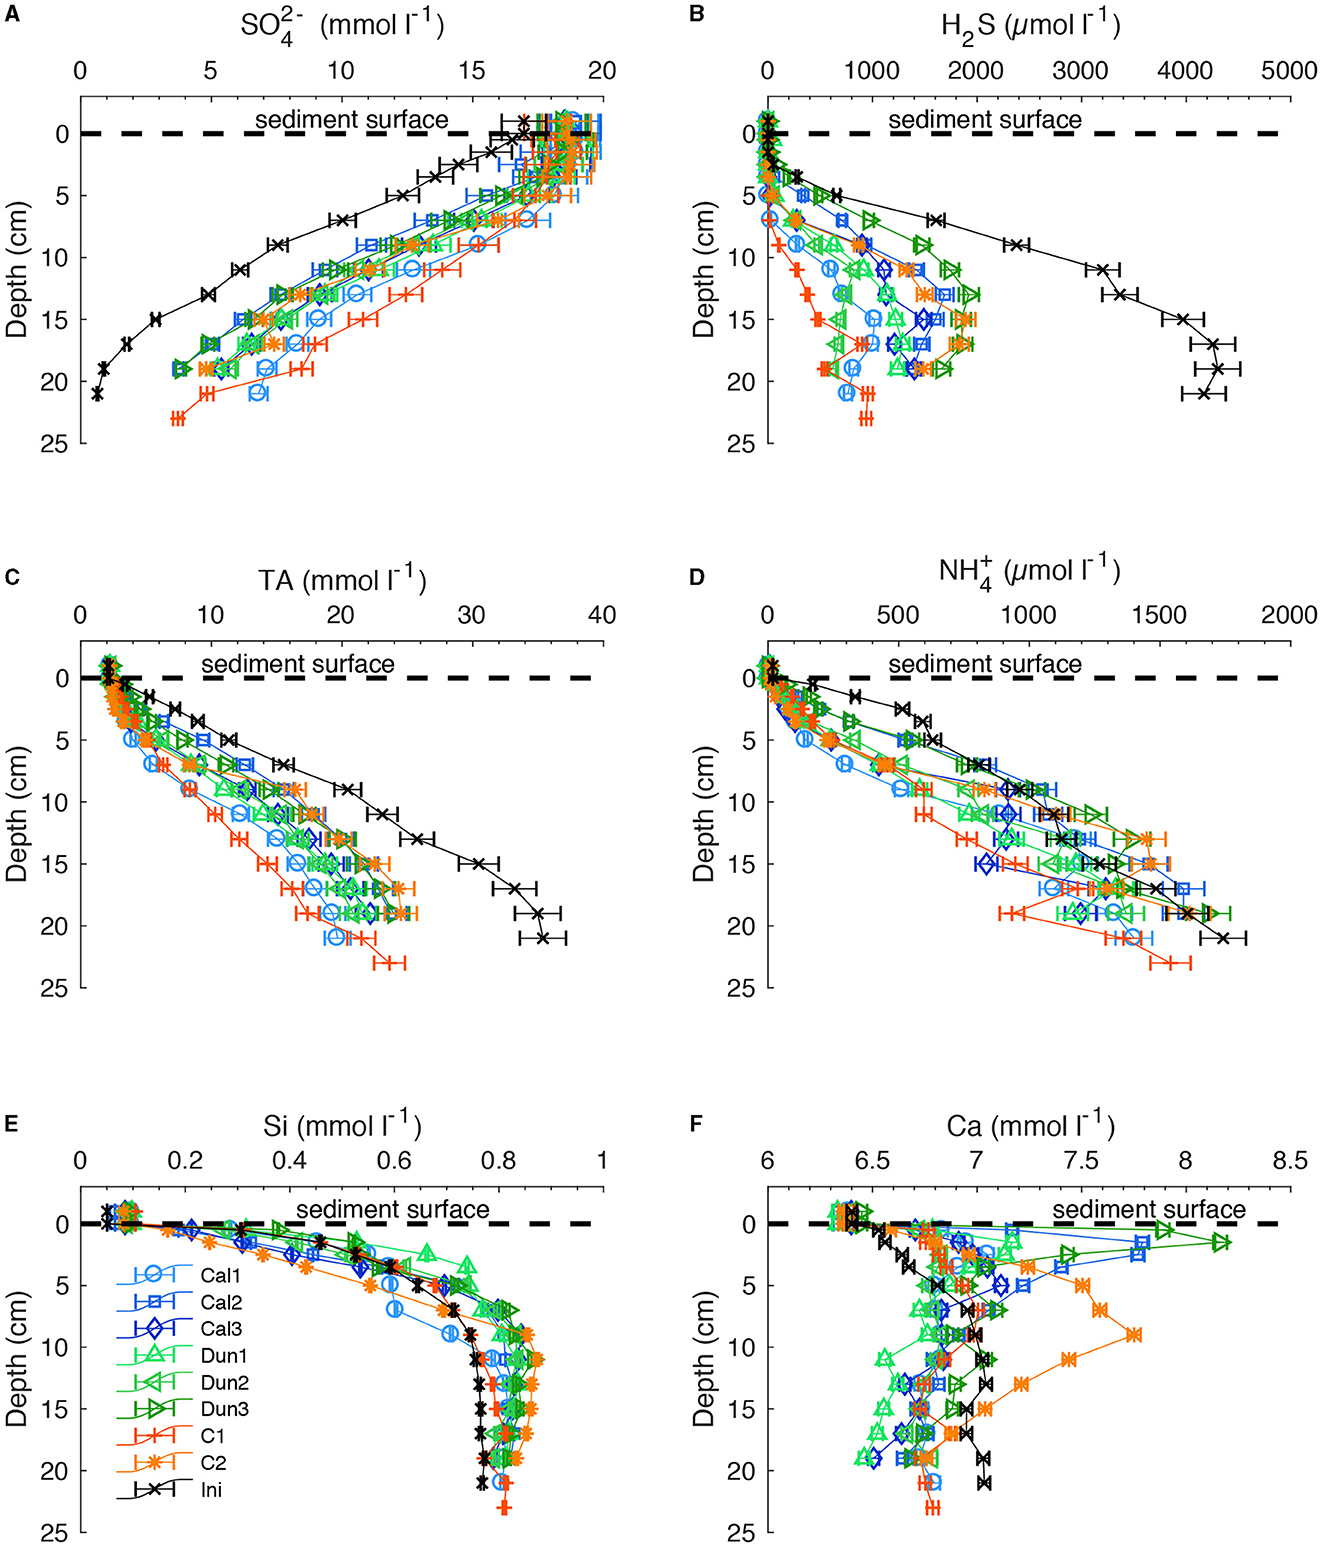
Figure 1. (A) SO, (B) H2S, (C) TA, (D) NH, (E) Si, and (F) Ca concentrations in all sediment cores. Colored markers indicate concentrations in each core at the end of the experiment. Black crosses indicate the concentrations in the initial core. Horizontal dashed line represents the sediment surface. Data above the sediment surface are bottom waters. Error bars report analytical precision.
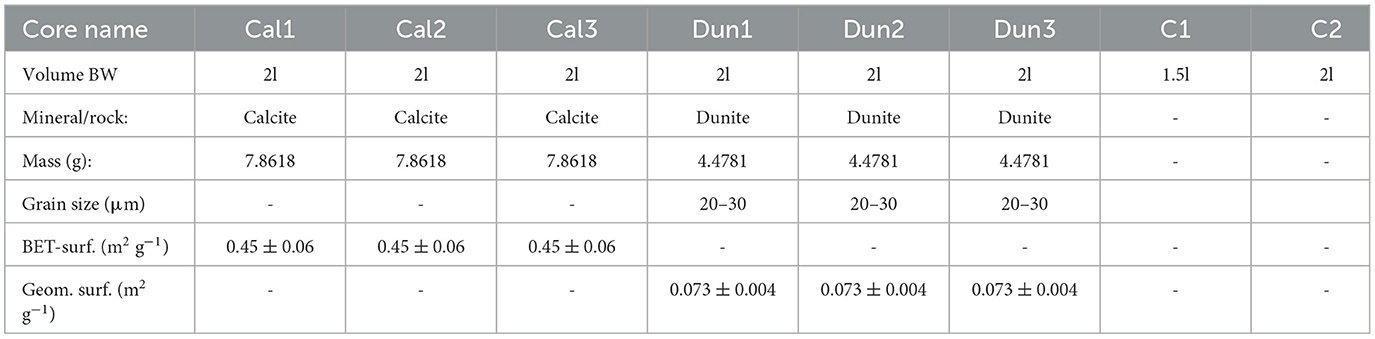
Table 1. Overview over different cores, including bottom water (BW) volumes, treatments (Cal, calcite; Dun, dunite; C, control), BET surface area of calcite (measured) and geometrical surface area of dunite grains assuming an average grain size of 25 μm.
2.3. Experimental setup
The eight sediment cores were placed in a rack in an upright position. The bottom water was carefully removed via suction and replaced with a known volume (1.5 l−2.0 l) of filtered (0.2 μm) Baltic Sea bottom water in order to remove pelagic auto- and heterotrophs and suspended particles. The volume of water added depended on the height of sediment in each core which varied slightly due to the recovery method. After this procedure, a gaseous headspace of ca. 10 cm was left in each core. Furthermore, the cores were equipped with adjustable stirring heads that contained ports for inserting optodes to continuously record pH and O2 concentrations in the overlying water (for details see Section 2.4). In order to prevent anoxic conditions developing, ambient air was bubbled into the water column. The water column in each core was slowly and continuously flushed with a constant throughflow of 40 μl min−1 from a single reservoir of bottom water. The residence time of the water inside the cores was thus about 4–5 weeks.
The cores were kept untreated for 3 weeks prior to mineral addition in order to equilibrate with the laboratory environment and to obtain a quasi-steady state natural background for each core. After this period, calcite (Cal1–Cal3) and dunite (Dun1–Dun3) were carefully spread on the sediment surface with three replicates for each treatment. Two control cores were left untreated (C1, C2). A precise description of each core is given in Table 1. The incubation was carried out in darkness for approximately 3 months at 12.5°C.
2.4. Sampling procedure and analysis
Bottom water samples were taken from the outflow of each core over a time period of several hours. Thus, samples represent the average outflow over the respective time period. Sampling intervals increased from daily during the first 2 weeks to every 3–4 days and weekly toward the end of the experiment. All samples were filtered through a 0.2 μm cellulose membrane filter and refrigerated in 25 ml ZinsserTM scintillation vials. A 5 ml aliquot was frozen directly after the sampling procedure for later nutrient analysis. Nutrient measurements were performed either via manual photometric measurement (NH4) or using a Seal—AnalyticalTM QuAAtro autoanalyzer (PO, NO, NO). Samples for TA were analyzed directly after sampling by titration of 1 ml of bottom/pore water with 0.02N HCl following Ivanenkov and Lyakhin (1978). Titration was ended when a stable purple color appeared. During titration, the sample was degassed by continuous bubbling with nitrogen to remove any generated CO2 and H2S. The acid was standardized using an IAPSO seawater standard. Anion element concentrations (SO, Cl−, Br−) were determined using ion chromatography (IC, METROHM 761 Compact, conductivity mode). Acidified sub-samples (30 μl suprapure HNO + 3 ml sample) were prepared for analyses of major and trace elements (Si, Na, K, Li, B, Mg, Ca, Sr, Mn, Ni and Fe) by inductively coupled plasma optical emission spectroscopy (ICP-OES, Varian 720-ES).
At the end of the experiments, the bottom water was removed via suction and the cores were sliced for pore water, solid phase and bacterial 16S rRNA analysis. The pore waters were recovered by centrifuging each respective sediment layer in 50 ml falcon tubes at 3,000 rpm for 10 min. Afterwards, the supernatant water was transferred to polyethylene (PE) vials in an Ar-filled glove bag to minimize contact with oxygen. In addition to the parameters listed above, pore waters were analyzed for H2S and Fe2+. For the analysis of dissolved Fe2+ concentrations, sub-samples of 1 ml were taken within the glove bag, immediately stabilized with ascorbic acid and analyzed within 30 min after complexation with 20 μl of Ferrozin. For H2S, an aliquot of pore water was diluted with appropriate amounts of oxygen-free artificial seawater and the H2S was fixed by immediate addition of zinc acetate gelatin solution. Further details are described by Dale et al. (2014, 2016).
Subsamples for bacterial community analyses were collected from surface sediments (0–2 cm) of all treatments and controls at the beginning of the experiment, after 42 days and at the end of the incubation (72 days, t6). At the end of the experiment (91 days, t7), not only the surface sediment but the entire core of one control (C1) was subsampled, with a resolution of 1 cm in the first 4 cm, followed by 2 cm sampling below the 4 cm horizon. The same resolution was used for the above-mentioned environmental start core that was also subsampled in a whole. All microbiological samples were immediately frozen at −80°C until further processing.
Bottom water pH and O2 were continuously measured using logging devices (PyroscienceTM PHROBSC-PK8 and OXROB3, respectively) calibrated following the instructions as provided by the manufacturer. Three TRIS-buffers were used to calibrate the pH probe for brackish bottom water conditions (Pratt, 2014; Müller et al., 2018). pH is reported on the total scale.
2.5. Solid phase analysis
Total carbon (TC) and total organic carbon (TOC) as well as total nitrogen (TN) and total sulfur (TS) were measured in freeze-dried and ground sediment samples by flash combustion using the Carlo Erba Element Analyzer (NA-1500). Total inorganic carbon (TIC) was calculated by subtracting TOC from TC. The accuracy of the method was tested by method blanks and two reference standards [2.5-Bis(5-tert-butyl-2-benzo-oxazol-2-yl)thiophene (BBOT, HEKAteckTM) and one internal sediment standard]. For more details see Bohlen et al. (2011) and Dale et al. (2011).
2.6. Micro profiling
Sediment micro profiling was performed using a motorized UnisenseTM micromanipulator (MMS). Oxygen, pH and H2S profiles were measured with UnisenseTM sensors Ox-50, pH-100 and SULPH-100, respectively. Vertical step sizes were adjusted to the respective sensor (minimum size was twice the needle diameter) and desired measuring resolution to keep the time for profiling as short as possible (100 μm for all O2 profiles, 250μm for first pH and H2S profiles, later 300 μm). All sensors were calibrated in accordance with manufacturer recommendations for saline solutions (UnisensTM calibration kit for SULPH-100 with a calibration concentration of 109 μmol l−1). Additionally to WTWTM standard pH buffers (4.01, 7.00 and 10.01), the pH sensitivity of the pH-100 in brackish waters and the off-set was determined using three TRIS-buffers (Pratt, 2014; Müller et al., 2018). After obtaining H2S and pH profiles, the total dissolved sulfur concentration was calculated according to the UnisenseTM guidelines based on Millero et al. (1988) and Jeroschewski et al. (1996). Unless otherwise stated, H2S henceforth refers to total dissolved hydrogen sulfide (H2S + HS−).
2.7. Flux calculations from bottom water concentrations and oxygen profiles
Solute fluxes were calculated based on concentrations in the inflow and the outflow following:
where Fe is the flux of any component (e) over the entire sediment surface (mol cm−2 d−1), is the measured concentration change of the respective element over a specific time (mol l−1 d−1) assuming that the concentration of this element is not affected by any process in the water column. kw is the water exchange rate in d−1, Cout is the outflow concentration (mol l−1), Cin is the inflow concentration (mol l−1), VMUC is the bottom water volume (l) in each core and Ased (cm2) is the sediment surface area of each core.
These calculations were performed for all measured solutes except oxygen and H2S. Additionally, diffusive fluxes were calculated based on pore water profiles following:
where, Fsed is the flux of a respective solute (μmol cm−2 d−1), ϕ is the porosity, Ds is the molecular diffusion coefficient in the sediment and dC/dz is the concentration gradient where the flux is determined. Ds was calculated as:
where, DM is the molecular diffusion coefficient in seawater and m is an empirical factor (here m = 3) (Boudreau, 1997). The DM values were calculated following Boudreau (1997).
For a clearer visualization, the flux data were smoothened using a moving average. For further calculations, raw flux data were used (Supplementary material S1.1 and Supplementary Figure 1S).
2.8. Temporal segmentation of experimental data
In order to compare results from the different cores, the experiment was segmented into different time intervals. These time intervals were defined individually for each core in a way that each interval started intermediate between the times that microsensor profiles were obtained. The time intervals for each core are listed in Table 2 and reported as starting time to end time in days after addition of substrates.
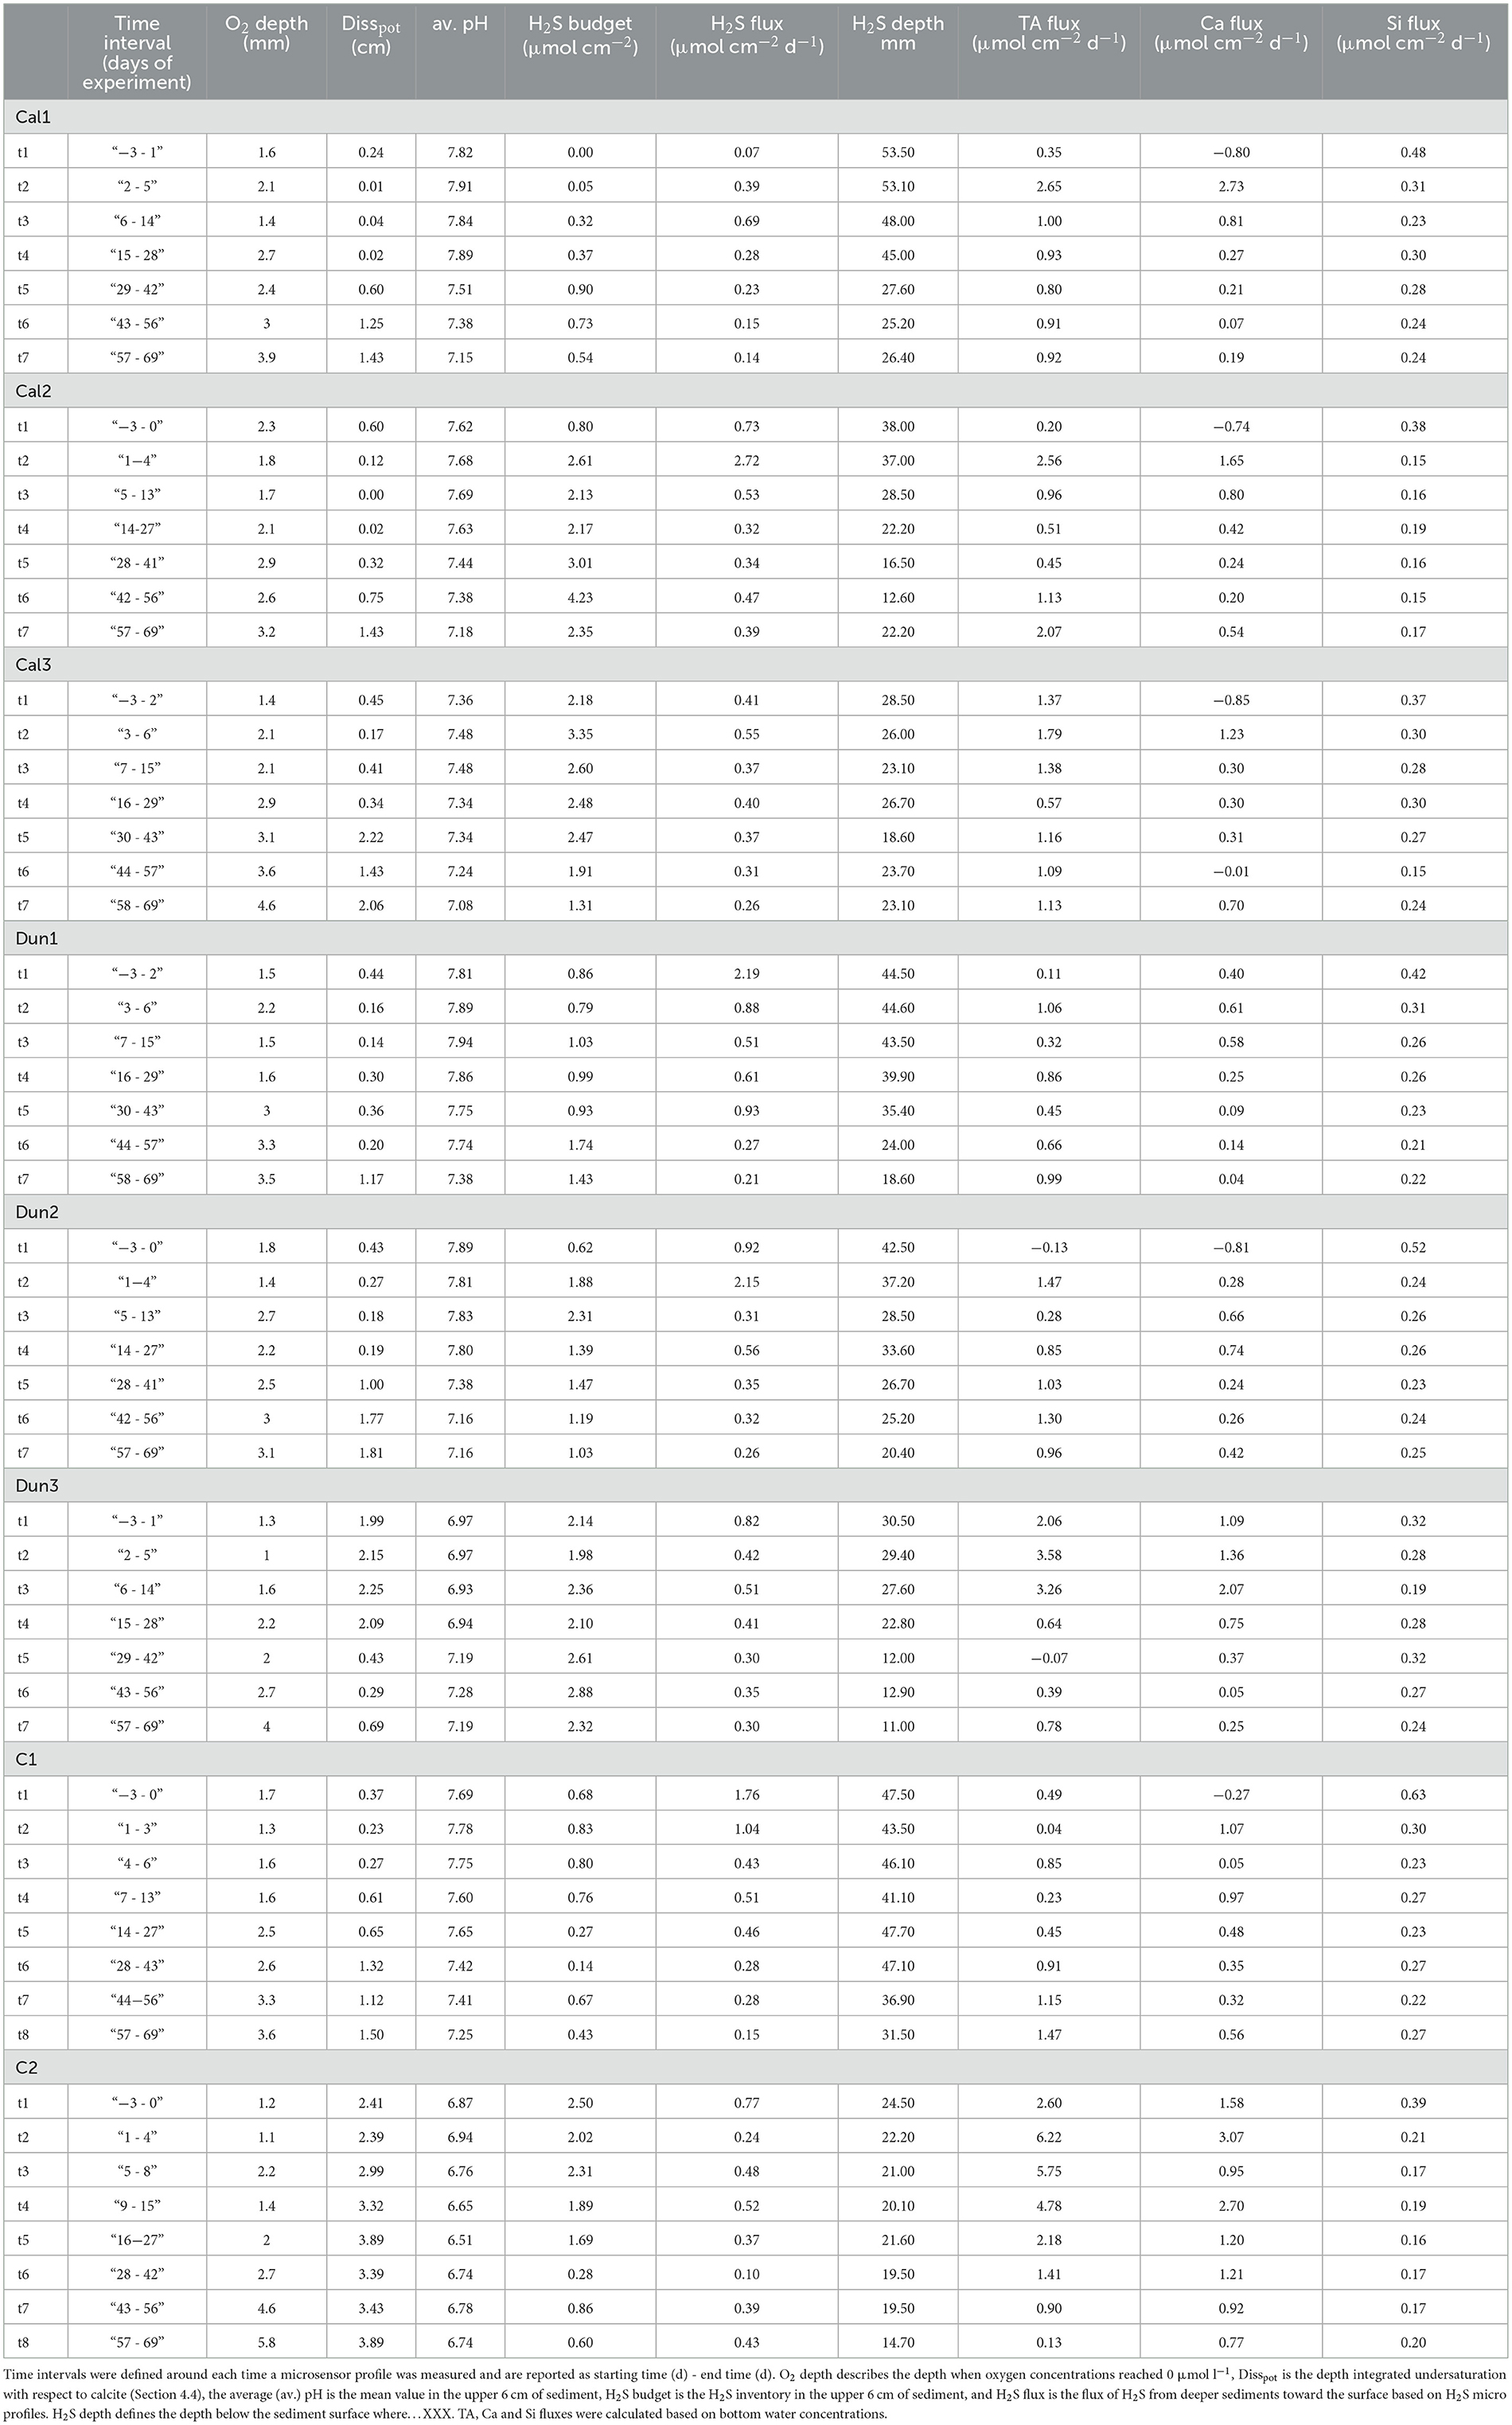
Table 2. Pore water properties of all cores in the upper 6 cm of the sediment during different time intervals (t1–t7).
The pore water O2, H2S and pH were assumed to be constant in each time interval. Subsequently the fluxes for O2 and H2S calculated from the microsensor data were averaged over the respective time interval to provide values in μmol cm−2 d−1 (Table 2). The oxygen penetration depth was defined as the depth where the oxygen concentration reached detection limit (~0.2 μM). pH values are reported as an average over the entire depth where each profile was obtained. The depth where H2S first appeared below the sediment surface was defined as the depth where measured H2S exceeded the analytical precision (~2 μmol l−1). H2S inventory for each time period were calculated by integrating bulk sediment concentrations over the upper 6 cm height and are reported as μmol cm−2.
2.9. Sequencing and sequence processing of 16S amplicon data
For studying the composition of the microbial community, a 16S amplicon library compatible with the Illumina MiSeq System was prepared as described previously (Böhnke et al., 2019; Perner et al., 2022). Briefly, RNA was extracted from around 300 mg sediment sample using the NucleoBond RNA Soil Mini kit (Macherey-Nagel, Düren, Germany) followed by subsequent DNaseI digestion using the RapidOut DNA Removal kit (Thermo Fisher Scientific GmbH, Waltham, Massachusetts, USA). Total environmental RNA was transcribed into cDNA with Invitrogen's SuperScript® VILOTM cDNA Synthesis Kit (Life TechnologiesTM, Darmstadt, Germany). Purified cDNA (Zymo Clean & Concentrator-5, Irvine, CA, USA) was then used to generate 16S ribosomal amplicons for the bacterial hypervariable V3 and V4 regions using the primer pairs S-D-Bac-0341-b-S-17 and S-D-Bac-0785-a-A-21 as described by Klindworth et al. (2013). Sequencing was done in collaboration with the Competence Center for Genomic Analysis (CCGA) of the Institute of Clinical Molecular Biology (IKMB, CAU Kiel, Germany) in a 2x300 bp paired-end sequencing run on the Illumina MiSeq platform (Illumina, St. Diego, USA).
For sequence processing the Qiime2 workflow was applied (Bolyen et al., 2019). Here, filtering and merging of demultiplexed raw reads were performed using the dada2-plugin with default settings and removal of the primer sequences (Callahan et al., 2016). For taxonomic assignments, the SILVA database release 138 (99% OTUs full-length sequences) (Quast et al., 2013) was pretrained with the respective primer pairs for bacteria (Pedregosa et al., 2011; Bokulich et al., 2018). The assignments were computed using the feature-classifier plugin (classify sklearn) with default settings and the pre-trained SILVA classifier (Bokulich et al., 2018). The phylogeny was calculated using the “align-to-tree-maffft-fasttree” pipeline (Price et al., 2010). Statistical analyses and plots were performed using R software (R Foundation for Statistical Computing, Vienna, Austria. URL https://www.R-project.org/) using the “microeco” package (Liu et al., 2021).
3. Results
3.1. Geochemical changes in pore water over time
Pore water analysis of one core was performed at the beginning of the experiment, and in all cores at the end of the experiment (Figure 1A). In all cores, SO concentrations decreased with depth. In the initial core, SO decreased to < 1 mM. Concentrations and penetration depths increased significantly in all cores over the course of the experiment, whereas the bottom water concentration increased only slightly from ~17 mmol l−1 to ~18 mmol l−1 (Figure 1A). In deeper sediment layers, the concentration increase was much larger, varying from 3 mmol l−1 in Dun3 to 6 mmol l−1 in Dun2 at 20 cm depth.
This downcore decrease in SO was mirrored by a downcore increase in H2S (Figure 1B). At the end of the incubation, H2S concentrations in all cores were lower compared to initial values. The H2S loss relative to the initial values was slightly smaller than the SO increase with large variations between the different cores (~800 μmol l−1 in Dun2 to ~2,000 μmol l−1 in C2 at the end of the experiment compared to ~4,000 μmol l−1 at the beginning in 20 cm depth). In the initially sampled core, the H2S front (i.e. the depth where H2S increases sharply) was about 3 cm. By the end of the experiment, this depth horizon had shifted downwards to ~5 cm and to ~7 cm in the cores Dun2 and C1, respectively. Exceptions to this trend are Cal2 and Dun3, where no change in the H2S depth horizon from the initial value was observed.
In all cores, TA increased with depth (Figure 1C), but decreased in each depth layer over the course of the experiment by 10 mmol l−1 (C2) to 15 mmol l−1 (Cal2) compared to the initial values.
A different behavior was observed for NH. Compared to the initially sampled core, lower concentrations were measured in the upper sediment sections (0–7 cm) toward the end of the experiment in all cores. However, the concentrations in deeper layers did not decrease and fluctuated around initial values (Figure 1D).
Initial Si concentrations (Figure 1E) increased sharply in the upper 5–7 centimeters. This concentration gradient weakened with depth and reached asymptotic values of about 750 μmol l−1 below 15 cm depth. In the cores sampled after the experiment, concentrations in all cores increased to ~850 to ~950 μmol l−1 at ~10 cm depth. In the upper 5 cm, concentrations were mostly lower compared to initial values.
Initial Ca concentrations increased linearly from ~6.4 to ~7.0 mmol l−1 at 7 cm depth, and then fluctuated around these values in deeper layers. Final concentrations in the upper sediment were markedly higher than initial ones, and up to ~6.8 mmol l−1 (C1) and ~8.2 mmol l−1 (Dun3). In most incubated cores, Ca concentrations showed peaks between 2.5 cm and 5 cm. An exception to this was core C2 with highest values (~7.8 mmol l−1) observed at 10 cm depth. Below the peak, Ca concentrations decreased in all cores to values between ~6.4 mmol l−1 (Dun1) and ~6.8 mmol l−1 in C1.
3.2. Fate of added material and solid phase composition
After the addition of calcite and dunite, the substrates initially covered the sediment surface as an approximately 0.5 mm thick layer. Within the first 2 weeks the grains had been entrained into the sediment and were continuously transported further downwards until they reached a depth of 1–2 cm after about 6 weeks. By the experiment, the substrates were visible as a brighter layer in the sediment through the walls of the cores clearly distinguishable from the matrix (Supplementary Figure 4S).
In the initially sampled core, TIC content varied between 0 and ~ 4.5 wt.% with a slight increase downcore (Figure 2). In calcite-treated cores, TIC content at the surface at the end of the experiment was up to 16 % in the uppermost sample. C1 also showed values of ~6% in the upper 3 cm. After the experiment, TIC contents in all cores below 3 cm were in the same range, except in Dun3 where TIC contents up to 10% were measured at 15 cm depth. This core showed overall higher concentrations compared to the other treatments.
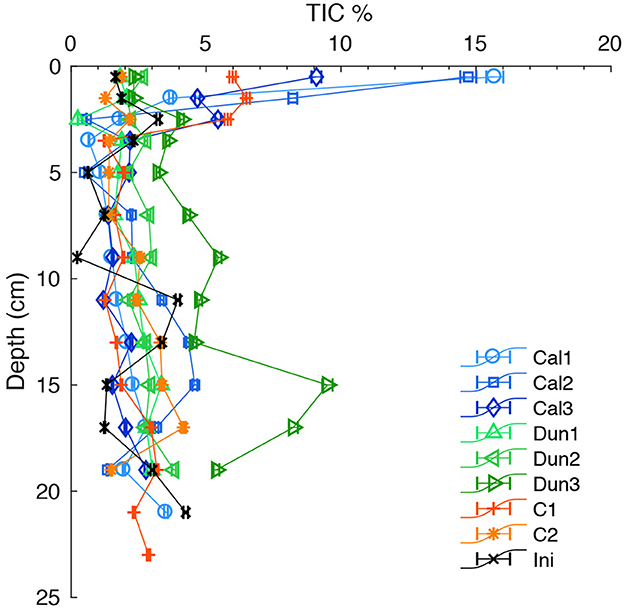
Figure 2. TIC content in the solid phase of all cores. Colored markers indicate contents in each core at the end of the experiment. Black crosses indicate the contents in the initial core. Error bars report analytical precision.
3.3. pH shift in pore waters as observed by micro profiling
The pH distribution in pore water profiles was highly dynamic (Figure 3) with two major regimes that occurred at different times in nearly all cores (exceptions are Dun3 and C2). Initially, pH decreased by around 0.5 units in the oxic surface layer (~1– 2 mm, Table 2) and then increased in deeper sediments by up to 1.4 units (peaking around 4 cm) before decreasing again below 5 cm. Lowest surface pH (~7.0) was observed in Dun1 and Dun2 (Figure 3), along with highest values in deeper sediments (~8.4). Over the course of the experiment, this distribution gradually shifted to the second major regime that was initially observed in Dun3 and C2, that is, a clear pH peak with values up to 8.5 (Dun3) just below the surface. With increasing depth, pH decreased down to values of ~5.6 (C2).
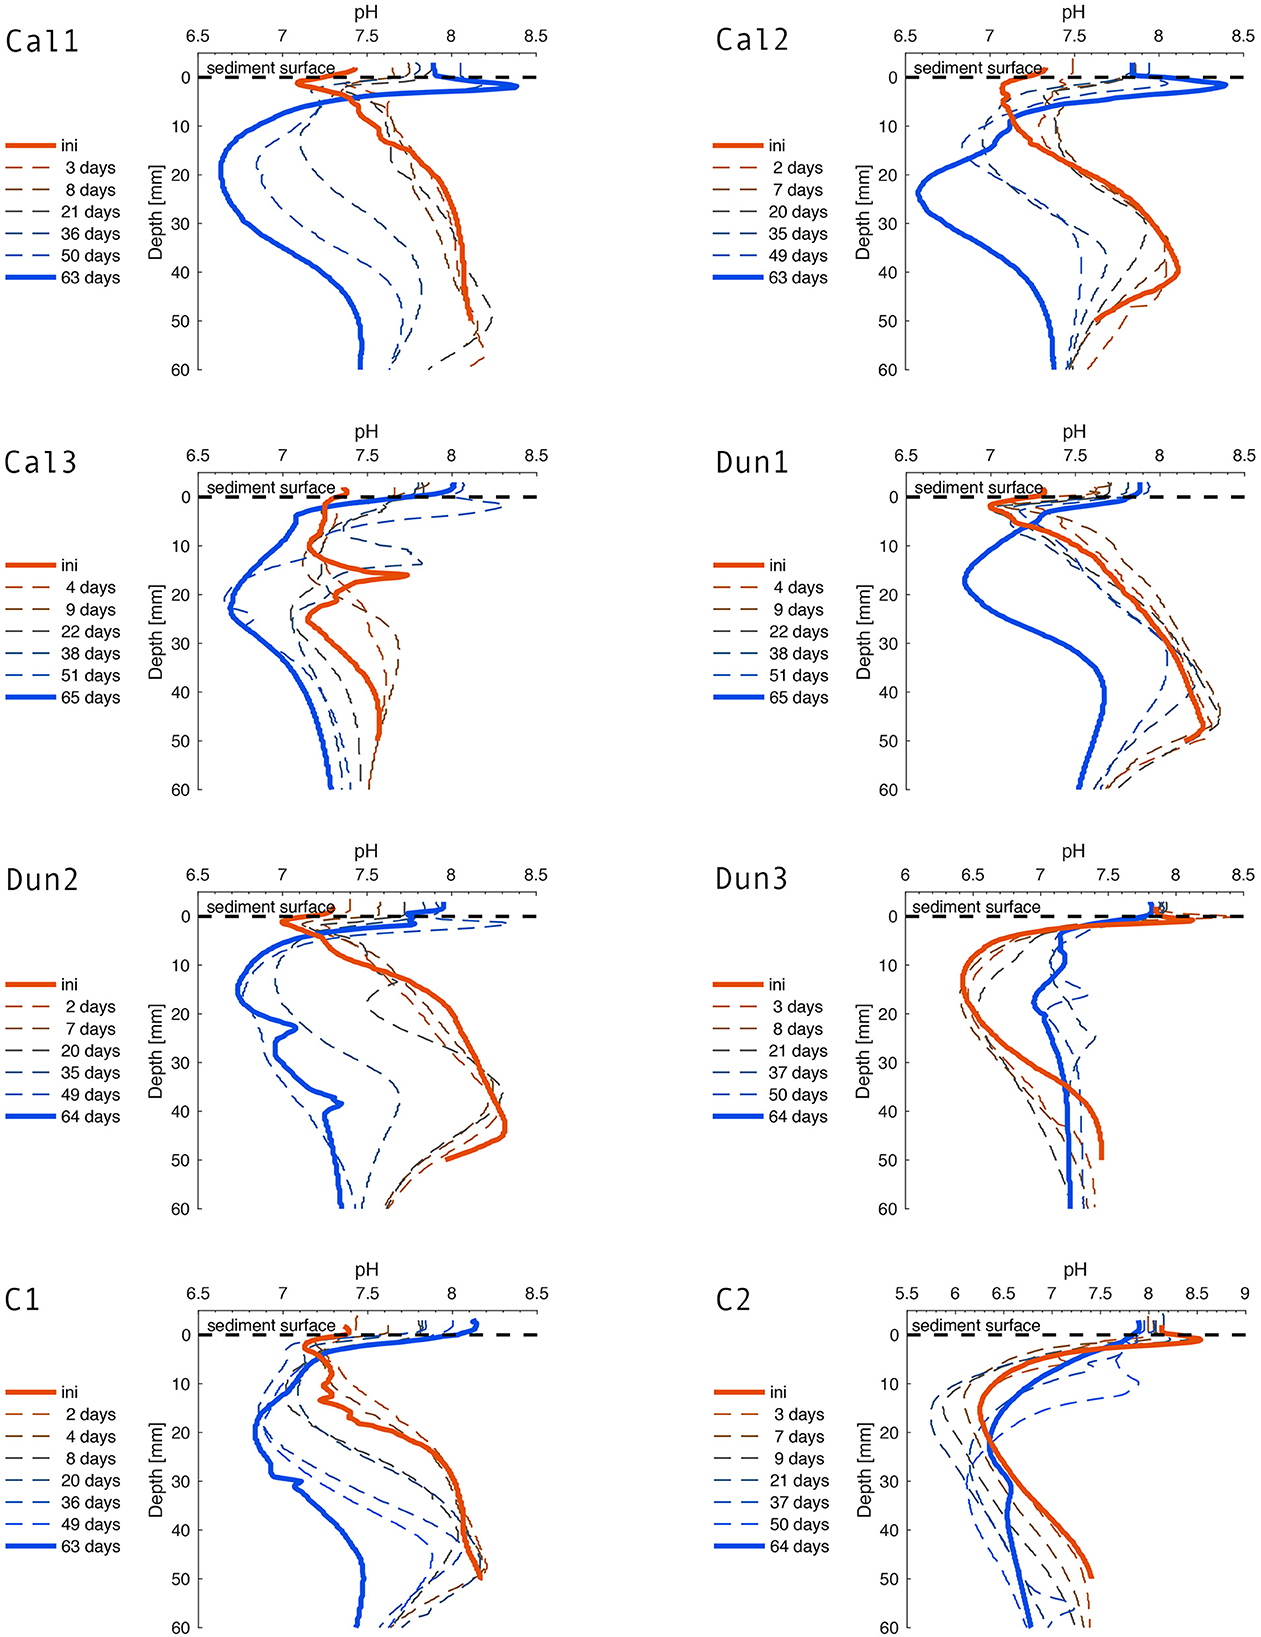
Figure 3. pH-profiles over the course of the experiment. Solid red and blue lines indicate the initial (1 day before addition of substrates) and final profiles, respectively. Dashed lines represent the profiles measured in days after addition of alkaline minerals.
3.4. Bottom water chemistry and fluxes across the sediment/water interface
TA concentrations in bottom waters increased over time in all cores over the first month of the experiments (Figure 4A). These changes are mirrored by corresponding TA fluxes (Figure 4B). Addition of alkaline minerals led to an almost immediate increase in TA fluxes for all calcite and dunite-treated cores. The reference core (C2) and dunite-treated core (Dun3) initially showed a very rapid TA increase to peak values of 4 mmol l−1 (Dun3) to 5.5 mmol l−1 (C2). Toward the end of the experiment, TA fluxes generally declined to about 1 - 2 μmol cm−2 d−1 for all cores treated with alkaline minerals. The two reference cores (C1, C2) covered a surprisingly large range in TA concentrations and fluxes despite no minerals being added.
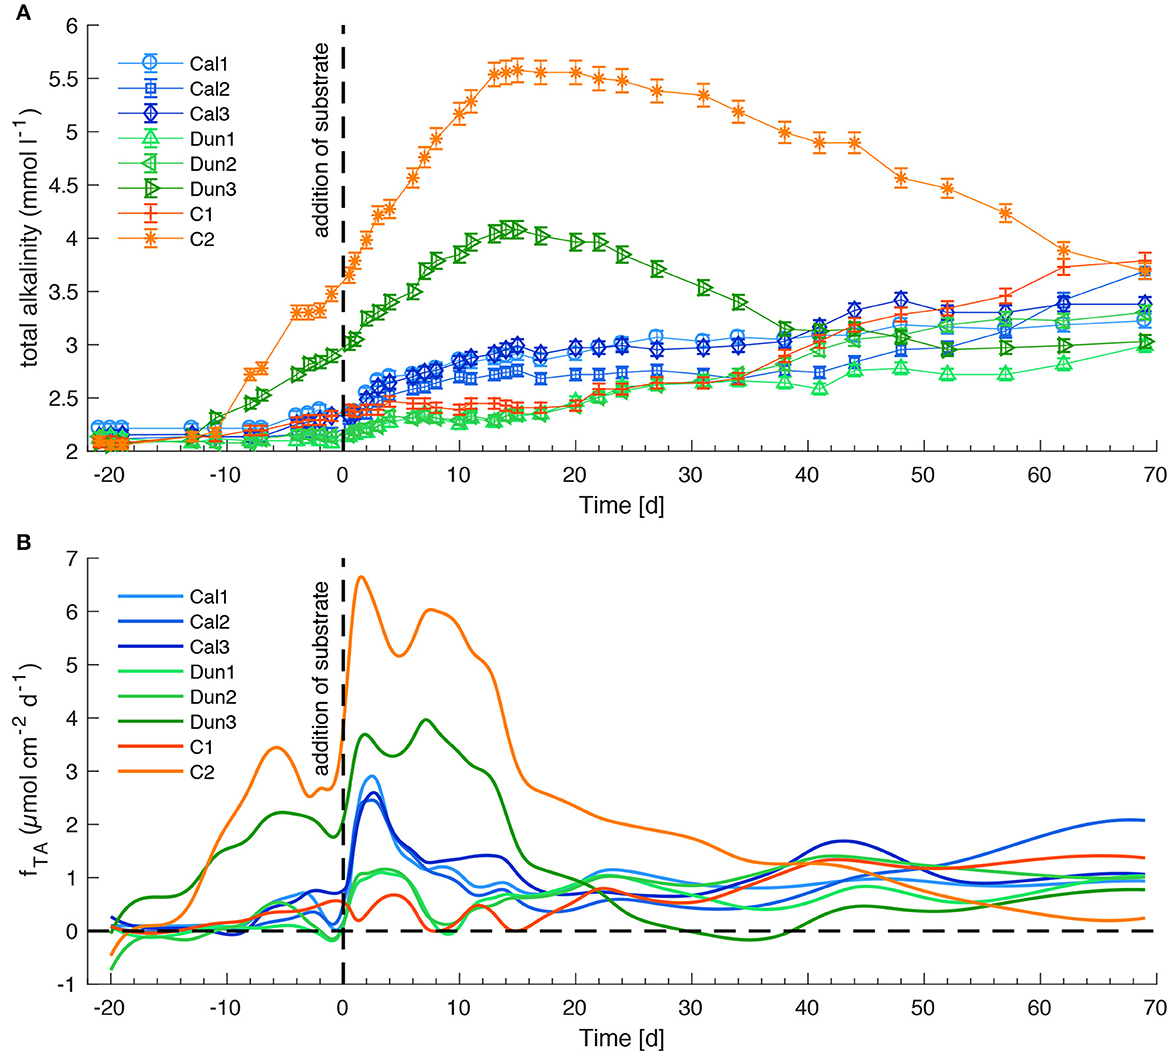
Figure 4. TA concentrations in bottom waters (A) and fluxes at the sediment surface (B) in all sediment cores. Positive fluxes denote a flux from the sediment to the bottom water and negative fluxes vice versa. Dashed lines indicate the addition of substrates. Time is given in days relative to mineral addition. Error bars on the concentrations denote analytical precision. Fluxes were calculated from bottom water concentrations (Eq. 3). For clarity, flux data were filtered as described in the Supplementary material S1. Note that filtered data is only used for visualization and not for any further calculations.
Dissolved silicon concentrations (Figure 5A) increased in all cores during the early stage of the experiment to peak values between ~190 μM (Dun3) and ~375 μM (Cal1). The corresponding fluxes (Figure 5B) averaged between 0.28 μmol cm−2 d−1 and 0.65 μmol cm−2 d−1 in the respective cores during this period. During the 8 days prior to addition of substrates, the concentrations in all cores slightly decreased, as reflected in decreasing fluxes. An increase in Si concentrations between day −1 and day 0 was associated with elevated fluxes just prior to mineral addition. A strong decrease in average fluxes around day 0 led to a slight decrease in Si concentrations. Afterwards the increasing trend in concentrations was a common feature for all cores with no significant trend ascribable to a specific treatment. Over the course of the experiment, the fluxes smoothened out and varied between 0.16 μmol cm−2 d−1 (Cal1) and 0.3 μmol cm−2 d−1 (C1).
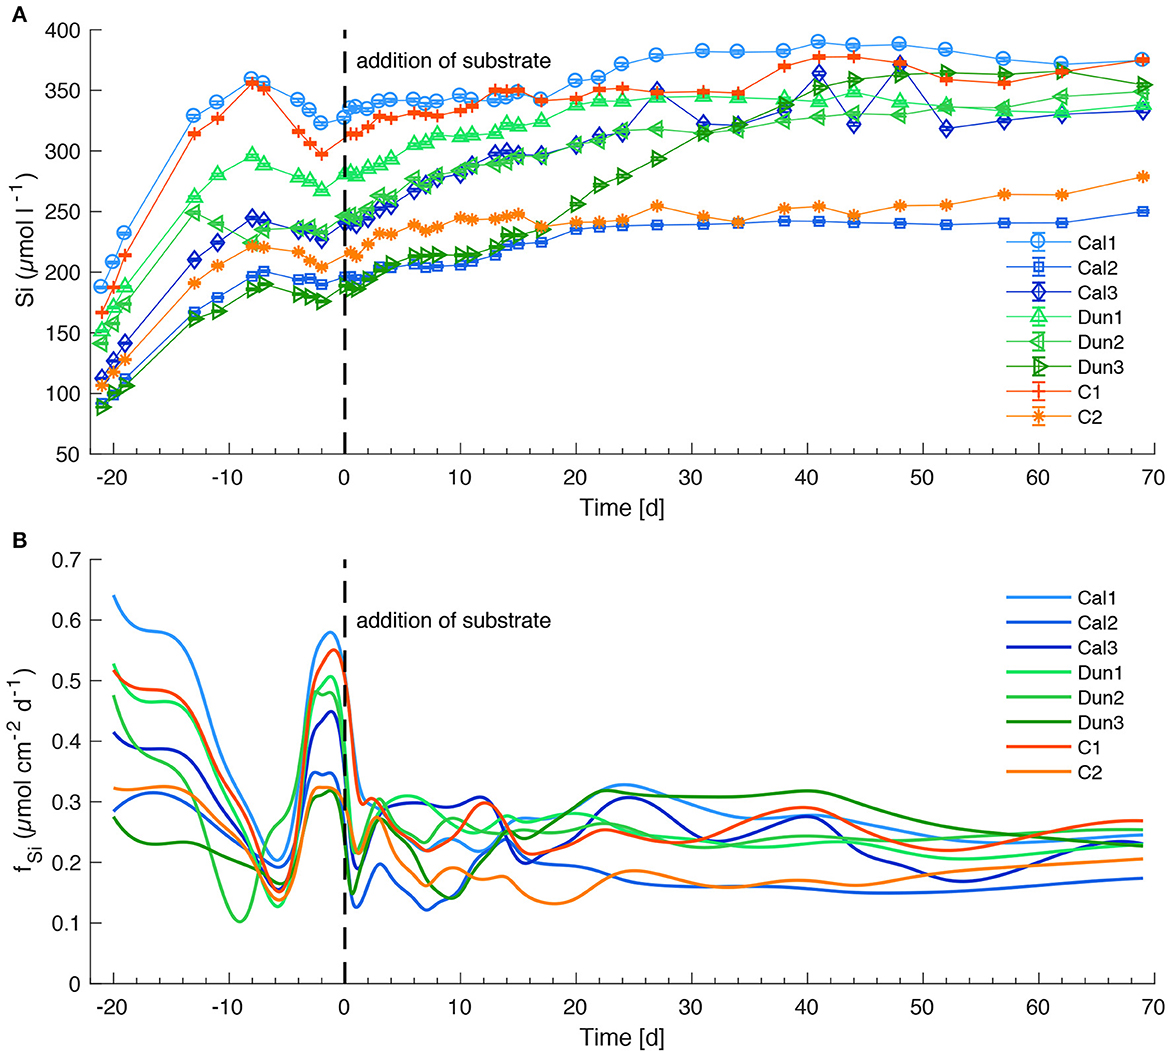
Figure 5. Si concentrations in bottom waters (A) and fluxes at the sediment surface (B) in all sediment cores. See Figure 4 for further information.
Dissolved calcium (Ca) concentrations showed more muted trends than TA fluxes, yet clearer trends than Si concentrations (Figure 6A). Ca concentrations decreased in all cores shortly before mineral addition and then showed an overall increase in all cores over the course of the experiment. The highest Ca concentrations were observed in those cores that also reached anomalously high TA values (C2, Dun3, Figures 4A, 6A). The addition of calcite led to an almost immediate increase in dissolved Ca fluxes (Figure 6B, Cal1–Cal3). Ca fluxes decreased after a few days and reached values in the range of 0.3–0.8 μmol cm−2 d−1 toward the end of the experiments for all calcite-treated cores. Interestingly a similar development of fluxes was observed in dunite treated cores.
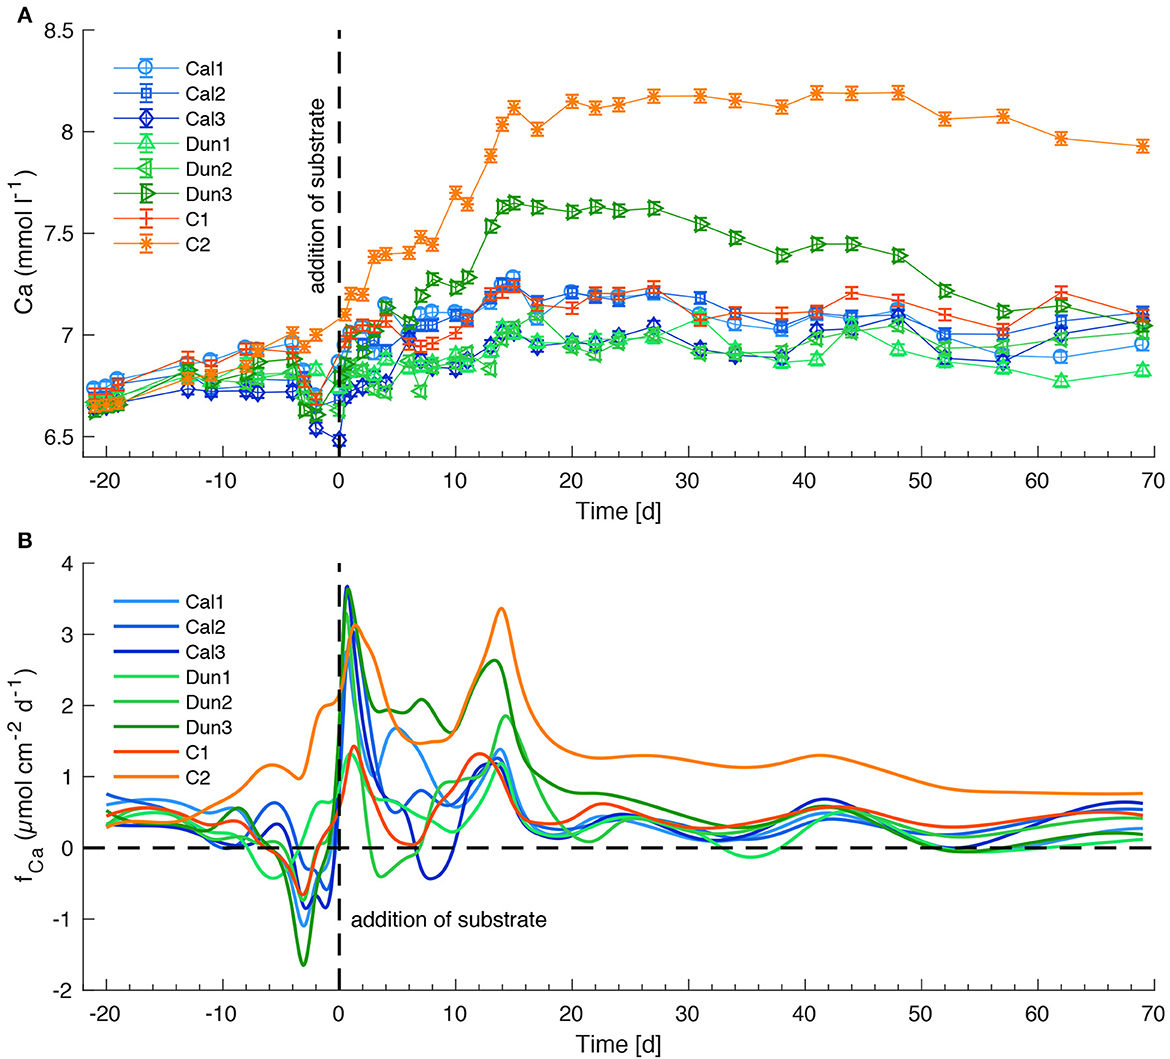
Figure 6. Ca concentrations in bottom waters (A) and fluxes at the sediment surface (B) in all sediment cores. See Figure 4 for further information.
Throughout the experiment, nickel concentrations stayed below detection limit (~0.2 μmol l−1) both in pore waters and in bottom waters (data not shown).
Oxygen concentrations in bottom waters (Supplementary Figure 2S) varied widely during the early stage of the experiment when oxygen was only supplied by diffusion across the air/water interface. The lowest concentrations were measured between day 2 and 3 in Cal2 and C1 (~90 μmol l−1). After bubbling the water column with ambient air directly in the liners, oxygen concentrations increased and stabilized around full saturation (~292 μmol l−1) in all cores. Higher values probably result from small gas bubbles stuck to the tip of the optode. Temporarily lower values occurred in Dun3 (~120 μmol l−1, day 69), Cal2 (day 1) and C2 (~90 μmol l−1, day 2).
Bottom water pH increased in all cores over the course of the experiment (Supplementary Figure 3S). The earliest and strongest increase occurred in C2 (pH 8.2 on day 15) and Dun3, in accordance with the high TA fluxes observed in these cores. Although pH remained at a high level in C2 (~8.15), it decreased in Dun3 after day 15 to values around 7.7. In the other cores, pH values fluctuated around 7.2–7.4 until the addition of substrates and the beginning of the bubbling of bottom waters. Subsequently, a strong increase to values around 7.9 was observed until day 15 that was most pronounced in the calcite treated cores and C1. The weakest increase was observed in Dun2 where pH reached values of ~7.75. After day 25, all cores (except C2 and Dun3) followed a rather similar trend of a slow pH increase. Final values ranged from 7.9 (Dun1) to 8.2 (C1).
3.5. Calculated properties of sediment cores over discrete time intervals
The assessment of the time intervals in each core reveals common trends in all cores except Dun3. Highest calcite dissolution potentials (Disspot, defined in Section 4.4) were observed toward the end of the experiment. The overall range of these values was between 0.0017 cm (Cal2, t3) and 3.8898 cm (C2, t8). pH values decreased in all cores over the course of the experiment, yet again with the exception of Dun3. Another common feature is the shallowing of the H2S front between 53.5 mm (Cal1, t1) and 11.0 mm (Dun3, t7). This decrease is not clear in all cores, however. The H2S fluxes varied over the course of the experiment, with a slight tendency toward lower values at the end of the experiment. TA and Ca fluxes varied with highest values around t2 in most cores. Si fluxes did not show any obvious time dependency.
3.6. Bacterial community compositions and bacterial shifts in treatments
Based on RNA-profiling of 16S rRNA genes, the active parts of the microbial communities of the different incubations were dominated by (i) phylogenetically distinct chemolithoautotrophic, sulfide oxidizing Gammaproteobacteria, primarily related to Beggiatoaceae (mostly Candidatus Parabeggiatoa and Candidatus Isobeggiatoa), Thiotrichaceae (uncultured), Ectothiorhodospiraceae (mostly Thiogranum) and Chromatiaceae, (ii) sulfate-reducing Desulfobacterota of the Desulfosarcinaceae and Desulfobulbaceae, (iii) members of the Planctomycetes, mostly heterotrophic Pirellulaceae (Rhodopirellula, Blastopirellula) and the Pla4 lineage as well as Cyanobacteria affiliated with Nostocaceae (Aphanizomenon) and Cyanobiaceae (Figure 7). Sulfurimonas sp. (Campylobacterota), hallmarked by versatile metabolisms (hydrogen, sulfur and nitrogen cycling) (Han and Perner, 2015), and the uncultured Sva0081 (Desulfobacteraceae), which has been suggested as important H2-scavenger in marine sediments (Dyksma et al., 2018), were abundant throughout the treatments (Figure 7). Cable bacteria associated with Candidatus Electrothrix were found in all incubations, albeit in low numbers (Figure 7). Maximum values at the beginning of the incubations were found in Cal1 (1.8%), Cal2 (3.6%), Dun2 (2.3%) and Dun3 (1.4%), and after 72 days of incubation in C2 (1.8%), Cal3 (2.2%), Dun1 (3.0%), Dun2 (1.8%) and Dun3 (1.6%) (Figure 7). Abundances of Candidatus Electrothrix in other cores were below 1%.
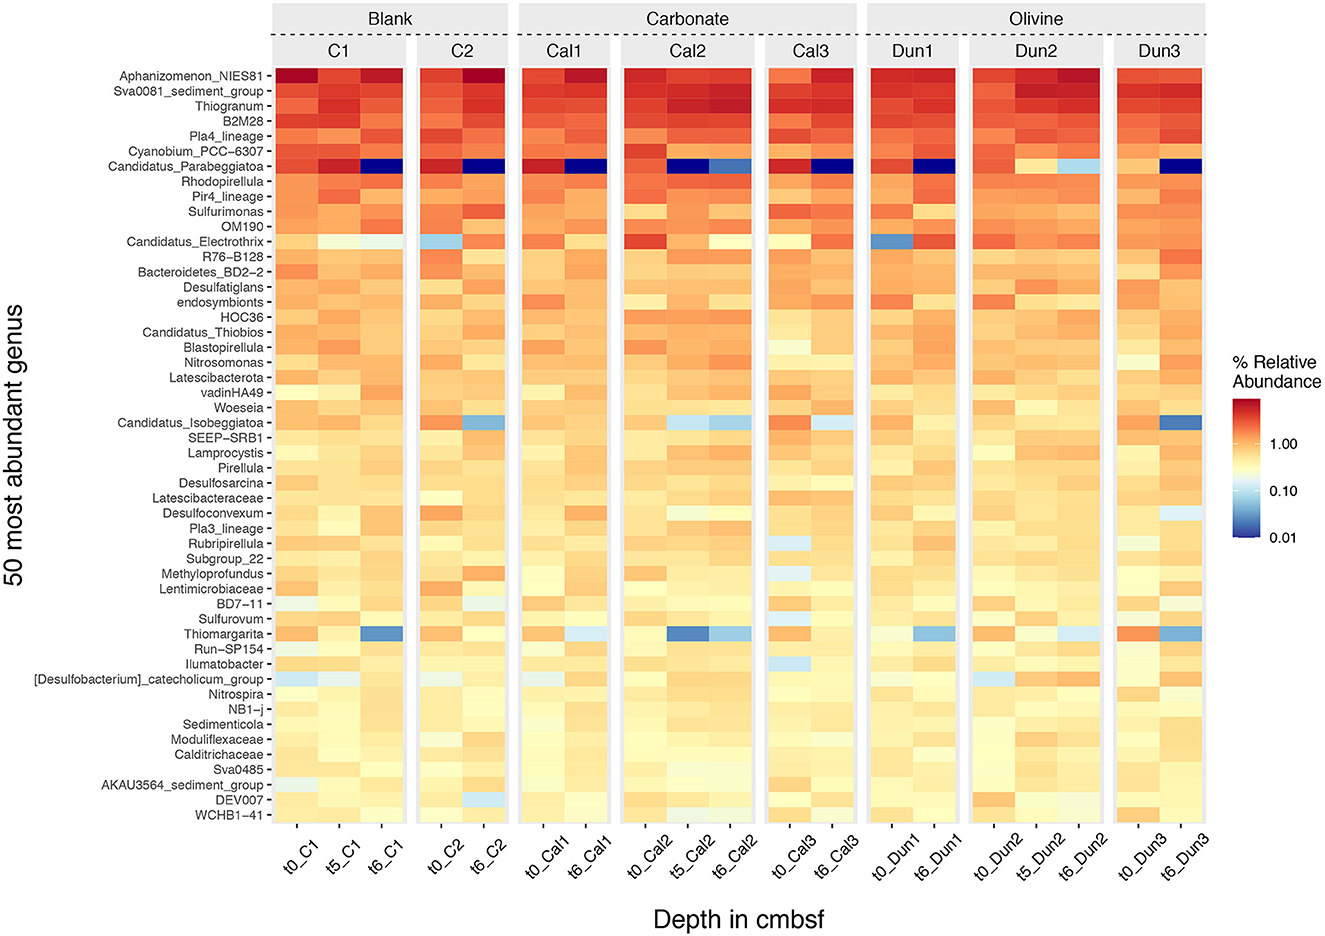
Figure 7. Heatmap of species abundances for the 50 most abundant genera. The name of the genus is shown on the left, the subsample time-point is shown at the bottom and the facet above indicates the treatment including controls (C1 and C2), carbonate (Cal1, Cal2, and Cal3) and olivine addition (Dun1, Dun2, and Dun3). The intensity of the color in the heatmap represents the abundance of each genus ranging from dark red to dark blue for high and low abundances, respectively.
4. Discussion
4.1. Robustness of experimental set-up and data
When interpreting results from laboratory experiments, it is instructive to scrutinize the set-up of the experiment for deviations from the natural system. Key considerations of potential importance for interpreting the results of this study include the following:
• The cores were recovered in January 2022 with bottom water temperatures of 6.9°C. For technical reasons, the laboratory temperature was 12.5°C. This temperature change accelerates chemical and biological processes and might lead to an overestimation of weathering rates and a rapid change in the biochemistry.
• During core recovery, the sediments are likely to be slightly disturbed, which is obviously highly important for assessing benthic weathering. An initially uneven sediment surface may later settle in the core liner due to gravity and bioturbation. This can lead to a spatial shift in the oxidation horizons and alter the oxygen exposer or availability in surface sediments. Acidification by oxidation and altered dissolution of minerals as well as a change in particulate organic matter (POM) degradation and microbial activity might be a consequence.
• After recovery, the cores were sealed with a rubber plug at the bottom. This cuts off geochemical gradients and fluxes from deeper sediment which will impact the chemical inventory of the sediment core over time and change availabilities of substrates educts for energy-yielding redox reactions and thus the microbial community.
• A low water through flow rate was applied in order to detect temporal changes in bottom water TA and other solutes that have a large seawater background. Accumulation or depletion of solutes in the bottom water will lead to artificial alteration of diffusive fluxes across the sediment-water interface and thus an underestimation of mineral dissolution rates.
• As a response to the large decrease in oxygen levels shortly after the beginning of the experiment, the bottom water was carefully bubbled with air. This reduced the calculated initial pCO2 from around 2,000 μatm at the beginning of the experiment to ~700 μatm after bubbling. Although 700 μatm is realistic for the natural system at certain times of year (Melzner et al., 2013), this led, combined with the accumulation of TA, to stronger oversaturation of bottom waters with respect to calcite than expected in the natural setting (Supplementary Figure 5S). In a natural system mineral dissolution might thus be higher.
• The last geochemical data point was obtained on day 69 after addition of substrates, whereas the final sampling of the cores took place on days 90–92. During this time, the fluxes and temperature varied largely due to technical problems. Thus, the final pore water data in the very upper centimeters might have been slightly altered over this period. The effect of this alteration is difficult to assess, but most likely relatively small.
• The pore water chemistry (except from micro profiles) for each core could only be examined at the end of the experiment. Thus, the comparison with initial conditions obtained from one reference core needs to be treated with caution.
• Maintaining near to in-situ bottom water conditions in the laboratory over the course of the experiment proved to be extremely challenging. Biogeochemical and physical alteration and artifacts could thus not be avoided.
A careful discussion of pore water alteration is essential when interpreting the results of laboratory experiments. In this study, several key considerations highlight the importance of assessing the potential deviations from the natural system. Despite these complexities, it is important to acknowledge that these challenges are inherent to studies involving such kind of laboratory experiments, and the data obtained from such experiments thus remain valuable and informative for understanding benthic weathering processes under experimental conditions.
4.2. Pore water nutrient shifts due to incubation and the impact on TA
The most striking change in pore water solutes was the loss of H2S and a concomitant increase of SO concentrations between the initially sampled core and the final sampling (Figures 1A, B). H2S production is mainly driven by the anaerobic oxidation of methane (AOM) and particulate organic carbon oxidation via SO reduction (POCSR) (Barnes and Goldberg, 1976; Froelich et al., 1979; Mark Jensen et al., 2003; Torres et al., 2020):
AOM:
POCSR:
Thus, both processes convert SO to H2S with the formation of 2 moles (AOM) and 2.28 moles (POCSR) of TA per mole of SO.
Since the concentration gradients of SO and H2S at the bottom of the initial core were close to zero (Figures 1A, B), a reduced H2S flux from deeper sediments as a consequence of plugging the bottom of the cores can be ruled out as an explanation for the lower final H2S concentrations compared to the initially sampled core. Toward the end of the experiment, the constant SO concentrations down to ~3 cm below the sediment surface point toward reduced POCSR, which is also observed in the lower NH concentrations (Figure 1D). This decrease is likely a consequence of a lack of supply of fresh POM during the incubation. The deeper penetration of SO and the lower H2S and TA concentrations below 3–5 cm could point toward lower POCSR, but the NH rather indicate little change from the initial POCSR. Thus, it appears that the production of H2S independently from SO was limited during the experiment. The most likely explanation is that the plug introduced at the bottom of the cores shut down the upward transport of methane (CH4) from deeper layers as described for Boknis Eck sediment e.g. by Maltby et al. (2018). This cutoff from CH4 supply would result in a decline in AOM rates below 20 cm where the AOM zone was likely situated. Considering the stoichiometry of AOM (Equation 7), this change allowed for a decrease in SO consumption and deeper SO penetration and a decline in dissolved H2S and TA production rates and concentrations at depth (Equation 7).
The apparently stronger decrease of H2S over time compared to the increase in SO may be a consequence of shifted Fe-H2S balance and a possibly stronger formation of FeS. Also, the elevated laboratory temperatures compared to initial in situ conditions can foster the formation of pyrite (Thiel et al., 2019). The decrease in H2S concentrations and flux to the upper layers of the sediment may have affected the microbial community and thus the experimental results.
In addition to reduced AOM, the lower TA values in deeper sediment can point toward authigenic formation of CaCO3. This is in line with lower Ca2+ concentrations in deeper sediments toward the end of the experiment (Figure 1F). This formation does not appear to be influenced by the treatment of the different cores, but is most likely a consequence of the increase in temperature during the incubation since CaCO3 solubility decreases with increasing temperature (Zeebe and Wolf-Gladrow, 2001).
4.3. Changes in pore water pH and possible explanations
Overall, the pH profiles of most sediment cores looked very similar at the start of the experiment and then evolved over time (Figure 3). Pore water pH is driven by a variety of oxidation and reduction processes which either release or consume protons. These processes are mainly driven by microbes that utilize the respective Gibbs free energy that the different chemical reactions yield (Fenchel and Jørgensen, 1977; Froelich et al., 1979).
Previous work has demonstrated that the pH profiles in the organic rich sediments of Boknis Eck are dominated by Fe3+ reduction coupled to H2S oxidation and subsequent Fe2+ oxidation via manganese oxide (MnO2) (Preisler et al., 2007). A suboxic zone between the H2S horizon and the maximum oxygen penetration depth (Table 2) is commonly observed in sediments inhabited by the filamentous H2S -oxidizing bacteria of the family Beggiatoacea that use nitrate to oxidize H2S via Dissimilatory Nitrate Reduction to Ammonium (DNRA) (Schulz and Jørgensen, 2001; Preisler et al., 2007):
These bacteria can store nitrate within their intracellular vacuoles and transport it down into the sediment, leading to the formation of a suboxic zone (Jørgensen and Nelson, 2004). H2S oxidation by Beggiatoa spp. is typically characterized by low pH values in the oxic zone and a clear peak around the H2S horizon (Jørgensen and Revsbech, 1983; Sayama et al., 2005). In most cores (except Dun3 and C1), this situation is reflected in the initial pH conditions at the beginning of the experiment (Figure 3) and the presence of Beggiatoa spp. is supported by bacterial 16S rRNA amplicon sequencing data (Figure 7 and Discussion Supplementary material S3.1).
Over time, though, in all cores except Dun3 and C2, the pH profile shifted toward a shape that was observed initially in Dun3 and C2, indicating a change in the predominant H2S oxidation pathway. Instead of decreasing, pH values increased in the upper millimeter of the sediment, peaking at around the maximum oxygen penetration depth (Figure 3 and Table 2). These maxima were situated above a very strong decrease in pH toward the lowest measured values of ~5.7 in core C2. The pH minima were observed slightly above the H2S horizon. The latter type of profile shape has previously been associated with the activity of cable bacteria (Nielsen et al., 2010; Malkin et al., 2014; Meysman et al., 2015). Like Beggiatoa spp., these bacteria oxidize H2S to SO, but in two spatially separated reactions, termed long-distance electron transfer (Nielsen et al., 2010; Risgaard-Petersen et al., 2012; Meysman et al., 2015):
Step one takes place around the H2S horizon. The electrons released are then transported upwards within the bacterial filaments to the oxic layer where step two takes place. Thus, per mole of H2S oxidized, 10 moles of protons are released in deeper sediments and 8 moles of protons are consumed in the oxic surface layer. The combination of these two processes would explain the pH peak at the surface and low pH values around the H2S horizon (Figure 3 and Table 2) (Malkin et al., 2014; Meysman et al., 2015, 2019). Thus, the pH profiles in cores Dun3 and C2 resemble profiles that would be generated by cable bacteria activity, but over time this activity appeared to cease, which is shown by the less pronounced surface peak and increasing pH values in pore waters. This hypothesis stands in contrast to the RNA-profiling data where, according to 16S rRNA gene proportions, cable bacteria, namely Candidatus Electrothrix increased in C2 and remained unchanged in Dun3 over time (Figure 7). Although the pH profiles of most incubations support increasing activity of cable bacteria over time of the experiments, we could not verify this by identifying increasing proportions of 16S rRNA genes from known cable bacteria. A detailed discussion on the microbial development is provided in the Supplementary material S3.1. With regards to the aims of this study, it is important to highlight that it cannot be resolved conclusively whether the changes in pore water pH are a naturally occurring feature or were induced by the laboratory incubation conditions. This will be considered for the evaluation of enhanced weathering in the further discussion.
4.4. Evaluation of enhanced and natural calcite weathering
The easiest approach to evaluate calcite dissolution is the assessment of bottom water concentrations of the weathering products (TA and Ca) and the respective fluxes via the sediment surface. Figures 4A, B indicate a slightly increased TA accumulation and elevated fluxes in cores Cal1 – Cal3 directly after the addition of calcite. These fluxes combined with elevated Ca concentrations and fluxes (Figures 6A, B) point toward dissolution in bottom waters during addition. Still, with regards to the overall experiment, there is no clear trend in Ca fluxes, or in TA fluxes or corresponding bottom water concentrations that could be attributed to a certain treatment. The reason for this observation is obviously the large inhomogeneity of the different cores with regards to pH values which are a major driver for calcite dissolution (Walter and Morse, 1985). In order to reliably quantify weathering processes in the different cores it is necessary to evaluate them under the geochemical conditions that foster or inhibit calcite dissolution during different time intervals (Table 2).
The rate of calcite dissolution is driven by saturation state with respect to calcite (Ωcal; Walter and Morse, 1985 and references therein). In this study, CO concentrations were calculated using measured pH and TA pore water values, leading to estimations of Ωcal:
where [Ca] and [CO] are the concentrations of calcium and carbonate, respectively, and Kscal is the solubility product of calcite at the respective salinity, temperature and pressure (Zeebe and Wolf-Gladrow, 2001). To provide temporal estimates of Ωcal, the initial and final values of TA and Ca were interpolated linearly for each depth layer. We recognize the obvious uncertainty associated with this approach and the following results should be interpreted with this in mind.
The total amount of calcite that can be dissolved is driven by the degree of undersaturation over the whole core. Since calcite only dissolves when ambient pore waters are undersaturated with respect to this mineral (Ωcal < 1), a dissolution potential [Disspot (cm)] was defined by integrating Ωcal over the region where undersaturation was observed:
where Ωcal(z) is the saturation state at depth z (cm) in the sediment. z(Ω < 1) and z(Ω>1) refer to depths where Ωcal values fall below 1 and above 1, respectively. Thus, Disspot combines the degree of undersaturation and the depth interval where undersaturation occurs (Figure 8).
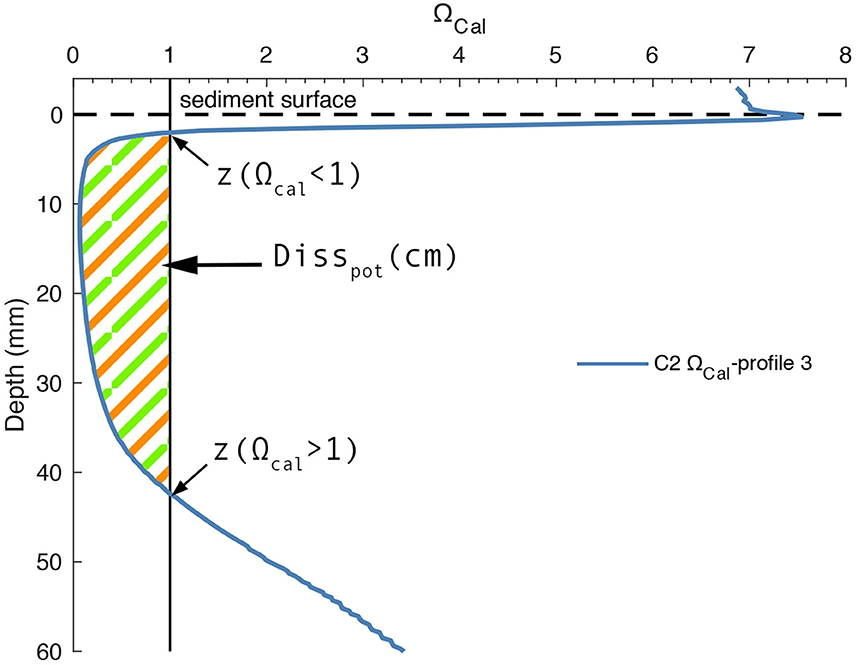
Figure 8. Illustrative example for calculation of Disspot on one representative profile (Profile 3, C2). Horizontal dashed line indicates sediment surface. Vertical solid line demarks ΩCal <1. Hatched area depicts the sediment depths where calcite can dissolve.
Disspot values depend on the dynamic interplay between pH and calcite dissolution. When CaCO3 dissolves in pore waters, the saturation state with respect to CaCO3 increases due the accumulation of weathering products. This has the effect of lowering Disspot. At the same time, a higher sedimentary flux of the weathering products to the bottom water should be observed. Consequently, Ca and TA fluxes together with Disspot values at a given time indicate how much calcite is being dissolved compared to how much calcite could be dissolved. The higher the calcite content of a sediment that bears a source of protons, the higher the ratio of Ca and TA fluxes to Disspot, the more effective is the dissolution process. The maximum dissolvable calcite content would then be indicated by high fluxes combined with Disspot values close to 0.
Highest Disspot values are associated with elevated TA and Ca fluxes during the discrete time intervals in cores C2 and Dun3 (Figures 9A, B). This clearly indicates that the natural inventory of calcium carbonate in the form of either calcite or aragonite (Figure 2) is being dissolved in corrosive pore waters. To disentangle these natural fluxes from enhanced fluxes induced by the addition of calcite, the pH profiles were compared to profiles obtained at Boknis Eck in situ under natural conditions (Preisler et al., 2007). At the time of sampling, these sediments were dominated by the activity of Beggiatoa spp. and were more similar to the initial profiles in e.g. Dun1 and Cal1. Therefore, based on these in situ profiles and Dun1 and Cal1 profiles, a realistic maximum value for Disspot was defined (dashed line in Figures 9A, B). This approach was chosen for because it only considers naturally observed and thus unambiguously realistic weathering regimes. In addition, not all cores showed extreme Disspot values. By considering time intervals with similar Disspot values, comparisons between different treatments are more justified.
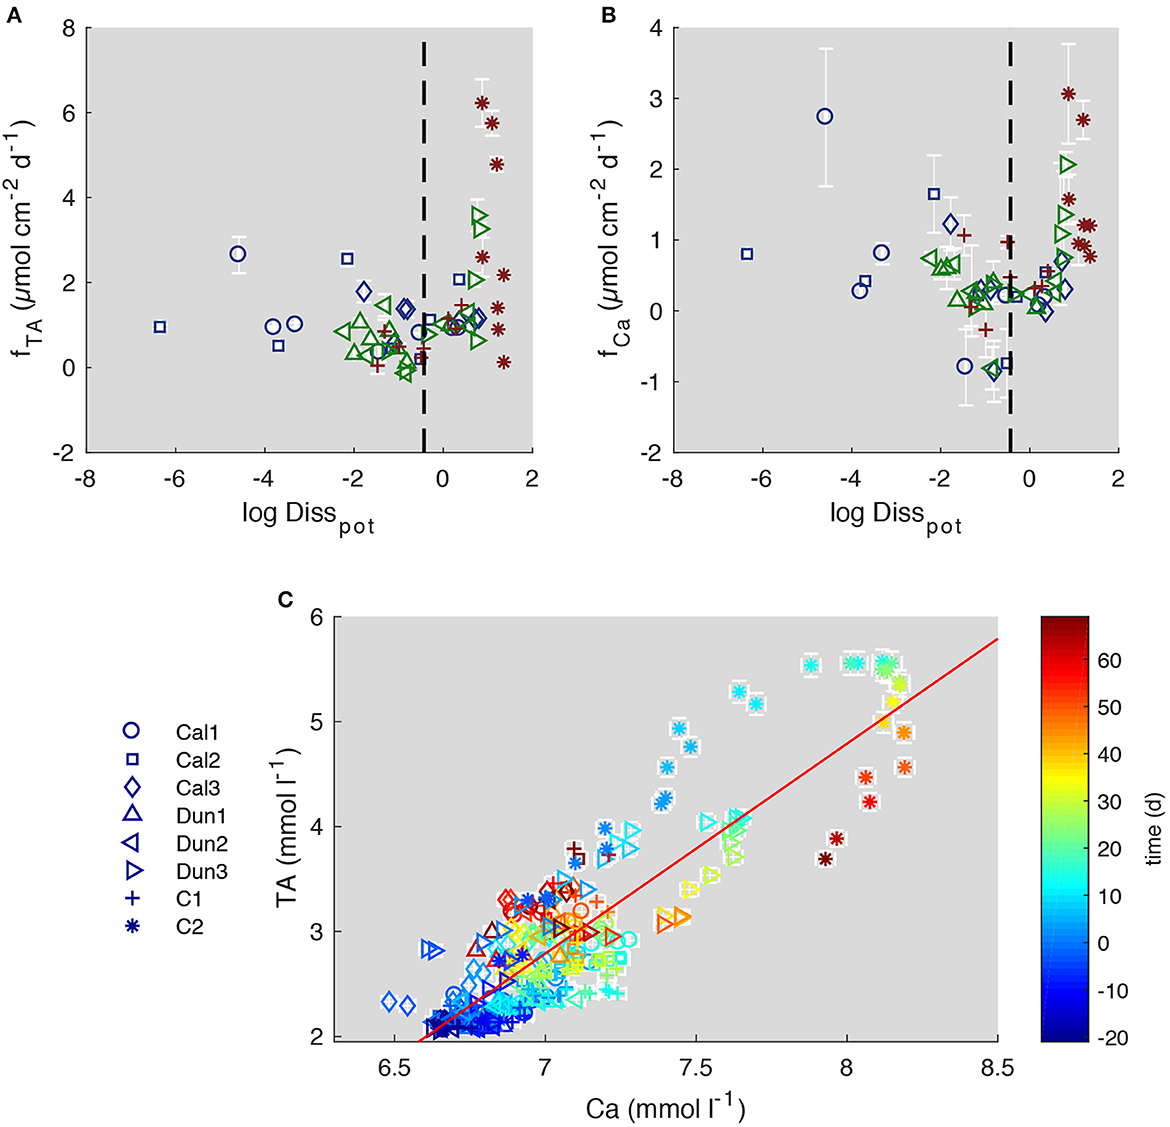
Figure 9. Comparison of Disspot to TA fluxes (A) and Ca fluxes (B) during discrete time intervals and Ca concentration to TA values over entire course of the experiment (C). Dashed lines in (A, B) indicate highest natural Disstot values. Red solid line (C) indicates a TA/Ca ratio of 2. Blue markers in (A, B) show values from calcite treated cores, green labels show dunite treated cores and red labels show control cores. Color coding in (C) indicates the time at which each sample was taken relative to addition of substrates. Error bars report 2SD.
For the evaluation of enhanced carbonate weathering, the fluxes of the different cores during time periods where Disspot was below this value were then averaged and compared (Table 3). This procedure excludes values obtained in C2, as in this core pH was very low over the entire course of the experiment. The results of the comparison show that TA fluxes were 0.961 ± 0.096 μmol cm−2 d−1 higher in calcite treated cores than in the control experiment. The ratio of FTA/FCa of 1.45 (Table 3) in the calcite treated cores is lower than the theoretical value of 2 (Equation 2), which points toward a loss of alkalinity which is not associated with Ca. We suggest that TA derived from CaCO3 dissolution was diminished by the oxidation of reduced species in the oxic surface sediment (Wallmann et al., 2008; Dale et al., 2011, 2021; Rassmann et al., 2020; Perner et al., 2022). The ΔFTA/ΔFCa values which represent the ratio of enhanced fluxes compared to the control experiment, though, are close to 2 (1.99), which would be the ratio expected for calcite dissolution. Hence, the additional fluxes were most likely induced by the addition of calcite to the sediment. Overall, it is important to acknowledge that the accumulation of weathering products in bottom waters and the low pCO2 have led to higher Ωcal values than expected in the natural system (Melzner et al., 2013). In more corrosive bottom waters the dissolution of calcite might be higher than observed in this study.
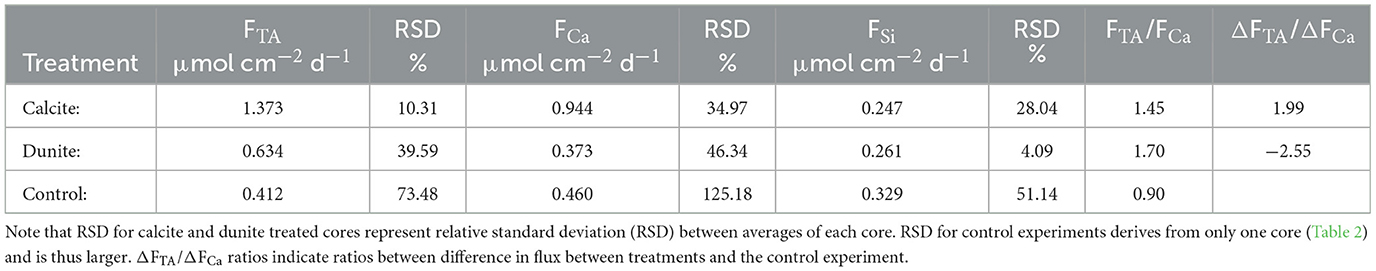
Table 3. TA, Ca and Si fluxes in different cores averaged over different treatments during comparable time steps.
To assess the suitability of weathering products as a proxy for mineral dissolution, TA and Ca concentrations in bottom waters were directly compared over the entire experiment (Figure 9C). The data clearly show that the ratio of TA/Ca is not always 2 (indicated by the thin red line, Figure 9C), as expected from equation 2. Instead, TA appears to increase before Ca concentrations. This is an especially well pronounced feature in C2 and Dun3, in which highest TA concentrations were observed during the early stage of the experiment. In the other cores this enhanced TA/Ca ratio was observed toward the end of the experiment (color coding in Figure 9C).
When comparing the different pH profiles in C2 and Dun3 (Figure 3), it is clear that very low values and subsequently high Disspot values dominated during the early stage of the experiment. During this time, the TA:Ca ratio in bottom waters is clearly higher than 2:1 (blue to green symbols in Figure 9C). In the other cores, similar conditions appeared later in the experiment (yellow to red symbols in Figure 9C). Since the low pH values presumably result from cable bacteria, their metabolism (Equations 9, 10) might lead to an altered TA/Ca ratio. The different diffusive coefficients of Ca2+ and HCO, which is the main contributor to TA, might alternatively be responsible for this effect, as DCa < DHCO3 (Boudreau, 1997). This might also explain why the ratio of TA/Ca decreased in C2 and Dun3 toward the end of the experiment. Along with the higher consistency of measured TA values and calculated fluxes, this suggests that a combination of TA and Ca may be the best way to assess weathering efforts, even though TA is the main driver for CO2 uptake in the surface ocean (Wolf-Gladrow et al., 2007) and thus of more relevance with respect to CDR studies.
4.5. Strong background fluxes disguise olivine dissolution
Dunite is an igneous rock with an olivine content of over 90% (Hochstetter, 1859) and displays rapid dissolution rates in seawater (Wolff-Boenisch et al., 2006; Rimstidt et al., 2012; Rigopoulos et al., 2018; Fuhr et al., 2022). Assuming that dunite dissolution represents olivine dissolution, the rate can be described as a function of temperature and pH (Rimstidt et al., 2012):
where rol is the dissolution rate given in mol m−2 s−1, T is temperature in K. In the temperature and pH range of this study, a pH increase from 7 to 8 would lead to an identical 55% decrease in rate as a theoretical temperature change from 12.5 to 6.59°C. Thus, the pH changes observed in our experiment (Figure 3) must play an important role for olivine dissolution.
The chemical process of olivine dissolution ought to lead to an accumulation of magnesium (Mg2+), Si and TA (Equation 1). The high Mg background of ~32 mmol l−1 in seawater at Boknis Eck prevents detection of the additional Mg due to analytical precision (±2%). Hence, the candidate proxies for detecting olivine dissolution are Si and TA concentrations. However, Si concentrations and fluxes over entire course of the experiment showed no trends between the differently treated cores (Figure 5). TA concentrations and fluxes (Figures 4A, B) slightly increased directly after the addition of dunite in Dun1 and Dun2, pointing toward olivine dissolution (Fuhr et al., 2022). Since Dun3 was dominated by CaCO3 dissolution in the early stage of the experiment, the TA fluxes from olivine dissolution in this core were strongly overprinted.
Pore water pH values were compared to Si fluxes averaged for each time step (Figure 10). A slightly lower gradient of the linear regression between pH and Si fluxes in cores treated with dunite might be interpreted as increased contribution from olivine dissolution for lower pH values. Still, the correlation for all cores is weak (R2 values between 0.241 and 0.072). Overall, the increase in Si flux with higher pH values in all cores points toward dissolution of either siliceous detrital material or biogenic debris such as diatomaceous frustules that are highly abundant in Baltic Sea sediments (Lewin, 1961; Gasiunaite et al., 2005). These processes result in a high background signal that overprinted Si contribution by olivine weathering at lower pH values.
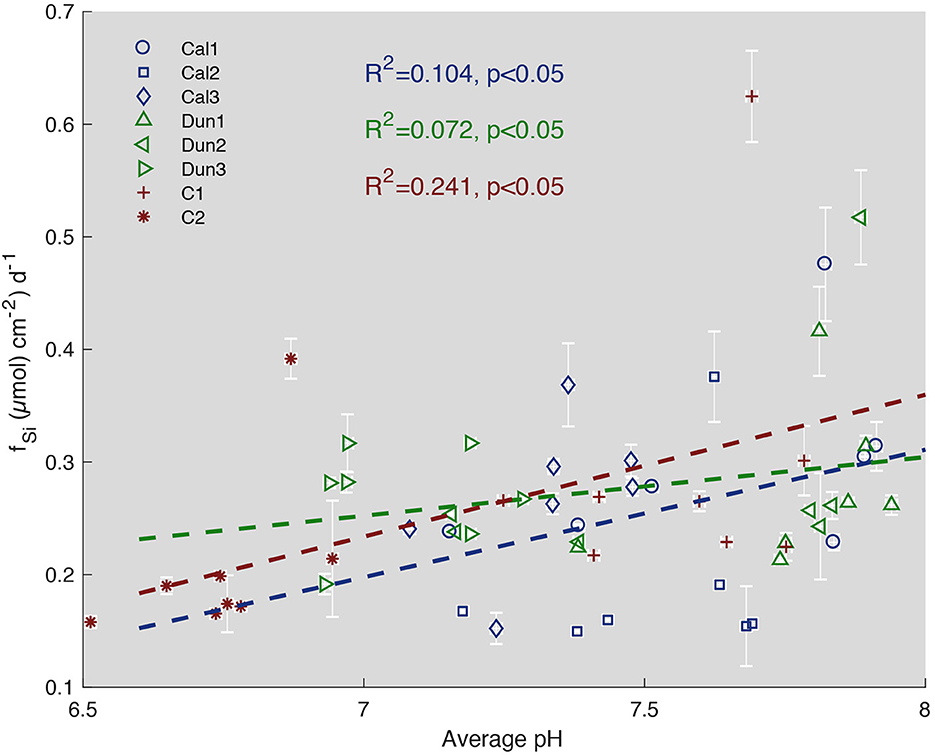
Figure 10. Cumulated Si fluxes via the sediment surface for each time step defined in Table 3 vs. pH in pore waters. Blue symbols represent calcite treated cores, green symbols show dunite treated cores and red symbols represent controls. Dashed lines show linear correlations for each treatment. R2 values represent the fit of each correlation. Error bars represent SD.
When comparing the different treatments during comparable time intervals (Table 3), cores treated with dunite showed slightly enhanced TA fluxes (0.634 μmol cm−1. d−1) compared to the control experiment (0.412 μmol cm−1. d−1). The very large standard deviations of 40 % and 73 %, though, diminish the significance of these data. Overall, the data does not allow for olivine dissolution to be evaluated in the experiment neither qualitatively nor quantitatively using these proxies.
Dissolved nickel, which was proposed as a dissolution proxy by Montserrat et al. (2017), was below detection limit (~0.2 μmol l−1) in all samples. Consequently, although it cannot serve as a dunite dissolution tracer, it can likely be excluded as a possible toxic threat to fauna (Flipkens et al., 2021) in the current benthic environment. Likewise, the formation of secondary mineral formation associated with olivine weathering (Fuhr et al., 2022) cannot be resolved based on the present data set.
4.6. Challenges for attribution
Marine alkalinity enhancement via enhanced weathering at the seabed requires monitoring to quantify rates of mineral dissolution and alkalinity production and ultimately the uptake flux of atmospheric CO2 in the ocean induced by deliberate mineral addition. To this end, a methodology needs to be established and suitable tracers have to be defined that allow for a reliable quantification of mineral dissolution rates.
Dissolved Si would be a suitable tracer to quantify dissolution rates of olivine and other reactive silicate minerals added to the seabed. However, our experimental data clearly show that benthic Si fluxes are dominated by the dissolution of biogenic opal and other sedimentary Si phases such that olivine dissolution rates could not be quantified using this tracer. Since biogenic opal produced by diatoms and other siliceous plankton is deposited and dissolved in almost all coastal and shelf sediments (Tréguer et al., 2021), the attribution problems that were encountered during this study will very likely also emerge during field experiments and large-scale application of benthic marine alkalinity enhancement. It may be possible to solve this attribution problem using stable Si isotopes (δ30Si) since biogenic opal and detrital silicate minerals have distinct isotopic compositions such that benthic fluxes induced by the dissolution of these separate phases can be differentiated (Geilert et al., 2020). Future work should, hence, test whether δ30Si may be a suitable tracer of the dissolution of deliberately added silicate minerals.
Dissolved Ca could be used to quantify dissolution rates of carbonates (calcite, aragonite) added to the seabed. Data obtained in this study indicate that this may be possible but that the interpretation of benthic Ca flux data is complicated by the dissolution of calcite delivered by coastal and seabed erosion in the study area (Wallmann et al., 2022). Similar problems may arise in other coastal and shelf settings where carbonate minerals produced by erosion and calcareous plankton are deposited and dissolved at the seabed. Since the stable isotopic composition of Ca and Sr bound in natural and deliberately added carbonate minerals may differ (Teng et al., 2021), employing these isotope tracers (e.g. δ44/40Ca, δ88/86Sr) might improve attribution.
According to our experimental results, TA may be the most suitable tracer to quantify the dissolution of alkaline minerals (olivine, calcite) added to the seabed. However, large TA fluxes were not only induced by the dissolution of added minerals but also by the dissolution of naturally-occurring carbonate minerals. Moreover, observed TA was likely consumed via H2S and iron oxidation. The resulting benthic TA fluxes were, hence, strongly modulated by microbially catalyzed redox reactions and very sensitive to shifts in the microbial community (primarily Beggiatoa spp. vs. other microbes including cable bacteria). Since these TA-producing and consuming microbial metabolisms occur in all coastal and shelf sediments (Boudreau, 1997), attribution problems will also arise in field experiments and applications. Attribution of TA fluxes to the dissolution of added alkaline mineral will, therefore, only be possible after accounting for highly dynamic natural TA background fluxes that can change on seasonal and shorter time scales in most benthic environments (Dale et al., 2013). Overall, the difficulties encountered with attribution will subsequently complicate monitoring, reporting and verification (MRV) in a possible field application scenario.
5. Summary, conclusion and outlook
This study presents results from an incubation of organic-rich sediment cores recovered from Boknis Eck in Eckernförde Bay where dunite and calcite were added to assess the potential for benthic alkalinity enhancement. The incubation of the cores and lack of methane flux from deeper sediments led to a reduction of AOM, which altered the H2S inventory in pore waters. Additionally, the precipitation of authigenic carbonates was indicated by reduced TA and Ca concentrations in pore waters toward the end of the experiment. These alterations and the decline in upward H2S fluxes may have led to a shift of pH profiles formed by the activity of Beggiatoa spp. to profiles associated with the activity of cable bacteria. The altered pH values in pore waters changed the saturation state with respect to calcite (Ωcal). In order to evaluate the enhanced weathering in dunite (olivine) and calcite treated cores, the experimental results were split into several time steps. The comparison of time intervals with similar chemical conditions suggests that TA fluxes were significantly increased by the addition of calcite and that TA currently appears to be the best proxy for evaluating enhanced weathering of calcite, and the most relevant variable for understanding CO2 uptake from the atmosphere. The increase in TA fluxes following the addition of dunite was too small to be resolved with available proxies due to high background fluxes. The possible formation of secondary minerals induced by olivine weathering could not be resolved.
The experiments were conducted in the laboratory under conditions that were as similar as possible to those in the field during the time of sampling (winter season). However, temperature, oxygen levels and the pCO2 of bottom water can vary largely over the annual cycle in Boknis Eck (Melzner et al., 2013). In order to understand the weathering behavior of both calcite and dunite (olivine) under natural conditions, it would thus be necessary to conduct further experiments, such as incubations under anoxic to hypoxic conditions and long-term experiments that reflect the weathering behavior under more natural conditions. Experiments in benthocosms might have the potential to reflect natural conditions at least with regards to temperature, bottom water pH, sediment heterogeneity and POC availability. Still, the fluxes from deeper sediments would still be difficult to capture realistically. Field experiments and stable isotope tracers may help to better understand the effect and the impact of enhanced benthic weathering as a CDR measure for climate change mitigation.
Data availability statement
The data presented in the study are deposited at the Sequence Read Archive (SRA) of the National Center for Biotechnology Information (NCBI) under the BioProject PRJNA988924 repository, accession numbers SAMN36035013 to SAMN36035020 and SAMN37271069 to SAMN37271133 (Supplementary Table 3S).
Author contributions
SG designed the study. MF and ID conducted the experiment. HTK helped with pH measurements. SS supervised micro profiling and data logging. AWD advised and supported lab procedures. KW helped with discussions. MS helped with the experimental set-up and sensoring. MP supervised molecular biology work and interpreted 16S sequencing data. SB performed bioinformatics analyses and helped with interpreting 16S sequencing data. MF wrote the manuscript. All authors contributed to editing the manuscript. All authors contributed to the article and approved the submitted version.
Funding
This study was funded by the Bundesministerium für Bildung und Forschung (BMBF) (Project RETAKE, awarded to SG) in the framework of the Deutsche Allianz für Meeresforschung (DAM) mission CDRmare.
Acknowledgments
We would like to thank Anke Bleyer (GEOMAR), Bettina Domeyer (GEOMAR), Gabriele Schüßler (GEOMAR), Regina Surberg (GEOMAR), and Ronny Baaske (GEOMAR) for their help with technical and analytical procedures in the laboratory, Antje Beck for her tremendous support during the experimental set-up and Diana Vasquez Gardenas for fruitful discussions, and the crew of FK Littorina for their support during recovery of sediment cores and the technical support from the Technik- und Logistikzentrum (TLZ) at GEOMAR.
Conflict of interest
The authors declare that the research was conducted in the absence of any commercial or financial relationships that could be construed as a potential conflict of interest.
Publisher's note
All claims expressed in this article are solely those of the authors and do not necessarily represent those of their affiliated organizations, or those of the publisher, the editors and the reviewers. Any product that may be evaluated in this article, or claim that may be made by its manufacturer, is not guaranteed or endorsed by the publisher.
Supplementary material
The Supplementary Material for this article can be found online at: https://www.frontiersin.org/articles/10.3389/fclim.2023.1245580/full#supplementary-material
References
Barnes, R. O., and Goldberg, E. D. (1976). Methane production and consumption in anoxic marine sediments. Geology 4, 297–300. doi: 10.1130/0091-7613(1976)4<297:MPACIA>2.0.CO;2
Béarat, H. J, McKelvy, M. V. G, Chizmeshya, A., Gormley, D., et al. (2006). Carbon sequestration via aqueous olivine mineral carbonation: role of passivating layer formation. Environ. Sci. Technol. 40, 4802–4808. doi: 10.1021/es0523340
Beuttler, C., Charles, L., and Wurzbacher, J. (2019). The role of direct air capture in mitigation of anthropogenic greenhouse gas emissions. Front. Clim. 1, 10. doi: 10.3389/fclim.2019.00010
Bohlen, L., Dale, A. W., Sommer, S., Mosch, T., Hensen, C., Noffke, A., et al. (2011). Benthic nitrogen cycling traversing the Peruvian oxygen minimum zone. Geochim. Cosmochim. Acta 75, 6094–6111. doi: 10.1016/j.gca.2011.08.010
Böhnke, S., Sass, K., Gonnella, G., Diehl, A., Kleint, C., Bach, W., et al. (2019). Parameters governing the community structure and element turnover in kermadec volcanic ash and hydrothermal fluids as monitored by inorganic electron donor consumption, autotrophic CO2 fixation and 16S tags of the transcriptome in incubation experiments. Front. Microbiol. 10, 2296. doi: 10.3389/fmicb.2019.02296
Bokulich, N. A., Kaehler, B. D., Rideout, J. R., Dillon, M., Bolyen, E., Knight, R., et al. (2018). Optimizing taxonomic classification of marker-gene amplicon sequences with QIIME 2′s q2-feature-classifier plugin. Microbiome 6, 90. doi: 10.1186/s40168-018-0470-z
Bolyen, E., Rideout, J. R., Dillon, M. R., Bokulich, N. A., Abnet, C. C., Al-Ghalith, G. A., et al. (2019). Reproducible, interactive, scalable and extensible microbiome data science using QIIME 2. Nat. Biotechnol. 37, 852–857. doi: 10.1038/s41587-019-0209-9
Borawska, Z., Szymczycha, B., Silberberger, M. J., Koziorowska-Makuch, K., Szczepanek, M., and Kedra, M. (2022). Benthic fluxes of dissolved silica are an important component of the marine Si cycle in the coastal zone. Estuar. Coast. Shelf Sci. 273, 107880. doi: 10.1016/j.ecss.2022.107880
Brunauer, S., Emmett, P. H., and Teller, E. (1938). Adsorption of gases in multimolecular layers. J. Am. Chem. Soc. 60, 309–319. doi: 10.1021/ja01269a023
Burton, E. A., and Walter, L. M. (1987). Relative precipitation rates of aragonite and Mg calcite from seawater: temperature or carbonate ion control? Geology 15, 111–114. doi: 10.1130/0091-7613(1987)15<111:RPROAA>2.0.CO;2
Callahan, B. J., McMurdie, P. J., Rosen, M. J., Han, A. W., Johnson, A. J. A., and Holmes, S. P. (2016). DADA2: High-resolution sample inference from Illumina amplicon data. Nat. Methods 13, 581–583. doi: 10.1038/nmeth.3869
Campbell, J. S., Foteinis, S., Furey, V., Hawrot, O., Pike, D., Aeschlimann, S., et al. (2022). Geochemical negative emissions technologies: part I. Review. Front. Clim. 4, 879133. doi: 10.3389/fclim.2022.879133
Caserini, S., Cappello, G., Righi, D., Raos, G., Campo, F., De Marco, S., et al. (2021). Buffered accelerated weathering of limestone for storing CO2: chemical background. Int. J. Greenh. Gas Control 112, 103517. doi: 10.1016/j.ijggc.2021.103517
Dale, A. W., Bertics, V. J., Treude, T., Sommer, S., and Wallmann, K. (2013). Modeling benthic–pelagic nutrient exchange processes and porewater distributions in a seasonally hypoxic sediment: evidence for massive phosphate release by Beggiatoa? Biogeosciences 10, 629–651. doi: 10.5194/bg-10-629-2013
Dale, A. W., Paul, K. M., Clemens, D., Scholz, F., Schroller-Lomnitz, U., Wallmann, K., et al. (2021). Recycling and burial of biogenic silica in an open margin oxygen minimum zone. Global Biogeochem. Cycles 35, e2020GB006583. doi: 10.1029/2020GB006583
Dale, A. W., Sommer, S., Bohlen, L., Treude, T., Bertics, V. J., Bange, H. W., et al. (2011). Rates and regulation of nitrogen cycling in seasonally hypoxic sediments during winter (Boknis Eck, SW Baltic Sea): sensitivity to environmental variables. Estuar. Coast. Shelf Sci. 95, 14–28. doi: 10.1016/j.ecss.2011.05.016
Dale, A. W., Sommer, S., Lomnitz, U., Bourbonnais, A., and Wallmann, K. (2016). Biological nitrate transport in sediments on the Peruvian margin mitigates benthic sulfide emissions and drives pelagic N loss during stagnation events. Deep. Res. Part I Oceanogr. Res. Pap. 112, 123–136. doi: 10.1016/j.dsr.2016.02.013
Dale, A. W., Sommer, S., Ryabenko, E., Noffke, A., Bohlen, L., Wallmann, K., et al. (2014). Benthic nitrogen fluxes and fractionation of nitrate in the Mauritanian oxygen minimum zone (Eastern Tropical North Atlantic). Geochim. Cosmochim. Acta 134, 234–256. doi: 10.1016/j.gca.2014.02.026
Dyksma, S., Pjevac, P., Ovanesov, K., and Mussmann, M. (2018). Evidence for H2 consumption by uncultured Desulfobacterales in coastal sediments. Environ. Microbiol. 20, 450–461. doi: 10.1111/1462-2920.13880
Fenchel, T. M., and Jørgensen, B. B. (1977). Detritus Food Chains of Aquatic Ecosystems: The Role of Bacteria BT - Advances in Microbial Ecology. Ed. M. (Alexander. Boston, MA: Springer US), 1–58.
Feng, E. Y., Koeve, W., Keller, D. P., and Oschlies, A. (2017). Model-based assessment of the CO2 sequestration potential of coastal ocean alkalinization. Earth's Futur. 5, 1252–1266. doi: 10.1002/2017EF000659
Flipkens, G., Blust, R., and Town, R. M. (2021). Deriving Nickel (Ni(II)) and Chromium (Cr(III)) based environmentally safe olivine guidelines for coastal enhanced silicate weathering. Environ. Sci. Technol. 55, 12362–12371. doi: 10.1021/acs.est.1c02974
Flipkens, G., Fuhr, M., Fiers, G., Meysman, F. J. R., Town, R. M., and Blust, R. (2023). Enhanced olivine dissolution in seawater through continuous grain collisions. Geochim. Cosmochim. Acta 359, 84–99. doi: 10.1016/j.gca.2023.09.002
Froelich, P. N., Klinkhammer, G. P., Bender, M. L., Luedtke, N. A., Heath, G. R., Cullen, D., et al. (1979). Early oxidation of organic matter in pelagic sediments of the eastern equatorial Atlantic: suboxic diagenesis. Geochim. Cosmochim. Acta 43, 1075–1090. doi: 10.1016/0016-7037(79)90095-4
Fuhr, M., Geilert, S., Schmidt, M., Liebetrau, V., Vogt, C., Ledwig, B., et al. (2022). Kinetics of olivine weathering in seawater: an experimental study. Front. Clim. 4, 831587. doi: 10.3389/fclim.2022.831587
Fuss, S., Lamb, W. F., Callaghan, M. W., Hilaire, J., Creutzig, F., Amann, T., et al. (2018). Negative emissions - part 2: costs, potentials and side effects. Environ. Res. Lett. 13, 063002. doi: 10.1088/1748-9326/aabf9f
Gasiunaite, Z. R., Cardoso, A. C., Heiskanen, A.-S., Henriksen, P., Kauppila, P., Olenina, I., et al. (2005). Seasonality of coastal phytoplankton in the Baltic Sea: influence of salinity and eutrophication. Estuar. Coast. Shelf Sci. 65, 239–252. doi: 10.1016/j.ecss.2005.05.018
Geilert, S., Grasse, P., Doering, K., Wallmann, K., Ehlert, C., Scholz, F., et al. (2020). Impact of ambient conditions on the Si isotope fractionation in marine pore fluids during early diagenesis. Biogeosciences 17, 1745–1763. doi: 10.5194/bg-17-1745-2020
Han, Y., and Perner, M. (2015). The globally widespread genus Sulfurimonas: versatile energy metabolisms and adaptations to redox clines. Front. Microbiol. 6, 989. doi: 10.3389/fmicb.2015.00989
Hartmann, J., and Kempe, S. (2008). What is the maximum potential for CO 2 sequestration by “stimulated” weathering on the global scale? Naturwissenschaften 95, 1159–1164. doi: 10.1007/s00114-008-0434-4
Hartmann, J., Suitner, N., Lim, C., Schneider, J., Marín-Samper, L., Arístegui, J., et al. (2023). Stability of alkalinity in ocean alkalinity enhancement (OAE) approaches – consequences for durability of CO2 storage. Biogeosciences 20, 781–802. doi: 10.5194/bg-20-781-2023
Hochstetter, F. v. (1859). Lecture on the geology of the Province of Nelson. New Zeal. Governemt Gaz. 7, 90–102.
Iizuka, A., Fujii, M., Yamasaki, A., and Yanagisawa, Y. (2004). Development of a new CO2 sequestration process utilizing the carbonation of waste cement. Ind. Eng. Chem. Res. 43, 7880–7887. doi: 10.1021/ie0496176
IPCC (2018). “Summary for policymakers” In: Global Warming of 1.5°C. An IPCC Special Report on the impacts of global warming of 1.5°C above pre-industrial levels and related global greenhouse gas emission pathways, in the context of strengthening the global response to. Cambridge University Press 3–24. doi: 10.1017/9781009157940.001
IPCC (2021). “Climate change 2021: the physical science basis” in Contribution of Working Group I to the Sixth Assessment Report of the Intergovernmental Panel on Climate Change. V.P. Masson-Delmotte, A. Zhai, S.L. Pirani, C. Connors, S. Péan, N. Berger, Y. Caud (Chen: Cambridge University Press).
Ivanenkov, V. N., and Lyakhin, Y. I. (1978). Determination of the alkalinity of seawater. methods hydrochem. Stud. Ocean 110–115.
Jeroschewski, P., Steuckart, C., and Kühl, M. (1996). An amperometric microsensor for the determination of H2S in aquatic environments. Anal. Chem. 68, 4351–4357. doi: 10.1021/ac960091b
Jørgensen, B., and Revsbech, N. (1983). Colorless sulfur bacteria, Beggiatoa spp. and Thiovulum spp., in O2 and H2S microgradients. Appl. Environ. Microbiol. 45, 1261–1270. doi: 10.1128/aem.45.4.1261-1270.1983
Jørgensen, B. B., and Nelson, D. C. (2004). Sulfide oxidation in marine sediments: Geochemistry meets microbiology” In Sulfur Biogeochemistry - Past and Present. Eds. J. P. Amend, K. J. Edwards, T. W. Lyons, (Boulder, CO: Geological Society of America).
King, H., and Plümper, O., and Putnis, A. (2010). Effect of secondary phase formation on the carbonation of olivine. Environ. Sci. andamp; Technol. 44, 6503–6509. doi: 10.1021/es9038193
Klindworth, A., Pruesse, E., Schweer, T., Peplies, J., Quast, C., Horn, M., et al. (2013). Evaluation of general 16S ribosomal RNA gene PCR primers for classical and next-generation sequencing-based diversity studies. Nucleic Acids Res. 41, e1–e1. doi: 10.1093/nar/gks808
Lackner, K. S. (2003). A guide to CO2 sequestration. Science 300, 1677–1678. doi: 10.1126/science.1079033
Lal, R. (2004). Soil carbon sequestration to mitigate climate change. Geoderma. 123, 1–22. doi: 10.1016/j.geoderma.2004.01.032
Lein, A. Y. (2004). Authigenic carbonate formation in the ocean. Lithol. Miner. Resour. 39, 1–30. doi: 10.1023/B:LIMI.0000010767.52720.8f
Lennartz, S. T., Lehmann, A., Herrford, J., Malien, F., Hansen, H.-P., Biester, H., et al. (2014). Long-term trends at the Boknis Eck time series station (Baltic Sea), 1957–2013: does climate change counteract the decline in eutrophication? Biogeosciences 11, 6323–6339. doi: 10.5194/bg-11-6323-2014
Lewin, J. C. (1961). The dissolution of silica from diatom walls. Geochim. Cosmochim. Acta 21, 182–198. doi: 10.1016/S0016-7037(61)80054-9
Liu, C., Cui, Y., Li, X., and Yao, M. (2021). microeco: an R package for data mining in microbial community ecology. FEMS Microbiol. Ecol. 97, 255. doi: 10.1093/femsec/fiaa255
Malkin, S. Y., Rao, A. M. F., Seitaj, D., Vasquez-Cardenas, D., Zetsche, E.-M., Hidalgo-Martinez, S., et al. (2014). Natural occurrence of microbial sulphur oxidation by long-range electron transport in the seafloor. ISME J. 8, 1843–1854. doi: 10.1038/ismej.2014.41
Maltby, J., Steinle, L., Löscher, C. R., Bange, H. W., Fischer, M. A., Schmidt, M., et al. (2018). Microbial methanogenesis in the sulfate-reducing zone of sediments in the Eckernförde Bay, SW Baltic Sea. Biogeosciences 15, 137–157. doi: 10.5194/bg-15-137-2018
Mark Jensen, M., Thamdrup, B., Rysgaard, S., Holmer, M., and Fossing, H. (2003). Rates and regulation of microbial iron reduction in sediments of the Baltic-North Sea transition. Biogeochemistry 65, 295–317. doi: 10.1023/A:1026261303494
Melzner, F., Thomsen, J., Koeve, W., Oschlies, A., Gutowska, M. A., Bange, H. W., et al. (2013). Future ocean acidification will be amplified by hypoxia in coastal habitats. Mar. Biol. 160, 1875–1888. doi: 10.1007/s00227-012-1954-1
Meysman, F. J. R., Cornelissen, R., Trashin, S., Bonné, R., Martinez, S. H., van der Veen, J., et al. (2019). A highly conductive fibre network enables centimetre-scale electron transport in multicellular cable bacteria. Nat. Commun. 10, 4120. doi: 10.1038/s41467-019-12115-7
Meysman, F. J. R., and Montserrat, F. (2017). Negative CO2 emissions via enhanced silicate weathering in coastal environments. Biol. Lett. 13, 20160905. doi: 10.1098/rsbl.2016.0905
Meysman, F. J. R., Risgaard-Petersen, N., Malkin, S. Y., and Nielsen, L. P. (2015). The geochemical fingerprint of microbial long-distance electron transport in the seafloor. Geochim. Cosmochim. Acta 152, 122–142. doi: 10.1016/j.gca.2014.12.014
Millero, F. J., Plese, T., and Fernandez, M. (1988). The dissociation of hydrogen sulfide in seawater. Limnol. Oceanogr. 33, 269–274. doi: 10.4319/lo.1988.33.2.0269
Montserrat, F., Renforth, P., Hartmann, J., Leermakers, M., Knops, P., and Meysman, F. J. R. (2017). Olivine dissolution in seawater: implications for CO2 sequestration through enhanced weathering in coastal environments. Environ. Sci. Technol. 51, 3960–3972. doi: 10.1021/acs.est.6b05942
Moras, C. A., Bach, L. T., Cyronak, T., Joannes-Boyau, R., and Schulz, K. G. (2022). Ocean alkalinity enhancement – avoiding runaway CaCO3 precipitation during quick and hydrated lime dissolution. Biogeosciences 19, 3537–3557. doi: 10.5194/bg-19-3537-2022
Müller, J. D., Bastkowski, F., Sander, B., Seitz, S., Turner, D. R., Dickson, A. G., et al. (2018). Metrology for pH measurements in brackish waters-part 1: Extending electrochemical pHT measurements of TRIS buffers to salinities 5-20. Front. Mar. Sci. 5, 1–12. doi: 10.3389/fmars.2018.00176
Nielsen, L. P., Risgaard-Petersen, N., Fossing, H., Christensen, P. B., and Sayama, M. (2010). Electric currents couple spatially separated biogeochemical processes in marine sediment. Nature 463, 1071–1074. doi: 10.1038/nature08790
Nilsson, M. M., Kononets, M., Ekeroth, N., Viktorsson, L., Hylén, A., Sommer, S., et al. (2019). Organic carbon recycling in Baltic Sea sediments – an integrated estimate on the system scale based on in situ measurements. Mar. Chem. 209, 81–93. doi: 10.1016/j.marchem.2018.11.004
Oelkers, E. H. (2001). An experimental study of forsterite dissolution rates as a function of temperature and aqueous Mg and Si concentrations. Chem. Geol. 175, 485–494. doi: 10.1016/S0009-2541(00)00352-1
Pedregosa, F., Varoquaux, G., Gramfort, A., Michel, V., Thirion, B., Grisel, O., et al. (2011). Scikit-learn: Machine learning in Python. J. Mach. Learn. Res. 12, 2825–2830.
Perner, M., Wallmann, K., Adam-Beyer, N., Hepach, H., Laufer-Meiser, K., Böhnke, S., et al. (2022). Environmental changes affect the microbial release of hydrogen sulfide and methane from sediments at Boknis Eck (SW Baltic Sea). Front. Microbiol. 13, 1096062. doi: 10.3389/fmicb.2022.1096062
Pokrovsky, O. S., and Schott, J. (2000). Kinetics and mechanism of forsterite dissolution at 25°C and pH from 1 to 12. Geochim. Cosmochim. Acta 64, 3313–3325. doi: 10.1016/S0016-7037(00)00434-8
Pratt, K. W. (2014). Measurement of pHT values of Tris buffers in artificial seawater at varying mole ratios of Tris: Tris·HCl. Mar. Chem. 162, 89–95. doi: 10.1016/j.marchem.2014.03.003
Preisler, A., de Beer, D., Lichtschlag, A., Lavik, G., Boetius, A., and Jørgensen, B. B. (2007). Biological and chemical sulfide oxidation in a Beggiatoa inhabited marine sediment. ISME J. 1, 341–353. doi: 10.1038/ismej.2007.50
Price, M. N., Dehal, P. S., and Arkin, A. P. (2010). FastTree 2 – approximately maximum-likelihood trees for large alignments. PLoS ONE 5, e9490. doi: 10.1371/journal.pone.0009490
Quast, C., Pruesse, E., Yilmaz, P., Gerken, J., Schweer, T., Yarza, P., et al. (2013). The SILVA ribosomal RNA gene database project: improved data processing and web-based tools. Nucleic Acids Res. 41, D590–D596. doi: 10.1093/nar/gks1219
Rassmann, J., Eitel, E. M., Lansard, B., Cathalot, C., Brandily, C., Taillefert, M., et al. (2020). Benthic alkalinity and dissolved inorganic carbon fluxes in the Rhône River prodelta generated by decoupled aerobic and anaerobic processes. Biogeosciences 17, 13–33. doi: 10.5194/bg-17-13-2020
Renforth, P., and Henderson, G. (2017). Assessing ocean alkalinity for carbon sequestration. Rev. Geophys. 55, 636–674. doi: 10.1002/2016RG000533
Rigopoulos, I., Harrison, A. L., Delimitis, A., Ioannou, I., Efstathiou, A. M., Kyratsi, T., et al. (2018). Carbon sequestration via enhanced weathering of peridotites and basalts in seawater. Appl. Geochemistry 91, 197–207. doi: 10.1016/j.apgeochem.2017.11.001
Rimstidt, J. D., Brantley, S. L., and Olsen, A. A. (2012). Systematic review of forsterite dissolution rate data. Geochim. Cosmochim. Acta 99, 159–178. doi: 10.1016/j.gca.2012.09.019
Risgaard-Petersen, N., Revil, A., Meister, P., and Nielsen, L. P. (2012). Sulfur, iron-, and calcium cycling associated with natural electric currents running through marine sediment. Geochim. Cosmochim. Acta 92, 1–13. doi: 10.1016/j.gca.2012.05.036
Sayama, M., Risgaard-Petersen, N., Nielsen, L. P., Fossing, H., and Christensen, P. B. (2005). Impact of bacterial NO3– transport on sediment biogeochemistry. Appl. Environ. Microbiol. 71, 7575–7577. doi: 10.1128/AEM.71.11.7575-7577.2005
Schulz, H. N., and Jørgensen, B. B. (2001). Big bacteria. Annu. Rev. Microbiol. 55, 105–137. doi: 10.1146/annurev.micro.55.1.105
Sternbeck, J., and Sohlenius, G. (1997). Authigenic sulfide and carbonate mineral formation in holocene sediments of the baltic sea. Chem. Geol. 135, 55–73. doi: 10.1016/S0009-2541(96)00104-0
Subhas, A. V., Rollins, N. E., Berelson, W. M., Dong, S., Erez, J., and Adkins, J. F. (2015). A novel determination of calcite dissolution kinetics in seawater. Geochim. Cosmochim. Acta 170, 51–68. doi: 10.1016/j.gca.2015.08.011
Teng, F. Z., Watkins, J., and Dauphas, N. (2021). Non-Traditional Stable Isotopes. Chantilly: De Gruyter.
Thiel, J., Byrne, J. M., Kappler, A., Schink, B., and Pester, M. (2019). Pyrite formation from FeS and H2S is mediated through microbial redox activity. Proc. Natl. Acad. Sci. 116, 6897–6902. doi: 10.1073/pnas.1814412116
Torres, M. E., Hong, W.-L., Solomon, E. A., Milliken, K., Kim, J.-H., Sample, J. C., et al. (2020). Silicate weathering in anoxic marine sediment as a requirement for authigenic carbonate burial. Earth-Sci. Rev. 200, 102960. doi: 10.1016/j.earscirev.2019.102960
Tréguer, P. J., Sutton, J. N., Brzezinski, M., Charette, M. A., Devries, T., Dutkiewicz, S., et al. (2021). Reviews and syntheses: the biogeochemical cycle of silicon in the modern ocean. Biogeosciences 18, 1269–1289. doi: 10.5194/bg-18-1269-2021
Wallmann, K., Aloisi, G., Haeckel, M., Tishchenko, P., Pavlova, G., Greinert, J., et al. (2008). Silicate weathering in anoxic marine sediments. Geochim. Cosmochim. Acta 72, 2895–2918. doi: 10.1016/j.gca.2008.03.026
Wallmann, K., Diesing, M., Scholz, F., Rehder, G., Dale, A. W., Fuhr, M., et al. (2022). Erosion of carbonate-bearing sedimentary rocks may close the alkalinity budget of the Baltic Sea and support atmospheric CO2 uptake in coastal seas. Front. Mar. Sci. 9, 968069. doi: 10.3389/fmars.2022.968069
Walter, L. M., and Morse, J. W. (1985). The dissolution kinetics of shallow marine carbonates in seawater: a laboratory study. Geochim. Cosmochim. Acta. 49, 1503–1513. doi: 10.1016/0016-7037(85)90255-8
Wolff-Boenisch, D., Gislason, S. R., and Oelkers, E. H. (2006). The effect of crystallinity on dissolution rates and CO2 consumption capacity of silicates. Geochim. Cosmochim. Acta. 70, 858–870. doi: 10.1016/j.gca.2005.10.016
Wolf-Gladrow, D. A., Zeebe, R. E., Klaas, C., Körtzinger, A., and Dickson, A. G. (2007). Total alkalinity: the explicit conservative expression and its application to biogeochemical processes. Mar. Chem. 106, 287–300. doi: 10.1016/j.marchem.2007.01.006
Keywords: enhanced benthic weathering, carbon sequestration, dunite and carbonate dissolution, micro profiles, ocean alkalinity enhancement
Citation: Fuhr M, Wallmann K, Dale AW, Diercks I, Kalapurakkal HT, Schmidt M, Sommer S, Böhnke S, Perner M and Geilert S (2023) Disentangling artificial and natural benthic weathering in organic rich Baltic Sea sediments. Front. Clim. 5:1245580. doi: 10.3389/fclim.2023.1245580
Received: 23 June 2023; Accepted: 02 October 2023;
Published: 24 October 2023.
Edited by:
Carlos Paulo, SRK Consulting, CanadaReviewed by:
Xiaole Sun, Chinese Academy of Sciences (CAS), ChinaZach A. DiLoreto, University of Toronto Scarborough, Canada
Copyright © 2023 Fuhr, Wallmann, Dale, Diercks, Kalapurakkal, Schmidt, Sommer, Böhnke, Perner and Geilert. This is an open-access article distributed under the terms of the Creative Commons Attribution License (CC BY). The use, distribution or reproduction in other forums is permitted, provided the original author(s) and the copyright owner(s) are credited and that the original publication in this journal is cited, in accordance with accepted academic practice. No use, distribution or reproduction is permitted which does not comply with these terms.
*Correspondence: Michael Fuhr, mfuhr@geomar.de