


1. Introduction
The geochemical evolution of seawater and atmospheric CO2 over geological time is traditionally ascribed to processes such as continental weathering, volcanic degassing, seafloor spreading and carbonate accumulation at the seafloor (R. A. Berner & Kothavala, 2001; Holland, 2005; Walker et al., 1981; Wallmann, 2001). The chemical alteration of terrigenous particles in the marine realm is largely ignored in these standard models of ocean and climate change even though numerous studies suggest that riverine and other lithogenic particles react with seawater and are strongly altered in marine sediments (Mackenzie & Garrels, 1966; Michalopoulos & Aller, 1995; Wallmann et al., 2008). In this contribution, we aim to change this perspective by exploring how the marine alteration of terrigenous silicate minerals affects the composition of seawater and, potentially, global carbon cycling.
Terrigenous particles generated by physical erosion and chemical weathering of the upper continental crust (UCC) are transported to the ocean by rivers, ice and wind. Most of this material is delivered as riverine suspended matter (E. K. Berner & Berner, 2012). Suspended matter carried by rivers is usually depleted in cations compared to parent rocks due to chemical weathering processes (table 1). It does, however, contain eroded cation-rich silicate minerals such as feldspars that are not weathered on land but transported into the ocean (Müller et al., 2021). These primary minerals are partly dissolved in contact with seawater and release products such as dissolved silica, major cations and trace elements into the ocean (Jeandel & Oelkers, 2015). Most of the riverine particles are, however, deposited on the shelf and along continental margins where they form terrigenous sediments. Primary minerals (e.g., feldspars) are dissolved and altered in these deposits pending on ambient conditions (Aloisi et al., 2004; Kim et al., 2016; Maher et al., 2004, 2006; Scholz et al., 2013; Solomon et al., 2014; Torres et al., 2020; Wallmann et al., 2008). This reaction has been termed marine silicate weathering. It proceeds with the same overall stoichiometry as continental silicate weathering:
Primary minerals (e. g. , feldspars)+CO2→secondary minerals (e. g. , clays)+cations+HCO−3
Silicate weathering is an important sink for atmospheric CO2 that is converted into HCO3- during the dissolution of silicate minerals to maintain charge balance and compensate for the release of metal cations (Walker et al., 1981). Marine silicate weathering releases cations into the porewaters of marine sediments, produces authigenic clays and carbonates and converts CO2 into HCO3- (Wallmann et al., 2008). It is driven by metabolic CO2 that is released into porewaters by the microbial degradation of organic matter. It serves as a sink for atmospheric CO2 since CO2 fixed in biomass via photosynthesis is deposited at the seabed and transformed into seawater alkalinity (HCO3-) during the dissolution of cation-rich minerals. The rate of marine silicate weathering may be as high as the rate of continental silicate weathering such that this process may play an important role in the regulation of atmospheric CO2 on geological timescales (Wallmann et al., 2008; Wallmann & Aloisi, 2012).
Cation-depleted secondary minerals formed by continental and marine silicate weathering (e.g., gibbsite, kaolinite) react with biogenic opal delivered by the marine biological pump and dissolved cations to form cation-rich authigenic clays (Michalopoulos & Aller, 1995; Rahman et al., 2017):
Secondary minerals + biogenic opal + cations +HCO−3→ clay +CO2
This reaction has been termed reverse weathering because seawater cations are taken up in authigenic clays while HCO3- is converted into CO2. CO2 is released because cation-poor solids are converted into cation-rich clay minerals (e.g., smectite) during this process. It may, hence, act as an important source for atmospheric CO2 on geological timescales (Dunlea et al., 2017; Isson et al., 2020; Isson & Planavsky, 2018). Reverse weathering is also an important sink for seawater K, Li and Mg compensating for the riverine input of these dissolved elements into the ocean provided by terrestrial silicate weathering (Mackenzie & Garrels, 1966; Rude & Aller, 1989; Sillen, 1967; Stoffyn-Egli & Mackenzie, 1984).
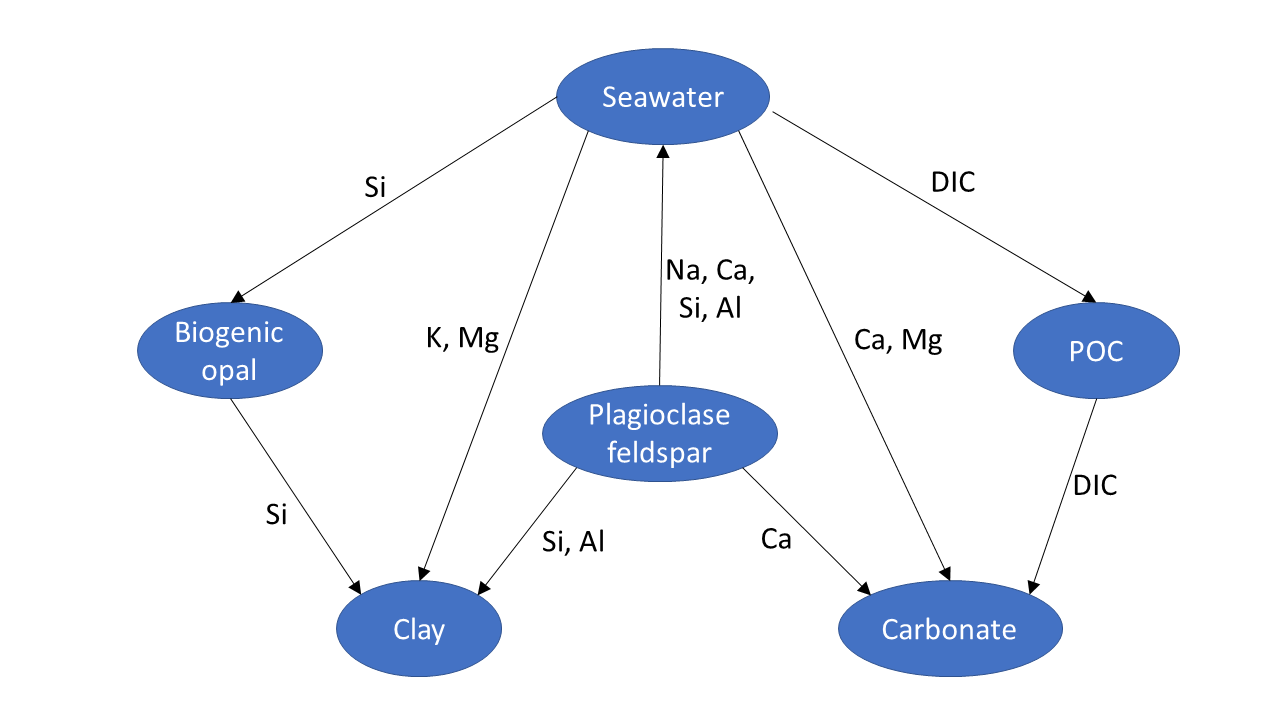
The net effect of these opposing reactions (eq 1 vs. eq 2) on seawater alkalinity and atmospheric CO2 is uncertain since the global rates of these processes are poorly constrained. A clear distinction between marine silicate weathering (eq 1) and reverse weathering (eq 2) is only possible by quantifying the cation contents of the dissolving phase (high cation content in eq. 1, low cation content in eq 2) and the cation contents of authigenic clays formed during these reactions. Authigenic clay formation is often ascribed to reverse weathering (eq 2) even though these minerals are also formed during marine silicate weathering (eq 1). It should, hence, be noted that clay formation only qualifies as reverse weathering if these reaction products contain more cations than the solid reactants. Moreover, both reactions can occur simultaneously in marine sediments. They are closely coupled because Al that is needed to form authigenic clays is usually provided by the dissolution of aluminosilicates (Geilert et al., 2023). The overall reaction is termed marine silicate alteration in the following text and is schematically presented in figure 1.

Plagioclase feldspar is used as example for primary silicates in figure 1 since this mineral group is very abundant in UCC (White, 1995) and dissolves rapidly during continental and marine silicate weathering (E. K. Berner & Berner, 2012; Gruber et al., 2019). Plagioclase dissolution provides Al and Si for authigenic clay formation and induces cation (Na, Ca) and Si release into ambient bottom waters. Cations bound in authigenic clays (K, Mg) are taken up from seawater while Si is provided by biogenic opal that is formed by siliceous plankton in the water column and dissolves in sediments. Carbonates are included in our scheme since a large fraction of the alkalinity formed during silicate weathering in anoxic subsurface sediments is fixed in these authigenic minerals (Torres et al., 2020; Wallmann et al., 2008). They may also serve as an important sink for dissolved inorganic carbon (DIC) on geological timescales (Schrag et al., 2013). DIC bound in these carbonates largely originates from marine particulate organic carbon (POC) that is formed in the water column and degraded in sediments.
The effect of marine silicate alteration on seawater alkalinity (TA) can be estimated considering benthic fluxes of cations across the sediment-water interface. These fluxes are induced by cation release from dissolving silicate minerals and cation uptake in authigenic phases:
Benthic TA flux=cation release flux−cation uptake flux
A positive TA flux results when cation release exceeds cation uptake on equivalent basis (marine silicate weathering) while a negative TA flux indicates alkalinity loss induced by net cation uptake (reverse weathering). This balance is used in the following text to evaluate the effects of marine silicate alteration on seawater TA. It should be noted that other diagenetic processes such as pyrite burial and dissolution of pelagic carbonates in surface sediments are not considered in this alkalinity balance ever though they induce significant benthic TA fluxes (Krumins et al., 2013; Middelburg et al., 2020). We employ this simple approach because our contribution focusses on the cation release and uptake during marine silicate alteration rather than general sediment diagenesis.
In the following, we do not only present new insights into marine silicate alteration but review all chemical interactions between riverine particles and seawater that induce changes in the chemical composition of seawater. We start our journey by presenting the mean chemical composition of riverine particles entering the ocean. We then estimate global rates of cation exchange and silicate mineral dissolution in seawater. Subsequently, we investigate alteration processes in marine sediments considering marine silicate weathering, reverse weathering and authigenic carbonate formation. Finally, we estimate global cation and dissolved silica fluxes induced by these processes and evaluate the effects of marine silicate alteration on concentrations of major cations and alkalinity in seawater. We show that marine silicate weathering (eq 1) and reverse weathering (eq 2) are strongly coupled and proceed at similar rates such that the alteration of riverine particles has no significant net effect on seawater alkalinity but strongly affects the major cation composition of seawater.
2. Global riverine particle flux and chemical composition of suspended riverine particles entering the ocean
Terrigenous particles generated by physical erosion and chemical weathering of the upper continental crust (UCC) are transported to the ocean by rivers, ice and wind. Most of this material is delivered by rivers that transported about 15 x 1015 g yr-1 of suspended matter into the ocean prior to the onset of the Anthropocene (Syvitski & Kettner, 2011; Wittmann et al., 2020). We apply the riverine particle flux calculated by Syvitski and Kettner (2011) even though higher estimates (20 x 1015 g yr-1) have previously been used (Oelkers et al., 2012). We chose this conservative estimate (15 x 1015 g yr-1) because it is consistent with the global denudation rate (15.2 ± 2.8 x 10¹⁵ g yr-1) that has been recently derived from cosmogenic nuclide data (Wittmann et al., 2020).
Suspended matter carried by rivers is depleted in cations compared to parent rocks due to chemical weathering processes (table 1). Rapid weathering of carbonate and evaporite rocks leads to a loss in solid phase Ca, Mg and Na (E. K. Berner & Berner, 2012) while silicate weathering induces significant Si, K, Na, Mg and Ca release (Gaillardet et al., 1999; Lechuga-Crespo et al., 2020). Insoluble elements such as Al and Fe are, on the other hand, enriched in river particles due to the formation of secondary minerals such as clays and metal oxides and hydroxides (E. K. Berner & Berner, 2012). Estimates on the global mean composition of UCC and suspended riverine particles vary significantly (table 1). Mean values calculated from these different estimates (UCC mean, River mean, table 1) have substantial standard deviations (indicated as ±) reflecting this uncertainty.
3. Cation exchange between riverine particles and seawater
Cation exchange is the first reaction that occurs when riverine particles enter the ocean. Most of the ion exchange takes place at the surface of clays and other sheet silicates. Cations bound to clay surfaces and in the space located between individual clay layers are subject to ion exchange when clays are equilibrated with seawater. Most of the exchangeable cations in 2:1 phyllosilicate (e.g., smectite group) compensate for the net negative charge induced by isomorphic substitution of cations in the tetrahedral (e.g., substitution of Si4+ by Al3+) and octahedral layers (e.g., substitution of Al3+ by Mg2+) of clay minerals (Blanc et al., 2015; Sposito et al., 1999). The exchange of surface-bond cations and interlayer cations is usually a fast process that is largely completed within a few minutes (Verburg & Baveye, 1994). However, sorption of cations with low hydration energies (e.g., K+, NH4+, Cs+) may induce collapse of the interlayer space and the edge-interlayer region resulting in a drastic slowdown of the diffusive exchange between the interlayer space and the bulk solution (C. X. Liu et al., 2003). The interlayer space is expanded by strongly hydrated cations (e.g., Na+, Ca2+) such that the diffusive transport and equilibration is accelerated in the presence of these cations. Exchange of major cations between clays and seawater is, hence, a relatively fast process in seawater due to its high Na+ concentration.
Cation exchange at the surface of Amazon River particles has been studied by Sayles and Mangelsdorf (1979). The authors showed that the reactive surface sites of particles suspended in Amazon River water are mostly occupied by Ca2+ (80 % on equivalent basis) followed by Mg2+ (17 %), Na+ (1 %) and K+ (2 %). The surface sites of particles suspended in the Ganga River are occupied by a similar cation mix composed of 76 % Ca, 16 % Mg, 7 % K and 1 % Na on equivalent basis (Lupker et al., 2016). A global compilation of exchangeable cations on river particles (Tipper et al., 2021) indicates that the mean composition (81 % Ca, 16 % Mg, 2 % K and 2 % Na on equivalent basis) is close to the values found in the Amazon River. The surface and interlayer space of riverine clays entering the ocean are largely occupied by Ca2+ since calcium is the most abundant cation in river water (E. K. Berner & Berner, 2012). Moreover, divalent cations (Ca2+, Mg2+) have a higher affinity for cation exchange sites than monovalent cations (Na+, K+) such that Ca2+ is further enriched in the exchangeable pool with respect to river water (Tipper et al., 2021).
After entering the ocean, Ca2+ is replaced by Na+ and Mg2+, the most abundant cations in seawater. Experimental studies with Amazon River particles (Sayles & Mangelsdorf, 1977) show that surfaces are mostly occupied by Mg2+ (38 ± 7 % on equivalent basis) and Na+ (38 ± 7 %) followed by Ca2+ (16 ± 7 %) and K+ (8 ± 1 %) after equilibration with seawater (Sayles & Mangelsdorf, 1979). Here, and in the following, ± indicates one standard deviation from the mean.
The mean cation exchange capacity (CEC) of riverine particles can be estimated as 250 ± 50 µeq. g-1 using the global mean Al/Si ratio in riverine particles (0.35 ± 0.01 mol/mol, table 1) and an empirical relationship between CEC and Al/Si (Tipper et al., 2021). A similar mean value (CEC = 245 ± 75 µeq. g-1) has been measured in Amazon River particles (Sayles & Mangelsdorf, 1979).
The values given above can be applied to calculate the change in the chemical composition of riverine particles induced by cation exchange after equilibration with seawater and global fluxes induced by cation exchange (table 2).
The data show that total element concentrations in riverine particles are significantly affected by cation exchange with seawater. The global mean particulate Na concentration increases by 27 % due to uptake of seawater Na while the Ca concentration declines by 14 % due to Ca release into seawater. Uptake of seawater cations on riverine particles also increases solid phase concentrations of Mg by 5 % and K by 3 % (table 2).
Global element fluxes induced by cation exchange in the coastal ocean are calculated by multiplying the global riverine particle flux with the difference between exchangeable cation concentration prior to and after equilibration with seawater (table 2). According to this approach, cation uptake on particles reduces the riverine fluxes of dissolved cations into the ocean by 15 % (Na), 17 % (K) and 8 % (Mg) while Ca release from riverine particles enhances the riverine flux of dissolved Ca by 10 % (table 2).
4. Dissolution of silicate minerals in seawater
In this section, we present the available data on mineral compositions of riverine particles and mineral solubilities in seawater. Experimental data on particle dissolution and kinetic modeling are employed to constrain the fraction of particles that dissolves in the ocean in contact with seawater.
4.1. Mineral composition of riverine particles entering the ocean
Mineral contents measured in riverine particles entering the ocean indicate that a large fraction of primary silicates forming UCC is not dissolved on land but exported to the ocean. Feldspars are e.g., provided by intense erosion of mountainous regions such as the Himalayas and are transported to the coast by rapidly flowing river waters as, both, suspended matter and bedload material. The Ganga and Brahmaputra rivers draining the Himalayan orogen join in Bangladesh to form the Meghna estuary, which represents the largest entry point of riverine particles to the world ocean (Garzanti et al., 2019). Sediments taken in the estuary, delta and on the shelf contain about 20 wt-% feldspars that are composed by equal amounts of plagioclase and K-feldspar (Garzanti et al., 2019).
Feldspars and other reactive primary minerals are also eroded on volcanic islands and active continental margins. Up to 45 % of the global particle fluxes into the ocean may be provided from these volcanically active regions even though they occupy only a small fraction of the global drainage area (Milliman & Syvitski, 1992). Basalt contains large amounts of highly reactive minerals such as Ca-plagioclase, pyroxene and olivine and is, therefore, strongly enriched in Ca and Mg with respect to UCC (Tang, 2021). A source-to-sink study on Iceland, a volcanically active island, shows that plagioclase and pyroxene contents in riverine particles decrease downstream (Thorpe et al., 2019). Nevertheless, suspended and bedload particles at the river mouth still contain about 30 wt-% plagioclase, 15 wt-% pyroxene and 2 wt-% olivine (Thorpe et al., 2019). It is, hence, likely that large amounts of plagioclase and basaltic minerals such as pyroxene reach the ocean around volcanic islands where they may partly dissolve in seawater. The chemical composition of volcanic rocks formed at active continental margins (subduction zones) is highly diverse (Kelemen et al., 2014). The average composition of these rocks may be similar to the composition of lower continental crust (Kelemen & Behn, 2016). Since lower crust is enriched in Ca and Mg with respect to upper continental crust (Rudnick & Gao, 2014), rocks at active margins probably provide eroded material that may contain more reactive minerals such as Ca-plagioclase and pyroxene than particles derived from passive margins.
Feldspar input is, however, not limited to erosion-dominated river systems and active margins but is also observed at passive margins. Sediments deposited e.g., at the mouth of the Amazon River contain significant amounts of feldspars (Gibbs, 1967). Most of Amazon particles are generated in the Andes by physical erosion that provides a mixture of quartz (15– 34 wt-%), feldspars (11–17 wt-%, plagioclase and K-feldspars) and clays (50–74 wt-%). During the passage through the vast Amazon basin, the particle composition is largely conserved such that the mineral composition of particles at the river mouth still reflects the composition of the material eroded in the Andes (Gibbs, 1967). At the river mouth, feldspars are most abundant in the 2–20 µm size fraction where they contribute 14 wt-% to the total mass (Gibbs, 1967). They also occur in the fine fraction (< 2 µm) that contains about 1–6 wt-% feldspars (Eisma & van der Marel, 1971).
Global compilations for the mean mineral composition of riverine particles are currently not available even though a preliminary database has recently been published (Müller et al., 2021). To address this issue, we derived a possible mineral composition of riverine particles (table 3) that is consistent with the mean composition of riverine particles (river mean, table 1) and the available mineralogical data (Müller et al., 2021).
The calcite content employed in our model (2.5 wt-%, table 3) is taken from a recently published survey on detrital carbonate contents of riverine particles (Müller et al., 2022). The other solids considered in the model represent minerals that are frequently found in riverine particles (Müller et al., 2021). Their global mean contents in riverine particles are derived by changing the contribution of these minerals until the mean element contents of the resulting mineral mixture (Na, K, Mg, Ca, Al, Si, Fe) are as high as the mean element contents measured in riverine particles (river mean, table 1). It should, however, be noted that many minerals such as felspars, pyroxenes and clays do not have fixed chemical compositions but form solid solutions with variable element contents. Hence, albite and anorthite are the Na- and Ca- endmembers of the plagioclase solid solution group which includes a range of mixed Na-Ca-feldspars (e.g., labradorite, oligoclase). The model in table 3 is, hence, not unique and other mineral mixtures can be identified that are consistent with the mean chemical composition listed in table 1. Nevertheless, the model may be a useful approximation. It indicates that about 20 wt-% of riverine particles entering the ocean are composed of feldspars that are highly reactive during chemical weathering and the most abundant silicate minerals in UCC (White, 1995).
4.2. Solubility of riverine minerals in seawater
Primary and secondary silicates entering the ocean may dissolve in seawater depending on their solubility. We employ PHREEQC (version 3.6.2) to get more insight into these processes by calculating the solubility and saturation state of seawater with respect to major silicate phases (Parkhurst & Appelo, 2013). We use the SIT database as implemented in PHREEQC for our calculations where a specific ion interaction approach is employed to calculate activity coefficients (Grenthe et al., 1997). This approach is suitable for solutions with moderate to high ionic strength such as seawater. It can be regarded as a simplified version of the Pitzer approach and represents many cation-anion interactions as complex formation rather than electrostatic interaction (Grenthe et al., 1997). The Pitzer approach is more rigorous than the SIT method but needs more empirical model parameters that are not always available. Hence, the Pitzer data base in PHREEQC does not include Al and Fe as solution master species. It is, hence, impossible to calculate the solubilities of Al- and Fe-bearing silicate phases with the current data base. Pitzer data are continuously updated (Pierrot & Millero, 2017) such that it may become feasible in the future to calculate solubilities in seawater using the Pitzer approach. For the time being, we apply the SIT approach as a useful approximation and standard database for our calculations (table 4).
The Pitzer database in PHREEQC is only applied for forsterite, diopside, enstatite, and talc, since these minerals are not included in the SIT database. Amphibole (tremolite) is neither included in SIT nor in the Pitzer database of PHREEQC. To calculate amphibole solubilities we, therefore, use the LLNL database of PHREEQC which is derived from databases for EQ3/6 and Geochemist’s Workbench that use thermodynamic data compiled by the Lawrence Livermore National Laboratory. Major cation and anion concentrations that need to be defined for the input file are calculated on the molality scale (mol per kg of H2O) using the ion/salinity ratios of seawater (Millero, 1996). We apply a seawater salinity of 35 in our calculations that corresponds to the following concentrations (in mmol kg H2O-1): Na = 487, Mg = 55.0, Ca = 10.6, K = 10.6, Sr = 0.087, Cl = 567, SO4 = 29.2, Br = 0.87, F = 0.069, B = 0.42. We employ a temperature of 15 °C and a pressure of 1 atm to simulate the conditions in the surface ocean. Dissolved inorganic carbon (DIC) and pH are set to DIC = 2.3 mmol kg-1 and pH = 8.2 to define the carbonate system while concentrations of dissolved ferrous and ferric iron are set to Fe(+II) = Fe(+III) = 0.1 nmol kg-1. Dissolved Si and Al concentrations are highly variable in the surface ocean. We, hence, apply two endmember scenarios with low concentrations (Si = 1 µmol kg-1, Al = 1 nmol kg-1) and high concentrations (Si = 20 µmol kg-1, Al = 50 nmol kg-1) to cover the range observed in the coastal ocean (Angel et al., 2016; Barraqueta et al., 2020; Sarmiento & Gruber, 2006).
Calculations indicate that seawater is strongly undersaturated with respect to most major silicate phases entering the ocean (table 4). Supersaturations are only calculated with respect to aragonite, calcite, hematite, hydrous smectite, clinochlore and talc. Hence, most silicate minerals entering the ocean should dissolve in ambient seawater.
4.3. Dissolution rates of silicate minerals in seawater
Dissolution of major aluminosilicates in seawater occurs under far-from-equilibrium conditions in strongly undersaturated solutions (table 4) that are marked by high dissolution rates (Lasaga, 1998). Under these conditions, dissolution rates reach a plateau such that a further increase in undersaturation has no significant effect on the dissolution rate (Gruber et al., 2019; Lasaga, 1998). Strong undersaturation of aluminosilicates in seawater (table 4) is maintained by rapid water exchange, removal of Al by scavenging on marine particles (Barraqueta et al., 2020; Hydes, 1979) and Si uptake by siliceous plankton (Sarmiento & Gruber, 2006). Terrestrial weathering usually occurs under more stagnant conditions with lower water exchange rates. Under these conditions, soil solutions tend to approach equilibrium, which induces a strong decline in dissolution rates (Lasaga, 1998; White, 1995; White & Brantley, 2003). It is, hence, likely that dissolution rates in seawater exceed those in terrestrial environments (Gruber et al., 2019; Jeandel & Oelkers, 2015).
Dissolution rates of minerals are proportional to their surface area (Lasaga, 1998). Hence, fine-grained particles with large surface areas dissolve more rapidly than coarse-grained particles (E. K. Berner & Berner, 2012). Riverine particles delivered to the ocean as suspended load are usually small and characterized by large surface areas. The median diameter of particles suspended e.g., at the mouth of the Amazon River amounts to ca. 3–4 µm (Gibbs, 1967). The geometric surface area of spherical particles within this diameter range and a grain density of 2.5 g cm-3 would amount to 0.6–0.8 m2 g-1. Even higher surface areas (7.3 m2 g-1) have been measured on suspended Amazon particles applying gas adsorption methods where the data are evaluated using the BET approach (Jones, Pearce, Jeandel, et al., 2012). This approach yields larger values since it captures all adsorption sites including those located on interlayer surfaces of clays that are the most abundant suspended minerals in the Amazon (Gibbs, 1967) and other river systems (table 3). The large surface areas of riverine particles entering the ocean probably induces a further increase in dissolution rates compared to many terrestrial environments (Jeandel & Oelkers, 2015). Dissolution rates are, however, highly pH dependent and reach a minimum under the close to neutral pH conditions that dominate in seawater (Hermanska et al., 2022). This pH effect may suppress dissolution reactions in seawater compared to terrestrial weathering environments that are typically characterized by more acidic conditions.
4.3.1. Dissolution rates derived from kinetic models
Data on dissolution kinetics of a range of primary silicate minerals have been recently compiled and evaluated to derive a general kinetic rate law and provide a consistent data set (Hermanska et al., 2022). Kinetic rate laws and parameter values are now available as CARBFIX database for PHREEQC (Hermanska et al., 2022). The kinetic database is based on BET rather than geometric surface areas and data obtained in experiments with low-salinity freshwaters under far-from-equilibrium conditions. Hence, effects of ionic strengths on dissolution kinetics are not yet considered in this database. Solution equilibria are calculated using the LLNL database while the SIT database is used as default database for the equilibrium calculations presented in table 4. Nevertheless, the rates derived from this model can be regarded as useful approximations. Dissolution rates calculated for the conditions defined in table 4 using the CARBFIX database indicate that forsterite and anorthite are highly reactive in seawater, albite and diopside show a moderate reactivity while tremolite, enstatite, quartz and K-feldspar are only slowly dissolved (table 5).
Dissolution rates are calculated assuming a mean particles diameter of 10 µm (table 5) and the corresponding geometric surface area. This grain size is employed because particle size analyzes conducted at the mouth of the Amazon River indicate mean feldspar and quartz diameters in the range of about 6–14 µm in the suspended sediment load (Gibbs, 1967). Since surface areas and dissolution rates of spherical particles decline with the squared particle radius, larger particles would yield lower rates while small particles would dissolve more rapidly than calculated above.
Our estimated dissolution rates are only valid for silicate minerals that are in contact with undersaturated seawater (table 4). They do not apply for particles that are deposited at the seabed and buried in terrigenous sediments since the accumulation of metabolites such as dissolved Al and Si in ambient porewaters may induce oversaturation with respect to major silicate phases. It is, hence, important to investigate whether riverine particles stay sufficiently long in contact with undersaturated seawater such that the dissolution rate is not limited by the contact time with seawater. Since settling of riverine particles is a fast process in the coastal zone, it takes only a few days to weeks before these particles hit the seafloor. Many coastal sediments are, however, frequently resuspended by bottom currents and transported alongshore and offshore until they reach local depocenters where they finally accumulate. Moreover, the uppermost millimeter of terrigenous shelf sediments is still in contact with the overlying seawater such that dissolved Al and Si concentrations in ambient pore fluids may still fall into the range observed in marine surface waters (up to 20 µmol Si kg-1 and 50 nmol Al kg-1, table 4). Sedimentation rates of fine-grained shelf deposits typical amount to ca. 1 mm yr-1 (Burwicz et al., 2011). This implies that suspended riverine particles are exposed to largely unaltered seawater over a period of about one year such that annual loss rates (table 5) can be applied to estimate rates of mineral dissolution in seawater.
Forsterite (olivine) is the most reactive silicate mineral in seawater (table 5) and during continental weathering (E. K. Berner & Berner, 2012). Since salinity has no significant effect on the forsterite dissolution rate (Oelkers et al., 2018) and soil solutions are usually highly undersaturated with respect to forsterite, it is likely that olivine dissolution in seawater proceeds as fast as during continental weathering. Natural olivine typically contains about 10 mol-% Fe replacing for Mg in the forsterite structure (Oelkers et al., 2018). Low to moderate Fe contents in natural olivine have no strong effect on solubility (Oelkers et al., 2018) such that the forsterite data given in tables 4 and 5 may be good approximations for olivine solubility and reactivity in seawater. Hence, a spherical forsterite grain with a diameter of 10 µm should lose about 3.1 % of its initial weight after exposure to seawater over a period of one year (table 5).
Due to these high dissolution rates, olivine addition has been proposed as an approach to remove CO2 from the atmosphere (Hartmann et al., 2013). Experimental studies confirm that olivine rapidly dissolves in seawater (Fuhr et al., 2022; Montserrat et al., 2017). However, secondary mineral formation seems to compromise the CO2 consumption and alkalinity generation in seawater due to the formation of authigenic phases such as talc and the precipitation of CaCO3 from supersaturated seawater, which seems to be catalyzed on olivine surfaces (Fuhr et al., 2022). Solubility data listed in table 4 confirm that Si-rich seawater is oversaturated with respect to talc such that the formation of Mg-Si-phases may limit the applicability of olivine addition as a carbon dioxide removal method in seawater.
Plagioclase feldspars, such as albite and anorthite, are the most abundant reactive silicate minerals in the earth’s crust (White, 1995). Seawater is strongly undersaturated with respect to anorthite and albite (table 4). Plagioclase feldspars rapidly dissolve in seawater and may lose 1.2–2.3 % of their initial mass over a period of one year (table 5). Since riverine particles contain significant amounts of plagioclase feldspars (albite, anorthite, table 3) that are highly soluble (table 4) and can rapidly dissolve in seawater (table 5), it is likely that most of the cation release into seawater from riverine silicate phases is induced by plagioclase dissolution. A study on albite dissolution kinetics in seawater under far-from-equilibrium conditions revealed high rates exceeding those that are observed in freshwater and during terrestrial weathering under close-to-equilibrium conditions (Gruber et al., 2019). Moreover, dissolution rates increase at high salinities (i.e., ionic strengths, Gruber et al., 2019). The combination of high salt contents and far-from-equilibrium conditions in seawater leads to an increase in albite dissolution rates by a factor of 34 with respect to a typical continental environment (Gruber et al., 2019). Nevertheless, albite dissolution rates in seawater reported in Gruber et al. (2019) (1.1–1.2 x 10⁻¹² mol m-2 s-1) are lower than those listed in table 5 (4.2–6.5 x 10⁻¹² mol m-2 s-1) which may be related to the formation of secondary minerals during the experiments (Gruber et al., 2019).
Quartz is one of the most abundant riverine silicate minerals entering the ocean (table 3). Rivers transport coarse-grained quartz as bedload while fine quartz grains are transported as suspended matter (Gibbs, 1967). Quartz dissolves very slowly during terrestrial weathering (E. K. Berner & Berner, 2012) and in seawater (table 5). Experimental studies on quartz dissolution in seawater, however, indicate that dissolution rates increase dramatically when seawater-quartz mixtures are rapidly steered to mimic the highly dynamic conditions in the beach surf zone (Fabre et al., 2019). Quartz dissolution rates ranged between 0.006 and 0.2 µmol Si g-1 d-1 pending on the stirring rate (Fabre et al., 2019), which corresponds to annual mass loss rates of 0.01–0.4 wt-% that partly exceed loss rates derived from the kinetic model (0.02–0.03 wt-%, table 5). The rate increase observed in rapidly steered suspensions can be ascribed to the thinning of the diffusive boundary layer around the quartz grains that induces a transition from diffusion to reaction-controlled kinetics (Fabre et al., 2019). Hence, mineral grains that are exposed to rapidly flowing seawater dissolve faster than grains in stagnant media. Terrestrial weathering usually occurs under more stagnant conditions than those encountered in the open marine environment. It is, hence, likely that silicate minerals dissolve more rapidly in the dynamic ocean compared to more stagnant continental weathering environments.
4.3.2. Experimental studies on clay and riverine particle dissolution in seawater
In the following section, experimental data are employed to estimate rates of clay mineral and riverine particle dissolution in seawater. It should, however, be noted that it is difficult to mimic open ocean condition during experiments conducted in the laboratory. Unrealistically high rates are usually observed over the first days of the experiments due to rapid dissolution of fine-grained particles and disturbed mineral surfaces present in the samples and created during sample preparation (White & Brantley, 2003). Rates decline to a more realistic level after these fines and high-energy surface sites are depleted. However, rates obtained after the initial peak are often compromised by precipitation of secondary Al-bearing minerals that form during the dissolution of aluminosilicates in seawater (e.g., Gruber et al., 2019). Solute accumulation over the course of the experiments induces higher saturation states than those observed in seawater, promotes secondary mineral formation and, hence, induces unrealistically low dissolution rates. Best estimates for in-situ dissolution rates in seawater may be attained by using data that are obtained after the initial rate peak and before rates are suppressed by the accumulation of solutes in the experimental vials. High water/rock ratios, flow-through experiments and other experimental set-ups where the solution is frequently replaced by fresh seawater yield better estimates than dissolution rates measured in closed systems.
A large fraction of the suspended load of rivers entering the oceans is composed of clay minerals that are formed during continental silicate weathering (table 3). Seawater is undersaturated with respect to many clay minerals (kaolinite, illite, smectites, table 4) and clays release dissolved Si into solution when dispersed in seawater with a low initial dissolved Si concentration (Mackenzie & Garrels, 1965). Mean dissolution rates can be calculated as 0.2 µmol Si g-1 d-1 for kaolinite, 0.6 µmol Si g-1 d-1 for illite, 0.8 µmol Si g-1 d-1 for chlorite and 2.0 µmol Si g-1 d-1 for montmorillonite employing data reported in Mackenzie and Garrels (1965). These rates were derived from dissolved Si concentrations measured over a period of 4 days after the initial rate peak had decayed and before the accumulation of dissolved Al and Si suppressed further dissolution. Assuming congruent dissolution, these experimental rates suggest annual mass losses of about 0.9 wt-% for kaolinite, 2.8 wt-% for illite, 6.2 wt-% for chlorite and 7.3 wt-% for montmorillonite. High dissolution rates of clays are related to smaller grain sizes and large surface areas of these fine particles.
Aluminum concentration measurements conducted during clay dissolution experiments in seawater show that dissolved Al is initially released and subsequently removed from solution within the first days and weeks of the experiments (Hydes, 1977; Mackin & Swider, 1987). Clay dissolution in seawater is, hence, an incongruent dissolution process. The incongruent behavior is related to the high solubility of Si bound in tetrahedral clay layers and the much lower solubility of Al bound in octahedral layers. Two overlapping incongruent dissolution mechanisms have been proposed (Mackin & Swider, 1987). In one of these mechanisms, tetrahedral Si-layers are preferentially dissolved leaving negatively charged Al-layers behind that subsequently take up protons, dissolved Si and cations from ambient seawater. The second mechanism considers that octahedral Al-layers are partially dissolved and that Al is subsequently removed from solution by the formation of authigenic phases (Mackin & Swider, 1987).
Incongruent dissolution of cation-rich clays (e.g., montmorillonite, K0.6Mg0.6Al1.4Si4O10(OH)2) accompanied by the formation of cation-free gibbsite (Al(OH)3) would result in cation release and, hence, alkalinity increase:
K0.6Mg0.6Al1.4Si4O10(OH)2+10H2O+1.8CO2→0.6 K++0.6Mg2++1.4Al(OH)3+4Si(OH)4+1.8HCO−3
The reaction is thermodynamically favorable since montmorillonite is more soluble in seawater than gibbsite (table 4). Dissolution of cation-rich clays qualifies as marine silicate weathering since cations and alkalinity are released into solution.
Incongruent dissolution of cation-depleted clays (e.g., kaolinite, Al2Si2O5(OH)4) accompanied by the formation of cation-rich clays (e.g., montmorillonite-HCK, K0.6Mg0.6Al1.4Si4O10(OH)2) qualifies as reverse weathering since cations and alkalinity are removed from seawater:
1.4Al2Si2O5(OH)4+1.2 K++1.2Mg2++5.2Si(OH)4+3.6HCO−3→2 K0.6Mg0.6Al1.4Si4O10(OH)2+13H2O+3.6CO2
Experimental data on kaolinite dissolution in seawater confirm that alkalinity is consumed during the reaction (Mackin & Swider, 1987). Dissolved Al concentrations attained in these experiments were, however, much higher than those observed in the ocean, which probably favored cation removal via authigenic Al-phase formation.
All experimental data on clay dissolution in seawater consistently show that Si is released into solution when Si concentrations are maintained within the range encountered in natural seawater (< 200 µM, Sarmiento & Gruber, 2006) which indicates that marine silicate weathering is the dominant pathway for clay alteration in contact with seawater (eq 4). Evaluations of experimental data, moreover, indicate that authigenic phases formed during clay dissolution have low molar Si/Al ratios approaching unity (Mackin & Swider, 1987) whereas molar Si/Al ratios in cation-rich clays always exceed unity (table 4). Both of these observation (net Si release, low Si/Al in authigenic phases) indicate that reverse weathering is not the dominant process during clay mineral dissolution in seawater since this reaction would induce Si uptake and yield authigenic clays with high Si/Al ratios (eq 5). Moreover, most of the Al dissolved in seawater is removed by scavenging and is, therefore, not available for authigenic mineral formation. It is, hence, likely that incongruent clay mineral dissolution in seawater induces net cation and alkalinity release and qualifies as marine silicate weathering rather than reverse weathering. It is, however, difficult to assess the cation and alkalinity release that occurs during the incongruent dissolution of clays in seawater.
Trace element and isotope data can also be employed to study dissolution and alteration of riverine particles in seawater. The distribution of neodymium (Nd) isotopes in the global ocean indicates a rapid exchange of Nd between riverine sediments and seawater at continental margins (Lacan & Jeandel, 2005). This observation led to the concept of “boundary exchange” which describes the release of solutes from riverine particles into seawater followed by partial uptake in authigenic minerals (Lacan & Jeandel, 2005). Experimental studies with coarse-grained riverine particles originating from volcanic islands (basaltic sands) confirm that seawater equilibrated with these particles rapidly attains the Nd isotopic signature of suspended solids (Pearce et al., 2013). However, only a small fraction of the dissolved Nd remains in solution due to the formation of insoluble secondary phases. Hence, the particulate Nd concentration in riverine particles decreased only by 0.04 to 0.38 wt-% over a period of 4 months. Si release rates observed during these experiments (Pearce et al., 2013) are also low (ca. 0.2 µmol Si g-1 d-1 over the first 20 days after the initial rate peak). They correspond to an annual mass loss of 0.7 wt-% assuming congruent dissolution and a Si content of 9780 µmol g-1 (table 1). These comparably low Si release rates are probably related to the large grain sizes of the riverine particles used in the experiments. Higher mass losses ranging from 0.5–7 % have been observed for Sr bound in volcanic riverine particles suspended in seawater at pH 7–8 (Jones, Pearce, & Oelkers, 2012; Jones, Pearce, Jeandel, et al., 2012; Oelkers et al., 2012) which indicates that minor elements with a high solubility (e.g., Sr) may be released at higher rates than dissolved Si und less soluble trace elements such as Nd.
4.4. Estimating global rates of silicate mineral dissolution in seawater
Mineral fluxes into the global ocean can be estimated applying the riverine particle flux (15 x 1015 g yr-1) and the mean mineral composition of suspended particles proposed in table 3. Annual dissolution rates for each mineral (table 6) are subsequently estimated applying silicate mineral dissolution rates listed in table 5 and clay dissolution rates estimated above (Mackenzie & Garrels, 1965) assuming congruent dissolution. Dissolution rates are set to zero when thermodynamic data indicate that seawater is oversaturated with respect to the corresponding mineral (table 4).
In the following section, mineral dissolution rates (table 6) are employed to estimate fluxes of dissolved elements into the ocean applying the chemical composition of the considered minerals (table 3). According to these data (table 6, table 3), the global Si release induced by dissolution of riverine particles in seawater amounts to 2.8 Tmol yr-1 where most of the Si is released by clay mineral dissolution. Even larger Si release rates are attained if the high quartz dissolution rate proposed for the global surf zone is valid (3–5 Tmol Si yr-1 Fabre et al., 2019). These fluxes approach the global riverine flux of dissolved Si into the ocean (7.0 Tmol Si yr-1, E. K. Berner & Berner, 2012). Hence, our budget calculations indicate that the dissolution of silicate minerals in seawater may significantly affect the dissolved Si budget of the global ocean.
Aluminum and iron released by silicate mineral dissolution in seawater are rapidly precipitated in coevally formed authigenic phases (oxides and hydroxides, secondary clays). It is, hence, difficult to derive net fluxes for these elements. Gross fluxes that would result for congruent dissolution amount to 1.7 Tmol Al yr-1 and 0.4 Tmol Fe yr-1 where most of the Al and Fe release would be induced by clay mineral dissolution (table 3, table 6). These gross fluxes are several orders of magnitude larger than the global aeolian inputs of dissolved Al and Fe to the open ocean that have previously been estimated as 0.04 Tmol Al yr-1 (Xu & Weber, 2021) and 0.003 Tmol Fe yr-1 (Somes et al., 2021). Dissolution of riverine silicate minerals would, hence, have a significant effect on global marine Al and Fe cycling even if less than 1 % of the gross flux would stay in solution. Water column data are consistent with this concept. They indicate specific Fe isotopic signatures and significant Al enrichments at continental margins that have been attributed to the release of these elements from riverine silicate phases (Conway & John, 2014; Homoky et al., 2013, 2016).
Fluxes of major cations induced by riverine mineral dissolution can be estimated as 0.06 Tmol Na yr-1, 0.14 Tmol K yr-1, 0.45 Tmol Mg yr-1, and 0.15 Tmol Ca yr-1 for congruent dissolution where most of the Na and Ca is released by plagioclase dissolution while K and Mg release are largely induced by clay mineral dissolution (table 6). These fluxes are at least one order of magnitude smaller than the global riverine flux of major cations to the ocean (table 2). Moreover, net fluxes of Mg and K are probably much smaller than gross fluxes calculated above since authigenic aluminosilicates that are formed during clay mineral dissolution have a high affinity for these cations and are strongly enriched in K and Mg (Michalopoulos & Aller, 1995). It can, hence, be concluded that dissolution of riverine silicate minerals in seawater has no significant effect on the global marine budget of major cations in seawater and, by inference, on the alkalinity budget of the global ocean. The data also suggest that more than 98 % of the suspended riverine particles are not dissolved in seawater over an exposure period of one year (table 6) but deposited in shelf sediments where they are further altered by dissolution and precipitation reactions.
5. Alteration of silicate minerals in marine surface sediments
In the following, we investigate the solubility, dissolution and alteration of silicate minerals in marine surface sediments focusing on the bioturbated surface layer (ca. top 10 cm of the sediment column) of fine-grained shelf sediments since most the riverine aluminosilicates accumulate in these deposits. Large amounts of particulate organic matter are deposited on the shelf and most of the organic matter is degraded within the bioturbated surface layer of shelf sediments. Due to aerobic respiration and denitrification, dissolved oxygen and nitrate are usually consumed within the top 1–2 cm of these deposits (Canfield, 1993). In the underlying layers, dissimilatory iron and sulfate reduction are the dominant pathways for organic matter degradation where sulfide is removed from solution by iron oxides that are renewed by bioturbation and oxidation of upward diffusing dissolved ferrous iron (Van Cappellen & Wang, 1996). Marine primary production is usually dominated by diatoms and other siliceous plankton at most continental margins (Sarmiento & Gruber, 2006). Biogenic opal produced by these organisms is deposited at the seabed and largely dissolved within the bioturbated surface layer such that dissolved Si concentrations in porewater exceed those in overlying seawater (Dale et al., 2021; Spiegel et al., 2023).
5.1. Solubility of riverine minerals in bioturbated surface sediments
Thermodynamic equilibrium calculations (PHREEQC, version 3.6.2) are again conducted to estimate the solubility of silicate minerals in surface sediments (ca. 0–2 cm depth) where oxygen or nitrate are still available and the underlying suboxic to anoxic sediment layer (ca. 2–10 cm) using the approach outlined in section 4. A pressure of 10 atm and temperature of 10 °C are applied to simulate the processes in shelf sediments deposited at ca. 100 m water depth. Formation of authigenic phases is favored in these sediments, since dissolution products such as dissolved Si and Al accumulate in ambient porewaters. Dissolution rates in sediments may be lower than in seawater and similar to those observed during continental weathering since porewaters are stagnant and dissolved species are transported mostly via diffusion and bio-irrigation rather than advection.
Measurements conducted in marine surface sediments typically show high Al concentrations at the surface followed by a decline in dissolved Al with sediment depth (Mackin & Aller, 1984a, 1984b, 1986; Van Beusekom et al., 1997). Dissolved Si concentration increase down-core due to the dissolution of biogenic opal and other silicate phases while Al decreases due to the precipitation of authigenic aluminosilicates (Mackin & Aller, 1986). Using these observations, we define Si = 200 µmol kg-1 and Al = 0.1 µmol kg-1 for the surface layer while Si = 500 µmol kg-1 and Al = 0.05 µmol kg-1 are applied for the subsurface layer.
Concentrations of dissolved inorganic carbon (DIC) in sediment porewaters are higher than in seawater due to the release of metabolic CO2 during the microbial degradation of marine organic matter (Boudreau & Canfield, 1993). We apply a DIC concentration of 2.5 mmol kg-1 for the surface layer and DIC = 3.0 mmol kg-1 in the subsurface layer to mimic the release of metabolic CO2. Moreover, we assume that porewaters are saturated with respect to calcite in both layers. To achieve calcite saturation, total alkalinity (TA) is set to 2.496 mmol kg-1 in the surface layer and TA = 2.978 mmol kg-1 in the subsurface layer. The resulting pH values (surface layer: pH = 7.69; subsurface layer: pH = 7.62) fall into the pH range commonly observed in surface sediments deposited on the continental shelf (Silburn et al., 2017).
Dissolved iron concentrations are controlled by iron reduction in the subsurface layer and iron oxidation at the surface. Reactive iron hydroxides such as ferrihydrite are rapidly reduced and consumed below the nitrate penetration depth such that dissolved ferrous iron accumulates in porewater (Canfield et al., 1993). Crystalline oxides such as hematite are conserved and buried while siderite and mixed Ca-Fe-carbonates are often formed under iron-reducing conditions (Van Cappellen & Wang, 1996). Ferrous iron diffuses upwards into the surface layer where it is rapidly oxidized by oxygen and nitrate. We assume that the balance between upward diffusion and oxidation results in a ferrous iron concentration of 0.5 nmol kg-1 in the surface layer (0–2 cm depth) while the dissolved ferric iron concentration in this layer is assumed to be controlled by the solubility of ferrihydrite (Fe(III) = 0.78 nmol kg-1). We further assume that the ferrous iron concentration in the subsurface layer (2 - 10 cm depth) is controlled by siderite solubility (Fe(II) = 88 µmol kg-1) whereas solubility of hematite limits the ferric iron concentration (Fe(III) = 0.081 nmol kg-1).
Applying these solution compositions, thermodynamic equilibrium calculations indicate that porewaters of marine surface sediments are strongly oversaturated with respect to most silicate minerals (table 7). The oversaturation is caused by elevated Si and Al concentrations in porewaters.
Many minerals that are soluble in seawater (table 4) are not dissolved in sediments (table 7) even though porewater pH values (7.62–7.69) are lower than seawater values (pH = 8.2). Hence, the increase in dissolved Si and Al concentrations induced by dissolution of biogenic opal and reactive Al-bearing minerals has a stronger effect on the saturation states of aluminosilicates in porewaters than the pH decrease induced by metabolic CO2 release.
Smectite, montmorillonite and illite seem to be the most stable phases in sediments (table 7). However, many sheet silicates with high ferrous iron contents are soluble in the surface layer (e.g., nontronite, glauconite, chamosite, greenalite, table 7). Chlorite is a common phase in riverine particles and terrigenous sediments (table 3). It contains significant amounts of ferrous iron with chamosite being the Fe2+ endmember of a solid solution series. Olivine can also contain Fe2+ ions replacing Mg2+ ions in the mineral lattice. It is, hence, possible that Fe is released by mineral dissolution in surface sediments (0–2 cm depth). Ferrous iron (Fe2+) is subsequently oxidized to ferric iron (Fe3+) by oxygen, nitrite and nitrate that are still available in this layer. Ferric iron produced by iron oxidation is then precipitated as ferrihydrite and bound in authigenic silicate phases such as glauconite that can also bind some of the released ferrous iron (Baldermann et al., 2015, 2022; Scholz et al., 2014). The composition of these authigenic phases, that are also referred to as green clay minerals (Velde, 2014), is poorly defined and it is possible that some variants such as berthiérine are sufficiently stable to precipitate from porewater (Velde, 2014) even though our database suggests that porewaters are undersaturated with respect to the specific glauconite form listed in the database (table 7). Ferrous and ferric iron may also be bound in authigenic illite and smectite since porewaters are oversaturated with respect to these iron-bearing clay minerals (table 7).
Aluminum concentrations in porewaters are higher than those typically observed in bottom waters which indicates that dissolved Al is released by dissolution of Al-bearing minerals. Anorthite and chlorite (chamosite) are the most common Al-bearing minerals in riverine particles (table 3) that may dissolve in surface sediments (table 7). It is, hence, likely that most of the Al enrichment in porewater originates from the dissolution of these minerals. Porewaters are also undersaturated with respect to halloysite (table 7). Halloysite is formed during continental weathering in drainage areas dominated by mafic lithologies (Joussein et al., 2005). Rivers also deliver amorphous Al-silicates to the ocean that are strongly depleted in cations and have been described as meta-halloysite or allophane (Mackenzie & Garrels, 1966; Moberly, 1963). It is, hence, possible that halloysite/allophane dissolution in sediments is another source for Al dissolved in porewater. Gibbsite is an unlikely candidate since porewaters are oversaturated with respect to this mineral (table 7) and riverine particles entering the ocean usually do not contain significant amounts of this Al hydroxide (Eisma & van der Marel, 1971; Gibbs, 1967). Most of the dissolved Al is probably removed from porewater by authigenic clay formation. Experimental data show that clays suspended in seawater take up dissolved Si when initial Si concentrations exceed those typically found in seawater (Mackenzie et al., 1967). The Si uptake is accompanied by Al removal from solution (Mackin & Aller, 1986; Mackin & Swider, 1987) and is mostly likely induced by formation of amorphous clays (Mackenzie et al., 1967) that are subsequently converted into more crystalline clays via Oswald ripening.
Formation and dissolution of clay minerals in surface sediments deposited in oxygen minimum zones (OMZs) has been studied using stable silicon isotopes (Ehlert et al., 2016; Geilert, Grasse, Doering, et al., 2020). Porewater profiles of stable Si isotopes (δ30Si) sampled in surface sediments deposited in the Peruvian OMZ indicate that authigenic clays are rapidly formed within the top 2 cm of the sediment column at a depth-integrated rate of 506 mmol Si per m2 seafloor area and year (Ehlert et al., 2016). Modeling indicates that about 24 % of the Si released by biogenic opal dissolution is bound in authigenic clays (Ehlert et al., 2016). Dissolved Al that is required for clay formation is most likely provided by the dissolution of plagioclase feldspars that are delivered by continental erosion during coastal El Niño events (Geilert et al., 2023). Porewater profiles of δ30Si measured in the Gulf of California show, in contrast, that clays are rapidly dissolved in these surface sediments (0–2 cm depth) at a depth-integrated rate of 520 mmol Si m-2 yr-1 (Geilert, Grasse, Doering, et al., 2020). δ30Si data indicate that the dissolving phase is not a primary mineral (e.g., feldspar) but a sheet silicate. Since some iron-bearing sheet silicates are unstable in surface sediments (e.g., chamosite, nontronite, table 7), they may dissolve in this environment (Scholz et al., 2019) and provide the observed δ30Si porewater signature (Geilert, Grasse, Doering, et al., 2020). Stable Si isotope data, hence, clearly document that feldspars and iron-bearing sheet silicates are rapidly dissolved in surface sediments.
5.2. Dissolution of riverine silicate minerals in surface sediments
In the following, we calculate dissolution rates for primary silicate minerals that are undersaturated in sediment porewaters (table 7) using the CARBFIX database as implemented in PHREEQC (Hermanska et al., 2022). Dissolution rates in surface sediments (table 8) are lower than those calculated for seawater (table 5) due to elevated concentrations of dissolved Si and Al in sediment porewaters and lower temperatures even though the more acidic pH values in sediments promote dissolution for most minerals. Anorthite is most likely the major silicate phase that dissolves in surface sediments since riverine particles contain significant amounts of this mineral (6.4 wt-%, table 3).
Other soluble silicate phases occur at much lower abundances in most riverine particles (pyroxene: 1.0 wt-%, olivine: 0.4 wt-%, table 3) such that they contribute less to the overall dissolution reaction. Since porewaters are oversaturated with respect to albite and K-feldspar (table 7), these major feldspars should not dissolve in surface sediments even though they contribute significantly to the dissolution of riverine particles in contact with seawater (table 6).
A 1-D reactive transport model is applied to evaluate the fraction of reactive minerals that may dissolve in surface sediments. The model considers sediment burial and compaction as well as bioturbation. It employs model parameter values that are typical for continental shelf sediments (Dale et al., 2015). The burial velocity after compaction is set to 0.1 cm yr-1 and the mass accumulation rate of solids is defined as 750 g m-2 yr-1. Bioturbation is assumed to affect the upper 10 cm of the sediment column with a bioturbation coefficient of 28 cm2 yr-1 at the sediment surface that continuously declines with sediment depth (Dale et al., 2015). The model is applied to simulate the dissolution of minerals with a diameter of 10 µm and corresponding geometric surface areas. Dissolution is modeled assuming that particles deposited at the sediment surface contain 6.4 wt-% anorthite, 1 wt-% diopside and 0.4 wt-% forsterite (table 3). The kinetic constants are set to 5.5 x 10⁻¹² mol m-2 s-1 for anorthite, 4.4 x 10⁻¹² mol m-2 s-1 for diopside and 3.4 x 10⁻¹¹ mol m-2 s-1 for forsterite (table 8). Dissolution rates are assumed to be proportional to mineral concentrations that decrease with sediment depth due to dissolution. No attempt is made to consider changes in reactivity, particle diameter and porewater composition with sediment depths, for simplicity. Deposition of minerals at the sediment surface is defined applying a flux condition (flux = C MAR) considering the mean mineral contents in riverine particles (C, taken from table 3) and the mass accumulation rate (MAR). The model solves a system of partial differential equations (PDEs) and is run until steady state is attained (Dale et al., 2015). MATHEMATICA is used as modeling software since it includes a very efficient PDE solver.
Model results indicate that forsterite is largely dissolved in surface sediments (fig. 2). Significant dissolution is also predicted for anorthite and diopside (fig. 2).

At the upper boundary of the model column, located at the sediment-water interface, mineral concentrations are lower than those in riverine particles (table 3) due to rapid dissolution and mixing in the bioturbated surface layer. Evaluation of model results shows that 64 % of the forsterite deposited at the seabed dissolves within the bioturbated surface layer while 39 % of anorthite and 25 % of diopside are dissolved within this layer located at 0–10 cm sediment depth. Considering the entire length of the model column (0–20 cm), the dissolved fractions increase to 96 % for forsterite, 75 % for anorthite and 52 % of diopside. Global dissolution rates in surface sediments can be estimated as 720 Tg anorthite, 78 Tg diopside and 58 Tg olivine per year applying mineral fluxes listed in table 6 and the dissolved fraction derived by reactive transport modeling for 0–20 cm sediment depth. These dissolution rates are significantly higher than those estimated for mineral dissolution in seawater (table 6) which is due to the much longer residence time of minerals in surface sediments (ca. 200 years) compared to the time that particles remain in contact with seawater (ca. 1 year).
Mineral dissolution rates in sediments derived by reactive-transport modeling (fig. 2, 0–20 cm) can be applied to estimate benthic fluxes of dissolved Si, Ca and Mg into the overlying bottom water considering the chemical composition of the dissolving minerals and assuming congruent dissolution. These fluxes result as 6.3 Tmol Si yr-1, 2.9 Tmol Ca yr-1 and 1.1 Tmol Mg yr-1. Fe may also be released since porewaters are undersaturated with respect to some iron-bearing minerals such as chamosite and nontronite (table 7). However, these minerals are not yet included in the CARBFIX database such that we are currently not able to calculate their dissolution rates. Most of the Al released during mineral dissolution according to our calculations (5.2 Tmol Al yr-1) does not stay in solution but will be bound in authigenic clays. Since authigenic clays contain Si and a range of other cations, the benthic fluxes estimated above should be regarded as maximum estimates. Mg is probably more affected by clay formation than Ca since authigenic clays are typically enriched in Mg (Rude & Aller, 1989) but do not contain significant amounts of Ca. Dissolution of primary silicate minerals in surface sediments would not serve as a significant source of dissolved Si and cations to the ocean if sediments approached thermodynamic equilibrium under closed system conditions (table 7). However, surface sediments are partially open rather than closed systems. Hence, solutes produced by silicate mineral dissolution are released into ambient bottom waters by molecular diffusion. The solute transport is further accelerated by benthic macrofauna that induces bio-irrigation (Aller & Aller, 1998; Boudreau, 1997). It is, hence, possible that a significant solute fraction is released into ambient bottom waters.
So far, we only investigated the fate of suspended riverine particles. However, rivers also transport coarser material as bedload. The bedload flux is usually assumed to contribute about 10–20 % to the total flux (Turowski et al., 2010). Higher percentages (up to 30–50 %) can be reached in sand-bed rivers and small rivers flowing through steep terrain (Turowski et al., 2010). Sandy sediment deposits cover large parts of the continental shelf (Emery, 1968). They are typically formed in high energy regions of the shelf where fast bottom currents inhibit the deposition of fine-grained material. Sandy sediments, that can serve as ultimate depocenter for coarse bedload particles, are highly permeable. They can be regarded as fully open systems since they are constantly flushed by bottom waters such that concentrations of dissolution products are maintained at the level found in ambient seawater (Huettel et al., 1998; Huettel & Gust, 1992). It is, hence, likely that coarse-grained reactive silicate minerals deposited in permeable sands are congruently dissolved with little authigenic clay formation. It should, however, be noted that dissolution rates of particles with a diameter of 100 µm, that typically accumulate in sandy sediments, are about 100 times lower than those of fine-grained particles (10 µm diameter) since surface areas and dissolution rates decrease with the squared particle radius.
The solute fraction that escapes into seawater is, in the end, governed by the competition between solute transport and authigenic phase precipitation in surface sediments. More work is needed to better constrain kinetics of secondary mineral formation, transport velocities in surface sediments and the resulting solute fluxes from shelf sediments. Detailed studies addressing some of these issues have been conducted on the Amazon shelf. They are, hence, presented in the following section.
5.3. Alteration of riverine particles in Amazon shelf sediments
The Amazon shelf is a highly dynamic environment characterized by rapid bottom currents and intense sediment remobilization. Most of the suspended load of the Amazon river is not deposited at the river mouth but transported north-westwards along the Guyana coast over distances of several hundred kilometers at a mean velocity of ca. 1.5 km yr-1 (Eisma & van der Marel, 1971; Gibbs, 1973). Radioisotope data (cosmogenic 32Si) indicate an authigenic Si content of 2.3 mmol/g in Amazon mud deposited at the Guyana coast (Rahman et al., 2016). Considering the Si concentration in riverine particles at the mouth of the Amazon River (9.8 mmol/g, Sholkovitz & Price, 1980), this Si content translates into an authigenic mineral content of ca. 23 wt-%. Hence, sediment alteration proceeds at high rates in this dynamic environment.
Numerous alteration studies conducted on the Amazon shelf confirm these findings (Mackin & Aller, 1986; Michalopoulos et al., 2000; Michalopoulos & Aller, 1995, 2004; Rahman et al., 2016; Rude & Aller, 1989, 1994; Spiegel et al., 2021). Hence, K- and Fe-enriched phases similar to 2:1 clays form on diatom frustules in Amazon shelf sediments (Michalopoulos & Aller, 2004) while Mg- and Fe-rich phyllosilicate phases precipitate on the surface of quartz grains in Amazon shelf sediments during early diagenesis (Rude & Aller, 1989). Analysis of bulk sediments deposited on the Amazon shelf show a significant K enrichment with respect to riverine particles (Spiegel et al., 2021). These enrichments translate into a K uptake rate in authigenic clays of 0.17 Tmol yr-1 for the Amazon shelf which is close to a previous estimate based on evaluation of porewater data (0.12 Tmol yr-1, Michalopoulos & Aller, 1995). The K uptake is accompanied by a corresponding uptake of Fe in authigenic clays (Vosteen et al., 2022). Most of the sediment alteration may be driven by the deposition of plankton-derived biogenic opal and by dissimilatory iron reduction in reducing shelf sediments that provide large amounts of Si and dissolved iron promoting authigenic clay formation (Aller et al., 1986; Aller & Blair, 2006).
Data on the bulk chemical composition of suspended riverine particles and surface sediments deposited on the Amazon shelf confirm that the bulk chemical composition of Amazon river particles is significantly altered after deposition on the Amazon shelf (table 9). The data show a rather high variability in Al contents and chemical composition of riverine suspended particles. These parameters are known to vary with river depth where Al concentrations decrease with depth due to the preferential sinking of coarse particles depleted in Al (mostly quartz, Guinoiseau et al., 2016). The composition also shows seasonal variability induced by changes in run-off (Bertassoli et al., 2017). It is likely that most of the observed variability is related to these effects. Surface sediments sampled along the Amazon shelf are, in contrast, rather homogenous. Sediments are enriched in K and Mg and depleted in Ca and Na with respect to riverine particles (table 9). K and Mg enrichments can be attributed to authigenic clay formation while Ca and Na depletions are probably driven by plagioclase dissolution. Previous work on the Amazon shelf was focused on authigenic clay mineral formation while plagioclase dissolution was not investigated. Our new data indicate that K and Mg uptake is accompanied by Ca and Na release such that the overall cation budget may be balanced.
The integrated chemical effects of alteration can be assessed by comparing the composition of riverine particles and shelf sediments. We chose data measured by Guinoiseau et al. (2016) close to Manaus since these authors took great care to sample particles across the entire river from shallow to large water depths and derived an average particle composition that is representative for this location. Moreover, Al contents measured at this station are close to those in surface sediments (table 9). The shelf station located furthest away from the river mouth (St. 93) was chosen for comparison since it receives biogenic opal and is exposed to seawater and anoxic conditions over an extended period of time. According to this approach, cation contents of shelf sediments (Na+ + K+ + 2 Mg2+ + 2 Ca2+ = 1907 ± 150 µeq. g-1) are as high as those of riverine particles (Na+ + K+ + 2 Mg2+ + 2 Ca2+ = 1916 µeq. g-1). The cation/Al ratios suggest a small cation depletion in sediments (0.524 ± 0.05 meq. (µmol Al)-1) with respect to river particles (0.538 meq. (µmol Al)-1) that may, however, not be significant. These findings are important since they deviate from the conventional view on particle alteration on the Amazon shelf. It is usually assumed that reverse weathering (cation uptake and CO2 release) is the dominant process in this shelf environment whereas our data show that marine silicate weathering (cation release and CO2 consumption) proceeds as fast as reverse weathering on the Amazon shelf (table 9).
Cation exchange has to be considered to understand processes that are responsible for the observed concentration changes. Absorbed Ca2+ ions are released into solution while Na+, K+ and Mg2+ ions are taken up on particle surfaces when Amazon riverine particles enter the ocean. Concentrations of exchangeable cations in river water and seawater are listed in table 2. Using these data and the data in table 9, the exchangeable and lattice-bound cation concentrations can be calculated (table 10). The data show that cation exchange contributes significantly to the Ca loss observed in shelf sediments. However, concentrations of all lattice-bound cations change significantly which clearly indicates that primary silicate dissolution and authigenic clay formation take place and are largely responsible for the observed changes in the particle composition (table 10). For Ca and Mg, calcite and dolomite dissolution/formation could play a role. However, these carbonate minerals have never been observed in Amazon river particles (Eisma & van der Marel, 1971; Gibbs, 1967) and it is therefore commonly assumed that Ca and Mg are largely bound in silicate phases (Guinoiseau et al., 2016).
Sediments at St. 93 contain significant amounts of particulate inorganic carbon (146 ± 20 µmol g-1). Most of the inorganic carbon in Amazon shelf sediments is, however, bound in authigenic FeCO3 rather than CaCO3. Sequential extraction data indicate a mean FeCO3 content of 80 ± 20 µmol g-1 for St. 93 (Vosteen et al., 2022). If the remaining inorganic carbon (64 ± 20 µmol g-1) would be bound in CaCO3, essentially all lattice-bound Ca would occur as CaCO3 (table 10). These data, hence, suggest that Ca-bearing silicate minerals may dissolve completely in surface sediments. However, Fe bound in labile authigenic clays may also be partly extracted during the step that is designed to dissolve FeCO3 (Vosteen et al., 2022). Hence, some silicate bound Ca may still be present in Amazon shelf sediments.
The mineralogical composition of Amazon River particles has been analyzed in detail (Gibbs, 1967). Analyses indicate that suspended matter contains 58 ± 10 wt-% clay, 25 ± 5 wt-% quartz, and 8.5 ± 2 wt-% feldspars at the mouth of the Amazon River (Gibbs, 1967). The decrease in lattice bound Na (ca. 200 µmol g-1) and Ca (ca. 35 µmol g-1) observed in shelf sediments (table 10) can be reproduced by the dissolution of 5 wt-% albite and 1 wt-% anorthite where albite dissolution is probably promoted by the frequent resuspension of sediments that exposes albite to undersaturated seawater. The feldspar content may, hence, drastically decline during sediment alteration from 8.5 wt-% in riverine particles to 2.5 wt-% in shelf sediments. More data on the feldspar contents in sediments deposited along the Amazon shelf are required to consolidate these findings. Nevertheless, cation release during marine silicate weathering (plagioclase dissolution and Na/Ca release) and cation uptake during reverse weathering (clay formation and K/Mg uptake) seem to be largely balanced during sediment alteration on the Amazon shelf. These processes are closely coupled since plagioclase dissolution may provide most of the dissolved Al required for authigenic clay formation and K and Mg uptake in sediments.
5.4. Global cation fluxes induced by silicate alteration in surface sediments
Porewater data obtained in a wide range of terrigenous surface sediments from the Atlantic Ocean and Caribbean confirm that dissolved K and Mg are removed and bound in solid phases while Ca and Na are released into ambient porewaters (Sayles, 1979, 1981). Most of the cation turnover occurs within the top 30 cm of the sediment column (Sayles, 1979). Ca release from terrigenous sediments exceeds the release of alkalinity confirming that Ca is provided by aluminosilicate rather than carbonate dissolution (Sayles, 1979). Diffusive fluxes across the sediment/water interface were determined from in-situ sampled porewaters. Assuming that 30 % of the global seafloor receives terrigenous sediments from the continents and, hence, qualifies as continental margin, the global cation release fluxes at continental margins were calculated as 1.4 - 2.6 Tmol Na yr-1 and 2.7 - 3.7 Tmol Ca yr-1 while the corresponding cation uptake fluxes in authigenic phases were estimated as 0.8 - 1.0 Tmol K yr-1 and 1.0 - 3.3 Tmol Mg yr-1 (Sayles, 1979).
These data clearly show that the geochemical footprint of sediment alteration observed on the Amazon shelf is not unique but seems to be a wide-spread feature in terrigenous surface sediments. Ca release from sediments and Mg uptake in authigenic phases is also observed in other marine surface sediments collected at 12 different near-shore sites (Drever et al., 1988) where the mean molar Mg/Al ratio (0.18 ± 0.07) exceeds the ratio in riverine particles (table 1) while the carbonate-corrected Ca/Al ratio (0.07 ± 0.05) is smaller than the riverine ratio (table 1). Hence, global cation fluxes can be estimated by multiplying changes in lattice-bound cation concentration observed during silicate alteration on the Amazon shelf (table 10) with the global flux of riverine suspended matter (15 x 1015 g yr-1). This calculation yields release fluxes of 3.1 ± 2.5 Tmol Na yr-1 and 0.54 ± 0.3 Tmol Ca yr-1 and uptake fluxes at 1.8 ± 0.9 Tmol K yr-1 and 1.2 ± 0.6 Tmol Mg yr-1 that are similar to those derived from porewater data (Sayles, 1979).
The global rate of benthic Ca release via anorthite and diposide dissolution in surface sediments estimated by reactive transport modeling (2.9 Tmol Ca yr-1 with 2.6 Tmol Ca yr-1 from anorthite and 0.3 Tmol Ca yr-1 from diposide, fig. 2) is consistent with benthic Ca fluxes derived from porewater data (2.7 - 3.7 Tmol yr-1, Sayles, 1979). This conformance implies that most of the benthic Ca flux from surface sediments can be ascribed to anorthite dissolution. It also suggests that dissolved Ca provided by this process is not retained in sediments but released into the overlying water column. However, the Mg release predicted by reactive transport modeling (1.1 Tmol yr-1) is not observed in field data. Hence, Mg provided by the dissolution of Mg-bearing minerals (e.g., pyroxene, olivine) is fixed in authigenic clays and not released into seawater. The field data also suggest the Mg fixation in authigenic phases is so efficient that additional Mg is taken up from ambient bottom waters such that sediment alteration induces a net uptake of seawater Mg in marine surface sediments. Considering these results, it may be promising to add Ca-bearing minerals (e.g., anorthite) rather than Mg-bearing minerals (e.g., olivine) to surface sediments to enhance seawater alkalinity and CO2 uptake in the ocean (Wallmann et al., 2022).
Porewater data can also be used to derive dissolved Si fluxes from sediments. However, most of the Si release from surface sediments is induced by dissolution of biogenic opal that is provided by diatoms and the remains of other siliceous plankton sinking to the seabed (Tréguer et al., 2021; Tréguer & De La Rocha, 2013). It is, therefore, difficult to access the contribution of terrigenous silicate mineral dissolution to the observed Si flux. Porewater gradients measured in terrigenous surface sediments, that do not contain measurable amounts of biogenic opal, suggest a significant Si release that can be attributed to aluminosilicate dissolution. The global Si flux from these sediments into seawater has been estimated as 1.9 ± 0.7 Tmol Si yr-1 (Tréguer et al., 2021; Tréguer & De La Rocha, 2013). This estimate is smaller than the Si flux derived by reactive transport modeling (6.3 Tmol Si yr-1) assuming congruent dissolution (fig. 2). The difference between these estimates may be ascribed to authigenic clay formation that may bind not only Si delivered by biogenic opal deposition but also Si released from dissolving terrigenous minerals.
Most surface sediments deposited in the shelf are eroded during glacial sea-level low-stands and redeposited at larger water depths where they often form deep-sea fans (Schlünz et al., 1999) and experience further alteration. In the following sections, we present studies on alteration processes occurring in these deposits and extend our approach by evaluating porewater data retrieved from deeper sediment layers.
6. Alteration of silicate minerals in deep-sea fan sediments
River particles are initially deposited on the shelf. However, many shelf deposits are subsequently eroded and redeposited at the slope and continental rise (Hay, 1994; Hay & Southam, 1977; Schlünz et al., 1999). At active continental margins, a large fraction accumulates on the accretionary wedge, in deep-sea trenches and on the incoming oceanic plate (Von Huene & Scholl, 1991). At passive margins, the eroded shelf material forms large deep-sea fans that serve as ultimate sink for the riverine particles transported into the ocean (Schlünz et al., 1999). To better understand sediment alteration in these settings, we present two regional studies for the Amazon and Bengal river systems and deep-sea fans, the two largest river systems in terms of particle transport (E. K. Berner & Berner, 2012).
Particles eroded in the Himalayas and transported in the ocean via the Ganga-Brahmaputra river system are forming a vast deep-sea fan covering the entire seafloor of the Bay of Bengal (Curray, 1994; France-Lanord et al., 2016). The Ganga and Brahmaputra rivers drain the Himalayan orogen and join in Bangladesh to form the Meghna estuary, which represents the largest entry point of riverine particles to the world ocean (Garzanti et al., 2019). High Holocene sedimentation rates have been recorded for the Bengal fan whereas the Amazon deep-sea fan has been largely inactive over the Holocene and received most of the particle load during glacial sea-level low-stands when the Amazon shelf was exposed and eroded (Schlünz et al., 1999).
6.1. Porewater data from deep-sea fan sediments
Porewater profiles retrieved in the Amazon deep-sea fan during ODP leg 155 (Flood et al., 1997) and Bengal deep-sea fan sampled during IODP leg 354 show surprisingly similar patterns even though they form in very different geological settings (fig. 3 and fig. 4). The data indicate a significant removal of all major seawater cations from porewater.

The down-core decrease in dissolved K and Mg observed in both fans (figs. 3 and 4) indicates that these cations are removed from porewater and fixed in solids over the entire lengths of the investigated sediment cores. K is apparently enriched with respect to seawater in the top 10 m of the sediment column. However, this enrichment is probably a sampling artifact. Sediments are usually heated during core retrieval and processing since onboard temperatures exceed in-situ temperatures at the deep-sea floor by typically about 15–20 °C. Heating by 17 °C affects cation-exchange equilibria and induces an increase in dissolved K and Na by about 20 % and 1 %, respectively, while dissolved Ca and Mg concentrations decrease by 6 % and 5 %, respectively (Sayles et al., 1973). Hence, in-situ K concentrations are probably 20 % lower and Mg concentrations 5 % higher than those shown in figures 3 and 4. Nevertheless, the data indicate that K and Mg uptake in sediments is a pervasive process that is not completed in surface sediments but proceeds down to large sediment depths due to continuous authigenic clay formation.
Dissolved Na concentrations in the Amazon fan are depleted with respect to seawater and decrease with sediment depth (fig. 3). This trend indicates that Na is fixed in authigenic phases formed in Amazon fan sediments. In the Bengal fan, Na is enriched with respect to seawater in the top 40 m of the sediment column and approaches seawater values at ca. 80 m depth (fig. 4). Here, Na seems to be affected by two opposing processes, i. e. Na release in surface sediments by mineral dissolution followed by Na uptake in deeper sediment sections.

The difference between the Amazon (fig. 3) and Bengal (fig. 4) fan is probably related to feldspar contents of the terrigenous matter deposited in these environments. Sediments taken in the Meghna estuary and delta and on the Bengal shelf contain about 20 wt-% feldspars that are composed by equal amounts of plagioclase and K-feldspar (Garzanti et al., 2019). Hence, Na-bearing plagioclase is probably deposited in Bengal fan sediments and may dissolve in the upper section of the core. The feldspar content at the mouth of the Amazon River amounts to only 8.5 ± 2 wt-% (Gibbs, 1967). Moreover, most of the riverine albite is already dissolved in Amazon shelf deposits (section 5.3) such that eroded shelf sediments deposited in the Amazon fan are further depleted in Na plagioclase and Na uptake rather than Na release is the dominant process in this sedimentary environment.
Ca concentrations strongly decrease with sediment depth in both deep-sea fans (figs. 3 and 4) probably due to authigenic CaCO3 precipitation. Carbonate formation is partly driven by alkalinity production via dissimilatory sulfate reduction (DSR) and anaerobic oxidation of methane (AOM, Wallmann et al., 2008). In Amazon fan sediments, sulfate is largely depleted by these processes at sediment depths of about 10 m (fig. 3) while sulfate is depleted at about 40 m sediment depth in Bengal fan sediments (fig. 4). Alkalinity reaches a maximum at these depths and declines in the underlying methanogenic sediments (figs. 3 and 4). Complete sulfate reduction via DSR and AOM should lead to TA values of about 60 meq. dm-3 (Wallmann et al., 2008). However, the measured TA values are much lower than this theoretical value and decline to less than 10 meq. dm-3 at the base of the cores (figs. 3 and 4). The TA deficit (≈50 meq. dm-3) is accomplished by a corresponding decrease in cation concentrations maintaining the charge balance of the pore fluids.
It is theoretically possible that the entire cation depletion is induced by reverse weathering, i.e., cation uptake in authigenic silicate phases. However, reverse weathering would not affect DIC concentrations such that DIC values would rise beyond 60 mM at the base of the sulfate-bearing zone for this scenario (Wallmann et al., 2008). Considering the ambient conditions in Amazon deep-sea fan sediments (salinity: 35, temperature: 2 °C, pressure: 350 bar, Ca: 5.0 mM, TA: 10 meq. dm-3), a pH value of 5.4 would be attained at the base of the core and the porewater would be strongly undersaturated with respect to calcite for DIC = 60 mM (SI = log IAP–log K = -2.0, PHREEQC, SIT data base). However, much higher pH values of 7.58 ± 0.16 were measured at the core base (IODP Janus data portal). Moreover, Amazon fan sediments contain significant amounts of inorganic carbon that are largely formed by authigenic carbonate precipitation (Burns, 1997). A scenario where reverse weathering alone is responsible for cation depletions is, hence, not consistent with available observations. It is likely that the Ca depletion at the core base is induced by carbonate precipitation rather than Ca fixation in authigenic silicate phases.
Carbonate precipitation would remove TA and DIC from solution until the solution is saturated with respect to the precipitating carbonate phase. The DIC concentration at equilibrium with calcite can be calculated as 10.4 mM and the pH as 7.45 for ambient conditions (Ca: 5.0 mM, TA: 10 meq. dm-3) which is close to the observed pH value (7.58 ± 0.16). The difference between the expected DIC concentration at depth (>60 mM) and the calculated equilibrium concentration (10.4 mM) indicates that ≈50 mM DIC are removed by carbonate precipitation. This would result in a Ca decline by ≈50 mM if DIC is precipitated as CaCO3. However, the Ca deficit observed at the core base amounts to only ca. 6 mM which implies that large amounts of Ca (≈44 mM) have to be released from dissolving silicate phases to close the Ca budget.
A similar cation balance can be set up for Bengal fan sediments (fig. 4). The calculations again indicate that ≈45 mM of Ca has to be release from silicate phases to close the DIC, TA and Ca budgets and attain equilibrium with respect to calcite. Since fine-grained anorthite (10 µm grain diameter) should rapidly dissolve in surface sediments (fig. 2), other less reactive phases are more likely to dissolve at large sediment depths. These may include Ca-rich tremolite (amphibole) and diopside (pyroxene, table 5), mixed Na-Ca-feldspars (e.g., labradorite, oligoclase), coarse-grained anorthite or anorthite minerals covered by secondary phases that may mitigate the dissolution process in surface sediments. It should, however, be noted that the estimates of Ca release from silicates derived above are maximum values since additional cations (Mg2+, Fe2+) are often bound in authigenic carbonates (Torres et al., 2020) such that less Ca is required to remove the calculated DIC excess. Nevertheless, the porewater data clearly indicate that Ca-bearing silicate phases are dissolved in deep-sea fan sediments as previously observed in other sedimentary settings (Solomon et al., 2014; Torres et al., 2020; Wallmann et al., 2008).
6.2. Reactive transport model for major cation, alkalinity and carbon turnover in Bengal fan sediments
We set up a reactive transport model for the Bengal fan sediments to substantiate our finding that Ca required for CaCO3 precipitation is delivered by silicate dissolution. The model simulates down-core steady state profiles for TA, DIC, sulfate, K, Mg and Ca. It considers sediment burial, compaction, and molecular diffusion as transport processes (R. A. Berner, 1980). Ages estimated for 100 m sediment depth (Reilly, 2018) range from ca. 0.25 Ma (site U1454) to 0.4 Ma (site U1450) which corresponds to a mean sedimentation rate of ca. 30 cm kyr-1. Porosity values listed in the IOPD LIMS Online Report Portal indicate an exponential decline from ca. 83 % at the surface to ca. 50 % at 100 m depth. These data are used to define the advective transport of dissolved species induced by sediment burial and compaction employing standard equations (R. A. Berner, 1980). Diffusion coefficients are calculated for each dissolved species considering ambient sediment temperature and tortuosity (Boudreau, 1997) where tortuosity is derived from porosity (Boudreau, 1997) and sediment temperature is assumed to increase down-core from 2 °C at the surface to 5 °C at 100 m sediment depth.
Reactions considered in the model include particulate organic carbon (POC) degradation via sulfate reduction (dissimilatory sulfate reduction) and methanogenesis as well as anaerobic oxidation of upwards diffusing methane with sulfate (Wallmann et al., 2006). The model employs a power law (Middelburg, 1989) imposing a steep down-core decrease in POC reactivity and degradation rates. POC concentrations are assumed to be constant with depth, for simplicity, applying a POC concentration of 0.5 wt-% which corresponds to the mean POC value measured in Bengal fan sediments (IOPD LIMS Online Report Portal). The exponent of the power law was decreased from -0.95 (Middelburg, 1989) to -1.125 to obtain a good fit to measured sulfate concentrations. This is justified by previous models showing that the down-core decrease in POC reactivity in margin sediments is steeper than predicted by the original power law (Wallmann et al., 2006). The resulting sulfate and methane profiles reproduce the measured sulfate concentrations and predict significant methane concentrations at depth that fuel anaerobic methane oxidation (AOM) at ca. 35–45 m sediment depth (fig. 5).

Cations are removed by uptake in authigenic clays and carbonates. Uptake rates are prescribed such that modeled concentrations conform with measured cation data (fig. 6).

Simple equations are employed to generate rate depth-profiles that minimize the difference between measured and modeled cation concentrations (Wallmann et al., 2008). The TA consumption rate is set equal to the sum of cation removal rates (K+ + 2 Mg2+ + 2 Ca2+) where cation charges are considered to maintain electroneutrality. Solubilities of carbonate and other minerals are not considered in this model. The TA model does not differentiate between cation fixation in clays and carbonate since both processes have the same effect on cation concentrations. They also have the same effects on TA due to charge balance constraints. Modeled alkalinity values obtained without cation uptake in solids increase to ca. 58 meq. dm-3 at the base of the core due to dissimilatory sulfate reduction (DSR) and AOM (fig. 7, red line). Cation removal induces a strong alkalinity decline such that modeled TA values approach the measured data (fig. 7).
DIC is produced by POC degradation and remains at a high concentration level (up to 68 mM at the core base) when cations are removed via clay formation. Due to the resulting high DIC level, modeled pH values are extremely low and porewaters are strongly undersaturated with respect to calcite (blue lines in fig. 7). Removing porewater Ca by CaCO3 precipitation instead of clay formation has only a small effect on pH and DIC (data not shown). Calcite saturation and measured pH values are, however, approached by the model when additional Ca is released from dissolving silicate phases and reprecipitated as CaCO3. This hidden Ca cycle where silicate-bound Ca is released into solution and quantitively precipitated as CaCO3 does not affect TA but induces a strong decline in DIC and a corresponding increase in pH and saturation state (black lines in fig. 7).

Saturation with respect to calcite is attained employing this approach while calculated pH values are still lower than those measured in porewaters. This may be due to the strongly simplified carbonate system considered in the model where HCO3- and CO32- are the only species contributing to alkalinity. A more complete model considering all species contributing to total alkalinity would probably yield somewhat higher and more realistic pH values (Torres et al., 2020). It should, however, be noted that pH values measured in porewater extracted from sediment cores are probably higher than in-situ values since CO2 can be lost from samples due to the pressure decline during core retrieval and the high in-situ partial pressure of CO2 (pCO2) in the samples. Hence, in-situ pCO2 values calculated with the model for 40 m sediment depth are two orders of magnitude higher than the atmospheric value (ca. 400 µatm) which will likely drive a significant diffusive CO2 and DIC loss from recovered porewater samples. In any case, the modeling confirms that additional Ca has to be released from silicate phases to provide sufficient Ca for carbonate precipitation such that porewaters attain saturation with respect to calcite. The model, hence, confirms the results of previous studies (Wallmann et al., 2008) and the conclusions obtained in section 6.1 employing stoichiometric reasoning.
The model also provides rates that can be used to quantify cation and alkalinity turnover in Bengal fan sediments considering cation uptake in silicate phases, Ca release from silicates and CaCO3 precipitation (table 11).
The rate of Ca release from silicates (1.865 µmol cm-2 yr-1 = 3.73 µeq. cm-2 yr-1, table 11) exceeds uptake rates of K and Mg (1.619 µeq. cm-2 yr-1, table 11) for the full model that considers all relevant processes. The rate of Ca release from silicates calculated for Bengal fan sediments is close to the corresponding rate calculated for terrigenous sediments deposited on the Sakhalin slope (1.6–1.9 µmol cm-2 yr-1, Wallmann et al., 2008) which may indicate that Ca release from silicates in anoxic sediments proceeds at similar rates over a range of different geological settings. Due to the net TA release, silicate alteration in Bengal fan sediments qualifies as marine silicate weathering. Rates of Ca release (1.865 µmol cm-2 yr-1) and carbonate precipitation (2.174 µmol cm-2 yr-1) indicate that up to 86 % of the Ca bound in authigenic CaCO3 is provided by silicate mineral dissolution and only 14 % by downward diffusion of seawater Ca.
It is possible that additional ions (e.g., Mg and Fe) are bound in authigenic carbonate (AC). Stable Mg isotope data indicate that a large fraction of Mg taken up in terrigenous sediments is in fact bound in AC rather than clay (Berg et al., 2019). Assuming that 50 % of the total Mg uptake (0.577 µmol cm-2 yr-1, table 11) is induced by carbonate formation, the required Ca release rate would drop to 1.58 µmol cm-2 yr-1. The ferrous iron uptake rate in carbonates may be estimated investigating the fate of H2S released during sulfate reduction which is largely removed from porewaters by pyrite formation. Ferric iron oxides can take up electrons released from H2S during pyrite formation and some of the ferrous iron formed during this process may be bound in AC as siderite (FeCO3):
H2S+12Fe2O3+14CO2→12FeS2+14FeO(bound in clays)+14FeCO3+H2O
The depth-integrated rate of sulfate reduction via DSR and AOM (2.031 µmol cm-2 yr-1, table 11) can be employed to estimate the rate of siderite formation as 0.51 µmol cm-2 yr-1 if pyrite formation follows the stoichiometry of the reaction above. In this case, the required Ca release rate would drop to 1.07 µmol cm-2 yr-1 and the composition of the AC phase would result as Ca0.67Mg0.13Fe0.23CO3. AC that is precipitated close to the sulfate penetration depth (ca. 40 m in Bengal fan sediments) is usually aragonite and high-magnesium calcite whereas carbonates precipitating in the underlying methanogenic zone typically include siderite and dolomite (Torres et al., 2020). The composition calculated above probably reflects a mixture of these carbonate assemblages. Ultimately, a better characterization of AC is required to decipher their chemical composition while Ca stable isotope data could be used to estimate the fractions of seawater and silicate derived Ca bound in these authigenic phases (Blättler et al., 2015). However, the modeling shows that most of the Ca bound in AC is provided by the dissolution of Ca-bearing silicates. Release of silicate-bound Ca exceeds rates of Mg2+ and K+ uptake in authigenic clays such that the alteration of silicates is dominated by marine silicate weathering rather than reverse weathering. The net TA production induced by these processes supports AC precipitation and, thereby, the inorganic fixation of POC-derived DIC in subsurface sediments.
AC formation is traditionally ascribed to TA generation via sulfate reduction where sulfate is reduced via DSR and AOM. The model results presented in table 11 and previous work (Torres et al., 2020; Wallmann et al., 2008), however, suggest that marine silicate alteration provides additional TA that may drive most of the observed carbonate precipitation. To better understand the contribution of sulfate reduction and silicate alteration, we conducted an additional series of model simulations. In these simulations, carbonate precipitation and dissolution are controlled by the saturation state of porewater with respect to calcite and the corresponding rate (RCalcite) is defined as:
RCalcite =kCalcite (Sat−1)
where kCalcite is a kinetic constant that is set to a large value of kCalcite = 0.01 yr-1 such that porewaters are forced to approach saturation. Sat is the saturation state with respect to calcite defined as Sat = CO32- x Ca2+/KSP. The solubility product of calcite (KSP) and the carbonate ion concentration (CO32-) are calculated using stoichiometric stability constants and equations valid for seawater (Zeebe & Wolf-Gladrow, 2001). The first of these model runs simulates the precipitation of calcite for Bengal sediments ignoring marine silicate alteration. In this simulation, TA is only generated via DSR and AOM. The model predicts that calcite precipitates in the sulfate-bearing sediment section with a peak in the AOM zone followed by calcite dissolution in the underlying methanogenic zone (fig. 8, red lines). The resulting depth-integrated rate of carbonate precipitation amounts to only 0.16 µmol cm-2 yr-1 which is more than an order of magnitude smaller than the rate obtained in the previous model with marine silicate alteration (table 11). This large differences clearly shows that most of the carbonate precipitation is driven by marine silicate alteration rather than DSR and AOM. An additional model run was conducted applying K+ and Mg2+ uptake in authigenic clays (fig. 8, blue lines). This simulation results in net carbonate dissolution and a corresponding down-core increase in dissolved Ca since TA is removed by cation uptake such that porewaters are undersaturated with respect to calcite over most of the sediment column even though TA is produced via DSR and AOM. Since cation uptake via clay formation removes TA and inhibits AC formation, AC formation cannot be ascribed to reverse weathering. A final simulation that considers all processes, including Ca release form silicate minerals, yields the best fit to the data (black lines) and a much larger depth-integrated rate of carbonate precipitation (2.31 µmol cm-2 yr-1) which is very close the value obtained in the model with prescribed cation uptake rates (table 11). The simulations, hence, confirm that AC formation is largely driven by Ca and TA release from reactive silicate phases rather than DSR and AOM.

7. Global cation turnover in subsurface sediments derived from pore water data
Porewater data from the scientific drilling program ODP/IODP were used to calculate major cation fluxes between surface sediments and the underlying sediment column across ca. 1 m sediment depth (Bradbury & Turchyn, 2019; Sun et al., 2016; Sun & Turchyn, 2014). These fluxes are based on a large data set (about 800 drill sites) and are derived from long sediment cores featuring significant concentration gradients created by early diagenetic processes. They show that Na is released from subsurface sediments over most of the global seafloor while Na uptake is observed over a smaller fraction of the global seafloor (Sun et al., 2016). Net Na release from subsurface sediments amounts to about 3.4 Tmol yr-1 (Sun et al., 2016). A significant fraction of this release may, however, be induced by evaporite (halite) dissolution (Sun et al., 2016). It may also be possible that the observed down-core increase in dissolved Na is related to burial of glacial seawater that was more saline and contained up to 3 % more Na than modern seawater under glacial maximum conditions (Wallmann et al., 2016). Since most of the sediment pile was probably buried under glacial rather than interglacial conditions (Wallmann et al., 2016), the down-core increase may partly reflect the Na difference between modern and mean Quaternary seawater modulated by diffusion and cation exchange. Shale data show that recent Quaternary shale deposits contain significantly more Na than older shale sequences (Wei & Algeo, 2020). This observation may imply that Na is released from fine-grained terrigenous sediments during shale diagenesis which could explain some of the net Na release from subsurface sediments observed at continental margins (Sayles, 1979; Sun et al., 2016). Global Na release from subsurface sediments into the surface layer (3.4 Tmol yr-1) is similar to the global Na flux from surface sediments into the overlying water column that has been estimated as 2.4 - 4.4 Tmol yr-1 (Sayles, 1979). The available data, hence, indicate that most of the Na release into seawater may be driven by subsurface processes at > 1 m sediment depth.
Potassium and Mg uptake is observed over almost the entire global seafloor (Sun et al., 2016). The global K uptake in subsurface sediments was calculated as 1.3 Tmol yr-1 (Sun et al., 2016). A significant down-core shift observed in the stable isotopic composition of dissolved K confirms that K is removed from porewaters and taken up in authigenic clays (Ramos et al., 2018). The Mg uptake was estimated as 1.7 Tmol yr-1 for the global ocean and 0.93 Tmol yr-1 when open ocean areas with <200m sediment thickness were excluded (Sun et al., 2016). A similar Mg flux of 1.1 ±0.5 Tmol yr-1 was derived when a machine-learning approach was applied to calculate global fluxes from point measurements (Berg et al., 2019). Stable Mg isotope data measured in porewater samples (Berg et al., 2019) suggest that a large fraction of Mg uptake is caused by authigenic carbonate precipitation (Berg et al., 2019). Hence, precipitation of Mg-bearing authigenic carbonates may contribute significantly to the Mg uptake in subsurface sediments. In some continental margin sediments, a down-core increase in dissolved Mg is observed that can be attributed to the dissolution of Mg-bearing minerals (Scholz et al., 2013; Wallmann et al., 2008). Thus, surface sediments deposited on the slope of Sakhalin Island contain 3–4 wt-% pyroxene and 0.3–0.9 wt-% olivine that are highly reactive and dissolve at depth (Wallmann et al., 2008). However, Mg-uptake in authigenic phases is the dominant process in most sediments. The global uptake of seawater K and Mg across the sediment/seawater interface has been estimated as 1.6–2.0 Tmol K yr-1 and 3.3–5.2 Tmol Mg yr-1, respectively (Sayles, 1979). These fluxes are larger than the fluxes from surface sediments into the underlying sediment column (1.3 Tmol K yr-1, 1.1 Tmol Mg yr-1) which implies that a large fraction of K and Mg uptake occurs already in surface sediments (Sayles, 1979).
Calcium is released from subsurface sediments in open ocean areas were pelagic carbonates dissolve whereas Ca uptake is observed at continental margins (Sun & Turchyn, 2014). Ca uptake at continental margins has been estimated as ca. 1 Tmol yr-1 and largely ascribed to AC formation (Sun & Turchyn, 2014). A much smaller Ca uptake in AC (0.135 Tmol yr-1) was derived from ODP/IODP porewater data using a machine-learning approach that, however, tends to underestimate basin-wide Ca uptake fluxes (Bradbury & Turchyn, 2019). Our observation that most of the Ca bound in AC is derived from silicate phases rather than seawater (table 11) strongly indicates that the total rate of AC precipitation is higher than the Ca uptake flux from seawater derived from Ca porewater gradients. The global rate of AC formation in subsurface sediments has previously been estimated as 1–4 Tmol yr-1 (Torres et al., 2020) which is consistent with our observations. Ca is, however, rapidly released from terrigenous surface sediments into ambient bottom waters with a rate of 2.7–3.7 Tmol yr-1 (Sayles, 1979). It, thus, seems that Ca is lost from, both, surface and subsurface sediments by dissolution of Ca-bearing silicate minerals and fixed in subsurface sediments by AC precipitation.
Dissolution of feldspars and other aluminosilicates can only proceed in subsurface sediments if dissolved Al and Si released by this process are efficiently removed from solution by authigenic mineral formation. Without this removal process, porewaters in subsurface sediments would attain high Al and Si concentrations such that the porewater would be oversaturated with respect to most aluminosilicate phases. The observed uptake of K and Mg in authigenic solids implies that K- and Mg-bearing clays are formed at depth. Mg-illite (K0.85Mg0.25Al2.35Si3.4O10(OH)2) is included in the SIT database and can be employed to test whether porewater saturated with respect to this specific 2:1 sheet silicate is undersaturated with respect to plagioclase feldspars such that these minerals can dissolve at depth. PHREEQC calculations with the SIT database show that marine porewater with a Si concentration of 200 µM and an Al content of 6.3 nM is saturated with respect to Mg-illite (SI = 0.0) but undersaturated with respect to albite (SI = -0.6 for low-solubility albite) and anorthite (SI = -7.9) at a pressure of 400 bar, a temperature of 15 °C and a pH of 7.0. This example illustrates that formation of Mg-illite and other authigenic 2:1 clays may reduce dissolved Si and Al to sufficiently low concentrations such that not only anorthite but also albite dissolution can occur in subsurface sediments and provide dissolved Na that is released at the seabed and Ca that is fixed in authigenic carbonates. It should be noted that organic complexation of Al may decrease Al activities in anoxic porewaters such that Na plagioclase dissolution may also proceed at higher Al and Si concentrations and pH values than those used in the example above (Wallmann et al., 2008). Illite was chosen for this example calculation since it is the most abundant authigenic sheet silicate formed in sedimentary basins (Milliken, 2003). Plagioclase dissolution coupled to clay formation is further indicated by mineralogical and solid phase chemical data that show a down-core decrease in plagioclase contents in deep sediments and a corresponding increase in authigenic clay and carbonate contents (Milliken, 2003; Torres et al., 2022). Our equilibrium calculation illustrates the close coupling between feldspar dissolution and authigenic clay formation. Clays and other authigenic aluminosilicates can only form when Al is provided by e.g., feldspar dissolution while feldspars can only dissolve if dissolved Al is efficiently removed by authigenic clay formation.
8. Global data sets on marine sediment composition
In the following section, we employ global data sets on the chemical composition of sediments and sedimentary rocks (table 12) to control whether our estimates on cation fluxes derived in the previous sections are consistent with these solid phase data. The composition of terrigenous sediments deposited on the continental shelf (shale) and in deep-sea fans yield almost identical cation/Al ratios (table 12). The difference between these marine sediment ratios and those in riverine particles after cation exchange with seawater confirm that K and Mg are taken up from seawater during marine silicate alteration while Na and Ca are released from solid phases. Trends observed in these data are, hence, consistent with those discussed in the previous sections.
Rates of cation release from silicate minerals and uptake of cations in authigenic phases can be calculated from these data assuming that Al is conserved in the solid phase. The global flux of particulate Al into the ocean results as 51 Tmol yr-1 assuming a flux of riverine suspended matter of 15 x 1015 g yr-1 and a mean Al content in these particles of 3396 µmol g-1 (table 1 and table 12). Fluxes of lattice-bound cations are estimated by multiplying the difference in cation/Al ratios between riverine particles after cation exchange with seawater (table 2, table 12) and mean ratios observed in shale that are printed as bold numbers in table 12.
According to this approach, global cation fluxes can be estimated as: +0.5 ± 1.7 Tmol Na yr-1, -2.9 ± 1.4 Tmol K yr-1, -1.7 ± 2.0 Tmol Mg yr-1, and +1.4 ± 3.8 Tmol Ca yr-1 where the positive sign indicates net release into seawater and the negative sign designates net uptake in authigenic solids. These estimates are associated with very large uncertainties since they are calculated as differences between two large numbers, each having considerable errors. Nevertheless, they fall into the same range as estimates for cation fluxes derived in previous sections which implies that the global compilations of solid phase compositions are consistent with the trends observed in porewater data and regional studies on cation turnover during marine silicate alteration.
9. Global cation, alkalinity, silica and DIC fluxes induced by marine alteration of terrigenous sediments
In the following section, we derive and summarize our best estimates for global fluxes induced by alteration of riverine particles in the marine environment (fig. 9, table 13).

Sodium porewater fluxes are difficult to estimate due to high concentrations of Na in seawater. Hence, Na porewater profiles exhibit no significant curvature within surface sediments (Sayles, 1979) since Na gradients cannot be resolved against the high Na background. Nevertheless, the lack of curvature in most surface sediments may imply low Na release rates in surface sediments. Thermodynamic equilibrium calculations are consistent with this interpretation. They indicate that seawater is undersaturated with respect to albite (table 4), the major Na-bearing primary silicate mineral, while porewaters of surface sediments attain saturation with respect albite already at shallow sediment depths (table 7).
Nevertheless, Amazon shelf data indicate a strong release of lattice-bound Na into seawater when extrapolated to global scale (3.1 ± 2.5 Tmol yr-1, section 5.3). It is, however, questionable whether the Amazon shelf is representative for the global shelf since albite dissolution is probably promoted by frequent resuspension events in the Amazon mud belt that exposes sediments to undersaturated seawater and by low salinities in the river mouth region (section 5.3). In other shelf settings where sediments accumulate and are not frequently resuspended in seawater, albite should not dissolve (table 7) but should be buried to deeper strata. Porewater profiles in deep-sea fan sediments indicate Na uptake in deeper sediment layers (fig. 3 and fig. 4) even though a global compilation of subsurface porewater gradients (Sun et al., 2016) seems to imply a net Na release from subsurface sediments (3.4 Tmol yr-1). Some of the down-core Na increase observed in deep sediments may reflect evaporite dissolution and the difference in dissolved Na concentrations between modern and mean Quaternary seawater (section 7). However, solid phase data show that plagioclase feldspars are replaced by authigenic clays in deep sediments (Milliken, 2003; Torres et al., 2022) while thermodynamic equilibrium calculations show that albite can dissolve in deep sediments if authigenic illite and 2:1 clay formation is sufficiently fast (section 7).
The data presented in the previous sections suggest that Na-rich plagioclase (albite) is dissolved in seawater (0.06 Tmol yr-1, section 4.3), in surface sediments that are frequently resuspended in seawater (e.g., Amazon shelf, section 5.3), in permeable surface sediments that are constantly flushed by seawater (section 5.2) and in deep sediments where clay mineral formation is fast enough to reduce dissolve Al and Si concentrations to such a low level that albite can dissolve (section 7). Global shale compositions also indicate that dissolved Na is released from shelf sediments (0.5 ± 1.7 Tmol yr-1, section 8), albeit at a lower rate than predicted by porewater data. In conclusion, the available data suggest that the global release rate of lattice-bound Na during marine silicate alteration may be conservatively estimated as 1.6 ± 1 Tmol yr-1 (fig. 9). Na uptake from seawater via cation exchange (1.3 ± 0.8 Tmol yr-1, table 2, fig. 9) seems to be almost as large as Na release from silicate minerals (1.6 ± 1.0 Tmol yr-1). The overall Na exchange flux between terrigenous particles and seawater is, hence, close to zero since seawater Na uptake on suspended particles in the coastal zone induced by cation exchange largely compensates for the release of lattice-bound Na from sediments (table 13).
Potassium is rapidly taken up in authigenic aluminosilicates such as illite. Strong curvature in porewater profiles indicates significant K uptake in terrigenous surface sediments (0.8–1.0 Tmol yr-1, Sayles, 1979) while solid phase data from the Amazon shelf suggest a global K uptake in surface sediments of 1.8 ± 0.9 Tmol yr-1 (section 5.3). Additional K is taken up in subsurface sediments (1.3 Tmol yr-1, Sun et al., 2016) while global shale data indicate a total K uptake of 2.9 ± 1.4 Tmol K yr-1 (section 7) which is remarkably similar to the sum of uptake fluxes in surface and subsurface sediments (2.1–3.1 Tmol K yr-1). K uptake in authigenic clays induced by marine silicate alteration can, thus, be estimated as 2.5 ± 1.0 Tmol yr-1 (fig. 9). Cation exchange with seawater in the coastal zone induces further K uptake of 0.2 ± 0.05 Tmol yr-1 (table 2, fig. 9) such that the total K uptake from seawater can be estimated as 2.7 ± 1.0 Tmol yr-1 (table 13).
Magnesium is taken up in authigenic clays and carbonates. Uptake in terrigenous surface sediments, derived from porewater data, amounts to 1.0 to 3.3 Tmol yr-1 (Sayles, 1979) while up-scaling of Amazon shelf data indicate Mg uptake in surface sediments of 1.2 ± 0.6 Tmol yr-1 (section 5.3). Additional Mg is taken up in subsurface sediments (0.9–1.3 Tmol yr-1, Sun et al., 2016) where a significant fraction is bound in AC (Berg et al., 2019). Shale data (section 8) suggest a total Mg uptake of 1.7 ± 2.0 Tmol Mg yr-1. Considering all available data, total Mg uptake in sediments via authigenic clay and carbonate formation may be estimated as 2.0 ± 1.0 Tmol yr-1. About 0.5 Tmol yr-1 may be bound in AC and 1.5 Tmol yr-1 in authigenic clays. Cation exchange with seawater in the coastal zone induces further Mg uptake of 0.4 ± 0.2 Tmol yr-1 (table 2) such that the total Mg uptake from seawater can be estimated as 2.4 ± 1.0 Tmol yr-1 (table 13).
Calcium is released from Ca-rich plagioclase feldspars that are highly soluble in seawater (table 4), surface sediments (table 7) and subsurface deposits (table 11). Other soluble Ca-bearing silicates such as tremolite (amphibole) and diopside (pyroxene) may contribute to the Ca release observed in sediments (table 7). Ca is released from riverine particles in contact with seawater (0.15 Tmol yr-1, section 4.4) and terrigenous surface sediments as indicated by porewater gradients (2.7 to 3.7 Tmol yr-1, Sayles, 1979), Amazon shelf data (0.5 ± 0.3 Tmol yr-1, section 5.3) and reactive transport modeling (2.9 Tmol yr-1, fig. 2). Ca derived from silicate dissolution in subsurface sediments is removed from ambient porewaters by AC formation. The downward flux of Ca observed in subsurface sediments (1.0 Tmol yr-1, Sun et al., 2016) is also driven by this process. The rate of AC formation exceeds this downward flux since a large fraction of the Ca bound in AC is derived by in-situ silicate dissolution (table 11). The total rate of AC formation in subsurface sediments may be conservatively estimated as 2.5 ± 1 Tmol yr-1 where about 1 Tmol Ca yr-1 and 0.5 Tmol Mg yr-1 are taken up from seawater and at least 1 Tmol Ca yr-1 is derived from silicate mineral dissolution (fig. 9). Shale data indicate a net Ca release of 1.4 ± 3.8 Tmol yr-1 (section 8) that may reflect the difference between Ca release from silicates and Ca uptake in authigenic carbonates. Given the available data, the Ca flux from surface sediments into seawater induced by silicate mineral dissolution may be estimated as 2.5 ± 1.0 Tmol yr-1 (fig. 9). Further Ca is released by the dissolution of riverine particles in contact with seawater (0.15 Tmol yr-1) and cation exchange (1.2 ± 0.2 Tmol yr-1) such that the total Ca release into the ocean results as 3.8 ± 1.2 Tmol yr-1 (table 13).
Alkalinity (TA) turnover during marine silicate alteration can be derived from major cation fluxes (eq 3). Alteration of silicates in marine sediments has no effect on seawater TA since benthic release fluxes of Na and Ca (Na: 1.5 ± 1 Tmol yr-1, Ca: 2.5 ± 1.0 Tmol yr-1, total: 6.5 ± 3.0 Teq. yr-1) are as large as cation uptake fluxes (K: 2.5 ± 1.0 Tmol yr-1, Mg: 2.0 ± 1.0 Tmol yr-1, total: 6.5 ± 3.0 Teq. yr-1) on equivalent basis (fig. 9). Cations and TA are released during the dissolution of silicates in contact with seawater (Na: 0.06 Tmol yr-1, Ca: 0.15 Tmol yr-1, TA: 0.36 Teq. yr-1, fig. 9). These fluxes are, however, much smaller than the benthic fluxes and their uncertainties. TA that is produced by the dissolution of Ca-bearing silicates in subsurface sediments is removed by AC formation before it can reach the ocean. We, hence, conclude that seawater TA is largely unaffected by marine silicate alteration. The major effect of marine silicate alteration is a change in the major cation composition of seawater. It induces Ca and Na release into the ocean. Release of lattice-bound Na is largely balanced by Na uptake from seawater via cation exchange whereas cation exchange induces further Ca release. K and Mg are taken up from seawater in, both, authigenic phases and via cation exchange (fig. 9).
Comparison with terrestrial weathering fluxes indicates that Na turnover induced by marine silicate alteration has no significant effect on the Na budget of the global ocean since riverine Na fluxes induced by terrestrial silicate weathering and other processes are at least one order of magnitude higher than the marine alteration flux (table 13).
In contrast, K uptake in marine sediments plays a major role in the marine K cycle since the marine K uptake flux exceeds the riverine flux of K into the ocean (table 13). Stable K isotope data confirm this interpretation (K. Wang et al., 2020, 2021; Zheng et al., 2022). They show that seawater K (δ41K = +0.12 o/oo) is strongly enriched in the heavy isotope (41K) with respect to river water (δ41K = -0.38 o/oo) and hydrothermal fluids (δ41K = -0.46 to -0.15 o/oo), which can only be explained by the preferential removal of the light K isotope (39K) in authigenic clays. Authigenic clays formed during low-temperature alteration of oceanic crust (H. Liu et al., 2021; Ramos et al., 2020) and during alteration of marine sediments (Hu et al., 2020; Ramos et al., 2018) are indeed strongly enriched in 39K with respect to seawater. The large K sink in authigenic clays derived above (table 13) clearly exceeds current estimates of riverine (table 13) and hydrothermal K inputs (K. Wang et al., 2020). Our data, hence, imply that K concentrations in seawater are not constant but may currently decline over time. A decline in seawater K may be induced by elevated rates of continental erosion and terrigenous sedimentation over the Quaternary and late Cenozoic (Hay et al., 2006) where enhanced input of terrigenous particles may promote authigenic clay formation and K removal from seawater. However, more data on the geochemical and isotopic evolution of seawater are required to validate this hypothesis.
Marine silicate alteration also affects the marine Mg budget since total uptake from the ocean including clay formation, authigenic carbonate precipitation and cation exchange (2.4 ± 1.0 Tmol yr-1, table 13) approaches the riverine flux (5.3 ± 1.0 Tmol yr-1, table 13). Stable Mg isotope data also indicate that a significant fraction of riverine Mg is removed from the ocean into terrigenous sediments (Berg et al., 2019). According to our estimates, this fraction may be even higher than previously estimated (Berg et al., 2019) such that less Mg needs to be taken up in ocean crust during high- and low-temperature alteration to close the marine Mg budget. Evaluation of brine inclusion data from evaporite deposits suggests that Mg concentrations in seawater have increased significantly over the Cenozoic (Brennan et al., 2013; Horita et al., 2002). This increase indicates that current Mg sources exceed current removal rates. The imbalance is probably not induced by marine silicate weathering since the late Cenozoic rise in continental erosion should lead to an increase in Mg removal. Hence, other processes such as a decline in hydrothermal uptake (Higgins & Schrag, 2015) or dolomite formation (Holland, 2005) seem to be responsible for the late Cenozoic Mg rise.
Calcium release induced by marine silicate alteration exceeds Ca fluxes derived from terrestrial silicate weathering according to our estimates (table 13). Hence, weathering of Ca-bearing silicate minerals may occur mostly in the marine realm rather than the terrestrial environment. This observation can be explained by the high solubility and reactivity of anorthite in seawater and its long residence time in marine sediments. However, the marine Ca budget is dominated by carbonate weathering and accumulation of neritic and pelagic carbonates at the seabed such that cycling of silicate-bound Ca has only a moderate impact on the evolution of Ca concentrations in seawater (Farkaš et al., 2007; Wallmann, 2001).
Marine silicate alteration significantly affects the dissolved Si budget of the global ocean. Dissolution of silicate minerals in contact with seawater may provide about 2.8 Tmol Si yr-1 (fig. 9) while 1.9 ± 0.7 Tmol Si yr-1 (Tréguer et al., 2021) are released from surface sediments (fig. 9). The total flux (4.7 ± 0.7 Tmol Si yr-1, table 13) approaches the global riverine flux of dissolved Si into the ocean (7.0 Tmol Si yr-1 , table 13). Even larger marine Si release rates are attained if the high quartz dissolution rate proposed for the global surf zone is valid (3–5 Tmol Si yr-1 Fabre et al., 2019). It is, hence, likely that marine silicate alteration is a relevant process that needs to be considered in future marine Si budgets (Geilert, Grasse, Wallmann, et al., 2020) even though rapid internal Si cycling via biogenic opal formation and dissolution dominates the spatial distribution of dissolved Si in the modern ocean (Dale et al., 2021; Tréguer & De La Rocha, 2013).
Large amounts of silicate-bound Al and Fe are released via silicate dissolution in seawater (1.7 Tmol Al yr-1, 0.4 Tmol Fe yr-1, section 4) and surface sediments (5.2 Tmol Al yr-1, section 5). Almost all of the dissolved Al and Fe is subsequently fixed in authigenic phases. However, even a small leakage of dissolved Al and Fe into seawater would have a large effect on the cycling of these elements in the global ocean. More work needs to be done to quantify Al and Fe fractions that stay in solution to better understand the cycling of these elements at continental margins and in the global ocean (Homoky et al., 2016).
The DIC content of seawater and atmospheric partial pressure of CO2 may be affected by burial of authigenic carbonate (AC) on geological timescales (Schrag et al., 2013). AC burial sequesters metabolic DIC that is released during anaerobic POC degradation in sediments. Without AC formation, metabolic DIC would be transported back into the ocean. However, this benthic DIC reflux is mitigated by AC formation such that the formation and burial of these carbonates removes DIC that is initially bound in phytoplankton during marine primary production, subsequently released during POC degradation in sediments, and finally buried as sedimentary inorganic carbon. It should, however, be noted that the global rate of benthic POC degradation (212 Tmol yr-1) exceeds the rate of AC formation (2.5 Tmol yr-1, Fig. 9) by two orders of magnitude (Jørgensen et al., 2022) which indicates that only a small fraction of metabolic DIC is fixed in AC. On the other hand, the global rate of POC burial in marine sediments (11.7 Tmol yr-1) falls into the same order of magnitude as is the rate of AC burial (Wallmann et al., 2012). This implies that the DIC content of seawater may be reduced by AC burial on geological timescales. In contrast to pelagic and neritic deposits, AC carries the negative carbon isotopic signature of POC. AC burial may, hence, also affect the isotopic composition of seawater DIC (Schrag et al., 2013). Since seawater TA is not significantly affected by marine silicate alteration, the decrease in DIC induced by AC formation may drive CO2 uptake from the atmosphere and a small but persistent draw-down of atmospheric CO2.
Our model results clearly show that AC precipitation is largely driven by a hidden cycle in anoxic subsurface sediments where Ca and TA released during the dissolution of Ca-bearing silicate minerals are quantitatively removed by AC formation (fig. 8). The modern rate of AC burial is, hence, ultimately limited by the rate of continental erosion and the input flux of Ca-bearing silicate minerals to anoxic subsurface sediments. Since sulfate reduction plays only a minor role in AC precipitation (fig. 8), AC was also formed in ancient sediments that were covered by sulfate-depleted seawater over most of the Precambrian (Algeo et al., 2015). The frequent occurrence of AC in Precambrian sediments (Schrag et al., 2013; J. Y. J. Wang et al., 2023) may, hence, be partly attributed to the dissolution of Ca-bearing silicate phases in marine sediments.
10. Conclusions
Alteration of riverine particles in seawater and marine sediments leads to a significant release of dissolved Ca and Si into the ocean and a strong uptake of seawater K and Mg in terrigenous sediments. Ca release is largely induced by dissolution of plagioclase (anorthite) that is highly reactive and soluble in seawater and sediments. Ca is further released from riverine particle surfaces by cation exchange. Si release is induced by the dissolution of feldspars, clays, and quartz in seawater and sediments and mitigated by the formation of authigenic clays. K and Mg are removed from seawater by cation exchange and the formation of authigenic minerals that bind large amounts of these seawater cations in their lattice structure. Most of the cation turnover occurs in marine surface sediments offering favorable conditions for marine silicate alteration. Subsurface sediments act as a sink for dissolved K, Mg and Ca where Ca and significant fractions of Mg are removed from anoxic porewaters by authigenic carbonate formation. A large fraction of Ca bound in authigenic carbonates is derived from marine silicate weathering in subsurface sediments rather than Ca uptake from seawater. Na uptake via cation exchange largely compensates for Na release from feldspars such that the net Na flux is small und insignificant. Current marine budgets of Na, K, Mg, Ca and Si need to be updated to include our new and improved estimates of fluxes induced by marine silicate alteration (fig. 9, table 13).
Total alkalinity in the modern ocean is not significantly affected by marine silicate alteration because K and Mg uptake in authigenic clays compensates for Ca and Na release induced by feldspar dissolution. These opposing reactions are closely coupled since Al required for clay formation is largely provided by feldspar dissolution while Al removal in authigenic clays promotes and maintains feldspar dissolution in marine sediments. A small decline in seawater DIC is induced by the burial of authigenic carbonates that is largely driven by the dissolution of Ca-bearing silicate minerals in anoxic subsurface sediments. This DIC decline may induce a slow but persistent draw-down of atmospheric CO2 on geological timescales.
In contrast to marine silicate alteration, terrestrial silicate weathering is a major sink for atmospheric CO2 and source for seawater alkalinity. It is driven by the hydrological cycle where rain water precipitates on land and takes up cations during chemical weathering. Marine alteration, instead, induces, both, cation release (Na and Ca) and cation uptake in solids (K and Mg) since silicate minerals are exposed to cation-rich seawater during marine alteration rather than cation-depleted freshwater. Marine alteration of riverine particles is, hence, only of minor importance for the carbon cycle but has a strong effect on the chemical composition of seawater. Our improved estimates in cation and silica fluxes induced by marine alteration of riverine particles should, hence, be considered in major cation and silica budgets of the modern ocean and in models simulating the geochemical evolution of seawater.
Acknowledgements
We are grateful for the insightful comments by the reviewer John Higgins, an additional anonymous reviewer and the helpful supervision by the editor Mark Brandon and the associate editor Daniel Ibarra. Our manuscript has been significantly improved during the review process thanks to the support by these colleagues. Funding: This work was supported by the German Federal Ministry of Education and Research, Grant No 03F0895, Project RETAKE, DAM Mission “Marine carbon sinks in decarbonization pathways” (CDRmare). The work was further supported by the Emmy Noether Project ICONOX “Iron cycling in continental margin sediments and the nutrient and oxygen balance of the ocean”.
Author Contributions
Klaus Wallmann developed the concept for this paper, performed the numerical simulations and wrote most of the text. Sonja Geilert and Florian Scholz provided expertise on marine silicate alteration and contributed to the text. Sonja Geilert also provided the interpretation of stable isotope data while Florian Scholz contributed data and insights on Amazon shelf sediments.
Data Availability
The contribution does not include original data. All data used in the contribution have been previously published elsewhere as indicated in the text.
Editor: C. Page Chamberlain, Associate Editor: Daniel Ibarra