

Abstract
Thawing of ice-rich permafrost soils in sloped terrain can lead to activation of retrogressive thaw slumps (RTSs) which make organic matter available for decomposition that has been frozen for centuries to millennia. Recent studies show that the area affected by RTSs increased in the last two decades across the pan-Arctic. Combining a model of soil carbon dynamics with remotely sensed spatial details of thaw slump area and a soil carbon database, we show that RTSs in Siberia turned a previous quasi-neutral ecosystem into a strong source of carbon dioxide of 367 ± 213 gC m-1 a-1. On a global scale, recent CO2 emissions from Siberian thaw slumps of 0.42 ± 0.22 Tg carbon per year are negligible so far. However, depending on the future evolution of permafrost thaw and hence thaw slump-affected area, such hillslope processes can transition permafrost landscapes to become a major source of additional CO2 release into the atmosphere.
Export citation and abstract BibTeX RIS

Original content from this work may be used under the terms of the Creative Commons Attribution 4.0 license. Any further distribution of this work must maintain attribution to the author(s) and the title of the work, journal citation and DOI.
1. Introduction
Air temperature in the Arctic is rising almost four times faster than the global mean due to the Arctic amplification of global warming (Rantanen et al 2022). This accelerated warming is a strong driver of thawing terrestrial permafrost (Biskaborn et al 2019, Smith et al 2022), especially of a gradual deepening of the active layer (Park et al 2016, Peng et al 2016). Furthermore, disturbances to soil layers which insulate the permafrost, including fires or other damage to organic soils horizons or vegetation, as well as changing snow dynamics (Porada et al 2016, Beer et al 2018, Heim et al 2022) can cause even more rapid thaw through additional alteration of the soil thermal regime. Especially in locations with a high amount of segregated and unevenly distributed ground ice, such as large ice wedges, or massive remnants of buried glacial ice, melting can result in a drastic change of the ground leading to rather rapid and abrupt permafrost landscape changes (Nitzbon et al 2020) such as thermo-erosional gullies and valleys (Morgenstern et al 2021), thermokarst lake dynamics (Grosse et al 2013), coastal erosion (Günther et al 2013), or retrogressive thaw slumps (RTSs) (Burn and Lewkowicz 1990). Both processes, gradual and abrupt thawing, lead to widespread landscape changes in permafrost regions and pose a threat to Arctic communities and infrastructure, ecosystems, and carbon pools, but differ in spatial and temporal scales.
Currently, only gradual permafrost thaw is accounted for in global climate models. While gradual thaw impacts a larger region than abrupt thaw, Turetsky et al (2019) estimated that greenhouse gas emissions from abrupt thaw will increase permafrost carbon release projections, which are based on gradual thaw, for 2300 by about 50%, hence contributing substantially to greenhouse gas emissions from permafrost regions. The pan-Arctic area of such ground failures and landscape changes due to permafrost thawing and the resulting alteration of the carbon cycle processes are still unclear. Combining broad-scale remote sensing approaches to determine landscape scale changes from permafrost thaw with modelling of carbon dynamics will help quantifying the impacts of abrupt thaw at continental scales. For example, Runge et al (2022) estimated the area of RTS in Siberia during the past two decades (1999–2020) based on high resolution remote sensing data across an 8 million km2 study region. Such datasets provide a unique opportunity to explore the scaling of field measured greenhouse fluxes from RTS with numerical modelling.
RTS result from slope failure due to abrupt thawing of ice-rich permafrost. They mostly occur along shorelines of lakes, rivers, and coastlines. They are mass-wasting features, which after initial detachment failure and the exposure of ice-rich soils consist of a headwall, a muddy slump floor and often a drainage channel. The slope-failure processes associated with RTS formation and growth expose permafrost soil layers that have been frozen in the deep subsoil for hundreds or thousands of years. In RTS, these layers become part of the active layer and erode quickly due to the thermo-erosional processes driving RTS growth. Mudflows, originating from the headwalls, flow across the thaw slump floors and usually exit through small meltwater gullies into downstream environments such as lakes, streams, or the Arctic Ocean (Lantuit and Pollard 2005). As a consequence, previously frozen terrestrial organic matter will be partly exported to aquatic systems and further processed in there (Beel et al 2020, Kokelj et al 2021). In addition, microbes will start to mineralize the organic matter that has been frozen for a long time and is exposed in RTS, releasing greenhouse gases such as carbon dioxide or methane (Knoblauch et al 2021). The geomorphological and biogeochemical processes in RTS have the potential to release greenhouse gases from thawing permafrost much faster than due to a gradual deepening of the active layer. For instance (Knoblauch et al 2021) estimated a CO2 release of 160–180 gC m-1 a-1 from a RTS in Northeast Siberia. In this study, we focus on the CO2 release from the RTS soils, i.e. material that has not been exported to aquatic systems.
At a continental to global scale, detailed estimates of CO2 release from RTS based on combined field studies, remote sensing and models are lacking. In this study, we integrate a dynamic decomposition model with a recent remote sensing map and a soil carbon database to estimate recent carbon dioxide emissions from RTS in Siberia. The following research questions are addressed:
(1) What is the amount of previously frozen soil organic matter available for mineralization due to recent RTS development at the continental-scale in Siberia? (2) How much CO2 has potentially been recently released from to RTSs to the atmosphere in Siberia in 1999–2020? (3) Has this estimated additional carbon release to the atmosphere any impact on the global carbon cycle?
2. Methods
2.1. Estimation of organic matter mineralization at thaw slumps
We estimated the amount of annually mineralized organic matter which is released as CO2 to the atmosphere using a dynamic 2-pool first-order decomposition model implemented in MathWorks MATLAB R2022b following Andrén and Kätterer (1997) and Beer et al (2022). Model parameters were taken from Knoblauch et al (2013). To account for soil temperature seasonality and vertical distribution, we assumed the decomposition rate constant k being temperature dependent following a Q10-model (equation (1)):
where kref are the parameter values taken from Knoblauch et al (2013), and Tref is the corresponding temperature (4 °C). We assumed the parameter Q equals to 2 (Schädel et al 2016, Vaughn and Torn 2019).
We applied this model to all detected RTS across the entire study area in Siberia. The model required several variables as input (see sections below): location and area of the thaw slumps, mean soil temperature seasonality for topsoil and subsoil, and initial soil organic carbon stocks. Based on the availability of soil temperature data, we conducted the calculations at a 0.5° grid cell scale. First we defined a 0.5° grid and determined for each cell the areal fraction of RTS, topsoil and subsoil temperature monthly means, and initial soil organic matter content. Then, the dynamic model has been run using these boundary conditions.
We accounted for uncertainty of model parameters using all the 48 parameter sets from Knoblauch et al (2013) representing Holocene and Pleistocene soils from Kurungnakh (supplemental material). The uncertainty of thaw slump area correction and soil organic matter stocks were reported as standard deviations. For each grid cell we resampled a normal distribution representing that standard deviation and the means of area and organic matter stocks using a vector of ten values for both variables. As a result, we estimated carbon emissions 4800 times for each 0.5 grid cell and reported the mean and standard deviation of all these results from all grid cells.
2.2. RTS area estimation
Active RTS were mapped across Northeast Siberia firstly to identify their distribution at continental scale, secondly to derive their annual thaw dynamics from 1999 to 2020, and thirdly to determine the terrestrial area currently impacted by rapid thaw from thaw slumps. To achieve this, we applied the Landsat-based detection of Trends in Disturbance and Recovery (LandTrendr) algorithm, which performs spectral-temporal segmentation from time series data to identify disturbance events and recovery periods from annual Landsat mosaics (Kennedy et al 2010). The algorithm is implemented as LandTrendr-Google Earth Engine (Kennedy et al 2018). We adapted and parameterised the LT-GEE algorithm to be sensitive to the spectral change associated to RTS thawing dynamics and to detect their annual thawing dynamics in Northeast Siberia (Runge et al 2022).
Firstly, we expanded the data scope from Landsat-only to also include Sentinel-2 images for an improved study area coverage in the northern high latitudes (Runge and Grosse 2020), and implemented spectral band adjustments between Sentinel-2 and Landsat for harmonized Landsat and Sentinel-2 annual mosaics (Runge and Grosse 2019). Secondly, we created ground truth data of individual RTS in the study area with TimeSync (Cohen et al 2010) to parameterise the required run parameters of LT-GEE based on the tasselled cap greenness spectral index (Huang et al 2002). Lastly, we ran LT-GEE with this parameterisation for the study area for the time period 1999–2020. Additionally, we performed spatial masking and a binary classification to limit the LT-GEE results to RTS and exclude other disturbances with a similar spectral signature, such as fire scars and landslides. With this, the adapted LT-GEE identifies the change in spectral signature associated to the change of land cover from (intact) vegetation to bare soil and ground due to thaw slumping within the assessment period. Therefore, the results represent active RTS as in newly disturbed area resulting from initiation, re-initiation of stabilised RTS, and lateral growth of RTS from 2000 to 2019. This mapping approach cannot detect and consider old, stabilised and revegetated RTS as their spectral signature differs strongly. It further neglects stabilisation and vegetation encroachment and succession within the RTS potentially following a disturbance within the assessment period. In total, 50 895 active RTS were identified, which affected a total area of 868 57 km2 by 2020. The mapped active RTS vary in size with a mean size of 1.7 ha. The smallest and largest mapped RTS were constrained by a minimum (0.36 ha) and maximum (15 ha) mapping unit, which had to be applied to ensure reliable RTS mapping. These RTS sizes overall agree well with other studies stating RTS sizes ranging from 0.15 ha to 52 ha of mega slumps (Günther et al 2015, Kokelj et al 2015, Lacelle et al 2015, Ramage et al 2017). There is a small bias towards larger slumps following Landsat's 30 m spatial resolution but the most commonly occurring RTS sizes are captured. The temporal analysis of rapid thaw dynamics showed initially an overall steady increase in RTS-affected area in Northeast Siberia with a more abrupt increase from 2016 onward (Runge et al 2022).
The RTS area derived from Landsat and Sentinel-2 data (30 m resolution) was then validated with very high resolution (VHR) multispectral RapidEye (RE) imagery (5 m resolution) across the study area for 2018 and 2019. The resulting bias and uncertainty range of the 30 m resolution product were used to correct the initial thaw slump area estimate. VHR multispectral imagery is limited due to frequent cloud cover and the large extent of the study area, hence we performed the validation on five focus sites across the study area.
2.3. Soil organic carbon stocks at 0.5° grid cell scale
The data on spatial distribution of soil organic carbon stocks is derived from the Northern Circumpolar Soil Carbon Database, version 2 (NCSCDv2; see Hugelius (Hugelius et al 2013, 2014)). This dataset was created by combining several different national or regional soil classification maps across the northern permafrost region with field-based soil profile data. The coverage of different soil types from polygon-based soil classification maps were digitized into a Geographic Information System and harmonized to a common soil classification scheme, the United States Department of Agriculture Soil Taxonomy (Soil Survey Staff 1999). At the regional scale, the soil map coverage was then linked to soil profile data (total profile n = 1778) to calculate soil organic carbon storage for different standard depth intervals. The data was then gridded to several different grid cell resolutions. For the analyses in this study, data for 0–100 cm depth at a grid-cell resolution of 0.5° was used. The 30% and 70% of total 0–100 cm organic matter stocks were assigned to topsoil and subsoil stocks, respectively.
2.4. Soil temperature profile at 0.5° grid cell scale
The time series of the temperature profile at 0.5° grid cells that show RTS during 1991–2010 has been estimated by a pan-Arctic simulation using the land surface model JSBACH. This model has recently been advanced by including cold regions processes (Ekici et al 2014, Beer et al 2018, 2020). For this study, we run a model version that does not consider a layer of lichens and bryophytes because such layer is missing at the disturbed RTS sites. In total, five dynamic snow layers, and seven soil layers were used in an implicit numerical scheme to solve the heat conduction equation with phase change. Depth of thermal and hydrological layers increase from 6 cm at the surface to 30 m for the bottom layer reaching a total depth of 53 m. The horizontal resolution of the model results is 0.5° following the resolution of climate forcing data. JSBACH interpolates daily climate forcing data to half-hourly values which is the internal time step of the model. The 0.5° climate data set for the period 1901–2100 is a combination of observation-based and reanalysis data sets as well as Earth System Model results. Details about the data set and the bias-correction method are given in Beer et al (2020). This model version has been intensively evaluated in terms of cold regions physical processes at site level and pan-Arctic scale (Ekici et al 2014, Porada et al 2016, Beer et al 2018, 2020), and in particular also for a specific RTS in Northeast Siberia (Knoblauch et al 2021). For the estimation of heterotrophic organic matter mineralization we averaged temperature at soil layers for topsoil 0–30 cm and subsoil 30–100 cm for each grid cell. While soil temperature can be highly variable among and within RTS due to slope orientation and aspect (Turner et al 2021), we here use a landscape-scape mean at 0.5° grid cell size in order to cover the seasonality and large-scale variation in soil temperature.
3. Results
3.1. RTS area correction
The comparison of the identified RTS to VHR images showed an average underestimation of the area impacted by rapid thaw by 2020 of 32.5% with a standard deviation of 26%. This area underestimation by LT-GEE can be explained by three aspects: Firstly, the spatial resolution of the combined Landsat and Sentinel-2 data sets (30 m) differs to the VHR RE images by one order of magnitude, leading to area gaps, especially at the boundaries of individual RTS due to the 30 m pixel size. Secondly, overall we underestimate the area affected by RTS in Northeast Siberia as we are restricted to a minimal mapping unit of 0.36 ha. RTS are overall small-scale disturbance features with typical slump sizes ranging from 0.15 ha to a few hectares (Kokelj et al 2015, Lacelle et al 2015). Because of this, our mapping approach with LT-GEE misses the smaller scale disturbances. Thirdly, (Runge et al 2022) only assessed active RTS dynamics between 1999–2020 and thaw dynamics before this assessment period could not be accounted for with LT-GEE. However, when delineating RTS boundaries, the RTS area in VHR RE images contains the full disturbance scar, and also sediment flow tracks were mostly included as they are considered a part of a RTS. As these areas were disturbed before 1999 or as in the case for the sediment flow tracks remain constantly disturbed from a spectral point of view (no change from intact vegetation to bare soil) these areas are not picked up as disturbances with LT-GEE from 1999 to 2020 (which may pre-date 1999). We therefore correct each individual RTS area by this bias of 32 ± 26% resulting in a total area of 1145 ± 2.5 km2.
3.2. Soil organic carbon availability at RTS
Based on the NCSCDv2 we estimated the amount of soil organic carbon of the upper meter of soil of all RTS individually. Due to the exponential distribution of the thaw slump area (Runge et al 2022), also the total amount of soil organic carbon follows this distribution (figure 1(a)). The absolute amount of organic carbon lies in between 0.05 × 10⁶ kg C and 43 × 106 kg C with a mean of 1.25 × 10⁶ kg C in the first meter of soil. Based on this approach, a total of 29 Tg C are currently present within the first meter of soil in all these mapped thaw slumps in Siberia. The mean carbon content per m2 of ground is shown in figure 1(b). This is the direct extract for the individual thaw slumps from the NCSCDv2. It is important to note the high organic carbon content in the West Siberian lowlands (peatlands), in the Yedoma regions of Yakutia and the Far East (Strauss et al 2017) and along rivers due to repeated alluvial deposition. In the southern mountain regions, organic carbon content is lower, which must be taken into account when interpreting the results of CO2 emissions.
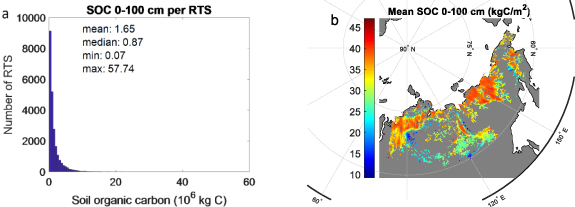
Figure 1. Estimated soil organic carbon (SOC) content in the first meter of each retrogressive thaw slump (RTS). (a) Histogram of total SOC in each RTS, and (b) spatial details of mean SOC per m2.
Download figure:
Standard image High-resolution image3.3. Topsoil and subsoil temperature at RTS
The offline simulations by the land surface model JSBACH result in current topsoil temperatures of 0 °C–12 °C in summer (June–July–August) with clear latitudinal and longitudinal gradients (figure 2(a)). Soil temperature higher than 10 °C in southern West Siberia and in Yakutia are responsible for a substantial CO2 production. Subsoil temperature (30–100 cm) can be also below the freezing point in northern regions depending on the active layer thickness (figure 2(b)). This may limit organic matter decomposition. However, many RTS show a positive subsoil temperature as a mean for 30–100 cm in summer (figure 2(b)).
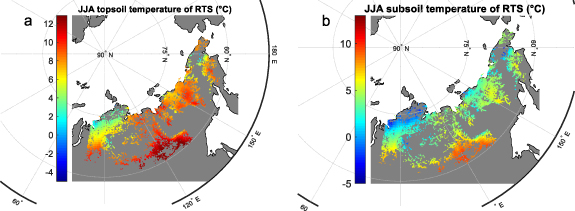
Figure 2. Model results of June–July–August (JJA) mean temperature of each RTS in the topsoil (a) and subsoil (b) during the period 1991–2010.
Download figure:
Standard image High-resolution image3.4. Carbon dioxide release from RTS
When applying the dynamic decomposition model to the available soil organic matter with the specific topsoil and subsoil temperature, we estimate a mineralization of organic matter of 367 ± 213 gC m-1 a-1 on average for all RTS (figure 3). This corresponds to a total CO2 release to the atmosphere of 0.42 ± 0.22 TgC/a from all these thaw slumps in Siberia.

Figure 3. Estimated mean annual carbon dioxide release from RTS during the period 1991–2010.
Download figure:
Standard image High-resolution image
4. Discussion
Thawing ice-rich permafrost can lead to abrupt thermokarst and fluvio-thermal erosion and substantial change of the landscape geomorphology. In hillslope regions, these processes can result in the formation of RTSs. Such thaw slumps make previously permanently frozen organic matter, often many millennia old, available for microbial decomposition by rapidly transporting these subsoil layers towards the exposed and warm surface. Is this locally abundant and often dramatic phenomenon important at the continental scale for the global carbon cycle? To address this question, we for the first time combined several novel datasets about RTS (remotely sensed area, soil carbon database, CO2 production studies) with dynamic modelling to estimate the recent Siberian carbon emission from these thaw slumps.
Our results show that these RTS are a strong carbon source (local hotspot) to the atmosphere. The average emission of 367 ± 204 gC m-1 a-1 is in stark contrast to an otherwise small carbon sink of the tundra in this area (Eckhardt et al 2019). However, the recent RTS-affected area in Siberia of 868 km2 is not large enough for emissions to be relevant for the global carbon cycle. The estimated carbon emission of 0.42 TgC/a from these Siberian thaw slumps is four orders of magnitude lower than the annual anthropogenic carbon emissions of about 10.6 PgC/a (Friedlingstein et al 2022). Nevertheless, the large amount of CO2 emitted from a relatively small, but rapidly increasing RTS area, is concerning for future scenarios should this RTS growthing trend since 2016 continue. RTS area growth for North Siberia from 1999 to 2019 has exceeded 331% (Runge et al 2022). This substantial growth rate for Siberian RTS area is met with similar high rates observed over recent decades in smaller regions of NW Canada, such as the Mackenzie Delta region (+2% to +407% from 1950/1960s to 2004/2008) (Segal et al 2016) or Banks Island (increase in RTS numbers by 6370% from 1984 to 2015) (Lewkowicz and Way 2019).
If we assumed a constant RTS area and constant related available organic matter in the future, then our results suggest a CO2 emission of 0.54 TgC/a at the end of the century due to soil warming following the RCP8.5 scenario (481 gC m-1 a-1, data not shown). This means that also future soil warming will have a minor effect on CO2 emissions from RTS. However, the RTS-affected area may change dramatically with ongoing warming especially in the high Arctic as many recent studies suggest a close relation of rapid permafrost thaw to extreme climate events such as extreme summer temperatures or precipitation (Lantz and Kokelj 2008, Kokelj et al 2015, Farquharson et al 2019, Lewkowicz and Way 2019, Ward Jones et al 2019, Bernhard et al 2022). A further important aspect is that RTS volumes are difficult to estimate from optical remote sensing data and require digital elevation data that allows more detailed estimates of mobilized sediment volumes and carbon (Bernhard et al 2022). Based on the RCP8.5 scenario, Turetsky et al (2020) assume an increase of pan-Arctic active thaw slump area from 1797 km2 in the year 2000 via 15 725 km2 in 2025 to 62 933 km2 in 2100 (RCP8.5). If we assumed this area of 62 933 km2 in 2100, then we would predict a CO2 emission from RTS to the atmosphere of 30.2 TgC/a at the end of the century. Using a linear model of an increase from 0.4 to 30.2 TgC/a during 80 years integrates to an overall total amount of 1.2 Pg carbon that could be emitted to the atmosphere just from these RTSs alone. This number is lower than the 4.4 PgC estimated by Turetsky et al (2020), but confirms the previously published order of magnitude, and that RTS can have an important contribution to the future carbon release from thawing permafrost. These back-at-the-envelope calculations demonstrate that the main source of uncertainty of such prediction of future greenhouse gas releases from RTS is due to the high uncertainty of future thaw slump area. Therefore, further research on dynamic modelling of segregated ice content in permafrost-affected soils and related thermo-erosion processes is required.
5. Conclusions
RTSs in Siberia represent a major hotspot of carbon dioxide release into the atmosphere. Essentially, such lateral thermo-erosion and subsidence following ice-rich permafrost thaw alters the carbon balance of permafrost-affected ecosystems from a small sink to a strong source of CO2. On a global scale, the resulting recent carbon release is negligible compared to other global carbon cycle processes so far. In the future, however, it may become more substantial, depending on the dynamics of affected areas having ice-rich permafrost.
Acknowledgments
C B acknowledges financial support by DFG-BE 6485/1-1 and DFG-BE 6485/4-1. C K was supported by the German Ministry of Education and Research (KOPF-Synthesis Project 03F0834A) and the DFG excellence cluster CLICCS (EXC2037/1). We acknowledge the technical support by CEN-IT which is the central IT service provider of the Center for Earth System Research and Sustainability at Universität Hamburg. A R was supported by an ESA CCI Postdoctoral Fellowship. G G and A R acknowledge support by ESA CCI+ Permafrost, EU Horizon 2020 project Arctic Passion (Grant No. 101003472), and the BMBF KoPf Synthesis project (03F0834B).
Data availability statement
The data that support the findings of this study are openly available at the following URL/DOI: https://zenodo.org/record/7552550 (doi: https://doi.org/10.5281/zenodo.7552550).
Conflict of interest
All authors declare no conflict of interest.
Supplementary data (<0.1 MB XLSX)