

Abstract
The Lena Delta in Siberia is the largest delta in the Arctic and as a snow-dominated ecosystem particularly vulnerable to climate change. Using the two decades of MODerate resolution Imaging Spectroradiometer satellite acquisitions, this study investigates interannual and spatial variability of snow-cover duration and summer vegetation vitality in the Lena Delta. We approximated snow by the application of the normalized difference snow index and vegetation greenness by the normalized difference vegetation index (NDVI). We consolidated the analyses by integrating reanalysis products on air temperature from 2001 to 2021, and air temperature, ground temperature, and the date of snow-melt from time-lapse camera (TLC) observations from the Samoylov observatory located in the central delta. We extracted spring snow-cover duration determined by a latitudinal gradient. The 'regular year' snow-melt is transgressing from mid-May to late May within a time window of 10 days across the delta. We calculated yearly deviations per grid cell for two defined regions, one for the delta, and one focusing on the central delta. We identified an ensemble of early snow-melt years from 2012 to 2014, with snow-melt already starting in early May, and two late snow-melt years in 2004 and 2017, with snow-melt starting in June. In the times of TLC recording, the years of early and late snow-melt were confirmed. In the three summers after early snow-melt, summer vegetation greenness showed neither positive nor negative deviations. Whereas, vegetation greenness was reduced in 2004 after late snow-melt together with the lowest June monthly air temperature of the time series record. Since 2005, vegetation greenness is rising, with maxima in 2018 and 2021. The NDVI rise since 2018 is preceded by up to 4 °C warmer than average June air temperature. The ongoing operation of satellite missions allows to monitor a wide range of land surface properties and processes that will provide urgently needed data in times when logistical challenges lead to data gaps in land-based observations in the rapidly changing Arctic.
Export citation and abstract BibTeX RIS

Original content from this work may be used under the terms of the Creative Commons Attribution 4.0 license. Any further distribution of this work must maintain attribution to the author(s) and the title of the work, journal citation and DOI.
1. Introduction
The cold biomes are covered by snow from autumn to spring, protecting vegetation from freezing air temperatures. If earlier snow-melt due to climate warming will lead to enhanced growth (Cooper 2014, Bjorkman et al 2015, Assmann et al 2019, May et al 2020), or trigger frost damage of vegetation (Bokhorst et al 2012, Ernakovich et al 2014, Bjorkman and Gallois 2020) is still under debate and likely regionally specific. In any case, rapid climate change will affect the composition, density and distribution of Arctic vegetation (e.g. Pearson et al 2013, Collins et al 2021).
On the other hand, Callaghan et al (2022) discuss that field and satellite-based studies show a large proportion of stable Arctic vegetation, even if only few studies specifically describe stable tundra (e.g. in Shevtsova et al 2020). Researchers have made great strides, yet, challenges in high-latitude remote sensing and the limited number of Arctic land-based observations lead to uncertainty on the direction and magnitude of vegetation changes in specific regions (Beamish et al 2020, Myers-Smith et al 2020, Heijmans et al 2022). Vegetation monitoring sites are not equally distributed in the circum-Arctic (Virkkala et al 2019, Tømmervik and Forbes 2020), notably, there are not many for the vast Russian Arctic (Callaghan et al 2021).
Recent satellite-based analyses on vegetation long-term changes (Berner et al 2020, Moon et al 2021) show tundra browning in the Kolyma Lowland in Eastern Siberia. However, to the west, for the Lena Delta region (figure 1), those studies indicate mostly stable or weak increases in greening. Thus, regional-scale studies will support the efforts of the circum-Arctic assessments and contribute to the understanding of regional-specific trends.
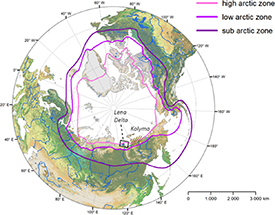
Figure 1. A circum-Arctic view on the Northern Hemisphere land cover (ESA Climate Change Initiative, CCI) with the three Arctic zones (Conservation of Arctic Flora and Fauna (CAFF)) outlined. The largest delta of the Arctic, the Lena Delta (outlined in the black box), is part of the low Arctic and high Arctic zones in Siberia. The brownish-striped region east of the Lena Delta known as Kolyma Lowland stands out as tundra browning in Berner et al (2020) and in Moon et al (2021).
Download figure:
Standard image High-resolution imageIn this study, we aim to shed light on spring snow-cover duration in the Lena Delta and its interannual variability, as well as on the spatio-temporal variability of mid-summer vegetation vitality. We consolidated the MODerate resolution Imaging Spectroradiometer (MODIS)-based remote sensing study by integrating snow-melt from time-lapse camera (TLC), observations and accompanied this study with air and ground temperature data analyses from the Samoylov Observatory (Hubberten et al 2006, Boike et al 2013, 2018a, 2018b, 2019, Haas et al 2016) in the central delta.
2. Material and methods
2.1. Investigation area
The Lena Delta is the largest river delta in the Arctic, covering an area of about 32 000 km2 (Are and Reimnitz 2000). The delta is distinguished by three geomorphological main units, named terraces (Grigoriev 1993, Schwamborn et al 2002, Morgenstern et al 2011a, 2013) (figure 2).

Figure 2. The 32 000 km2 large land mass of the Lena Delta extends into the Laptev Sea, ranging from 72° N to 73.8° N. The geomorphological outlines of delta terraces are published (Morgenstern et al 2011b) and visualized in pink colors for the third and violet for the second terrace. Samoylov Island in the center of the delta is indicated by the black point. The background image shows ESA CCI land cover classes overlaid on a Digital Elevation Model.
Download figure:
Standard image High-resolution imageThe first delta terrace is the modern active delta built up by Holocene river terraces with ice-rich polygonal tundra and sandy floodplains partitioned into barren, shrubland, and wetland. The second terrace in the north–west consists of non-deltaic units of Late Pleistocene to early Holocene sandy sediments covered by sparse tundra vegetation. The third and geomorphologically highest terrace is a Late-Pleistocene ice-rich Yedoma-type ice complex (Schirrmeister et al 2003, 2011a, 2011b). This terrace forms several large islands in the southern part of the delta with elevations of up to 60 m a.s.l. (Morgenstern et al 2011a).
Typical for ice-rich lowland permafrost landscapes, the plateaus are mainly covered by polygonal tundra, and thermokarst lakes and basins in different stages of evolution and degradation. Low-centered polygons characterize the drained lake basins and Holocene plateaus, relict polygons the Pleistocene plateaus (Nitzbon et al 2020). The delta is flanked by mountain ranges in the south and south-east.
While we defined the entire Lena Delta region as area of interest (AOI) for MODIS data extraction (figure A1), the land-based observations were carried out in the center of the Lena Delta (figure A5).
2.2. Micro-meteorological and ground temperature time series on Samoylov Island
Updated Samoylov Tair and Tground from 2002 to 2019 are publicly available (Boike et al 2018a) together with a detailed description in Boike et al (2019). The time series contain data gaps between 2002 and 2013 at times of interrupted energy supply. With the establishment of the modern research station in 2013, data acquisitions became more consistent. We calculated daily averages of air temperature (Tair) as well as ground temperature depth profiles (Tground). To inter-annually compare the temperature regime despite heterogenous data gaps, we calculated the thawing degree days (TDDs, sum of days >0 °C) within each MODIS 8 d period from 15 April to 27 July.
2.3. TLCs in the central delta
Starting in 2006, Boike et al (2019) set up a Campbell Scientific (CC640) TLC on Samoylov Island and made the time-series publicly available (Boike et al 2018b). The TLC used in this study (SAM-TLC-LTO) is installed at 3 m height above ground, overlooking polygonal tundra (figure A4).
In spring 2018, Morgenstern et al (2021b) deployed TLCs (Brinno TLC200) on neighboring delta islands at around 1 m height above ground set up with an hourly resolution. Monitoring locations were chosen to be distributed across different landscape units (figure A5, Kruse et al 2019). We visually examined these red–green–blue (RGB) photo sequences and defined the day of expanding snow-melt when melt ponds formed and the bright snow-cover has gone and became patchy that typically occurred during the course of one illumination-rich spring day on the plateaus. This way, the determination of a bright snow-cover versus start of snow-melt expansion could be done with a temporal resolution of 1 d.
2.4. Lena Delta MODIS-derived snow-cover and vegetation greenness time series
First, we evaluated MODIS products and the advanced very high resolution radiometer (AVHRR) global inventory modeling and mapping studies (GIMMSs) normalized difference vegetation index (NDVI) dataset (Pinzon and Tucker 2014). We found that 8 d and bi-weekly MODIS higher level vegetation and snow products and the bi-weekly GIMMS products were of reduced usability mainly due to high cloud contamination in this high-latitude region, causing considerable artifacts. Ultimately, we used the 8 d MODIS Surface Reflectance (MOD09A1, 500 m resolution) covering the 74° N, 123.2° E to 71.6° N, 129.7° E area of interest (AOI) (appendix 'MODIS products in regions of interest, and area of interest (ROIs, AOI)', figure A1).
We calculated normalized difference snow index (NDSI) equation (1) as a proxy for snow cover and NDVI equation (2) as a proxy for vegetation greenness for the 2001–2021 time series:

- (a)Snow-cover duration: We binary-classified NDSI into 'snow' and 'snow free' by applying the global threshold of NDSI >0.4 representing a bright, and not wet snow-cover (Riggs et al 2015, Riggs and Hall 2016), and thereby compiled annual raster matrices of the duration of snow-cover, Snow(i,j,DOY), with coordinates (i,j) and day of the year (DOY) (table A2). The lowest-level sand flats and the river ice are longer snow-covered than the land surface in the delta. These lowest-level surfaces come widely below the river water level in summer and thus could be masked out using the water mask.
- (b)Vegetation greenness: Several of the 8 d NDVI time series were not of sufficient data quality. Specifically, June was regularly cloud-covered. As the best-quality time series and at the same time representing peak growing season, we averaged the two mid-summer 8 d periods of DOY193–201 (12–27 July), adequately representing the summer vegetation state in the Lena Delta known from botanical surveys. Mid-July also coincides with the timing of satellite-derived Sun-Induced Fluorescence maximum and air temperature maximum in tundra, also for the Lena Delta region (Walther et al 2018). We applied a regionally determined threshold value of NDVI <0.35 to mask barren and sparsely vegetated terrain.
To allow for quantitative interannual comparisons, we extracted the yearly absolute and normalized deviations per grid cell, dyear, for two defined regions of interest (ROIs): 'Lena Delta ROI' covering 26 386 km2, and 'central Lena Delta ROI' covering 4223 km2 in the delta apex and surroundings (appendix 'MODIS-derived snow-cover duration and mid-summer vegetation greenness'). We assigned outstanding years when the normalized negative or positive deviation reached values ⩾1.
2.5. Lena Delta reanalysis-derived snow height and air temperature time series
We downloaded the European Centre for Medium-Range Weather Forecasts reanalysis version-5 (ERA5) (Copernicus Climate Change Service 2017) products on air temperature and snow height from 2001 to 2021 and calculated the monthly averages for the Lena Delta AOI with a spatial grid cell resolution of around 31 km. To equally allow for quantitative interannual comparisons, we extracted the absolute and normalized yearly deviations per grid cell for the two defined ROIs 'Lena Delta' and 'central Lena Delta'.
3. Results
3.1. Lena Delta spring snow-cover duration
The time-series averaged matrix of Snow(i,j,DOY) am2001–2021 (figure 3), shows a latitudinal snow melt gradient. In mid-May, snow has already melted along the southern delta rims with snow-melt progressing to the northern delta rims in around 10 d.

Figure 3. AOI Snow(i,j,DOY) arithmetic mean 2001–2021 (am2001–2021) in Universal Transverse Mercator UTM projection (UTM Z52 N). Colors code the DOY of the last bright snow-cover, pink to red colors indicating snow-cover until early May and light to darker blue colors indicating a longer snow-cover until mid to late May. Ice-covered areas (sea, lake and river ice) are masked in white, as well as areas with high noise in the delta channels are widely masked out.
Download figure:
Standard image High-resolution imageIn the same way, the visualization highlights the third terrace islands as topography-related spatial patterns that become snow-free after mid-May. The second terrace as a distinct topography-related pattern stands out in spring 2010 and 2014 with longer snow-cover duration, but not throughout the other years. Outside of the Lena Delta, an elevational gradient is visible with late snow-melt at high elevations in the mountain regions south of the delta.
We identified for both ROIs two late snow-melt years in 2004 and 2017, and a successive period of early snow-melt from 2012 to 2014 (figure 4, tables A3(a) and (b)). The central delta shows even stronger expressed outstanding early snow melts in 2013 and 2014. Whereas, there seems to be no difference in the early (but not outstanding early) snow melt timing for 2011 and 2012 for the central delta. Inter-annual variability range of the averaged Snow(i,j,DOY) is high with 11 d (5 d earlier to 6 d later snow-melt) for the Lena Delta ROI.
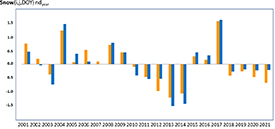
Figure 4. Lena Delta snow-cover duration, Snow(i,j,DOY) normalized deviation per year, ndyear from the arithmetic mean (am2001–2021) per grid cell (tables A3(a) and (b)). ndyear Lena Delta in orange and ndyear central delta region in blue.
Download figure:
Standard image High-resolution image3.2. Lena Delta mid-summer vegetation greenness
NDVIDOY193–201 am2001–2021 visualizes that the spatial distribution of vegetation greenness is related to the topographic units of the three delta terraces (figure 5).
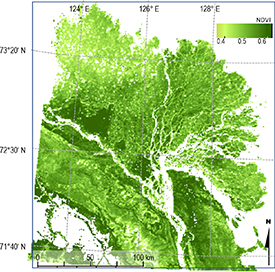
Figure 5. AOI NDVIDOY193–201 arithmetic mean 2001–2021 (am2001–2021) in UTM Z52 N. Colors code the NDVI, from light green indicating sparser tundra vegetation to dark green indicating higher plant biomass. Surface water and sea-ice-covered and other areas with high NDVI noise are masked in white.
Download figure:
Standard image High-resolution imageThe delta land surface is characterized by a low NDVI regime. Relatively high NDVI of around 0.6 occurs for the polygonal tundra on the third terrace with shrubs of 30–40 cm height. In contrast, NDVI of 0.45 characterizes sparse vegetation tundra on the sandy substrates of the second terrace in the north–west of the delta. NDVI of around 0.55 is typical for the graminoid dominated polygonal tundra on the Holocene terraces with a high share of polygonal water ponds.
Mid-summer NDVI seemed to be reduced compared to the time series arithmetic mean 2001–2021 (am2001–2021) in the early years of the 21th century, with an even stronger reduction for the central delta (figure 6). Mid-summer NDVI per pixel ranges from a minimum in 2004 with a negative yearly deviation of d2004 = 0.07 NDVI to maximum values in 2011, 2018 and 2021 with positive yearly deviations of up to 0.05 NDVI (table A3(c)).
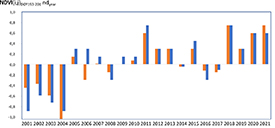
Figure 6. Lena Delta mid-summer NDVI (i,j,DOY193–201) normalized deviation per year, ndyear from the arithmetic mean (am2001–2021) per grid cell (tables A3(c) and (d)). ndyear Lena Delta in orange and ndyear central delta region in blue.
Download figure:
Standard image High-resolution imageThe highest negative deviation in the mid-summer NDVI occurred in the late snow-melt year 2004. Whereas, mid-summer NDVI in the 2017 late snow-melt year was around average.
ERA5-derived average air temperature in June, preceding the 2004 mid-summer NDVI minimum, not even reached up to 2 °C in 2004. ERA5 air temperature time series also show an increase of about 4 °C from 2018 on (figure 7), when mid-summer vegetation greenness seems to establish at an higher NDVI.

Figure 7. ERA5 air temperature at 2 m height temperature averaged for the month of June, for the Lena Delta region in orange and for the central delta region in blue.
Download figure:
Standard image High-resolution image3.3. Snow-melt in the central delta
Samoylov TLC time series confirm the MODIS-derived late snow-melt in 2017 with a site-level snow-melt only starting on 9 June. Also, similarly to the MODIS-derived records for the central delta, snow-melt in 2011 and 2012 started early, on 22 April in 2011, and on 5 May in 2012, leaving the land surface snow-free already in mid-May. The springs of the two MODIS-derived early snow-melt years 2013 and 2014 are missing in the TLC data record due to power outages. In regular years, snow-melt started in late May and the land surface became snow-free from late May to June on Samoylov Island (figure 8, table A4).
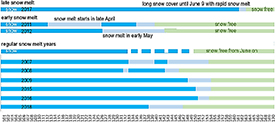
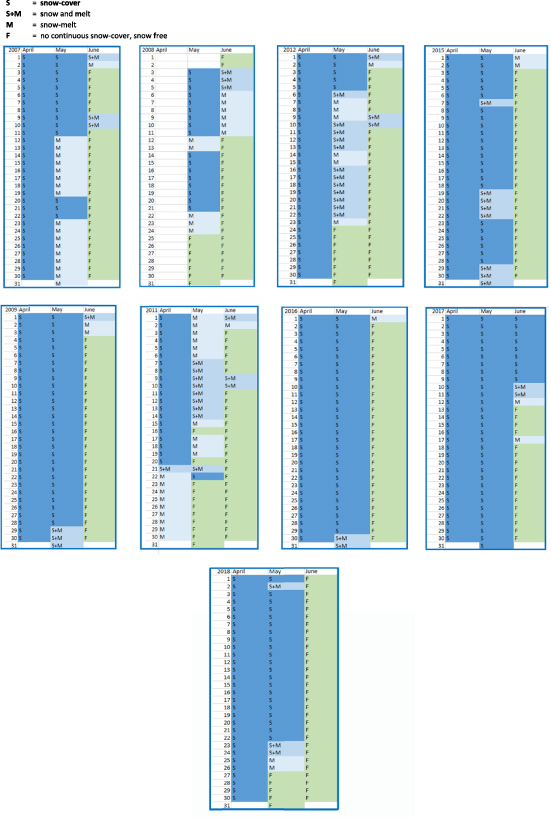
Figure 8. SAM-TLC-LTO monitored snow melt on Samoylov Island in the central Lena Delta. The time scale shows the DOY starting with DOY 100 (10 April). Bright snow cover is shown in blue, snow-melt with changing snow cover as light blue, and a snow-free land surface as green. The longest spring snow cover occurred in 2017 with snow-melt in the 2nd week of June. Two early snow-melt years stand out in the TLC record in 2011 and 2012. In typical years 2007, 2008, 2009, 2015, 2016, 2018, snow-melt started in mid-May to late May and the land surface became snow free from late May to June on.
Download figure:
Standard image High-resolution imageIn the 2018 TLC RGB photo sequences, all cameras on the third terrace plateau monitored bright snow-cover within the 8 d MODIS DOY137 (17–24 May) period, confirming the NDSI threshold >0.4 for snow-cover abundance. After the DOY137 period, NDSI in 2018 dropped below 0.4, in accordance when TLC data showed patchy snow cover only. Snow patches were still abundant in the landscape for a longer time period, but the plateau-scale bright snow cover had gone.
The TLCs installed in 2018 were closer to the ground and thus able to spatially resolve vegetation leaf-out and vascular plant shooting in the RGB photo sequences. TLCs recorded that snow-melt in 2018 preceded the shooting of the slow-growth adapted tundra vegetation (occurring in mid-June 2018) by around one month (tables A5).
Table 1. Number of TDDs from DOY105 to 201 (15 April–27 July), determined by the mean daily air temperature (Tair) > 0 °C within a MODIS 8 d period. Data gaps are white.
| DOY | 2002 | 2003 | 2004 | 2005 | 2006 | 2007 | 2008 | 2009 | 2010 | 2011 | 2012 | 2013 | 2014 | 2015 | 2016 | 2017 | 2018 | |
|---|---|---|---|---|---|---|---|---|---|---|---|---|---|---|---|---|---|---|
| 105 | 0 | 0 | 2 | 0 | 0 | 1 | 0 | 0 | 0 | 0 | ||||||||
| 113 | End April | 4 | 0 | 0 | 0 | 0 | 0 | 0 | 0 | |||||||||
| 121 | Early May | 0 | 0 | 1 | 0 | 3 | 2 | 0 | 0 | 0 | 0 | 1 | ||||||
| 129 | 0 | 0 | 5 | 1 | 1 | 0 | 3 | 2 | 0 | 0 | 0 | 0 | ||||||
| 137 | Mid May | 2 | 1 | 2 | 1 | 1 | 1 | 1 | 5 | 0 | 0 | 0 | 3 | |||||
| 145 | 5 | 0 | 1 | 4 | 5 | 5 | 8 | 6 | 3 | 0 | 3 | 1 | 7 | |||||
| 153 | Early June | 5 | 1 | 7 | 6 | 1 | 1 | 8 | 8 | 3 | 6 | 7 | 8 | 1 | 7 | |||
| 161 | Mid June | 5 | 8 | 8 | 8 | 6 | 8 | 8 | 8 | 8 | 8 | 8 | 8 | 8 | ||||
| 169 | 8 | 8 | 8 | 8 | 8 | 8 | 8 | 8 | 8 | 8 | 8 | |||||||
| 177 | End June | 8 | 8 | 8 | 8 | 8 | 8 | 8 | 8 | 8 | 8 | 8 | 8 |
3.4. Air and ground temperature on Samoylov Island
The two late snow-melt years, 2004 and 2017, also stand out in the Samoylov Tair record with the fewest number of TDDs from mid-April to the end of July (DOY105 to 201, 15 April–27 July). In most years, there are 5–8 d with a mean daily Tair below 0 °C between mid-May and June (table 1).
In most years, there are 5–8 d with a mean daily Tair below 0 °C between mid-May and June. In contrast, a higher occurrence of TDDs in May is observed in the early snow-melt years 2012–2014. The years of early snow-melt also do not experience intense freezing events after snow-melt. The daily averaged Tair and Tground data depict 2004, and 2017 as colder years in the time window of MODIS DOY145 to 160 (25 May–16 June). In 2004 and 2017, daily averaged ground temperature in the first week of June was still −6 °C, which is several degrees colder than in average years (figure 9).
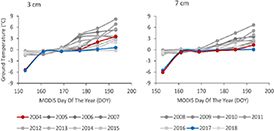
Figure 9. Samoylov daily averaged ground temperature Tground at 3 cm and 7 cm depth (regular years in gray color) show colder ground temperature in 2004 (red color) and 2017 (blue color) in the first week of June (x-axes numbers relate to MODIS DOY).
Download figure:
Standard image High-resolution image4. Discussion
4.1. Spatial variability of snow-cover duration and vegetation greenness in the Lena Delta
The time-series averaged spatially distributed duration of snow-cover shows that all plateaus of the third terrace islands are snow-free first, despite spanning half a latitude. This plateau landscape at elevations of up to 50–60 m offers drainage and is characterized by less pronounced microtopography, due to relict Pleistocene polygons. In contrast, the lower Holocene terraces with more pronounced polygonal microtopography keep snow longer, e.g. the later snow-melt is visible around 73° N compared to the third terrace plateaus. At MODIS-scale, we capture a spatial snow-melt variability in terms of landscape-level topography and the latitudinal gradient, both of which are driven by the spatial distribution of freezing temperatures and radiative forcing across the landscape, as shown as influential factors in Callaghan et al (2011b), Assmann et al (2019).
At site level, TLC data (Boike et al 2018b, Morgenstern et al 2021b) show a strong variation of snow-melt in relation to microtopography. In topographic lows, such as thermokarst depressions, steep thermo-erosional gullies and valleys, and at coastal cliffs, snow accumulates. This local snow accumulation results in up to several days and weeks later snow-melt compared to the plateau-scale snow-melt event.
MODIS-scale resolution does not technically permit identification of these snow patches nor patches of high vegetation biomass. Typically, high-stature and dense vascular plant cover occurs in small patch sizes at nutrient-rich locations, such as on the floodplains and in thermo-erosional landscape features. For Example Kropp et al (2020), Grünberg et al (2020) could show a strong relation of vegetation and the timing of snow-melt in forest tundra relying on datasets with high spatial resolution.
At MODIS-scale, the terrace system of the Lena Delta determines the spatial pattern in the mid-summer vegetation greenness, as due to the nutrient, soil, and moisture conditions, different tundra vegetation communities and biomass established on the terrace plateaus (Shevtsova et al 2021a, 2021b). At GIMMS scales, the spatial NDVI pattern and the occurrence of NDVI outliers indicates heavy cloud-contamination for the high-latitude Lena Delta region. Whereas, for the purpose of larger regional and circum-Arctic long-term assessments, GIMMS provides a four decades-long NDVI record, enabling the long-term insights into seasonality and productivity of Arctic vegetation (e.g. as in Park et al 2016).
For the focus of this study, MODIS enabled a landscape-scale extraction of the dominant time-averaged spatial distribution of land surface properties and processes in the Lena Delta. This knowledge on the underlying landscape-scale spatial variability, also supports the assessment of variability of these landscape units in the temporal domains.
4.2. Temporal variability of snow-cover duration and vegetation greenness in the Lena Delta
Groisman et al (1994), Buermann et al (2003) and Callaghan et al (2011a) correlated interannual snow-melt variability to the large‐scale atmospheric circulation of the Northern hemisphere. There is a marked difference in snow-cover for the North American, Atlantic, and West Siberian in contrast to the East Siberian sectors with observed and projected changes, indicating the smallest decrease of snow-cover over Siberia compared to the largest decrease over Alaska and Scandinavia (Callaghan et al 2011a). Bulygina et al (2009), (2011), Groisman et al (2006), and Zhong et al (2018) found that snow-cover in Siberia even increased within their specific investigation periods. Specifically, for the region at 70° N south of the Lena Delta, Foster et al (2013) using passive microwave remote sensing covering 1967 until 2011, showed no or only slightest decrease in snow-cover duration compared to other circum-Arctic regions at 70° N.
In our study, the MODIS-derived time series on snow-cover duration and ERA5-derived time series on snow depth confirm a high interannual variability for the Lena Delta region. ERA5-derived snow depth also indicates the longest snow-cover occurring in 2017, and reduced snow depths in May in the early snow-melt years 2012–2014 (figures A3). The second decade of this century shows considerably reduced ERA5-derived snow depths from March to May.
The 2004 and 2017 late snow-melt also occurred at larger regional-scales in Northern Eurasia, e.g. late snow-melt in 2004 is found in Foster et al (2013). Specifically, the late snow-melt in 2017 is described as outstanding with the second highest spring snow-cover extent for Eurasia over the period of satellite observations, which date back to 1967 (Richter-Menge et al 2017).
For late and early snow-melt years, the Lena River ice break-up seemed to be temporally not directly linked to the MODIS-scale derived snow-cover. For example, during the late snow-melt 2004 and 2017, break-up occurred when there was still snow-covered land in the entire delta. In early snow-melt years, plateau-scale snow-cover was already gone, when the break-up in the delta occurred in June. Days to weeks before the main break-up, ice on shallow river channels had already melted and a network of shallow open water developed throughout the years (visible in MODIS true color composites), also before the plateau-scale snow-melt.
In contrast, lakes remained ice-covered until several weeks after the major snow-melt event. Visual inspection of true color composites of MODIS and Landsat satellite data indicated that since 2018 lakes were free of ice already in late June. However, within the course of this study we did not assess lake ice phenology through the years of the time series, similarly as in Antonova et al (2016) for 2013–2015 for the central Lena Delta. There, the authors showed that in the springs 2013 and 2014, lake-ice melt started early with ice-free lakes from early July and late June on, respectively, whereas in 2015, lake ice in the central delta melted in mid-July.
The ensemble of early snow-melt years from 2012 to 2014 is characterized by positive daily air temperatures and no freezing events in the weeks following snow-melt, potentially favoring early vegetation leaf out and shooting in those years. Despite early snow-melt, mid-summer vegetation vitality during those three summers was not outstanding higher or lower.
We found lowest mid-summer vegetation greenness in the late snow-melt year in 2004. As long snow-cover duration in spring limits the energy transfer from the warming near-surface atmosphere into the ground, ground temperatures in early June proved to be several degrees colder in the late snow-melt years, 2004 and 2017, then in years of regular or early snow-melt. Similarly, also using satellite data (AVHRR NDVI and passive microwave satellite products), Grippa et al (2005) found for the northern tundra in Siberia that late snow-melts were followed by low summer NDVI.
The late snow-melt in 2004 in the Lena Delta was followed by the lowest ERA5 June air temperature in the time series record, not even reaching 2 °C in the monthly average. Currently, the terrestrial ecosystems of the Lena Delta experiencing a sequence of years of up to 4 °C warmer monthly June temperatures starting in 2018 that seem to lead to higher mid-summer greenness also starting in 2018 with highest NDVI occurring in July 2018 and 2021.
These findings, that the years from 2018 characterized by warm air temperature in June were accompanied by high mid-summer greenness are in accordance with findings in Høye et al (2007), and Assmann et al (2019), showing that air temperatures in summer seemed to be the key factor for the summer vegetation vitality, while the snow-melt timing had its key influence on the onset of vegetation growth. Zona et al (2022) concluded that an earlier snow-melt and subsequent earlier start of vegetation seemed to have its biggest impact in form of a reduced late-summer (month of August) vegetation productivity.
The highest circumpolar tundra greenness measurements in the long-term AVHRR satellite records (1982–2020) have all been recorded in the last decade (Moon et al 2021) and reports on tundra greening are numerous. What could be pathways for the land surface of the Lena Delta? Rising temperatures are expected to enhance permafrost degradation processes, such as enhanced river cliff erosion as already observed in the delta (Stettner et al 2018, Fuchs et al 2020), thermal erosion, and widespread thermokarst processes. The predominance of certain types of permafrost degradation are influenced by the relief settings and geomorphological characteristics of the affected landscapes (Nitzbon et al 2020, Morgenstern et al 2021a). The higher elevations of the third delta terrace support drainage of the plateaus, thus limiting future thermokarst lake development and favoring progression of thermo-erosional gullying and valley formation. This would lead into the direction of the Arctic greening trajectory as proposed in Heijmans et al (2022) due to a drying land surface.
That is in contrast to the Arctic browning trajectory that would develop in case of a landscape wettening scenario. The Kolyma Lowland, located east of the Lena Delta region, showing current NDVI browning trends in different satellite sensor records (Berner et al 2020, Moon et al 2021) may become a wettening region in a warmer summer air temperature scenario. The Kolyma Lowland landscapes are characterized by lower relief and extensive thermokarst features with less drainage. Similar assumptions were made in the Arctic Report Card (2021) pointing out an increase in surface water that was described as a dominant land surface process in Veremeeva et al (2021) for the Kolyma Lowland.
Myers-Smith et al (2020), Frost et al (2021), and Moon et al (2021) make aware, how strongly satellite-based analyses depend on the satellite sensors, the spatial scale, as well as the choice of the vegetation remote sensing products and that identifying the processes that underlie complex spatio-temporal trends should integrate a broad base of information.
5. Conclusions
The Lena Delta is the largest delta in the Arctic and, as a snow-dominated ecosystem, particularly sensitive to Arctic climate change. We used the two decades of MODIS satellite time series to investigate the interannual variability of the spring snow-cover duration and the tundra vegetation vitality in mid-summer. The MODIS-derived spring snow-cover duration and vegetation greenness provided new insights into the spatial and temporal variability of these land surface properties and processes for the Lena Delta region.
We extracted a persistent spatio-temporal snow-melt pattern determined by a latitudinal gradient of more than 150 km across the delta. We also found that snow melts first on the plateaus of all third terrace islands despite spanning half a latitude, leaving the land surface snow free already in mid-May. In 'regular years' the central delta is snow-free from late May to June on. The 'regular year' snow-melt is transgressing from mid-May to late May within around 10 d across the delta to its northern rims.
We used the time series to reveal interannual variability patterns for the Lena Delta region within the two decades of the 21th century. We extracted an ensemble of springs with early snow-melt in 2012–2014, all followed by warm air temperature regimes with no potentially vegetation-damaging freezing events occurring in the weeks after snow-melt.
Two late snow-melts stand out in 2004 and 2017, followed by several degrees colder ground temperatures in early June than in years of regular or early snow-melt. These cold ground temperatures do not provide favorable conditions for vegetation development. Mid-summer NDVI time series showed lowest mid-summer vegetation greenness after the late snow-melt in 2004, in combination with the lowest ERA5 June air temperature in the time series record, not even reaching 2 °C. Since 2005, MODIS-derived mid-summer vegetation vitality is slightly rising, specifically, in the summers since 2018, preceded by up to 4 °C warmer than average ERA5 June air temperature.
Two decades of MODIS-derived time series are yet too short to extract long-term changes and statistics between the timing of the snow melt, summer vegetation greenness and air temperature. However, we can depict the outstanding years and occurring land surface processes from the satellite records. These findings, that the years from 2018 on characterized by warm air temperature in June were accompanied by high mid-summer greenness are in accordance with other studies, showing that air temperatures in summer are the key factor for the summer vegetation vitality, while the snow-melt timing had its key influence on the onset of vegetation growth.
A wide range of relevant land surface properties and processes can be assessed and monitored by satellite remote sensing, providing data in times when logistical challenges lead to data gaps in land-based observations in the Arctic. Despite the large potential of satellite-based observations and products, these regional-scale assessments are strongly consolidated by the integration of land-based data.
Acknowledgments
This study has been supported by the German Federal Ministry of Education and Research (BMBF). We thank our Russian and German colleagues from the LENA2018 expedition as well as the Research Station Samoylov Island for support of our field work in summer 2018.
We thank both our MSc students: Till Hainbach (Potsdam University, Germany) for assistance in preparation and installation of the time-lapse cameras in the field in spring 2018 and for the subsequent TLC data processing and preparing the PANGAEA data publication, and Ksenia Simonova (St. Petersburg State University, Russia, and Hamburg University, Germany) for analyzing the 2018 TLC data related to timing of the snow melt and vegetation greening. We thank Thomas Böhmer, Research Assistant at AWI Potsdam for his GIS work producing figures 1 and 2 of this manuscript.
BH acknowledges funding by the Helmholtz Association Climate Initiative REKLIM. S L acknowledges funding from Geo.X, a network for Geosciences in Berlin and Brandenburg. This study was further supported by the Russian-German research program 'Kohlenstoff im Permafrost KoPf' (BMBF Grant No. 03F0764A), and by the ERC consolidator grant 'Glacial Legacy' of UH (Grant No. 772852).
Data availability statements
The data that support the findings of this study are openly available at the following URL/DOI: https://doi.pangaea.de/10.1594/PANGAEA.931773, https://doi.org/10.1594/PANGAEA.891142 and https://doi.org/10.1594/PANGAEA.891129. Measurements in soil and air at Samoylov Station (2002–2017) are provided under https://doi.org/10.1594/PANGAEA.891142, TLC pictures from Samoylov LTO, 2002–2017, https://doi.org/10.1594/PANGAEA.891129, are updated in the PANGAEA data publications to include the year 2018 and are cited in the as (Boike et al 2018a, 2018b).The TLC videos for monitoring snow and vegetation evolution in 2018 are published under Time Lapse Camera videos for monitoring snow and vegetation evolution in 2018 on Samoylov and Kurungnakh islands, Lena Delta, Russia https://doi.org/10.1594/PANGAEA.931773 are cited in the as (Morgenstern et al 2021b).
Appendix
Appendix. A1. MODIS products in regions of interest, and area of interest (ROIs, AOI)
We downloaded the MODIS products from the NASA Distributed Active Archive Centre (DAAC) (application for extracting and exploring analysis ready samples (AρρEEARSs)) for the defined AOI between 74° N, 123.2° E to 71.6° N, 129.7° E (figure A1). Ultimately, we used the 8 d MODIS Surface Reflectance product (MOD09A1, 500 m resolution) for which the highest quality pixels with optimal viewing angles are selected.
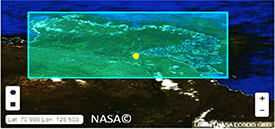
Figure A1. AOI for MODIS data download (light-blue shaded box, 1472 columns, 552 rows) from the NASA DAAC. Samoylov Island is indicated by the yellow point in the central delta.
Download figure:
Standard image High-resolution image
Figure A2. The AOI covering the Lena Delta region with below the two ROIs for grid cell extraction: Lena Delta (orange-colored polygon) and central delta (blue-colored polygon) as World Geodetic System 1984 (WGS84) arrays. Samoylov Island is indicated by the yellow point in the central delta.
Download figure:
Standard image High-resolution imageThe NASA AρρEEARS service determines which MODIS tiles intersect with the bounding box, and mosaics them into time series image stacks. The AρρEEARS reprojection delivers the time series image stacks as World Geodetic System 1984 (WGS84) arrays. The Lena Delta AOI output consists of 1472 columns, and 552 rows with a 0.004 49° grid cell resolution.
We applied the MODIS water mask (MOD44W) to all image data. The annual raster matrices for the duration of spring snow-cover, Snow(i,j,DOY), with coordinates (i,j) and DOY, and NDVI(i,j)DOY193–201 consist of the spatially mapped arithmetic mean (am2001–2021), the standard deviation (std2001–2021), and the variability coefficient (cv2001–2021) (table A1).
Table A1. Overview on the number of extracted ROI grid cells in the MODIS AρρEEARS WGS84 raster array, and the equivalent area km2 from a transformed UTM product for true area calculation of the ROIs.
| Region of interest ROI | Number of extracted grid cells | True area extent (km2) |
|---|---|---|
| Lena Delta | 794 890 | 26 386 |
| Central Lena Delta | 114 007 | 4223 |
Table A2. Showing the time series products of the last snow cover DOY, Snow(i,j,DOY), and mid-summer NDVI(i,j)DOY193–201: arithmetic mean (am2001–2021), standard deviation (std2001–2021), variability coefficient (cv2001–2021).
| Remote sensing index | Time coverage | Pixel res. (m) | Satellite source product | Time series products | Application |
|---|---|---|---|---|---|
| NDSI | 2001–2021 | 500 | MOD09 (Terra) surface reflectance RED, NIR | Snow(i,j,DOY) am2001–2021, std2001–2021, cv2001–2021 | Spring snow cover duration |
| NDVI | 2001–2021 | 500 | MOD09 (Terra) surface reflectance GREEN, SWIR-1 | NDVI(i,j) DOY193–201 am2001–2021, std2001–2021, cv2001–2021 | Mid-summer vegetation greenness |
Specifically, for the interannual comparisons, we extracted the grid cells per year from two ROIs (figure A2, table A2): (a) 'Lena Delta ROI' with 794 890 MODIS AρρEEARS grid cells extracted from the full delta region, with excluding some of the most outer-reach coastal estuarine areas characterized by high noise, (b) 'central Lena Delta ROI' with 114 007 MODIS AρρEEARS grid cells covering the delta apex and its close surroundings. Both ROIs include the lower part of hill slopes along the Lena River facing the delta body, thus extending slightly beyond the geomorphological delta body itself, by this capturing stronger the tundra dynamics as most of the central part of the delta is covered by water and sandbanks that were all masked out. 'Lena Delta ROI' and 'central Lena Delta ROI' cover 26 386 km2 and 4223 km2 respectively, in true-area projection when transformed to Universe Transverse Mercator UTM in their respective UTM zones Z51 N and Z52 N.
To allow for quantitative interannual comparison, we extracted the yearly deviations, and also normalized to ndyear dividing the yearly deviations by the standard deviation (std2001–2021) of each Snow(i,j,DOY) and NDVI(i,j)DOY193–201 ROI. Tables A3 show the yearly and normalized yearly deviations per ROI.
Appendix. A2. MODIS-derived snow-cover duration and mid-summer vegetation greenness
Tables A3(a)–(c), last snow-cover DOY, Snow(i,j,DOY), and mid-summer NDVI(i,j) DOY193–201 yearly median, mean, and normalized deviations (nd), from the arithmetic mean (am2001–2021) per pixel for the ROIs. Bold text indicates strongest positive, italic text strongest negative deviations with ndyear ⩾ 1.
Table A3a. ROI Lena Delta: yearly deviations Snow(i,j,DOY).
| Year | Snow(i,j,DOY) median dyear | Snow(i,j,DOY) mean dyear | Snow(i,j,DOY) normalized ndyear |
|---|---|---|---|
| 2001 | 2.97 | 2.82 | 0.75 |
| 2002 | 0.85 | 0.75 | 0.20 |
| 2003 | −1.22 | −1.39 | −0.37 |
| 2004 | 4.29 | 4.60 | 1.23 |
| 2005 | 0.05 | 0.25 | 0.07 |
| 2006 | 1.83 | 1.96 | 0.52 |
| 2007 | 0.81 | 0.33 | 0.09 |
| 2008 | 2.83 | 2.65 | 0.71 |
| 2009 | 1.46 | 1.60 | 0.43 |
| 2010 | −0.06 | −0.37 | −0.10 |
| 2011 | −1.74 | −1.77 | −0.47 |
| 2012 | −3.92 | −3.68 | −0.98 |
| 2013 | −4.66 | −4.56 | −1.22 |
| 2014 | −4.5 | −4.02 | −1.07 |
| 2015 | 1.06 | 1.07 | 0.29 |
| 2016 | 0.35 | 0.59 | 0.16 |
| 2017 | 6.09 | 5.87 | 1.57 |
| 2018 | −1.36 | −1.57 | −0.42 |
| 2019 | −0.92 | −0.97 | −0.26 |
| 2020 | −1.7 | −1.75 | −0.47 |
| 2021 | −3.35 | −2.56 | −0.68 |
| Averaged/ROI std2001–2021: 3.75 | |||
Table A3b. ROI central delta: yearly deviations Snow(i,j,DOY).
| Year | Snow(i,j,DOY) median dyear | Snow(i,j,DOY) mean dyear | Snow(i,j,DOY) normalized ndyear |
|---|---|---|---|
| 2001 | 2.04 | 1.84 | 0.46 |
| 2002 | 0.22 | −0.14 | −0.04 |
| 2003 | −3.65 | −2.95 | −0.74 |
| 2004 | 5.73 | 5.82 | 1.46 |
| 2005 | 1.39 | 1.50 | 0.38 |
| 2006 | 0.64 | 0.35 | 0.09 |
| 2007 | −0.44 | 0.00 | 0.00 |
| 2008 | 3.85 | 3.13 | 0.78 |
| 2009 | 1.63 | 1.73 | 0.43 |
| 2010 | −1.39 | −1.63 | −0.41 |
| 2011 | −2.45 | −2.16 | −0.54 |
| 2012 | −2.34 | −2.13 | −0.53 |
| 2013 | −6.61 | −6.07 | −1.52 |
| 2014 | −6.35 | −5.76 | −1.44 |
| 2015 | 1.65 | 1.71 | 0.43 |
| 2016 | 1.21 | 1.29 | 0.32 |
| 2017 | 6.52 | 6.47 | 1.62 |
| 2018 | −1.05 | −1.07 | −0.27 |
| 2019 | −0.83 | −0.76 | −0.19 |
| 2020 | −1.7 | −0.93 | −0.23 |
| 2021 | −1.94 | −0.84 | −0.21 |
| Averaged/ROI std2001–2021: 4 | |||
Table A3c. ROI Lena Delta: yearly deviations NDVI(i,j) DOY193–201.
| Year | NDVI(i,j) DOY193–201 median dyear | NDVI(i,j) DOY193–201 mean dyear | NDVI(i,j) DOY193–201 normalized ndyear |
|---|---|---|---|
| 2001 | −0.035 | −0.030 | −0.43 |
| 2002 | −0.025 | −0.025 | −0.36 |
| 2003 | −0.035 | −0.040 | −0.57 |
| 2004 | −0.060 | −0.070 | −1.00 |
| 2005 | 0.010 | 0.010 | 0.14 |
| 2006 | −0.020 | −0.020 | −0.29 |
| 2007 | 0.005 | 0.001 | 0.01 |
| 2008 | −0.010 | −0.010 | −0.14 |
| 2009 | 0.005 | 0.000 | 0.00 |
| 2010 | 0.007 | 0.005 | 0.07 |
| 2011 | 0.045 | 0.040 | 0.57 |
| 2012 | 0.020 | 0.020 | 0.29 |
| 2013 | 0.020 | 0.020 | 0.29 |
| 2014 | −0.007 | −0.003 | −0.04 |
| 2015 | 0.020 | 0.020 | 0.29 |
| 2016 | −0.007 | −0.008 | −0.11 |
| 2017 | −0.015 | −0.010 | −0.14 |
| 2018 | 0.050 | 0.050 | 0.71 |
| 2019 | 0.030 | 0.020 | 0.29 |
| 2020 | 0.040 | 0.040 | 0.57 |
| 2021 | 0.055 | 0.050 | 0.71 |
| Averaged/ROI std2001–2021: 0.07 | |||
Table A3d. ROI central delta: yearly deviations NDVI(i,j) DOY193–201.
| Year | NDVI(i,j) DOY193–201 median dyear | NDVI(i,j) DOY193–201 mean dyear | NDVI(i,j) DOY193–201 normalized ndyear |
|---|---|---|---|
| 2001 | −0.06 | −0.06 | −0.86 |
| 2002 | −0.04 | −0.04 | −0.57 |
| 2003 | −0.04 | −0.05 | −0.70 |
| 2004 | −0.06 | −0.06 | −0.86 |
| 2005 | 0.02 | 0.02 | 0.29 |
| 2006 | 0.02 | 0.02 | 0.29 |
| 2007 | 0.015 | 0.01 | 0.14 |
| 2008 | −0.02 | −0.02 | −0.29 |
| 2009 | 0.02 | 0.01 | 0.14 |
| 2010 | 0.02 | 0.01 | 0.14 |
| 2011 | 0.05 | 0.05 | 0.71 |
| 2012 | 0.02 | 0.02 | 0.29 |
| 2013 | 0.02 | 0.02 | 0.29 |
| 2014 | −0.001 | 0.00 | −0.04 |
| 2015 | 0.04 | 0.03 | 0.43 |
| 2016 | −0.02 | −0.02 | −0.29 |
| 2017 | −0.002 | −0.01 | −0.10 |
| 2018 | 0.05 | 0.05 | 0.71 |
| 2019 | 0.05 | 0.02 | 0.29 |
| 2020 | 0.04 | 0.04 | 0.57 |
| 2021 | 0.05 | 0.04 | 0.57 |
| Averaged/ROI std2001–2021: 0.07 | |||
Appendix. A3. ERA5 reanalysis-derived snow depth
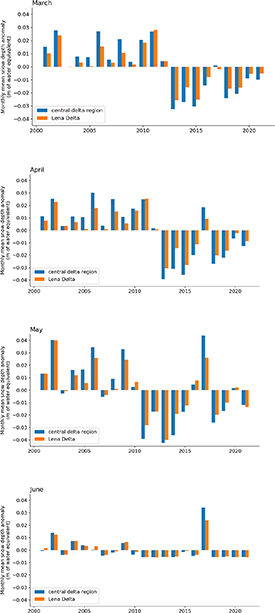
Figure A3. Monthly averaged ERA5-derived spring snow depth (expressed as snow water equivalent in m) in March to June from 2001 to 2021 in form of absolute deviation per year from the arithmetic mean (am2001–2021) per grid cell. Averaged snow depth deviations of the Lena Delta ROI in orange and of the delta region in blue.
Download figure:
Standard image High-resolution imageAppendix. A4. TLC-derived snow-melt and vegetation dynamics
For this study we selected four TLC monitoring sites in spring to summer 2018, specifically of cameras installed to monitor wide-areas that are adequate at MODIS-scale (figure A5).
- (a)The long-term monitoring Campbell Scientific SAM-TLC-LTO on Samoylov Island installed at 3 m height above ground (figure A4) monitors the polygonal tundra surface of the first terrace and is due its larger distance to the ground not able to well resolve the vegetation processes of leaf-out and shooting.
- (b)Three of ten installed Time lapse cameras (Brinno TLC200) in the central Lena Delta in April 2018 (Morgenstern et al 2021b) were selected for this study. The cameras were set up with an hourly resolution with a high quality 720 pixel format.
KUR-TLC-1A monitored a tussock tundra valley system draining the third terrace plateau. KUR-TLC-2B monitored the third terrace upland overlooking polygonal terrain with prostrate shrub tundra. SAM-TLC-1B monitored the flat plateau surface of the first terrace close to Samoylov Island, similarly to SAM-TLC-LTO monitoring polygonal tundra.

Figure A4. Samoylov TLC set-up on the tundra with two Campbell TLCs. The lower TLC (SAM-TLC-LTO) at 3 m height recording was used in this study. Reproduced from (Boike et al 2019). CC BY 4.0.
Download figure:
Standard image High-resolution image
Figure A5. Samoylov long-term TLC (SAM-TLC-LTO) and TLCs installed in 2018 in the central delta (TLC: red points). Sentinel-2 true color (ESA©), August 2018, as background image in UTM Z52 N.
Download figure:
Standard image High-resolution image
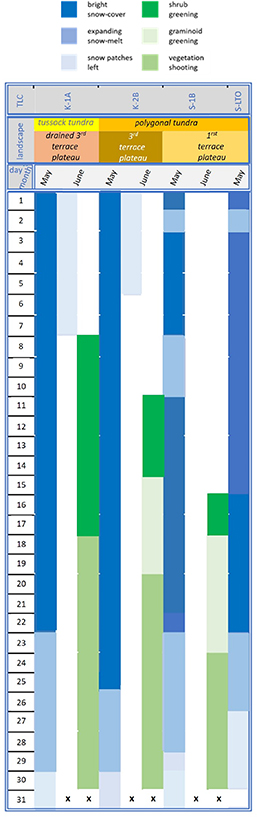
Table A4. TLC records in May to June 2018 with timing of the snow-melt and vascular plant cover leaf-out and shooting for KUR-TLC-1 A (K-1 A), KUR-TLC-2B (K-2B), SAM-TLC-1B (S-1B), and SAM-TLC-LTO (S-LTO).
|
Tables A5. Site-level timing of snow-melt recorded by SAM-TLC-LTO on Samoylov Island in the years 2007, 2008, 2009, 2011, 2012, 2015, 2016, 2017, 2018.
|