


Abstract
Water plays an important role in underpinning equitable, stable and productive societies and ecosystems. Hence, United Nations recognized ensuring water security as one (Goal 6) of the seventeen sustainable development goals (SDGs). Many international river basins are likely to experience 'low water security' over the coming decades. Water security is rooted not only in the physical availability of freshwater resources relative to water demand, but also on social and economic factors (e.g. sound water planning and management approaches, institutional capacity to provide water services, sustainable economic policies). Until recently, advanced tools and methods are available for the assessment of water scarcity. However, quantitative and integrated—physical and socio-economic—approaches for spatial analysis of water security at global level are not available yet. In this study, we present a spatial multi-criteria analysis framework to provide a global assessment of water security. The selected indicators are based on Goal 6 of SDGs. The term 'security' is conceptualized as a function of 'availability', 'accessibility to services', 'safety and quality', and 'management'. The proposed global water security index (GWSI) is calculated by aggregating indicator values on a pixel-by-pixel basis, using the ordered weighted average method, which allows for the exploration of the sensitivity of final maps to different attitudes of hypothetical policy makers. Our assessment suggests that countries of Africa, South Asia and Middle East experience very low water security. Other areas of high water scarcity, such as some parts of United States, Australia and Southern Europe, show better GWSI values, due to good performance of management, safety and quality, and accessibility. The GWSI maps show the areas of the world in which integrated strategies are needed to achieve water related targets of the SDGs particularly in the African and Asian continents.
Export citation and abstract BibTeX RIS

Original content from this work may be used under the terms of the Creative Commons Attribution 3.0 licence. Any further distribution of this work must maintain attribution to the author(s) and the title of the work, journal citation and DOI.
1. Introduction
Water is a vital resource necessary for the survival of human society and of ecosystems. A famous quotation from Coleridge (Coleridge 1798): 'Water, water, everywhere, nor any drop to drink', points out the uneven distribution of freshwater in space and time as well as its impaired quality (Postel et al 1996, Oki and Kanae 2006). The availability of freshwater resources is one of the main drivers of the quality of social and ecological systems on which we depend.
Unfortunately, human-water systems are traditionally viewed through the lens of physical 'water scarcity' (Gunda et al 2015), either demand driven water scarcity (water stress) or population driven scarcity (water shortage). The demand-driven scarcity is measured by calculating the ratio of estimated annual freshwater demand to availability, with a threshold set exceeding 0.4 (Vörösmarty et al 2005). The supply-driven scarcity is instead measured by calculating per capita availability of renewable freshwater resources: water is scarce when the availability goes below 1000 m3 per person per year (Falkenmark et al 1989). Many of the previous studies used these concepts of water scarcity for their macro-scale assessment at annual (Arnell 1999, Vörösmarty et al 2000, Alcamo and Henrichs 2002, Alcamo et al 2003, Oki and Kanae 2006, Islam et al 2007, Kummu et al 2010) and monthly time scale (Wada et al 2011a, Hoekstra et al 2012).
Nevertheless, these traditional assessments of water scarcity are usually poorly integrated with the needs of policy makers and practitioners (Bakker 2012), giving only little attention to the human dimensions such as social and institutional capacities (Bakker and Morinville 2013). Alongside climatic changes and population growth (Vörösmarty et al 2000), heterogeneous distribution of water resources is pronounced by economic disparity, poor governance and institutional failures. The integration of both physical and human pressures on water resources (e.g., growing global population, changing climate, and increasing urbanization), is a fundamental requisite for a comprehensive understanding of human-water systems.
According to Grey and Sadoff (2007), water security refers in particular to the availability of an acceptable quantity and quality of water for health, livelihoods, ecosystems and production, coupled with an acceptable level of water-related risks to people, environments and economies. Ensuring water security, vital for people wellbeing, agriculture, energy and other sectors, is therefore one of the major challenges of the 21st Century for the scientific community, society, and policy.
After phasing out of the Millennium Development Goals in 2015, the United Nations Rio + 20 Summit 2012 in Brazil committed to establish a set of sustainable development goals (SDGs) to guide global development for achieving sustainability (Glaser 2012). As an outcome, the United Nations have recently adopted Resolution 70/1 'Transforming our world: the 2030 Agenda for Sustainable Development' with 17 SDGs and relative targets to be achieved by 2030 (UN 2015). Goal 6 is to 'ensure availability and sustainable management of water and sanitation for all' (UNSDSN 2013). The major challenges for Goal 6 include issues of water scarcity, access to safe drinking water, sanitation, water quality, flood risks, and transboundary water. In order to achieve Goal 6 and monitoring the targets, a comprehensive assessment of global water resources considering multiple challenges in an integrated manner is required. However, only very few studies attempted the development of integrated assessment frameworks. Examples are the water-poverty index (Sullivan 2002), water-vulnerability index (Hamouda et al 2009, Sullivan 2011, Gain et al 2012, Giupponi et al 2013, Aleksandrova et al 2016), and risk index (Gain and Giupponi 2015, Giupponi et al 2015, Gain et al 2015b). The interactions between humans and water have recently been viewed comprehensively in terms of 'water security' (Gunda et al 2015).
Vörösmarty et al (2010) assessed global threats to water security rather than water security per se. In their assessment, a threat framework is developed considering twenty-three indicators for assessing threats to human water security and biodiversity. The selected indicators are mostly of bio-physical origin, with little consideration of the human dimension. Governance, for example is not considered. Lautze and Manthrithilake (2012) assessed water security considering five critical dimensions (i.e., basic needs, agricultural production, the environment, risk management and independence) for 46 countries in the Asia–Pacific region. Despite they have considered indicators of physical and socio-economic dimensions, recent developments of models considering physical processes have not been taken into account. Recently, Dickson et al (2016) consolidated a comprehensive and flexible list of indicators for assessing community water security. However, the assessment is limited to local—community—scale rather than global scale.
In order to overcome these gaps, this study aims at providing a first global understanding of the status of water security, using a spatial multi-criteria analysis (MCA) framework that goes beyond available recent water scarcity assessments. In this study, physical dimensions are mainly based outputs from the state of the art global hydrologic model PCR-GLOBWB at a monthly temporal scale that go beyond traditional assessment at yearly scale (Vörösmarty et al 2000, Alcamo and Henrichs 2002, Islam et al 2007). Compared to previous attempts, this study integrates physical and socio-economic dimensions of security within a unique index.
2. Methods
For assessing water security at global scale, the term 'security' is conceptualized as a function of 'availability', 'accessibility to services', 'safety and quality', and 'management'. Specific indicators are identified and data for each of the indicators are collected from different sources, ranging from modeling output to previous studies. As the indicator values have different units of measurement, these are normalized between 0 and 1 scale in order to be comparable with other indicators. The global water security index (GWSI) is calculated by aggregating the indicators using spatial MCA methods. We have considered both simple additive weighting (SAW) and ordered weighted average (OWA) methods. The steps are described below.
2.1. The concept of security
The conceptualization of water security differs from discipline to discipline, from area to area, from theme to theme. While there is no universal definition for 'security', diverse notions can be found in the available security literature (Grey and Sadoff 2007, Bakker 2012, Bogardi et al 2012, Cook and Bakker 2012, Allan et al 2013, Grey et al 2013, Lawford et al 2013, Pahl-Wostl et al 2013, Benson et al 2015, Gober et al 2015, Gain et al 2015a). These diverse notions include common factors such as availability, accessibility, affordability, quality, safety, stability (Hoff 2011, Bizikova et al 2013). Considering these key aspects, we define 'water security' as the conditions in which a sufficient quantity of water resources is available and accessible of adequate quality. To operationalize the definition, first, we should emphasize whether a sufficient quantity of water resources is available or not. Second, we need to focus whether available water resources is accessible or affordable to society and ecosystem. Third, we need to consider whether available and accessible water is of good quality and whether the area is free from flood risk. Finally, consideration of governance and management aspect are central to implementing a sustainable approach to water security (Pahl-Wostl et al 2013). Therefore, a quantitative assessment of water security should be carried out taking into account physical, socio-economic and governance dimensions, through the assessment of indicators covering four main criteria: availability, accessibility, safety and quality, and management. In this study, the term, 'security' is considered as the output of spatial MCA and is decomposed into these four criteria.
2.2. Selection of indicators
Physical processes are analyzed for representing water scarcity, droughts, and groundwater depletion, taking advantage of, the outputs of the state-of-the-art macro-scale hydrological and water resources model PCR-GLOBWB (Wada et al 2011b). Model outputs are converted into spatial indicator maps and joined with socio-economic indicators derived from the most recent global statistics. For providing current assessment of global water security, our analysis is limited to available recent data sources. The resolution of final aggregated results is 5 min (similar to Global Agro-ecological Zones by Food and Agricultural Organizations, www.fao.org/nr/gaez/en/). The definition and data source for each of the selected indicators is given in table 1.
Table 1. Definition of water security indicators with data sources.
| Water security criteria | Indicators | Spatial and temporal scales | Definition, notion and data source |
|---|---|---|---|
| Availability | Water scarcity index (WSI) | 0.5° spatial resolution; Monthly mean value of 2010 | WSI is defined as the ratio of total water withdrawal to the water availability including environmental flow requirements. The values with higher WSI lead to decrease water security. (Source: Wada et al 2014b). |
| Drought index (DI) | 0.5° spatial resolution; Yearly value of 2012 | DI is calculated using PCR-GLOBWB. The values with higher DI lead to decrease water security. (Source: Wada et al 2013). | |
| Groundwater depletion | 0.5° spatial resolution; Yearly value of 2010 | Groundwater depletion rate (million m3 yr−1) is calculated using PCR-GLOBWB. The values with higher DI lead to decrease water security. (Source: Wada et al 2012). | |
| Accessibility to services | Access to sanitation | Country scale data for 2014 | Percentage of population with access to improved sanitation. The values with higher access lead to increase water security (Source: Hsu et al 2014) |
| Access to drinking water | Country scale data for 2014 | Percentage of population with access to improved drinking water source. The values with higher access lead to increase water security (source: Hsu et al 2014) | |
| Safety and quality | Water quality index | Country scale data for 2012 | The values with higher index value lead to increase water security. (Source: Srebotnjak et al 2012) |
| Flood frequency index | Country scale flood frequency during 1985–2003 | Frequency of flood events during 1985–2003. (Source: Center for H et al 2005) | |
| Management | World governance index | Country scale data for 2010 | The values with higher index value lead to increase water security. (Source: Kaufmann et al 2010) |
| Transboundary legal framework | River Basin scale data for 2015 | How effective transboundary legal agreements are in place. (Source: http://twap-rivers.org/indicators/) | |
| Transboundary political tension | River Basin scale data for 2015 | Risk of Potential Hydro-political Tensions due to Basin Development in Absence of Adequate Institutional Capacity. (Source: http://twap-rivers.org/indicators/). |
2.2.1. Water availability
The criteria 'water availability' includes indicators that represent 'acceptable' quantity of freshwater. However, the term 'acceptable' is subject to different interpretations by different groups (Pahl-Wostl et al 2013). To make this term operational, first, we have considered the widely used blue water scarcity index (WSI), defined as the ratio of total water withdrawal to the water availability considering environmental flow requirements. Renewable groundwater (i.e., groundwater recharge that goes to base flow) has been accounted for in the water availability side. Water withdrawal includes both surface water and renewable groundwater use for agriculture (irrigation and livestock), industry and households (Wada et al 2011a, Wada et al 2011b). However, nonrenewable or fossil groundwater, i.e. groundwater depletion, has not been considered in the water use, but considered in a separate indicator (Wada et al 2011a, Wada et al 2011b). Nonrenewable groundwater use amount has been subtracted from water withdrawal, since the absolute amount of groundwater resources is not known and cannot be included in the WSI (Wada et al 2011a, Wada et al 2011b). Environmental flow requirements have been considered in WSI calculation (Wada et al 2014a), with the following equation. Water stress is evaluated per month to consider the seasonal variability and occurs whenever the amount of water withdrawal reaches the threshold of 0.4 in that of water availability in a same spatio-temporal domain.
where Ww is the water withdrawal and Aw is the water availability. Ew is the environmental flow requirement. Although environmental flow requirement is best determined by the degree and nature of their dependency on stream flow, such information is rarely observed directly, especially at the scale at which it is modeled in this study. Therefore we calculated Ew to be Q90, i.e. the monthly stream flow that is exceeded 90% of the time, following Smakhtin (2001) and Smakhtin et al (2004) PCR-GLOBWB is used to construct WSI on monthly basis with a spatial resolution of 0.5° (Wada et al 2014b). WSI for monthly average value of 2010 is shown in figure S1 of online supplementary material.
Despite WSI is a useful measure of water availability, we need to consider separately fossil groundwater depletion and hydrological drought as separate indicators of water availability. The groundwater depletion, defined as the persistent removal of groundwater from aquifer storage owing to abstraction, has been estimated for the benchmark year 2010 at a 0.5° grid following the method described in Wada et al (2012). A flux-based method, i.e., calculating the difference between grid-based groundwater recharge (natural recharge and return flow from irrigation as additional recharge) and groundwater abstraction is used to assess groundwater depletion (Wada et al 2012). The groundwater depletion index is shown in figure S2.
For assessing hydrological droughts, we used the monthly 80-percentile flow, Q80, i.e. the mean monthly stream flow that is exceeded 80% of the time, as it is commonly used as a threshold, which accounts for seasonal stream flow variability (Wada et al 2013). Drought frequency was derived by counting the occurrences of drought events, i.e. when stream flow falls below the threshold Q80, and drought index was calculated by dividing drought frequency by the average frequency over the period 1960–2010 (Wada et al 2013). The drought index is shown in figure S3. However, the drought index does not work well for desert area. In order to consider desert area within drought index, we have provided modified drought map (see figure S5), in which aridity class I and II of desert classification (see figure S4) is introduced as high drought value.
2.2.2. Accessibility
The indicators, 'access to sanitation' and 'access to drinking water', calculated through percentage of population with improved sanitation and drinking water, are adopted to represent accessibility of water to people mainly due to varying socio-economic conditions.
2.2.3. Quality and safety
For representing 'quality and safety' of water security, we have considered both water quality index (WATQI) and flood frequency index. Based on WATQI , part of 'Environmental Performance Indicator', developed by Yale Center for Environmental Law and Policy and the Center for International Earth Science Information Network at Columbia University, Srebotnjak et al (2012), expanded its geographical coverage by using hot-deck imputation of missing values (see figure S6). Hot-deck imputation is a method for handling missing data in which each missing value is replaced with an observed response from a similar unit. The modified results better inform decision-makers on the types and extents of water quality problems in the context of limited globally comparable water quality monitoring data (Srebotnjak et al 2012). In addition to water quality index, various physical factors such as flood risks make the available water unsafe (Gain et al 2015b). We, therefore, consider flood risk (see figure S7) as one of the indicators of 'quality and safety'.
2.2.4. Management
In addition to above factors, there are also social and institutional management issues such as water planning and management approaches, institutional capability, economic policies, power relationship and governance systems in place that play an important role for providing water security. In order to consider 'management' aspect, we have considered the 'world governance index' developed by World Bank (Kaufmann et al 2010). Country scale world governance index (see figure S8) was calculated through aggregation of six governance dimensions: voice and accountability, political stability and absence of violence, government effectiveness, regulatory quality, rule of law and control of corruption (Kaufmann et al 2010). In addition, we have assessed transboundary governance status of (i) legal framework (see figure S9) and (ii) hydro-political tension (see figure S10) for 286 river basins of the World (see http://twap-rivers.org/indicators/).
2.3. Normalization of the indicators
A preliminary step for the aggregation of indicators is normalization, as the indicators in a data set often have different measurement units. Several normalization techniques exist in the literature (OECD 2008) and the best choice depends on the indicators which are under consideration and the preferences of the decision maker. In this study, we apply a value function approach. Value functions are mathematical representations of human judgments which offer the possibility of treating people's values and judgments explicitly, logically and systematically (Beinat 1997, Gain and Giupponi 2015, Gain et al 2015b). A value function translates the performance of the indicators into a value score between 0 and 1 which represents the degree to which a decision objective is matched. If the objective is perfectly matched (highest security), the value is 1 and if it is perfectly unmatched (lowest security), the value is given 0. The value functions were introduced in the Geographical Information System (GIS) software environment as fuzzy membership functions (Schmucker 1983), defining how each map element is close to, or far from to a membership value (or degree of membership) of 1 for optimal security (Zadeh 1965). The membership functions were usually linear or in some cases trapezoidal (linear normalization with a plateau to express stable valuation of indicator values below or above a given threshold).
2.4. Aggregation and development of index
For efficient processing of huge amounts of spatial information, data about each indicator are stored as raster map layers (i.e. organized as unitary information cells, the picture elements or pixels), with a spatial resolution of approximately 0.083 decimal degrees (around 10–15 km at intermediate latitudes). Each indicator map is represented as a matrix of pixels with 4320 columns and 2160 rows. Among available GIS software tools (Burrough et al 2015), the spatial analyses were performed in the TerrSet environment, coded with its macro language, allowing to implement complex data processing algorithms in a transparent and reproducible manner.
After having normalized indicators by means of fuzzy membership functions, the resulting map layers have been aggregated with a hierarchical MCA (Saaty 1980). The indicators are aggregated into security criteria, which in turn are aggregated to produce the final outcome, i.e. global water security index, GWSI map. Each indicator and criterion is weighted to express their relative relevance to contribute to the GWSI. The weights were defined by the authors (see table 2). Among the four main criteria of water security, the highest relevance is given to availability (45%), compared to accessibility (20%), safety and quality (20%), and management (15%). According to authors, water security cannot be achieved without available resources. For determining water availability, the most important criterion is blue WSI (weight: 70%). However, blue WSI is not capable to incorporate drought and deep groundwater depletion. Therefore, separate indicators (with 15% weight each) are considered for representing drought and groundwater depletion. Without drinking water, people cannot survive. Therefore, for representing accessibility, access to drinking water is given higher weight (60%), compared to sanitation (40%). Water quality and flood risks were considered equally important for representing safety and quality. Water governance status of a country is the most important factor for managing resources. Transboundary legal framework and political tensions also support secured supply of water resources in an area. Therefore, for representing management, highest priority is given to world governance index (70%), followed by transboundary legal framework (15%) and political tension (15%).
Table 2. Hierarchy and weights for assessing global water security.
| Main components (weight) | Security criteria (weights) | Indicators (weights) |
|---|---|---|
| Global water security index | Availability (45%) | Water scarcity index (70%) |
| Drought index (15%) | ||
| Groundwater depletion (15%) | ||
| Accessibility to water services (20%) | Access to sanitation (40%) | |
| Access to drinking water (60%) | ||
| Safety and quality (20%) | Water quality index (50%) | |
| Global flood frequency (50%) | ||
| Management (15%) | World governance index (70%) | |
| Transboundary legal framework (15%) | ||
| Transboundary political tension (15%) |
Ordered weights (indicators/criteria ordered in decreasing order): (i) aggregation of 2 indicators/criteria: 0.8; 0.2, (ii) aggregation of 3 indicators/criteria: 0.6; 0.2; 0.2; (iii) aggregation of 4 indicators/criteria: 0.55; 0.15; 0.15; 0.15.
Since weighting is inherently subjective, in the future practical applications weights should be the result of participatory processes with relevant stakeholders (policy makers, institutions, NGOs, etc).
Once indicators are normalized and weighted, a suitable aggregation algorithm has to be selected in accordance with the logic of the conceptual model, but also according to the preferences and attitudes of the decision makers. The aggregation can be done via SAW in which normalized values of indicators/criteria are first multiplied by weights (all weights summing up at 1), and then summed up (Afshari et al 2010, Wang 2015, Kaliszewski and Podkopaev 2016). A well-known drawback of SAW is its full compensatory effect: the result of aggregating a very good and a very bad value is the same as when two average values are aggregated (Giupponi et al 2013, Gain and Giupponi 2015, Giupponi and Gain 2016). Therefore, we adopt the OWA approach (Yager 1988, Eastman et al 1993, Yager and Kacprzyk 1997), an evolution of SAW. OWA applies a second round of weighting in which weights are applied to the ordered sequence of values previously weighted as in SAW (Mianabadi et al 2014). For example, if three indicators have to be aggregated, first, their values are weighted as usual (weighted scores) and then they are ordered (ordered scores) and weighted again with a new vector of weights. This second weighting step makes it possible to overcome the full compensation of SAW and to implement the preferred degree of ANDness, with two extremes: the pessimist case of the limiting factor (i.e. the entire weight is given to the lowest ordered score) and the optimist case in which only the highest score determines the value of the aggregated index (Giupponi and Gain 2016).
More specifically, in this work we opt for a pessimistic approach in which the aggregated index is calculated giving higher weights to those criteria showing the worst performances to account for the constraining effects of limiting factors to the overall performance of the index (see table 2 for details). Although we applied OWA pessimistic approach for detailed assessment, however, we also have explored uncertainty associated with different aggregation algorithms. In particular, we report the effects on GWSI results by comparing: (i) OWA pessimistic (risk averse decision maker) with the weights provided in table 2 and OWA pessimistic with equal weights; (ii) OWA pessimistic and SAW (full compensation of good and bad), and (iii) OWA pessimistic (risk averse decision maker) and OWA Optimistic (risk taker decision maker).
3. Results
We argue that the blue WSI alone is inadequate as a comprehensive assessment of global water resources availability as it does not incorporate considerations of aridity, drought and groundwater depletion in the assessment. Therefore, we combine the blue WSI (Wada et al 2014b) with two more indicators: groundwater depletion (Wada et al 2012) and the drought index (Wada et al 2013), to obtain a more comprehensive notion of water availability (figure 1).

Figure 1. Assessment of water availability, aggregated through figures S1, S2 and S5.
Download figure:
Standard image High-resolution imageResults show that remarkable water availability issues are located in India, China, part of USA and African countries where various combinations of high water demands, population and economic growth, and arid environment exacerbate the imbalance between needs and available resources. Importantly, more than 90% of the global irrigated areas are present in these regions.
The available freshwater, however, may not be accessible due to various socio-economic and physical constraints (e.g., lack of infrastructures). Accessibility to safe drinking water and improved sanitation (calculated through percentage of population with improved sanitation and drinking water) is, therefore, an important indicator for water security assessment (figure 2). Most people in Africa do not have access to safe drinking water and improved sanitation, whereas in developed countries such as USA, Canada, Australia and Europe almost all people do.
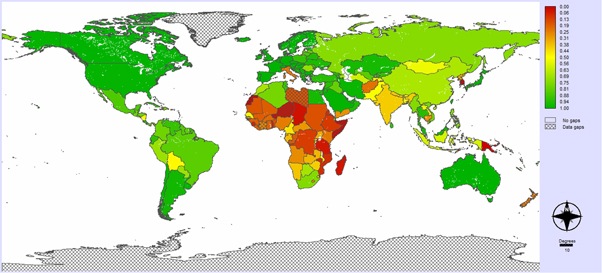
Figure 2. Assessment of accessibility to water services.
Download figure:
Standard image High-resolution imageIn some areas, available freshwater cannot provide benefits to societies and ecosystems due to impaired quality. High quality freshwater is found in Scandinavian countries, Canada, and New Zealand, whereas water quality is low in Africa and the Middle East (figure S6). In addition to the problem of water quality, flood risks make available freshwater unsafe and it increases risks to people and ecosystem. Water volumes flowing during wet seasons cannot be used during the low flow seasons unless storage systems, for example reservoirs, are in place (Gain and Wada 2014). Flood risk is a major concern all over the world including developed and developing countries. By combining water quality and flood frequency indices, we have integrated indicator of water 'quality and safety' (figure 3).
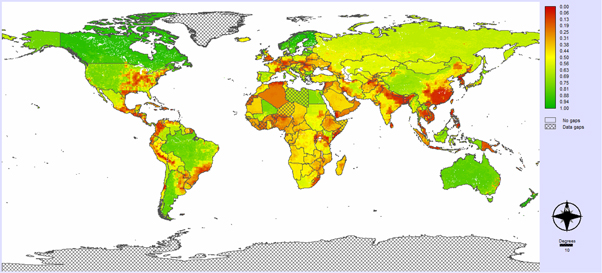
Figure 3. Aggregated quality and safety index (aggregation of figures S6 and S7).
Download figure:
Standard image High-resolution imageThe country level 'world governance index' developed by the World Bank (Kaufmann et al 2010) has been considered and included in the analysis. Further, transboundary water resources management is another important dimension of governance. In order to provide an indicator for transboundary governance, we have aggregated information concerning the legal framework and hydro-political tension for 286 river basins of the World (see http://twap-rivers.org/indicators/). Governance status appears to be relatively low in Asia, Africa and South America. Combining both general governance and the transboundary governance indicator, an integrated index of management capacity is calculated (figure 4). Management is generally good in developed countries, whereas it is poor in Africa, the Middle East and Asia.

Figure 4. Aggregated management index (aggregation of figures S8, S9, and S10).
Download figure:
Standard image High-resolution imageBy aggregating the indices of water availability, accessibility, safety and quality, and governance through OWA pessimistic aggregation, we have developed the GWSI. Figure 5 shows that water security is low in many countries in Africa and Asia, whereas the criteria for water security is met in Scandinavian countries, New Zealand, Australia, Canada, Japan, and throughout Western Europe. It is important to note that water security is low in part of USA primarily due to excessive pumping of groundwater. Figure 5 also shows where we have data gaps for some indicators, in particular in Africa and in small island states.
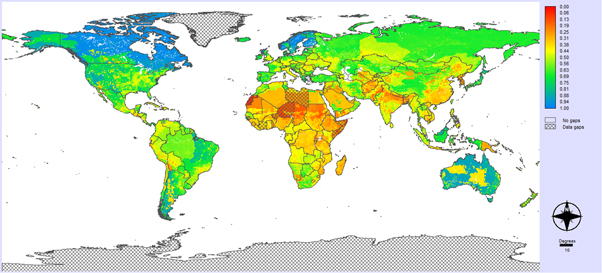
Figure 5. Aggregated global water security index, calculated using the aggregation of water availability, accessibility, safety and quality, and management indices. The value '0–1' (with the continuous color 'red to blue') represents 'low to high' security. The shaded areas identify countries with data gaps.
Download figure:
Standard image High-resolution imageThe performance of selected indicators and their aggregated notions for China, India, USA, Australia, Brazil and Bangladesh is shown in figure 6. Flood risk, impaired water quality, governance and transboundary management are major problems in Bangladesh, India, Brazil and China. Therefore, the performance for quality and safety as well as management is very low in these countries. Due to high flood risks (Gain et al 2013) and high arsenic concentration in the groundwater (Burgess et al 2010), along with transboundary complexities (Gain and Schwab 2012, Gain and Giupponi 2014, Rouillard et al 2014), water resources is highly insecure in countries like Bangladesh, even physical water availability is not a major problem there. Based on NASA's Gravity Recovery and Climate Experiment (GRACE) satellites, Richey et al (2015) found that groundwater is disappearing fast from the world and India is among the worst hit. However, the performance in Australia is good for all the indicators.
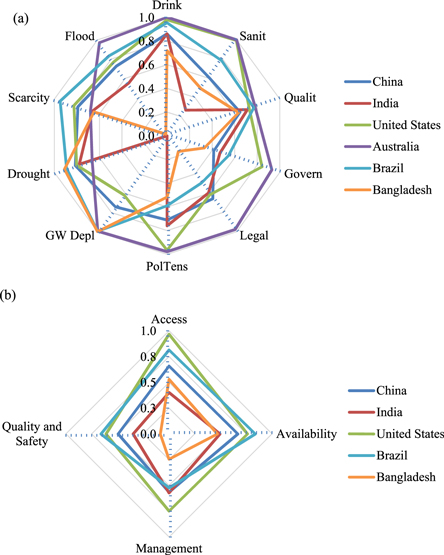
Figure 6. Performance of designated indicators (a) and their aggregated notions (b) for some selected countries. The value '0' represents worst performance, whereas '1' represents best performance. The average value of water scarcity index (Scarcity), drought index (Drought) and groundwater depletion (GW Depl); access to sanitation (Sanit) and access to drinking water (Drink); water quality index (Qualit), and flood frequency index (Flood); world governance index (Govern), Transboundary legal framework (Legal) and transboundary political tension (PolTens) is shown in (a), whereas their aggregated notion, 'availability', accessibility (Access), quality and safety, and management is shown in (b).
Download figure:
Standard image High-resolution imageAs mentioned above, beside the OWA Pessimistic aggregation procedure, we ran other aggregation scenarios, to explore the uncertainty associated with the subjectivity inherent in weighting. The descriptive statistics of difference between (i) OWA pessimistic (risk averse decision maker) with the weights provided in table 2 (Pes) and OWA pessimistic with equal weights (Pese); (ii) OWA pessimistic (Pes) and SAW (full compensation of good and bad), and (iii) OWA pessimistic (risk averse decision maker)(Pes) and OWA Optimistic (risk taker decision maker) (Opt) are shown in table 3. As expected, the highest differences are between pessimistic and optimistic, while the lowest are between the adopted solution and the test of adopting equal weights. The values of the means are always negative, meaning that the map we produced is more precautionary, in that the values of water security are lower than the others. The spatial distributions of these differences are shown in figures S11–S13 of online supplementary material.
Table 3. Descriptive statistics of the difference between different aggregation algorithms.
| Pes–Pese | Pes–SAW | Pes–Opt | |
|---|---|---|---|
| Minimum | −0.424 | −0.350 | −0.575 |
| Maximum | 0.194 | 0.141 | 0.205 |
| Mean | −0.021 | −0.032 | −0.052 |
| Standard deviation | 0.058 | 0.070 | 0.114 |
4. Discussions and conclusions
To provide a comprehensive picture of water resources, Vörösmarty et al (2000) suggested an integrated approach bringing together the physical, and socioeconomic dimensions. Similarly, Kummu et al (2010) mentioned that research on water scarcity should continue to extend towards the inclusion and scrutiny of concepts of water governance, water management, water policy, environmental integrity, and water's role in societal and economic development. Using these dimensions, the present study provides a first global analysis of water security using a spatial MCA framework that goes beyond available water scarcity assessment. Figure S1 (of supplementary material) indicates that physical water scarcity is very high in India, North-East China, some South and Eastern European countries, parts of United States, countries of middle east and Africa. However, compared to water scarcity assessment (Wada et al 2011b, Wada and Bierkens 2014, Wada et al 2014a), this study shows heterogonous distribution of water security. The comparison between (blue) water scarcity and water security assessments is shown in figure 7. According to the results, (blue) water scarcity value is better in Bangladesh, China (country as a whole), India (country as a whole), and Brazil than water security. For example, low water security in Bangladesh is represented by extreme flood along with deterioration of water quality (e.g., arsenic contamination), transboundary water problems. Similarly, beyond blue water scarcity, low water security in India, China and Brazil, is denoted by lack of access to safe water and sanitation, deep groundwater depletion, drought, bad quality along with management problems. In Australia, water security is better than water scarcity value due to good management, good accessibility to safe water and due to maintenance of good quality. In contrast, the situation becomes very bad in African countries due to poor performance of governance, lack of access to drinking water and sanitation (Snorek et al 2014). In Niger, 17 million people do not have access to adequate sanitation and 8 million people lack access to clean water.

Figure 7. Comparison between blue water scarcity and water security assessment for some selected countries. The value '0' represents worst performance, whereas '1' represents best performance.
Download figure:
Standard image High-resolution image
The model based simulation of water scarcity, drought and groundwater depletion comprehensively represent the security of global water availability. The outputs (i.e., river flow) from PCR-GLOBWB are comparable to other global hydrological models like Water GAP: both models have been used in the number of multi-model simulation projects, notably in the ISI-MIP project (www.isimip.org/). Generally, the spatial variability in water availability (i.e., river discharge) between PCR-GLOBWB and WaterGAP is similar in most of large catchments and the difference is mostly within 10%–20% (Dankers et al 2014, Prudhomme et al 2014).
Moving beyond qualitative understanding of water security (Bakker 2012, Cook and Bakker 2012), we provide a comprehensive quantitative assessment for current period. Access to safe water and sanitation, water quality, flood risks and water governance are also the major security concerns for managing global water resources. The GWSI and the indicators used in this study directly refer Goal 6 SDG targets. Therefore, GWSI can be useful to support Goal 6 SDG monitoring of targets to be achieved by 2030. Success in attaining the SDGs will rest on how well monitoring of the progress towards the goals can be tracked, and how consequent implementation actions can be identified, refined and implemented. The main challenge for monitoring the implementation of the SDGs will lay in the availability of comparable global raw data collected with adequate spatial detail and quality at regular time intervals (Giupponi and Gain 2016). In this study, data are collected with different spatial resolutions and reported to a common GIS structure with 5 min resolution, which is finer than current available information, in view of allowing the integration of more detailed information in the near future, for more accurate spatial assessment. Similarly, time resolution is currently sub-optimal in that not all the data sets utilized so far refer to the same period of time.
Country-level averaging and aggregation hide the variability of physical and socio-economic phenomena. Therefore, the spatial detail is crucial to identify hot spot areas of greatest interest for planning the developments towards the SDGs. Remotely sensed data provided by the satellites will play a greatest role in providing the spatial and temporal information required.
Given the aim of exploring the feasibility of proposing an assessment method that may contribute to the future implementation of the SDGs, we envisage consolidating fuzzy membership functions in the future, when targets will be agreed upon, so that the output of the classification could explicitly demonstrate the areas in which the SDG targets are being accomplished. Similarly, the weights of indicators will require careful consideration with the involvement of relevant stakeholders and in depth sensitivity analysis.
The GWSI is proposed as a means to monitor progress towards SDGs in the coming years. In order to monitor SDG targets, the performance of each of the selected indicators should be assessed similarly to the examples reported in figure 6. The evaluation of spatial and temporal performances will allow to identify the specific needs for improvement in each country. For instance, repeated assessments on an annual basis will allow for the identification of progressive or persisting problems. The spatially explicit analysis identifies the areas where strategies are required to increase the availability of water resources, to expand accessibility to larger groups of people to safe water and sanitation, to improve water quality and reduce flood frequencies, and, finally, to improve the capability of national as well as transboundary institutions. To increase water availability, we need to improve agricultural water productivity, irrigation efficiency, and domestic and industrial water-use intensity, reduce population growth, increase water storage in reservoirs and, finally, to increase the use of desalination technologies (Wada et al 2014a). In order to increase access to safe water and sanitation (especially in sub-Saharan Africa and developing countries), ongoing efforts of the World Health Organization (WHO) need to be strengthened in terms of promotion of home water treatment, improvement of hygiene behaviors and gender aspects, increased use of affordable, effective and environmentally-friendly of drinking water and sanitation. Global water quality can be improved by developing international water quality guidelines for aquatic ecosystems, strengthening global process for monitoring, storing and accessing water quality information. In order to reduce flood frequencies, water storage needs to be increased using the benefits of wetlands. To improve governance, the institutional ability of transboundary organizations needs to be strengthened by implementing and adopting some common policies such as Water Framework Directives and Flood Directives in Europe. In addition, general governance needs to be improved in the Middle East, Africa and other developing countries by increasing accountability and transparency, political stability, and controlling corruption. In order to achieve Goal 6 by 2030, these strategies need to be implemented in an integrated manner.
Acknowledgments
AG was supported by Alexander von Humboldt Foundation. Authors would like to acknowledge Leverhulme Trust for the financial support. AG designed the research and processed the data. YW analyzed the water scarcity index, groundwater depletion and drought index. CG designed and performed the spatial analysis and aggregation of indicators.