Article

Pore Characteristics of Lacustrine Shale Oil Reservoir in the Cretaceous Qingshankou Formation of the Songliao Basin, NE China

1
State Key Laboratory of Biogeology and Environmental Geology, China University of Geosciences, Beijing 100083, China
2
School of Earth Sciences and Resources, China University of Geosciences, Beijing 100083, China
3
Research Institute of Petroleum Exploration and Development, PetroChina, Beijing 100083, China
4
College of Geoscience and Surveying Engineering, China University of Mining and Technology, Beijing 100083, China
5
Geological Engineering and Geomatics, Chang’an University, Xi’an 710054, China
*
Authors to whom correspondence should be addressed.
Energies 2020, 13(8), 2027; https://doi.org/10.3390/en13082027
Submission received: 8 March 2020 / Revised: 3 April 2020 / Accepted: 15 April 2020 / Published: 18 April 2020

Abstract

:
Shale oil is hosted in nanopores of organic-rich shales, so pore characteristics are significant for shale oil accumulation. Here we analyzed pore characteristics of 39 lacustrine shale samples of the Late Cretaceous Qingshankou Formation (K2qn) in the Songliao Basin, which is one of the main shale oil resource basins in China, using field emission-scanning electron microscopy (FE-SEM), and low-pressure nitrogen adsorption. We accomplished fractal analysis, correlation analysis using correlation matrix and multidimensional scaling (MDS), and prediction of fractal dimensions, which is the first time to predict pore fractal dimensions of shales. Interparticle pores are highly developed in K2qn. These shales have mesoporous nature and slit-shaped pores. Compared with the second and third members (K2qn2,3), the first member of the Qingshankou Formation (K2qn1) has a larger average pore diameter, much smaller surface area, fewer micropores, simpler pore structure and surface indicated by smaller fractal dimensions. In terms of pore characteristics, K2qn1 is better than K2qn2,3 as a shale oil reservoir. When compared with marine Bakken Formation shales, lacustrine shales of the Qingshankou Formation have similar complexity of pore structure, but much rougher pore surface. This research can lead to an improved understanding of the pore system of lacustrine shales.

1. Introduction

With the increasing energy demands of the world, the transition from conventional petroleum to unconventional petroleum is inevitable [1,2,3,4,5,6]. Shale oil, as a kind of unconventional petroleum resource, is attracting growing attention [7,8,9,10]. Multistage-fractured horizontal drilling dramatically enhances the production performance of shale reservoirs [11]. Natural fracture spacing significantly affects shale reservoir performance [11]. It is more profitable to find oil instead of gas since oil has more energy density and it is easier to transport, store, and use [9].
A shale oil reservoir is a kind of self-contained source-reservoir system. The pores and micro-fractures in inorganic minerals and organic matter constitute a complicated pore-fracture system in shales [1,2,12,13]. Shale oil is stored in four types of pores, i.e., intraparticle (intraP) pores, interparticle (interP) pores, organic-matter pores, and micro-fractures [4]. Intraparticle pores are located within particles. Interparticle pores exist between particles and crystals. They are possible to be part of an active pore network. Organic-matter pores are intraparticle pores located within organic matter, and they are also likely to be part of an interconnected network since organic-matter particles are interconnected [14]. Different pore-size scales also have different contributions to the pore network [15]. The pores not only store hydrocarbons but also are potential flow paths for hydrocarbon production [16]. Therefore, understanding the pore characteristics in shales is crucial.
Since different kinds of pore types and pore sizes exist, pore characterization in shales is challenging [15]. The pore characteristics of marine shales have been extensively studied [17,18,19,20,21,22,23,24], such as Bakken Shale from the Williston Basin [25,26,27] and Longmaxi Shale from the Sichuan Basin [28,29,30,31,32]. The Bakken Shale is not only the world-class source rock but also the dominating production zone [33]. The major pores in the Bakken Shale are mesopores and macropores [25]. The fractal dimension of the pores in the Wufeng-Longmaxi Shale is primarily related to micropores, and undoubtedly helpful to represent the complexity of pore structure and reveal the degree of micropore development [29]. The nature of adsorption/desorption isotherms gives a quantitative assessment of the porous structure of the materials [34,35,36,37]. Xe+ plasma focused ion beam scanning electron microscopy (PFIB) has also been applied in shales [15]. In addition, most researchers have used univariate linear regression with 2D scatter plots to figure out the correlations between pore parameters and mineral content and total organic carbon (TOC) [38,39]. Only seldom researchers have applied multivariate linear regression, and 3D scatter plots to analyze these relationships to eliminate Simpson’s paradox to some degree [22]. One manifestation of Simpson’s paradox is a counterintuitive statistical appearance of data in a complex system with the interaction of multiple variables [40]. However, shale oil reservoirs in China are terrestrial shales, and the research on pore characteristics of terrestrial shale oil reservoirs, especially lacustrine shales, is still lagging behind.
The Songliao Basin is both a major terrestrial petroleum basin and a significant shale oil resource basin in China. Petroleum production potential evaluation and horizontal drilling have been conducted in the Songliao Basin [33]. Lacustrine organic-rich shale in the Late Cretaceous Qingshankou Formation is the primary shale oil source rock in the Songliao Basin [10]. Qingshankou Formation shale is characterized by a high content of organic matter at the oil generation stage and is of considerable thickness. Moreover, the SK-1 scientific drilling project under the International Continental Scientific Drilling Project framework is the world’s first continental drilling project aiming to retrieve complete and continuous Cretaceous terrestrial strata [41,42]. SK-1 scientific drilling project recovered continuous cores with a total length of 2485.89 m, from the Late Turonian to the end of the Cretaceous [41,43,44]. There are continuous cores with a length of 497.02 m in the Qingshankou Formation in the SK-1s well, which is quite convenient for doing this research.
In this study, we collected 39 samples of shale in the Qingshankou Formation (K2qn) of the SK-1s well and conducted FE-SEM and low-pressure nitrogen adsorption analysis. The primary objectives of this study are 1) to study pore morphology, pore structure, and pore fractal characteristics of lacustrine shales; 2) to analyze relationships between fractal dimensions and pore structure parameters using correlation matrix and MDS and to predict pore fractal dimensions of shales for the first time, using stepwise regression and 3D scatter plots, and 3) to choose a better shale oil reservoir from Qingshankou Formation in terms of pore characteristics and to understand the differences between marine and lacustrine shale oil reservoirs pore characteristics.

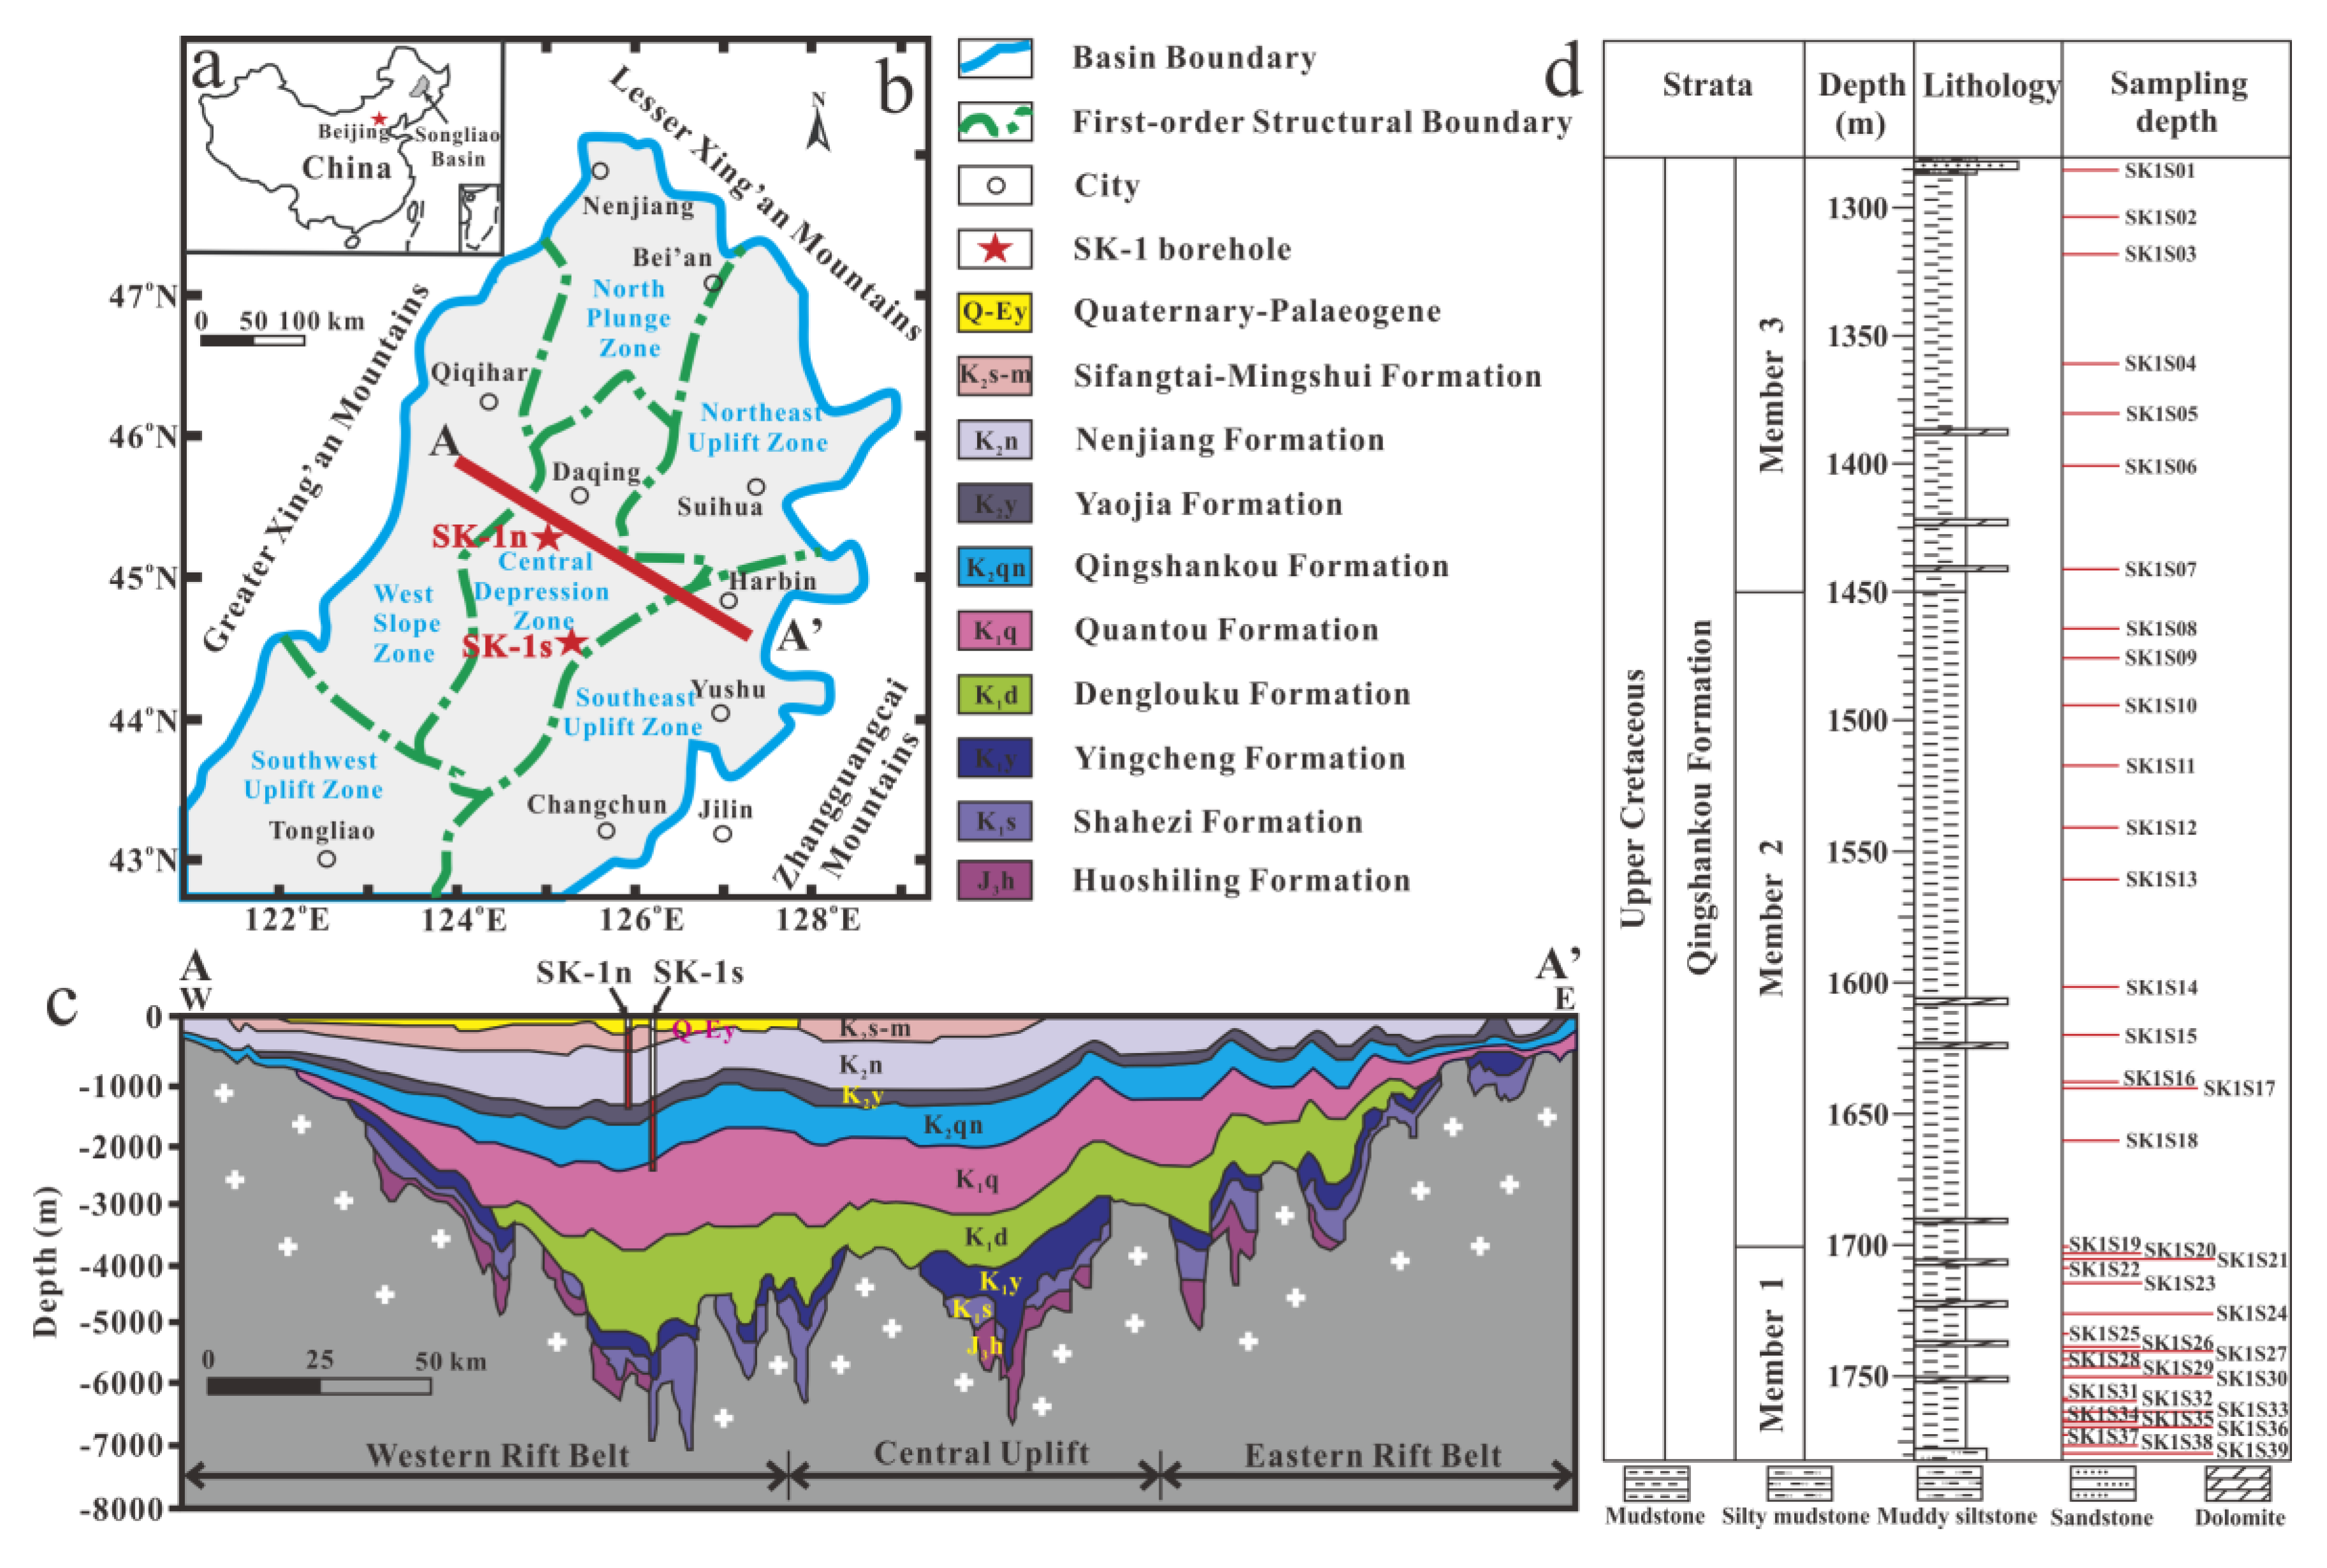
2. Geological Setting

The Songliao Basin covers approximately 260,000 km2 in Heilongjiang, Jilin, and Liaoning provinces of northeast China (Figure 1a). It is about 750 km in length in the north-south direction and 350 km in width in the east-west direction [45,46]. The Songliao Basin was a long-lived lake basin in the Cretaceous, and it has continuous Cretaceous strata. This basin preserved as much as 10,000 m of alluvial fan, volcaniclastic, fluvial, and lacustrine sediments [45]. The basin trends in an NNE direction with a diamond-shaped basin floor. It went through three major tectonic events, including rifting, thermal subsidence, and structural inversion [46]. During the Late Mesozoic, the interaction between the Pacific and Eurasian plates resulted in an extended rift-valley system in south Mongolia and northeast China [47,48]. From the Late Jurassic to the Cretaceous, the Songliao Basin, which was in northeast China, was developed as a rift basin in this extended system [46,47,48]. During thermal subsidence, lithospheric cooling and extension during the whole Cretaceous resulted in regional deformation and subsidence [46]. The Songliao Basin gently developed into a considerable lake with lake-level fluctuations and probable marine incursions [49]. Generally, the thickness of typical sediment packages is about 3000–4000 m. These sediment packages are composed of lacustrine, alluvial, and fluvial sediments [45]. Sediments in the SK-1 well cores were deposited during this stage. Structural inversion, which included uplift and folding, started with the deposition of the Upper Nenjiang Formation and culminated at the end of the Cretaceous [46]. Six structural units have been established in the Songliao Basin. They are Central Depression Zone, North Plunge Zone, Northeast Uplift Zone, Southeast Uplift Zone, Southwest Uplift Zone, and West Slope Zone, respectively (Figure 1b) [50].
The SK-1 drilling project includes two boreholes, the north borehole (SK-1n) and the south borehole (SK-1s). Figure 1b shows the locations of these two boreholes. These two boreholes are 60 km apart. The six stratigraphic formations in the SK-1 cores (Figure 1c) are primarily composed of mudstones, siltstones, and sandstones, deposited in various paleoenvironments from deep lakes to flood plains [45]. The Qingshankou Formation (1285.91–1782.93 m in SK-1s well) is primarily composed of black-gray mudstone interbedded with gray sandstone, siltstone, and dolomite. The black mudstone in the first member of the Qingshankou Formation (K2qn1), which is also the most significant petroleum source rock in the Daqing Oilfield, was deposited in a deep lake environment [46]. The black-gray mudstone in the second and third members (K2qn2,3) was deposited mainly in a semi-deep lake environment [50]. The Qingshankou Formation is Late Turonian to Late Coniacian in age [50].

3. Sampling and Analytical Techniques

3.1. Sampling

A total of 39 lacustrine shale samples were selected from K2qn in the SK-1s well. Among them, 20 samples were from K2qn1, and 19 samples were from K2qn2,3. Figure 1d shows the strata and sampling depths. Since these core samples were well preserved without weathering, the measured data is accurate. Each sample was divided into several pieces for conducting low-pressure nitrogen adsorption, and FE-SEM studies.

3.2. Field Emission-Scanning Electron Microscopy (FE-SEM)

We used an argon ion beam to polish one piece of each sample (about 10 mm in length, 10 mm in width, and 3–5 mm in height) to generate a flat and smooth surface by Leica RES102 Ion Milling System of Leica company from Germany at the Petroleum Geology Research and Laboratory Center. Every single sample was carbon-coated (13 nm thick). An Apreo FE-SEM of FEI company then imaged the samples. The maximum resolution of a single-pixel is 0.9 nm. Energy-dispersive spectrometer (EDS) measured the semi-quantitative analysis of mineral composition. We can directly observe pore types, pore morphology, and pore distribution [17,19].

3.3. Low-pressure Nitrogen Adsorption

Low-pressure nitrogen adsorption was conducted with a Micromeritics ASAP 2020HD88 Surface Area and Porosity Analyzer of Micromeritics company from the U.S. at Beijing Center for Physical and Chemical Analysis, China. Equivalent surface areas were determined with the Brunauer–Emmett–Teller (BET) method. Pore volumes were calculated using the Density Functional Theory (DFT) model. Average pore diameters were calculated with the adsorption branch by the Barrette–Joyner–Halenda (BJH) model. There is a comprehensive description of the different theories mentioned above [51]. In this study, with the DFT model, micropores with pore size from 1.6 nm to 2 nm, mesopores with pore size from 2 nm to 50 nm, and macropores with pore size from 50 nm to 148 nm were detected [52].

4. Results

4.1. Pore Morphology from FE-SEM

Four types of pores were recognized in this study, including organic-matter pores, interparticle (interP) pores, intraparticle (intraP) pores, and micro-fractures.

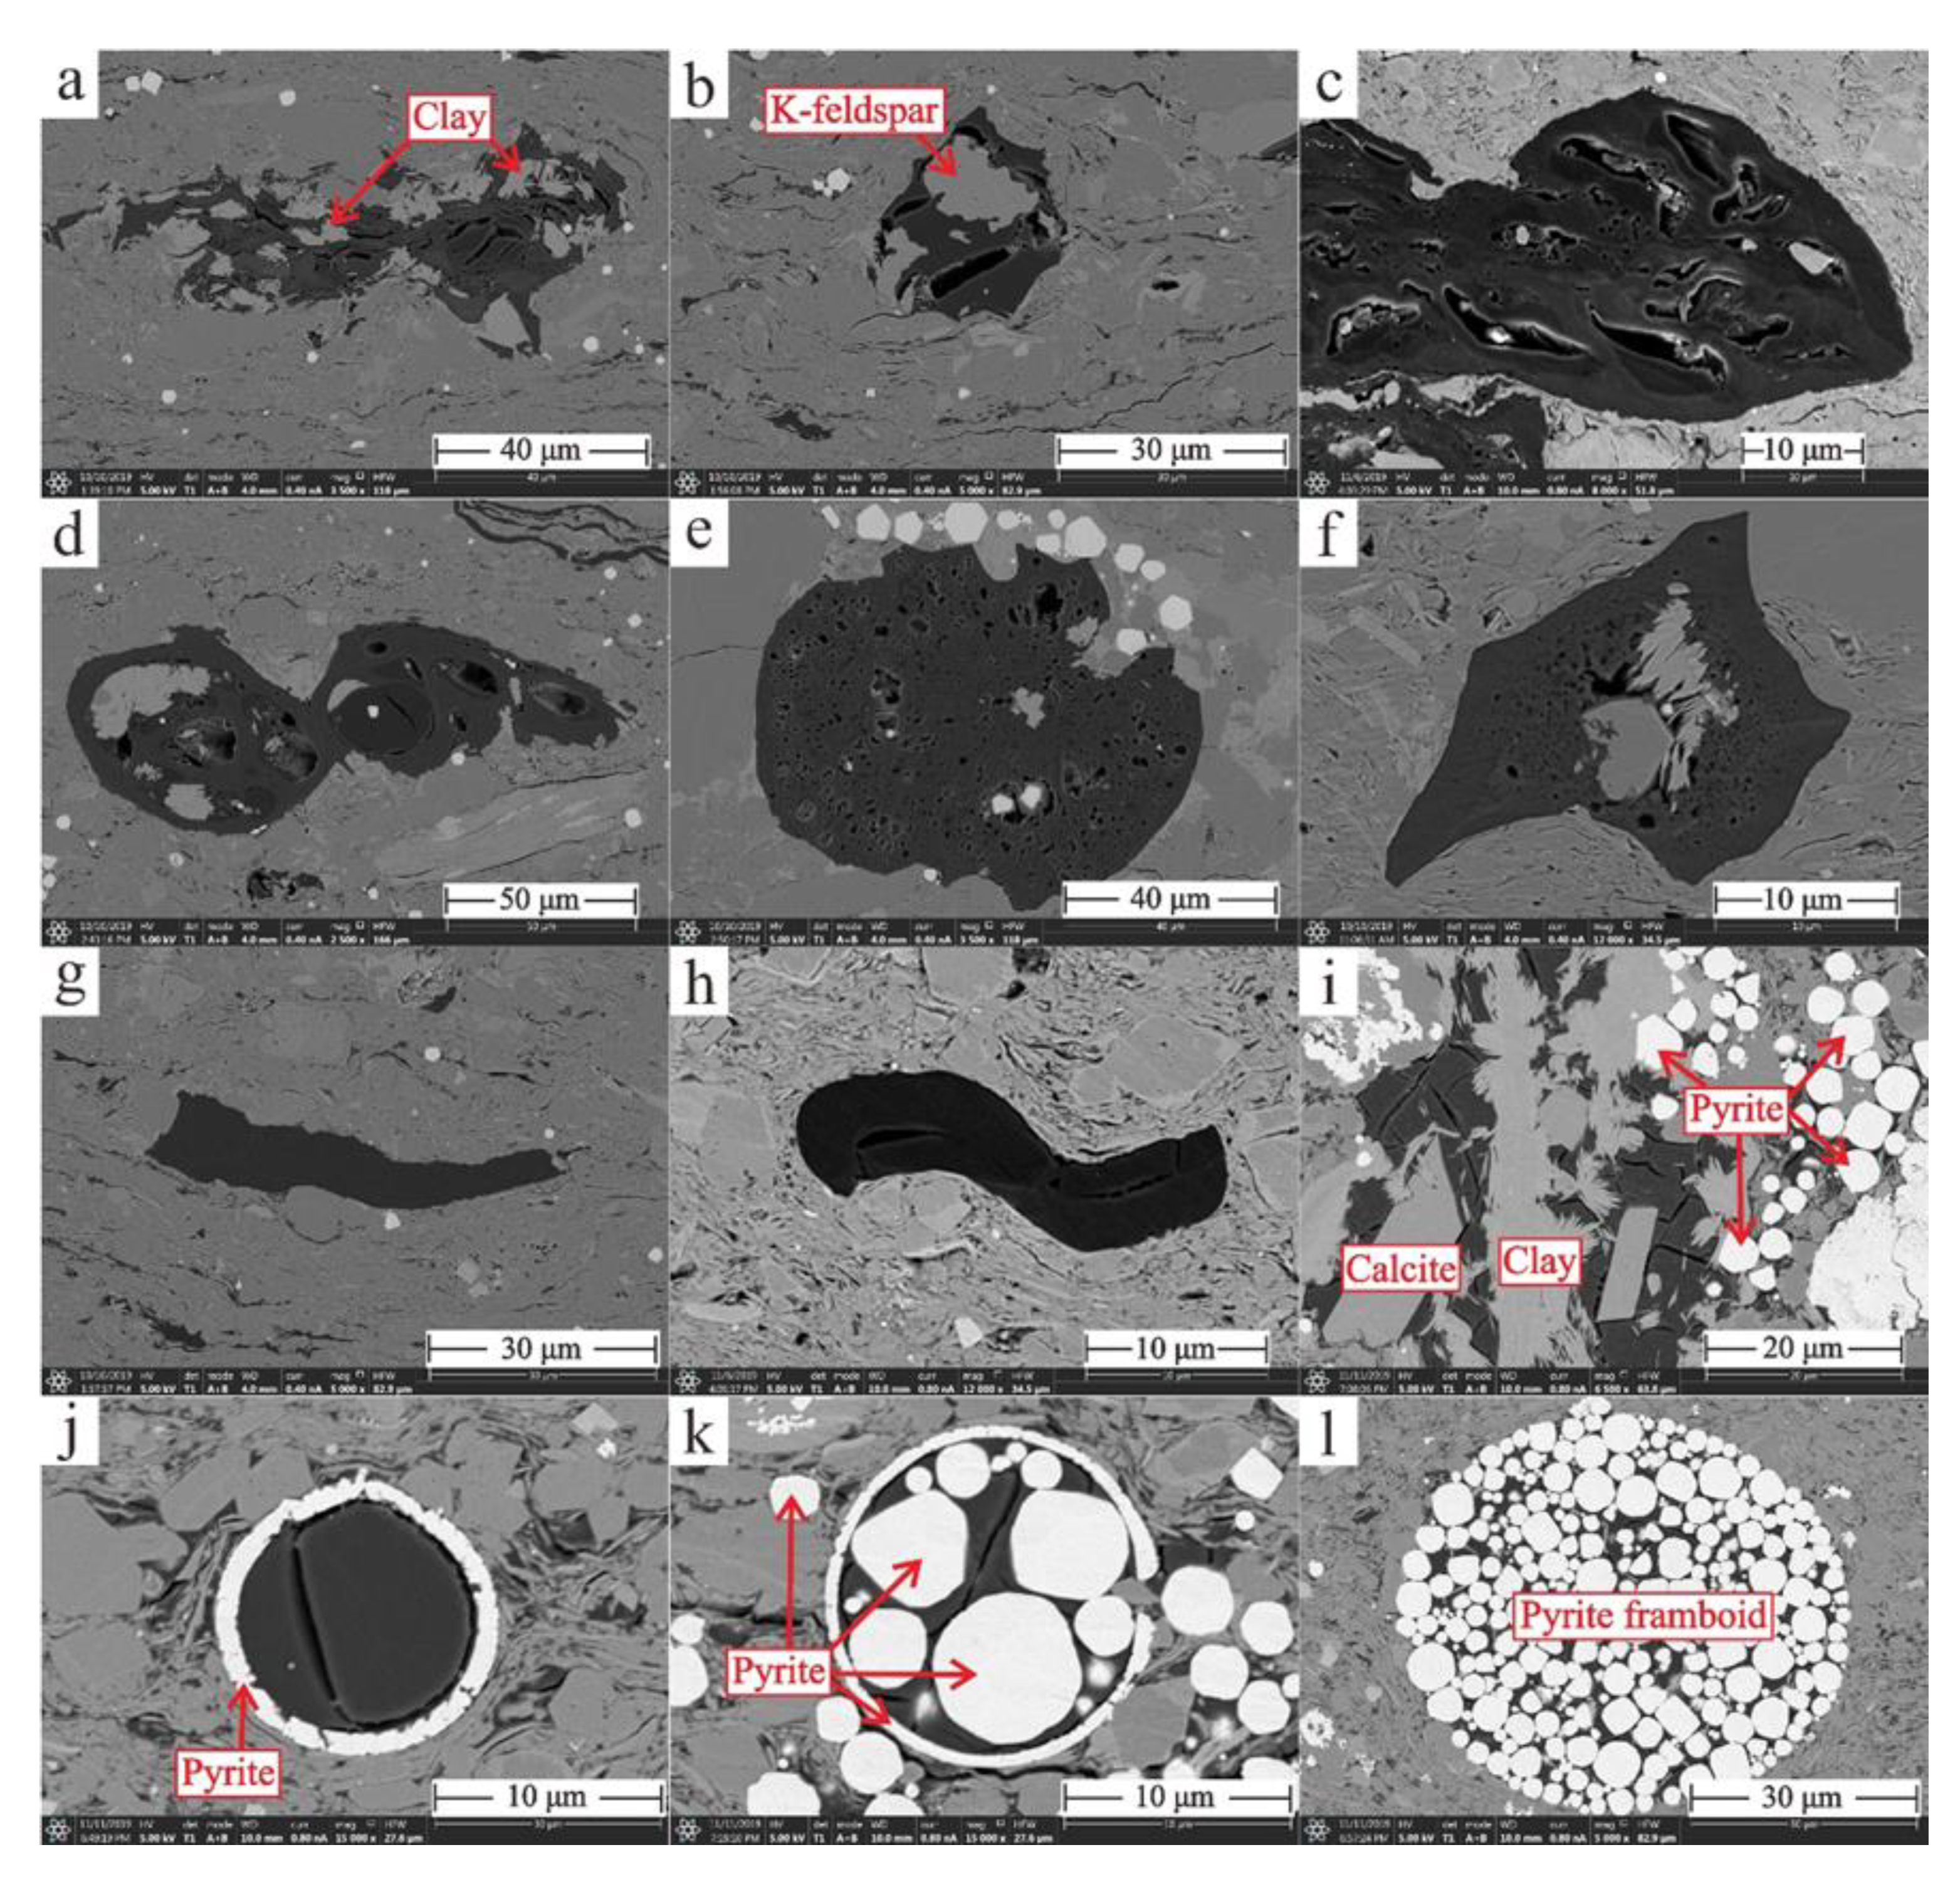
4.1.1. Organic-Matter Pores

Organic-matter pores in the Qingshankou Formation are moderately developed and show high heterogeneity. Some organic-matter pores are elongated, with maximum pore size up to 10 μm long and 2.5 μm wide (Figure 2a–c). Some organic-matter pores are oval or round, with maximum pore size up to 15 μm in diameter (Figure 2d). There are also some honeycomb-like organic-matter pores, with a wide range of pore sizes between 0.1 μm and 7 μm (Figure 2e,f). Some irregular band-like organic matter with clear and sharp boundaries does not have visible pores (Figure 2g). Nevertheless, when band-like organic matter concentrates together and is in contact with each other, a small number of interparticle pores form with pore size up to 5 μm long and 1 μm wide (Figure 2h). Some gridded-like pores are found within organic matter, which coexists with clay minerals, calcite grains, and pyrite particles (Figure 2i). Some pores are also found within organic matter, and are surrounded by pyrite circle (Figure 2j) or coexist with pyrite particles within pyrite circle (Figure 2k). Some pores can be observed within the organic matter in pyrite framboids (Figure 2l).

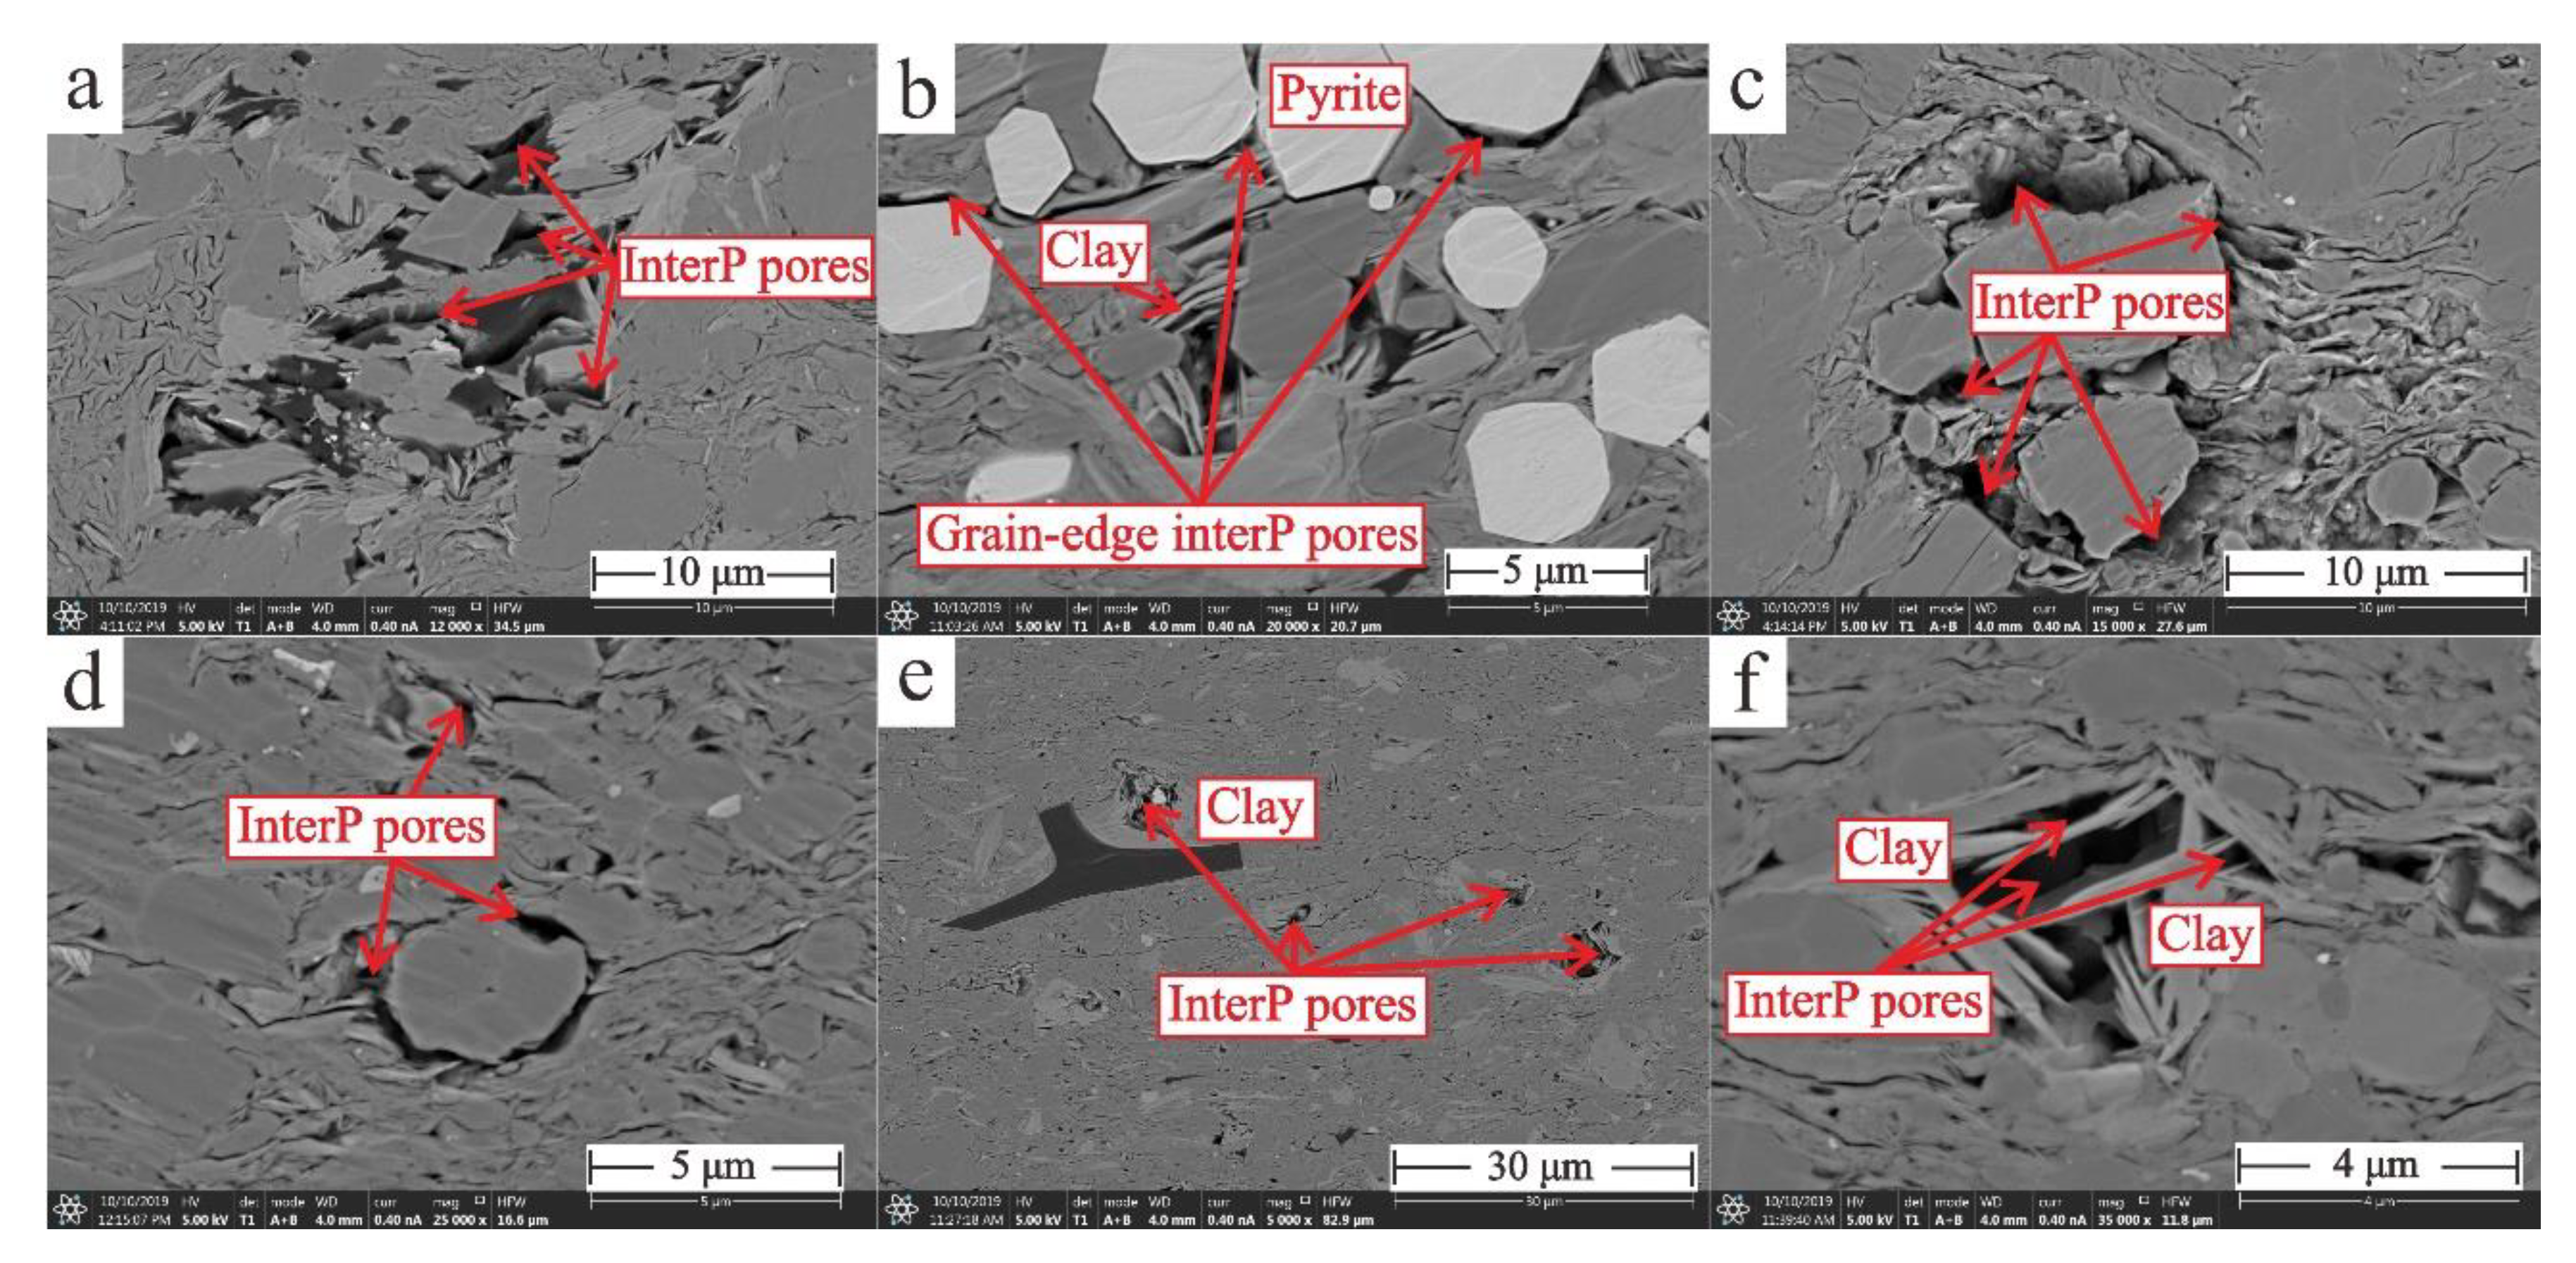
4.1.2. Interparticle Pores

Interparticle pores are highly developed and are the most significant pore type in the Qingshankou Formation. Some interP pores can be found between organic matter and inorganic minerals (Figure 3a). Some grain-edge interP pores exist among pyrite particles, clay minerals, and other minerals (Figure 3b). Some interP pores are present around rigid grains (Figure 3c,d). There are also many interP pores between clay platelets (Figure 3e,f).

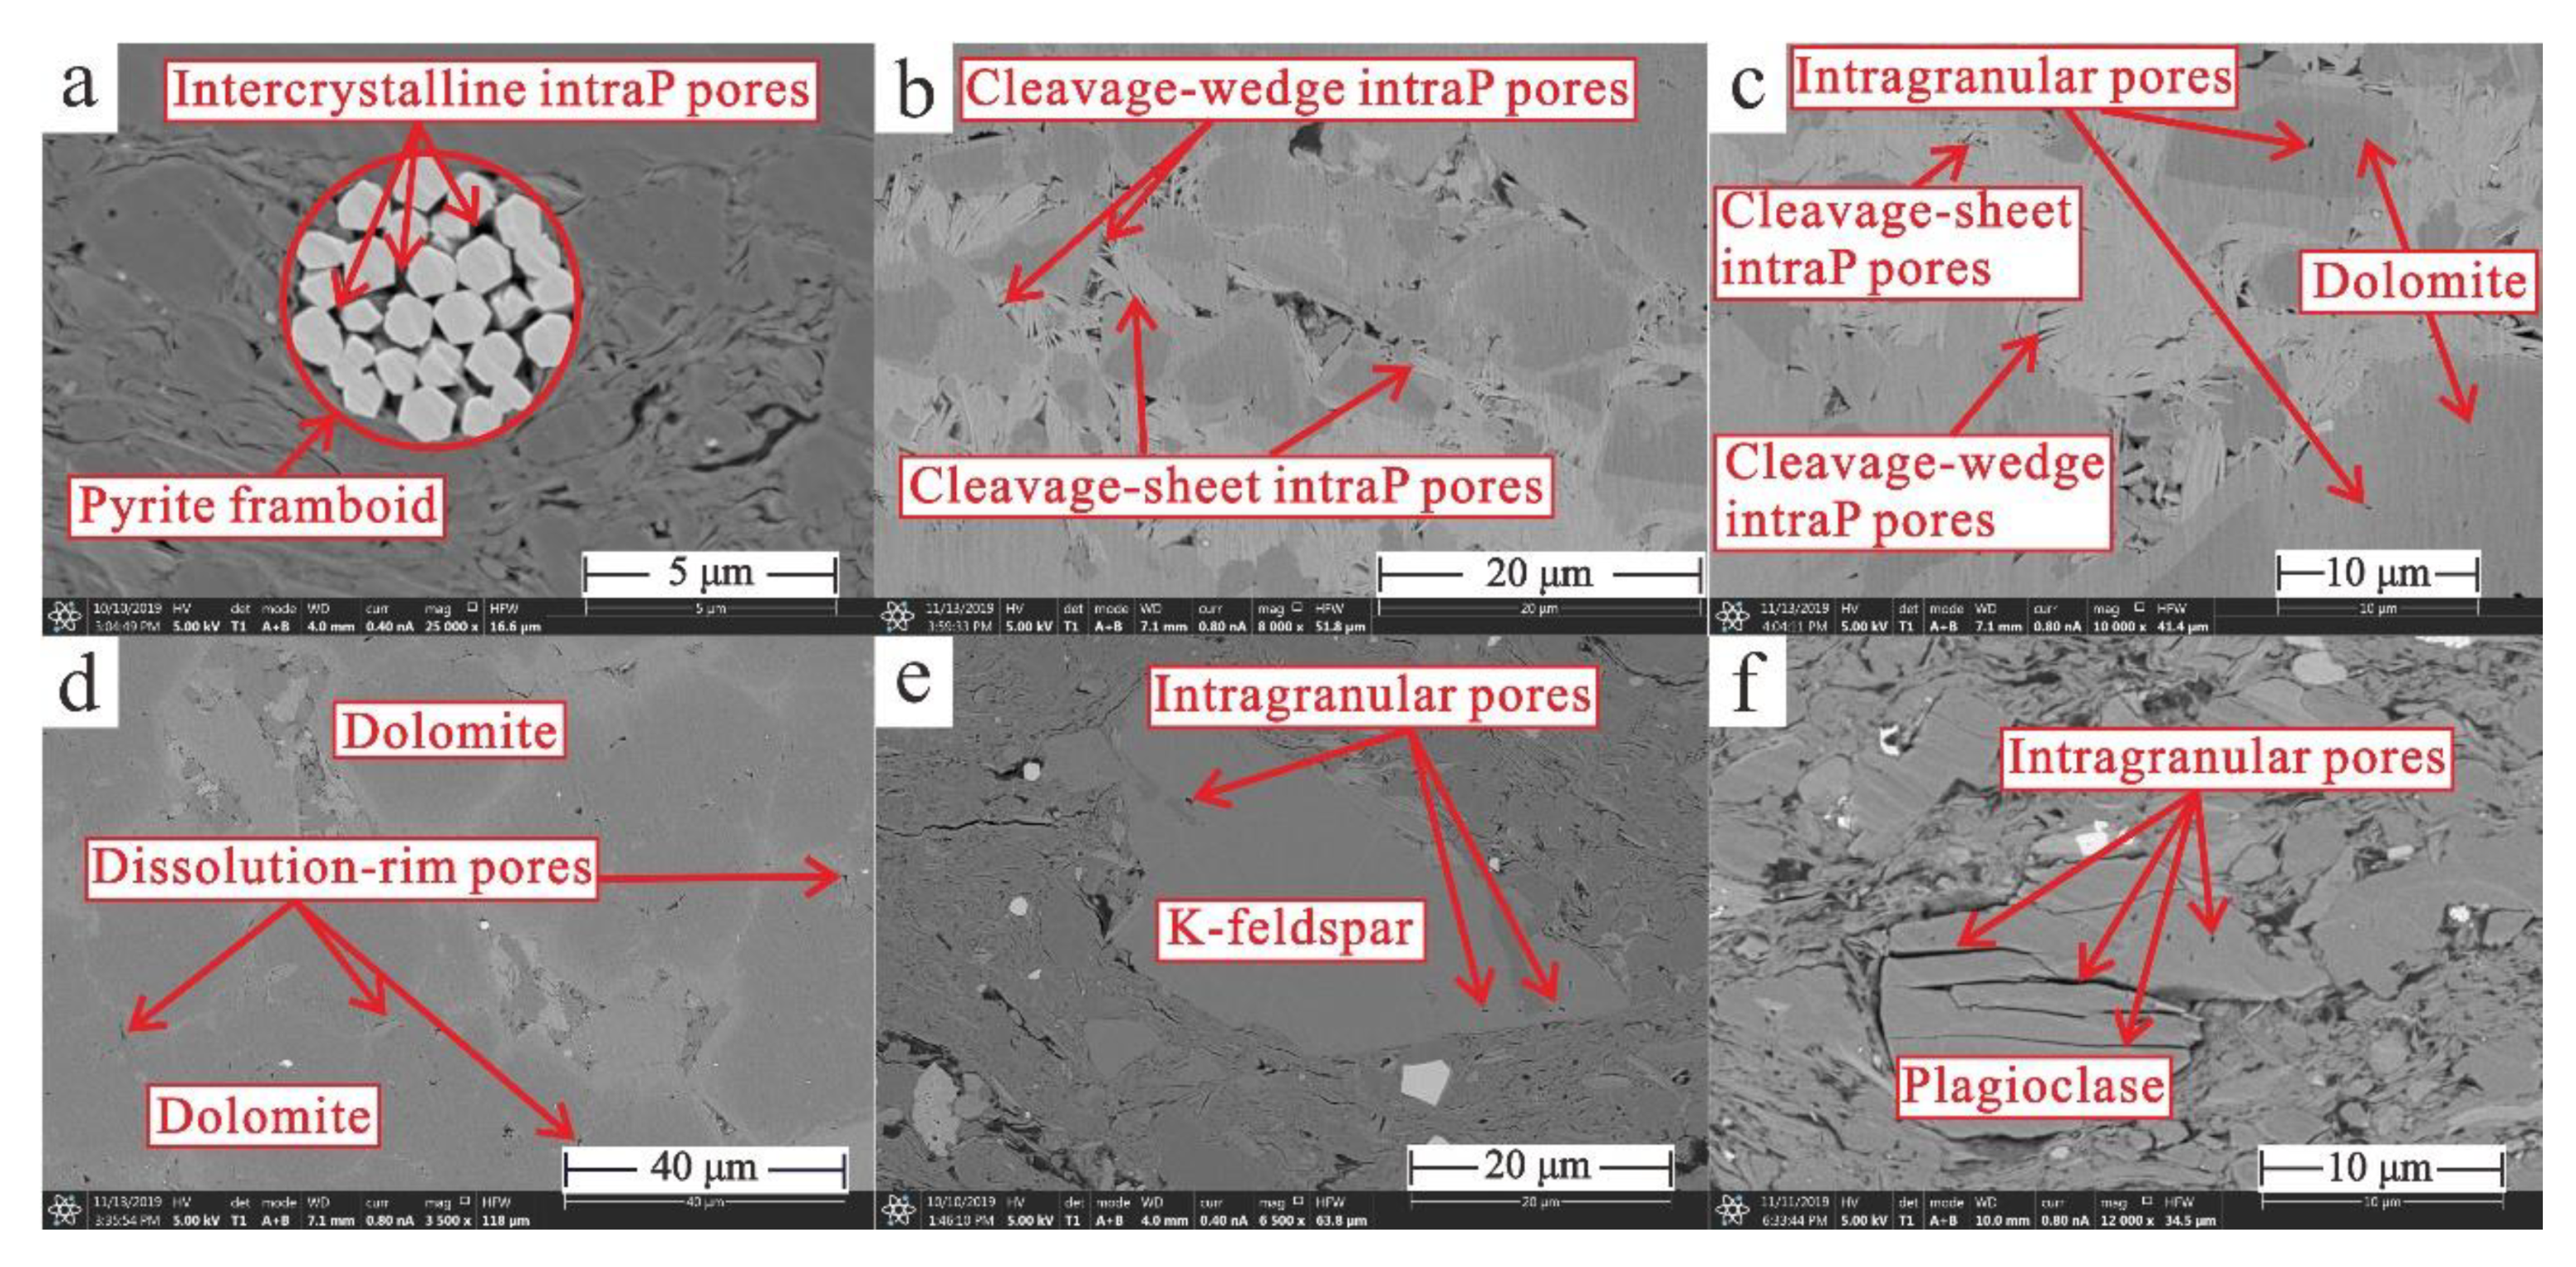
4.1.3. Intraparticle Pores

Intraparticle pores are found within particles. Some of them are intercrystalline pores, but intragranular pores also exist. Intercrystalline intraP pores within pyrite framboids can be easily observed in the Qingshankou Formation, with pore size up to 0.5 μm (Figure 4a). Cleavage-sheet and cleavage-wedge intraP pores are also common within clay aggregates (Figure 4b,c). There are also some intragranular pores in dolomite grains, with a maximum pore size up to 0.5 μm (Figure 4b,c). Lots of dissolution-rim pores are observed in dolomite grains (Figure 4d). Some intragranular pores exist in K-feldspar grains, with pore size up to 0.8 μm (Figure 4e). Some intragranular pores are observed within plagioclase grains (Figure 4f).

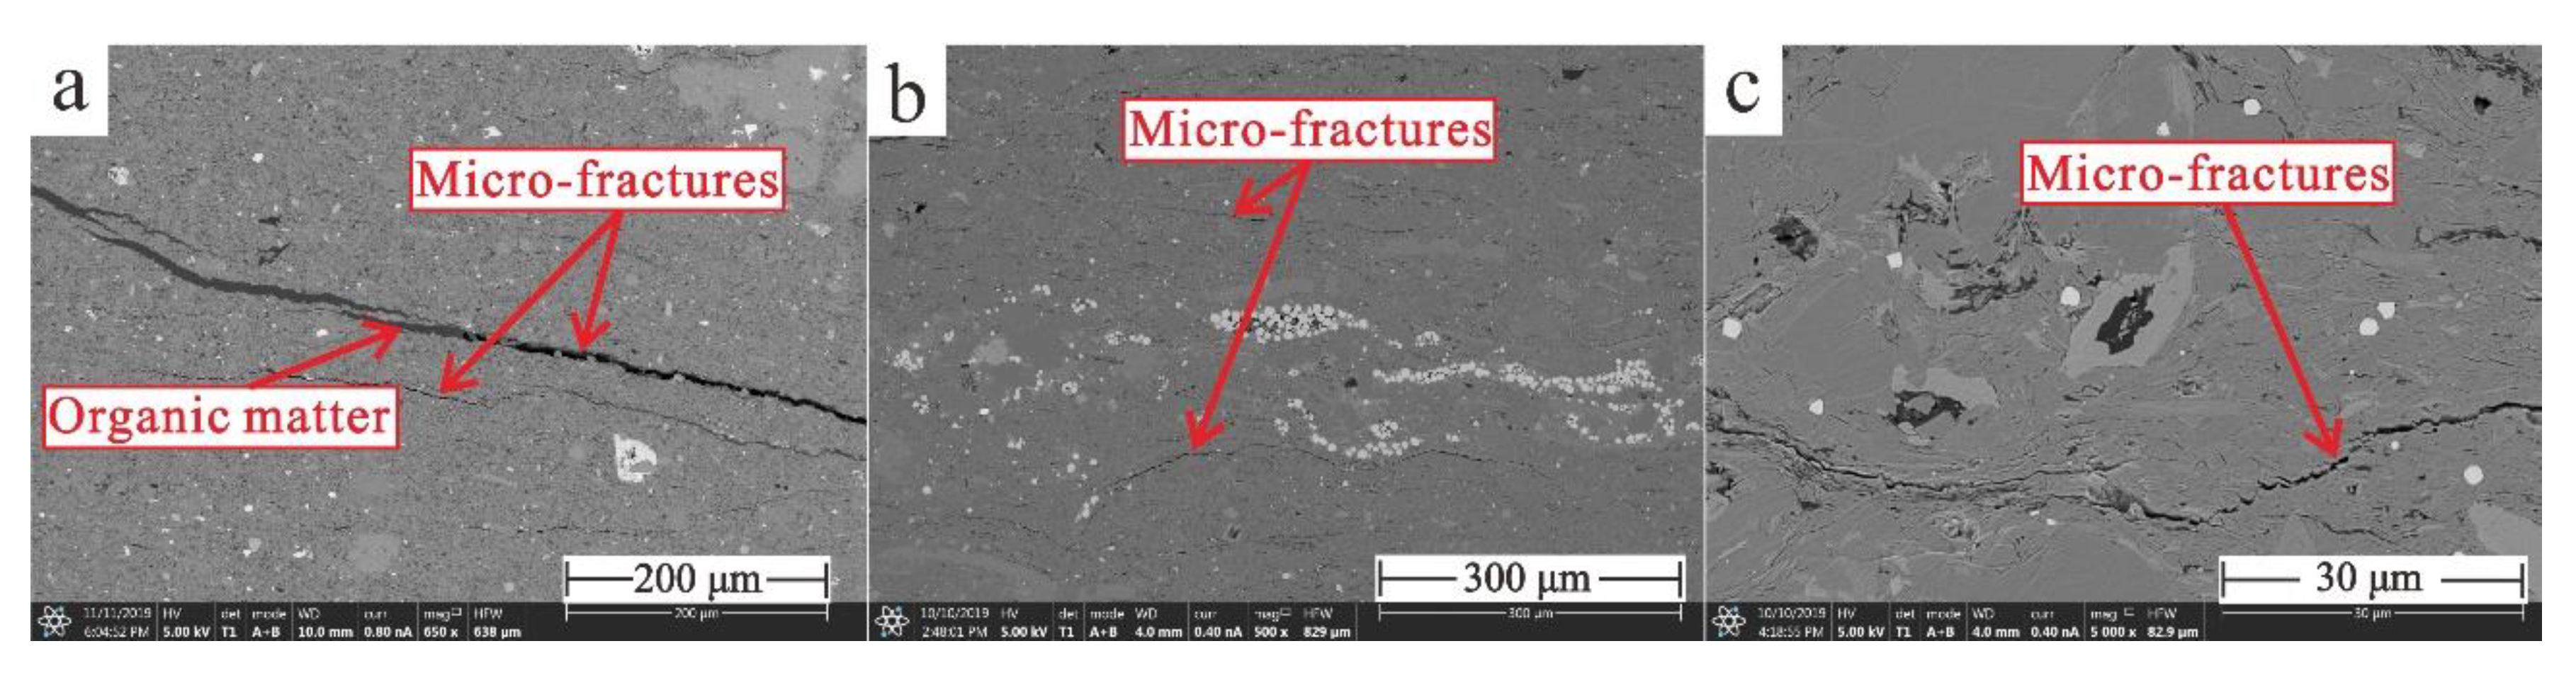
4.1.4. Micro-Fractures

Micro-fractures, which are a crucial part of an active pore network, can be found in the Qingshankou Formation. Some micro-fractures with a length of more than 400 μm and a width of 8 μm that are filled with organic matter are also observed (Figure 5a). Some micro-fractures are not filled with organic matter (Figure 5a–c).

4.2. Analysis of Nitrogen Adsorption

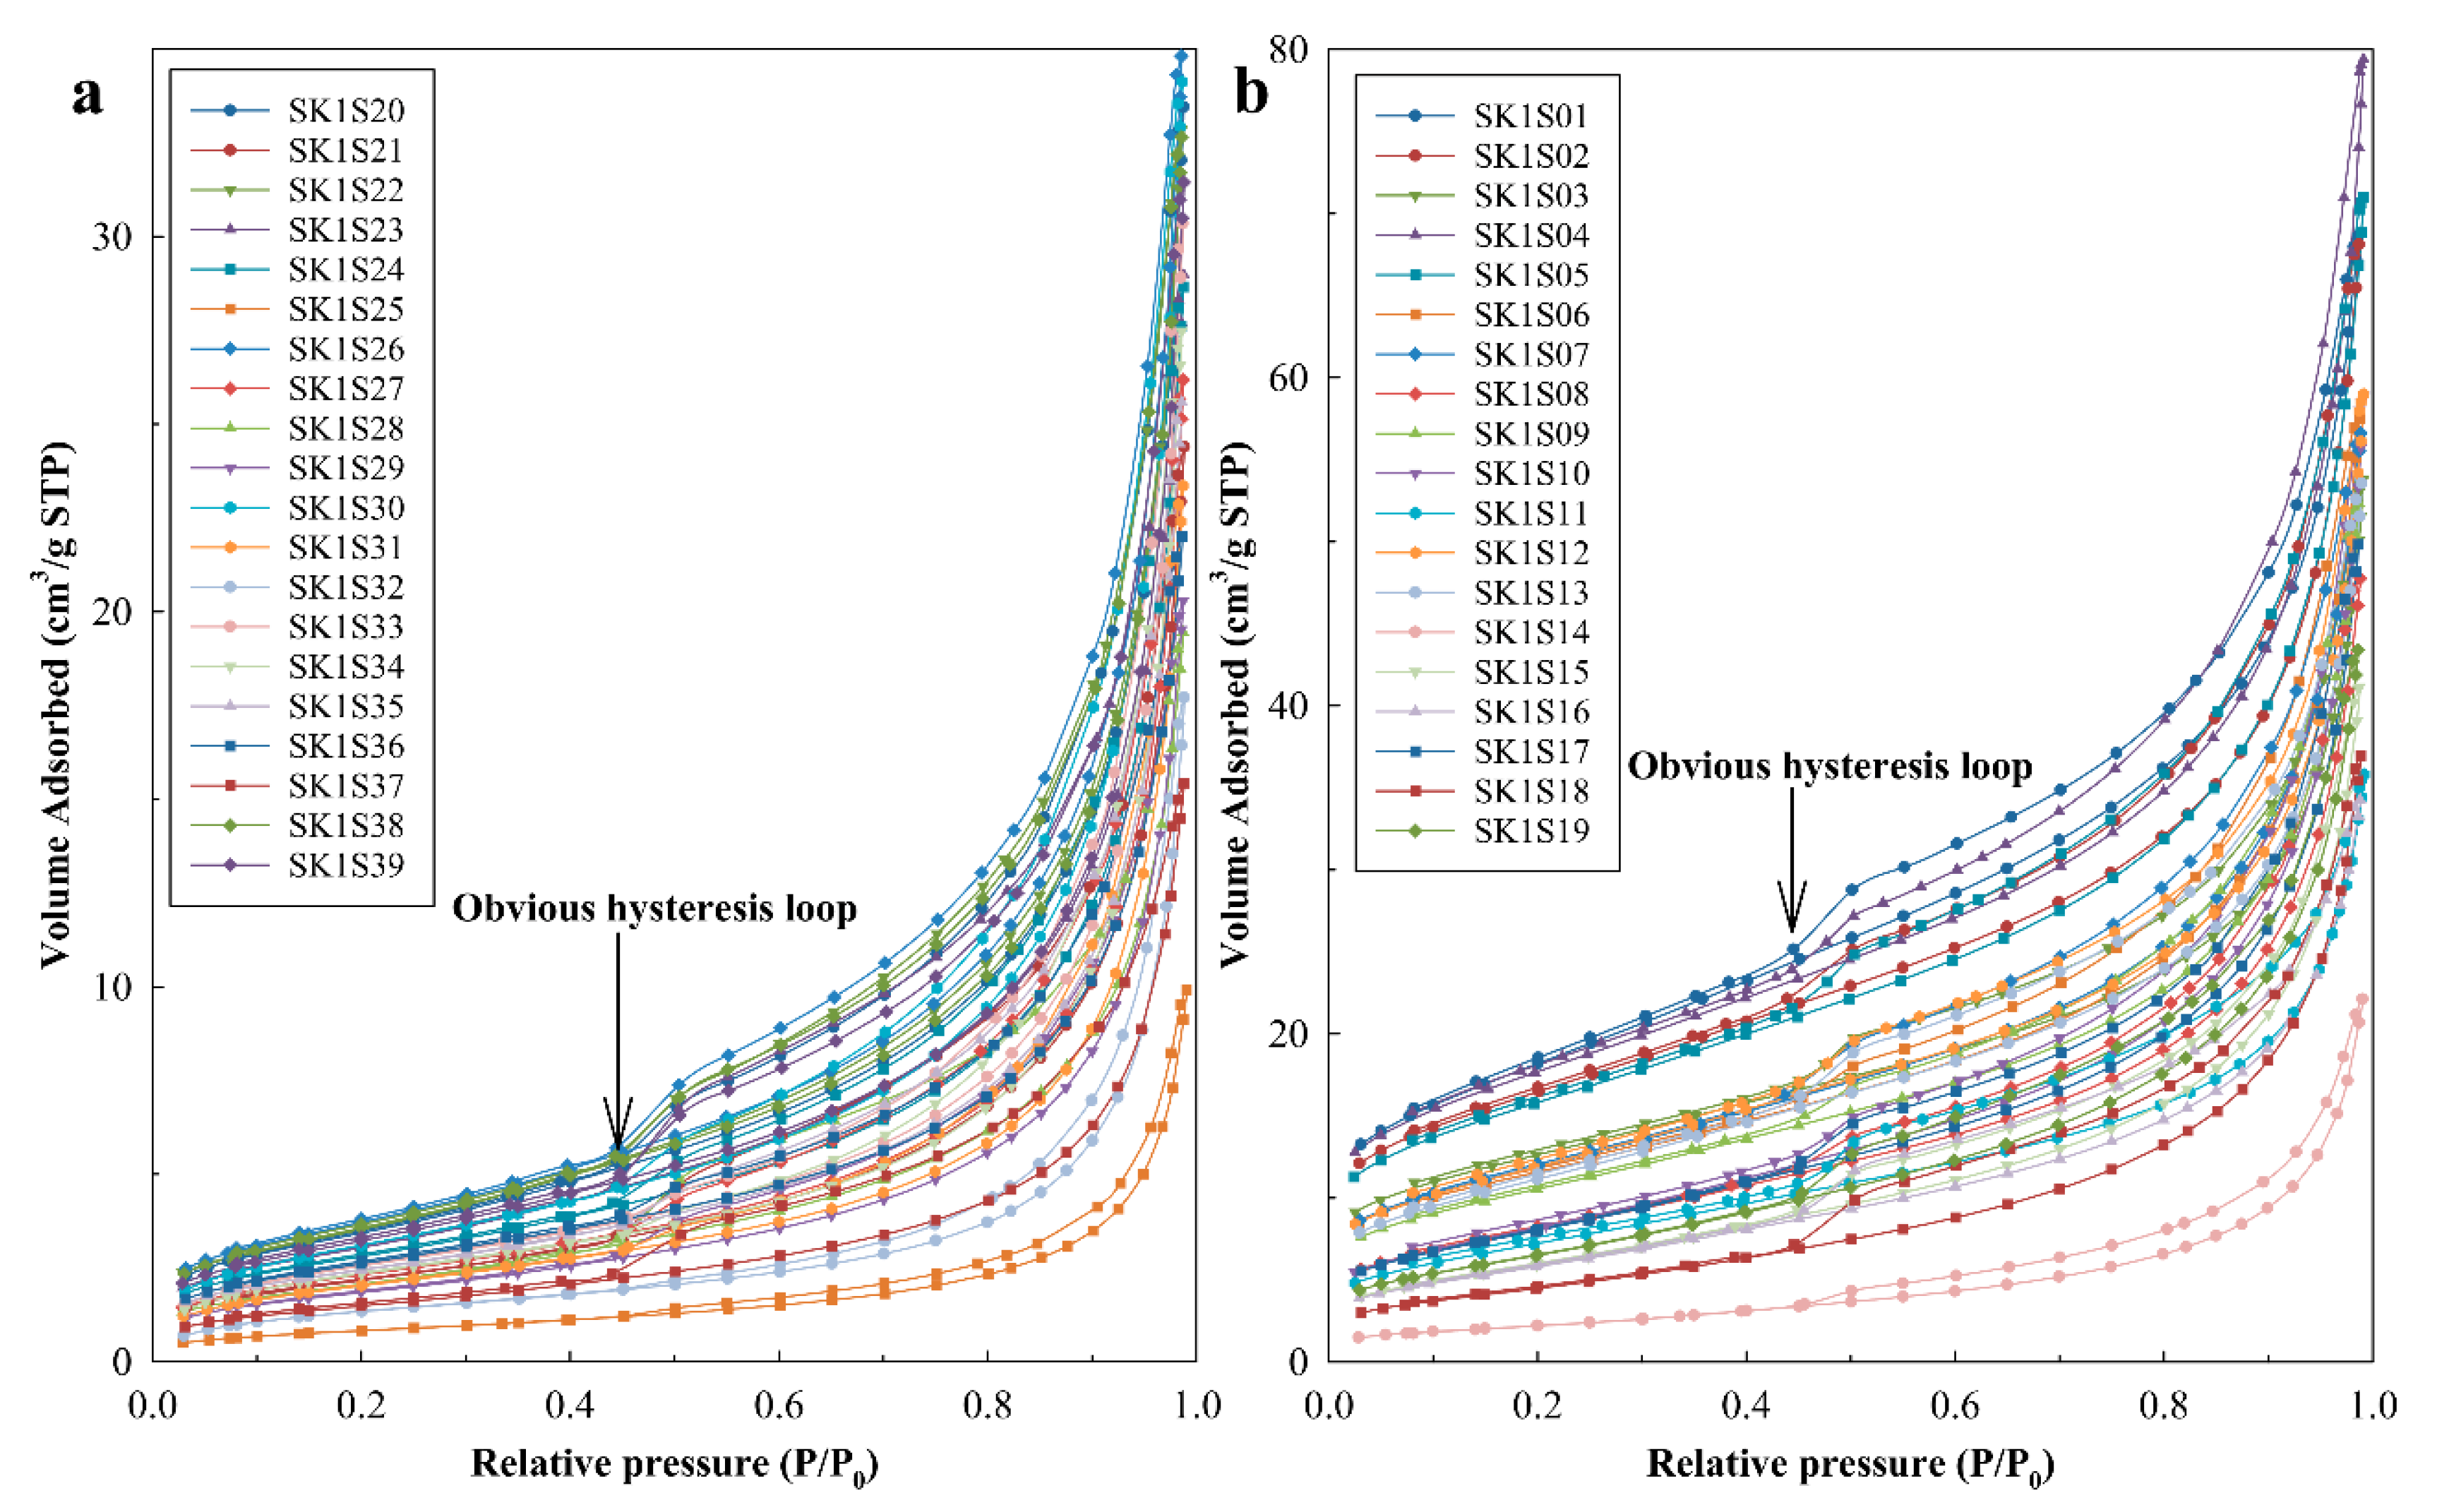
4.2.1. Nature of Isotherms and Hysteresis Loops

The nitrogen adsorption/desorption isotherms for samples in K2qn1 and K2qn2,3 are shown in Figure 6a,b, respectively. Adsorption/desorption isotherms show obvious hysteresis loops, which are visible when relative pressure is about 0.45 (Figure 6). This phenomenon is called the ‘forced closure’ of the desorption branch due to the Tensile Strength Effect [53]. Various interpretations have been proposed for hysteresis [54,55,56], with a possible interpretation being capillary condensation in mesoporous structures [56]. All the studied samples are of Type IV [56]. Type IV isotherm is characterized by its hysteresis loop, which is related to capillary condensation taking place in mesopores, and the limiting uptake over a range of high relative pressure. Due to monolayer-multilayer adsorption, the first part of the Type IV isotherm follows the same path as the corresponding part of a Type II isotherm. This indicates that mesopores are the dominating pores of the samples in both K2qn1 and K2qn2,3. Most of the isotherms in K2qn1 and K2qn2,3 rise rapidly or even vertically when relative pressure is close to 1 (Figure 6a,b), which indicates these samples might have macropores or fractures [29,56].
Though these samples display isotherms with hysteresis patterns, these isotherms show some differences in shape. Some isotherms show steep slopes when relative pressure is close to 1, and others show moderate or gentler slopes. The slope of the isotherms indicates the development of macropores [35]. The parameter ΔVG, which is the difference in volumes of gas adsorbed at the last two highest relative pressures recorded, was used to calculate the slope of the isotherms [57]. However, the slope should be calculated with the difference in volumes of gas adsorbed at the last two highest relative pressures recorded divided by the difference in the last two highest relative pressures recorded (ΔVG/Δ(P/P0)) in Figure 6. Therefore, we used the parameter ΔVG/Δ(P/P0) instead of the parameter ΔVG to represent the slope of the isotherms in this study.
All the ΔVG/Δ(P/P0) values are shown in Table A1. Some samples, such as SK1S04, SK1S05, SK1S12, and SK1S38, show high ΔVG/Δ(P/P0) values, and correspondingly show steep isotherms (which was interpreted to be indicative of macropores [35]) at the highest two relative pressure steps (Figure 6). However, the presence of apparent hysteresis of these shales also represents the existence of mesopores. Some samples, such as SK1S28 and SK1S37, show low ΔVG/Δ(P/P0) values, as the slopes are gentle. Along with the hysteresis patterns, it indicates that these samples are mainly mesoporous. Other samples, such as SK1S01, SK1S11, SK1S18, SK1S26, and SK1S39, are marked by the existence of both mesopores (visible hysteresis pattern) and macropores (lower in concentration relative to samples with high ΔVG/Δ(P/P0) values).
According to the types of hysteresis loops [56], the hysteresis patterns shown by the samples are mainly of two types: (1) H3, such as SK1S01, SK1S04, SK1S05, SK1S11, SK1S12, SK1S18, SK1S26, SK1S38, and SK1S39; and (2) the combination of H3-H4, such as SK1S28 and SK1S37. The H3 hysteresis pattern, which does not show any limiting adsorption at high relative pressure, is observed with aggregates of plate-like particles producing slit-shaped pores [56]. The H4 hysteresis pattern is typically related to porous materials containing narrow slit-shaped pores [56]. However, explaining the pore shapes with hysteresis patterns might be not accurate [29], since the actual pore shape might be a mix of various pore types, which have also been observed in the FE-SEM images.

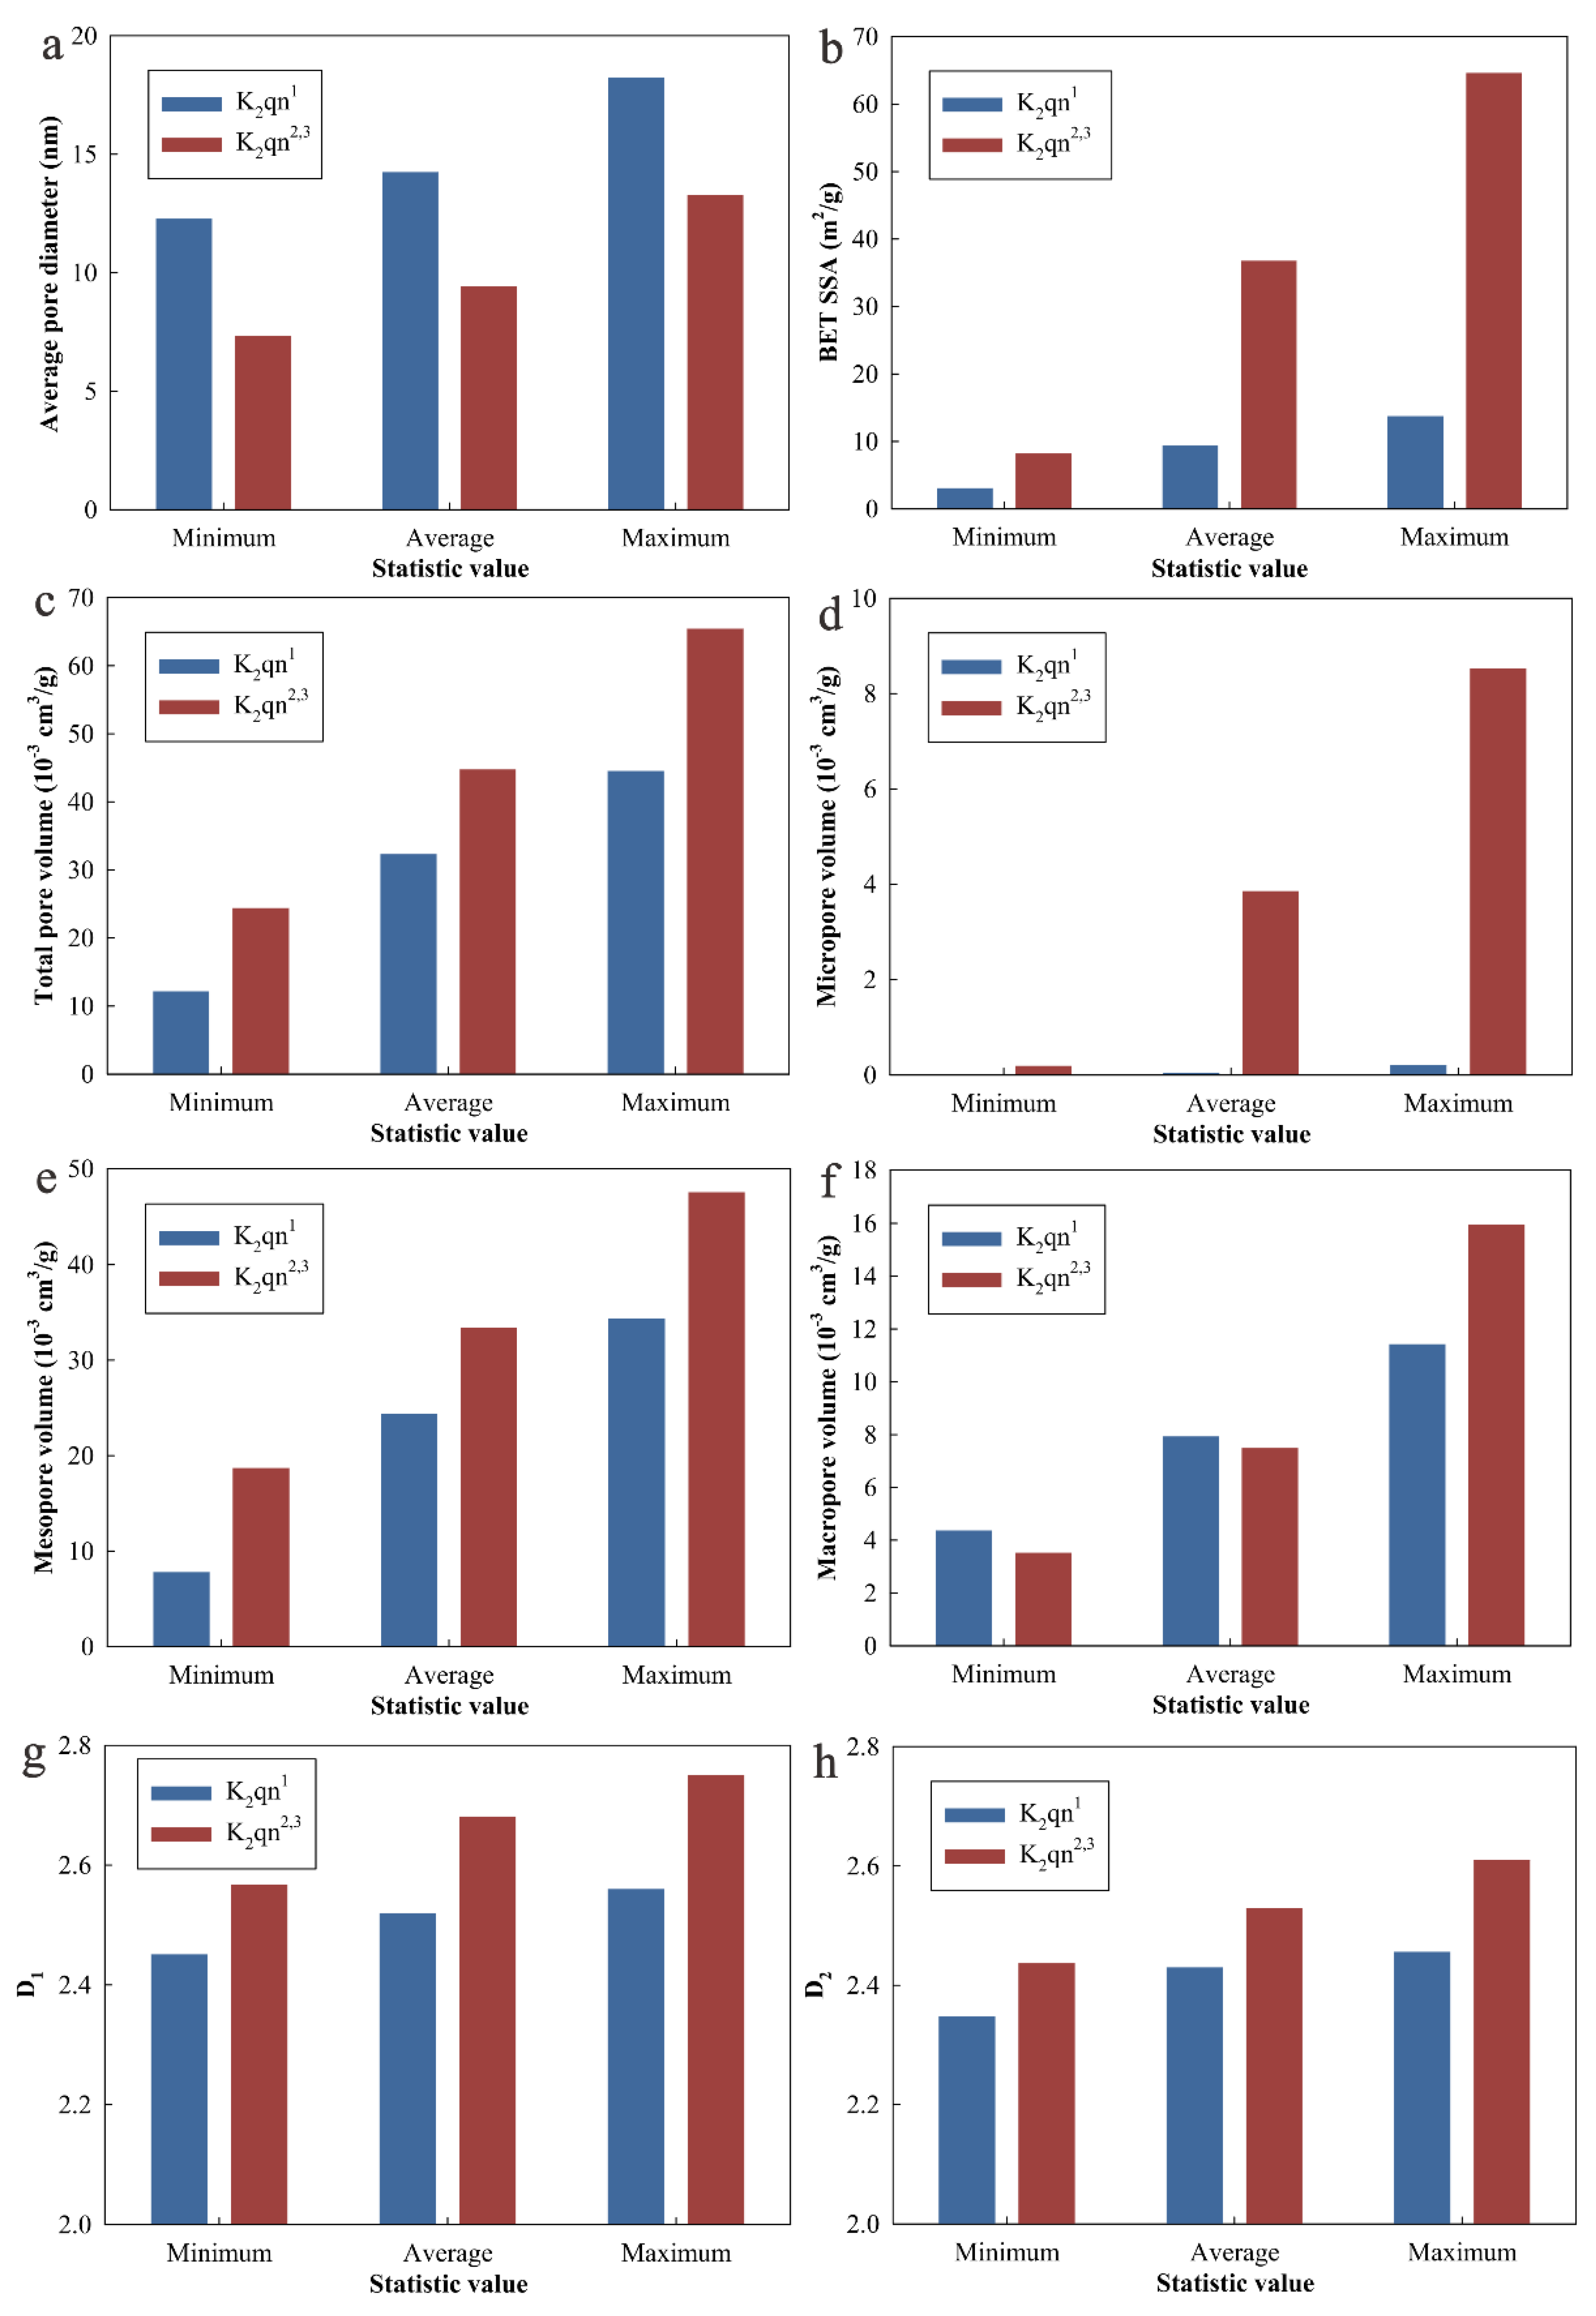
4.2.2. Pore Structure Parameters

The quantitative pore structure parameters of the studied samples from low-pressure nitrogen adsorption are shown in Table A1. The statistic values (minimum value, average value, and maximum value) of pore structure parameters in K2qn1 and K2qn2,3 are shown in Figure 7. When comparing pore structure parameters and fractal dimensions of two different members (K2qn1 and K2qn2,3), the average value of each member can represent the overall level of each member. Therefore, the average value has been applied here. The average pore diameter in K2qn varies from 7.34 nm to 18.22 nm, with an average of 11.89 nm. The average pore diameter in K2qn2,3 (9.42 nm on average) is smaller than that in K2qn1 (14.24 nm on average) (Figure 7a). BET specific surface area (BET SSA) in K2qn exhibits a wide range of values from 3.04 m2/g to 64.57 m2/g, with an average of 22.70 m2/g. BET SSA in K2qn2,3 (36.75 m2/g on average) is enormously more massive than that in K2qn1 (9.36 m2/g on average) (Figure 7b). Total pore volume in K2qn is in the range of 12.13–65.40 × 10⁻³ cm3/g, with an average of 38.35 × 10⁻³ cm3/g. Total pore volume in K2qn2,3 (44.73 × 10-−3 cm3/g on average) is bigger than that in K2qn1 (32.30 × 10⁻³ cm3/g on average) (Figure 7c). Micropore volume in K2qn is in the range of 0–8.52 × 10⁻³ cm3/g, with an average of 1.90 × 10⁻³ cm3/g. Micropore volume in K2qn2,3 (3.85 × 10⁻³ cm3/g on average) is dramatically more massive than that in K2qn1 (0.04 × 10⁻³ cm3/g on average). There is almost no micropore in K2qn1 (Figure 7d). Mesopore volume in K2qn varies from 7.77 × 10⁻³ cm3/g to 47.50 × 10⁻³ cm3/g, with an average of 28.75 × 10⁻³ cm3/g. Mesopore volume accounts for 74.97% of total pore volume, which indicates mesopore is the dominating pore type in K2qn. Mesopore volume in K2qn2,3 (33.39 × 10⁻³ cm3/g on average) is larger than that in K2qn1 (24.33 × 10⁻³ cm3/g on average) (Figure 7e). Macropore volume in K2qn1 (7.93 × 10⁻³ cm3/g on average) is a little bigger than that in K2qn2,3 (7.48 × 10⁻³ cm3/g on average), with an average of 7.71 × 10⁻³ cm3/g in K2qn (Figure 7f). These pore structure parameters in K2qn are much larger than those of marine shales from the Early Cambrian Niutitang Formation in the Sichuan Basin, southwest China [22].

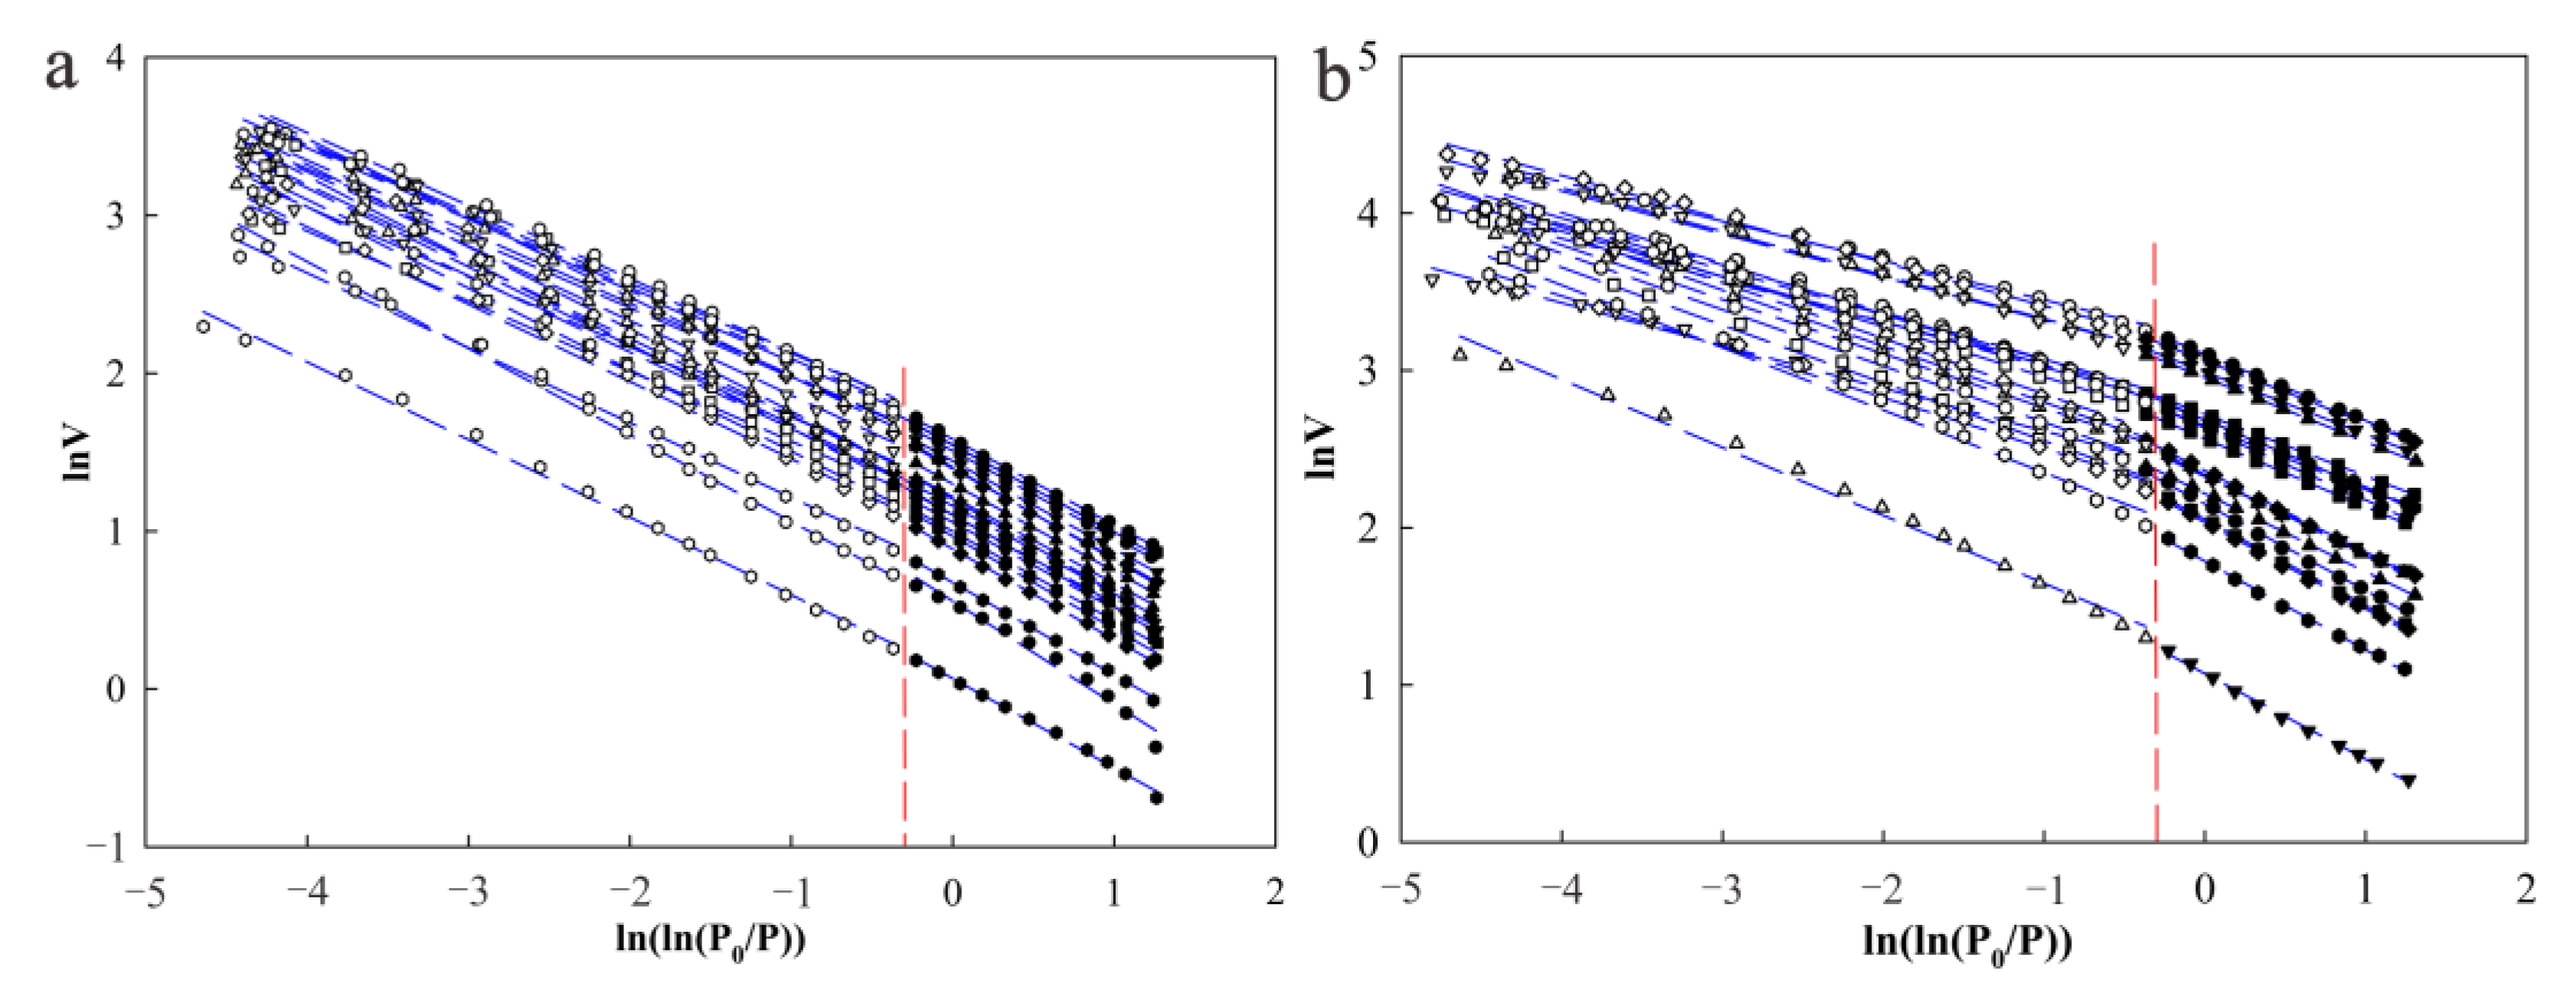
4.3. Fractal Dimensions from Nitrogen Adsorption Isotherms

The fractal Frenkel-Halsey-Hill (FHH) model based on gas adsorption isotherms has been proven to be a useful model and is broadly used in shales [58]. The FHH model involves applying Equation (1) [59,60]:
ln ( V / V 0 ) = A [ ln ( ln ( P 0 / P ) ) ] + c o n s t a n t
where P is the equilibrium pressure; P 0 is the saturation pressure of the gas; V is the volume of adsorbed gas molecules; V 0 is the volume of monolayer coverage;   A is the power-law exponent, which depends on the fractal dimension (D) and the mechanisms of adsorption.
D value can be calculated from the slope ( A ) of the straight line in the ln V versus ln ( ln ( P 0 / P ) ) FHH plot using either Equations (2) or (3):
D = A + 3
D = 3 A + 3
Both Equations (2) and (3) have been applied to calculate the fractal dimension D [59,61]. Equation (2) is applied in the capillary condensation regime in which the hysteresis loops start to appear, while Equation (3) is used in the case of the van der Waals force [62].
Following the FHH model, the plots of ln V versus ln ( ln ( P 0 / P ) ) in K2qn1 and K2qn2,3 are shown in Figure 8a,b, respectively. There are two different linear segments at the P/P0 intervals of 0–0.5 and 0.5–1, which indicates that fractal characteristics exist in these two distinct regions [63]. The fractal dimensions in these two distinct regions represent different types of pore features. D1 is at higher P/P0 and represents the pore structure fractal dimension, whose behavior is controlled by capillary condensation. D2 is at lower P/P0 and represents the pore surface fractal dimension, whose adsorption behavior is called monolayer-multilayer adsorption controlled by van der Waals forces [60].
In general, the fractal dimension (D) varies in the range of 2–3. It is affected by the geometrical irregularities and roughness of the surface [64]. The larger the D values are, the more complicated and irregular the surfaces are [29]. Table A2 shows fractal fitting parameters and fractal dimensions of the studied samples. Using Equation (2), D1 varies from 2.4507 to 2.7498 (2.5982 on average), which meets the conditions of the fractal theory of porous structures [65]. However, D1 calculated by Equation (3) varies from 1.3521 to 2.2494, which shows deviations from the definition of fractal dimension, so it is unreasonable and useless [65]. The same thing happens to D2. The fractal dimension varies from 2 for an entirely typical smooth solid surface to 3 for an extremely complicated surface. In this situation, only Equation (2) is used to calculate D1 and D2 in this study.
Both segments have good linear relationships, and all the coefficients of determination (R12 and R22) are higher than 0.9775 (Table A2), indicating that shales in K2qn are fractal [64]. Comparing with the fractal dimensions in these two formations, the values of D1 in K2qn1 have a narrower distribution ranging from 2.4507 to 2.5600 with an average of 2.5196, while the values of D1 in K2qn2,3 range between 2.5669 and 2.7498 with an average of 2.6809 (Figure 7g). The lower average value of D1 indicates that shales in K2qn1 have simpler pore structures than those in K2qn2,3. The values of D2 in K2qn1 have a narrower distribution from 2.3478 to 2.4559 (2.4298 on average), and the values of D2 in K2qn2,3 vary from 2.4368 to 2.6092, with an average of 2.5287 (Figure 7h). It suggests shales in K2qn1 have smoother pore surfaces than those in K2qn2,3.

5. Discussion

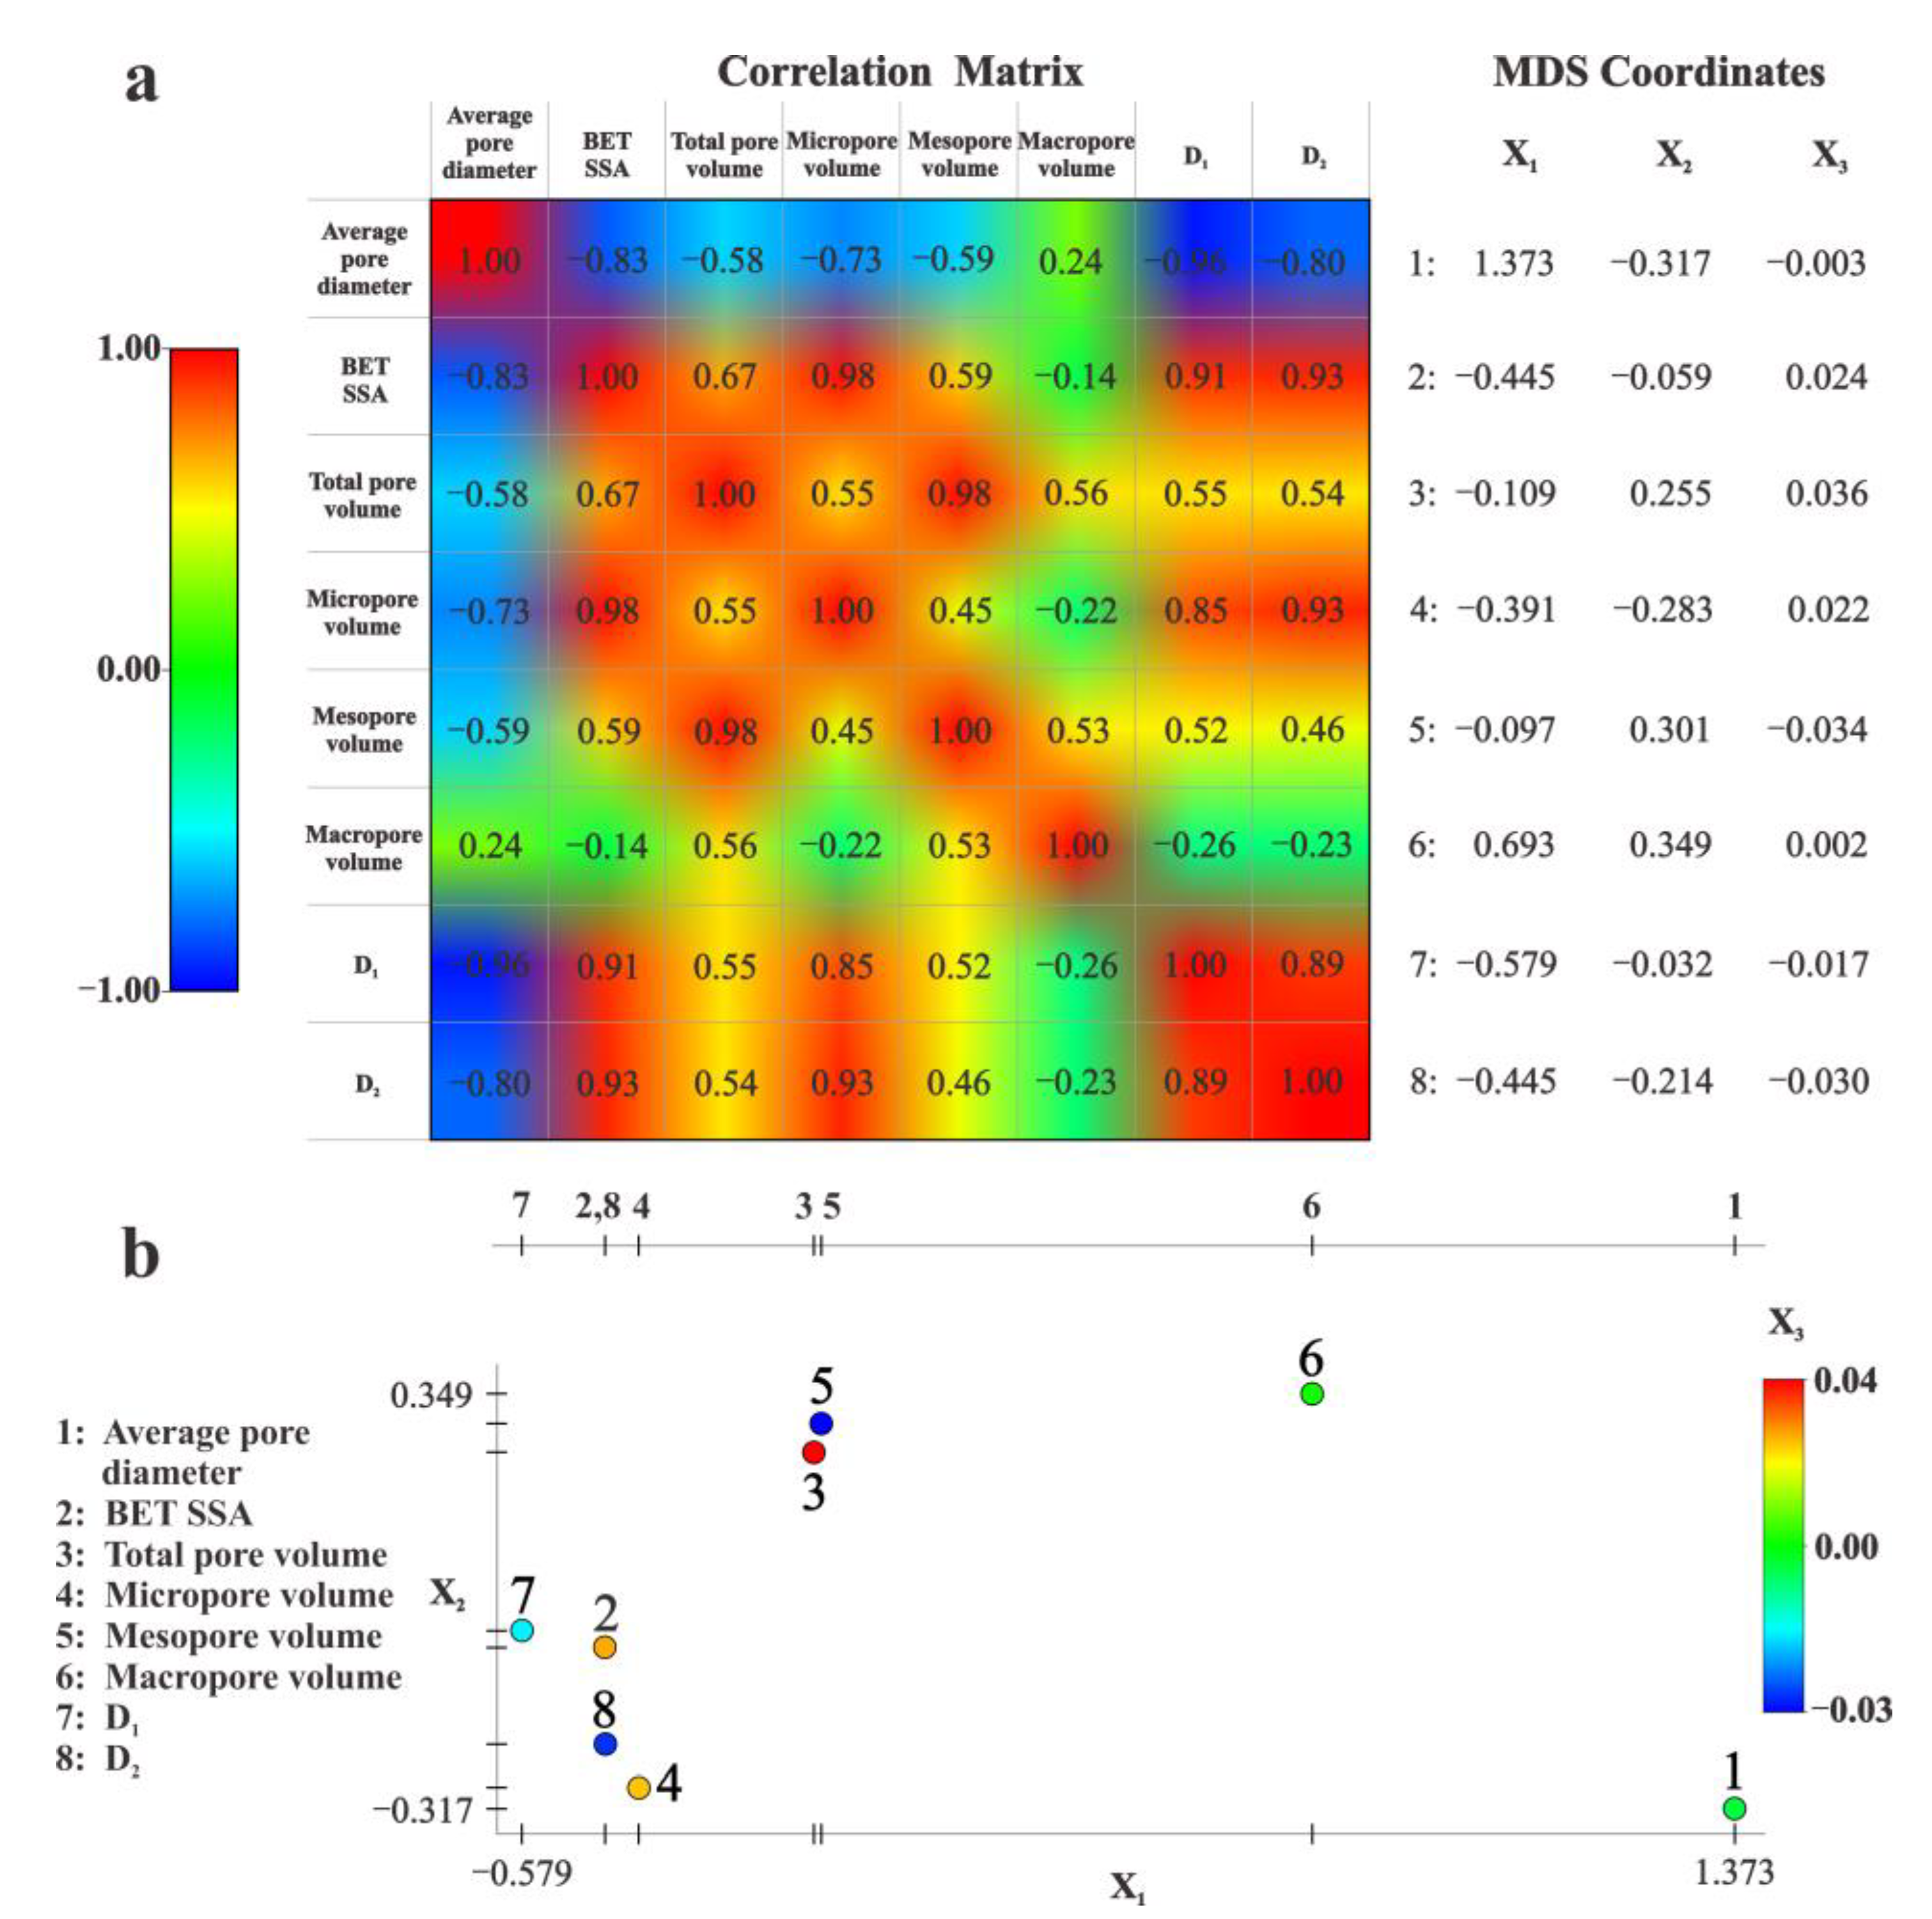
5.1. Relationships between Pore Structure Parameters

Multidimensional scaling (MDS) [66,67,68] is a method used in data sciences to visualize and compare similarities and differences of high dimensional data. Its application in geostatistics helps visually evaluate and interpret multivariate data in a lower dimension. MDS does this by projecting the multivariate distances between entities to a best-fit configuration in lower dimensions that we can see [69]. More details can be seen in Reference [69]. To investigate the relationships between pore structure parameters in K2qn, we used MDS in this study.
The correlation matrix and multidimensional scaling of multivariate pore structure parameters are shown in Figure 9a and b, respectively. The correlation matrix shows the Pearson correlation coefficients between these pore structure parameters (Figure 9a). The Pearson correlation coefficients vary from −1 to 1 and represent from extremely negatively correlated to extraordinarily positively correlated. The multidimensional scaling plot shows the degree of correlation between these parameters (Figure 9b). The distances of these parameters are based on three coordinates, X1 (shown as horizontal axis), X2 (shown as vertical axis), and X3 (shown as color from cold to hot), respectively. The closer the two parameters are observed in the MDS plot, the more positive correlation exists between them, and vice versa.
We analyzed the correlations among average pore diameter, BET SSA, total pore volume, micropore volume, mesopore volume, and macropore volume in this part. From the MDS plot in Figure 9b, we can get a general impression that BET SSA and micropore volume are more positively related because these two dots are close to each other, and total pore volume and mesopore volume are more positively related for the same reason.
From the MDS plot in Figure 9b, we can tell that the dot representing the average pore diameter is quite far away from other parameters, except the dot representing macropore volume. The average pore diameter has a weak positive correlation with macropore volume, with a correlation coefficient of 0.24 (Figure 9a), which is reasonable. The two dots representing BET SSA and micropore volume are quite far away from the dot representing the average pore diameter in Figure 9b, with correlation coefficients of −0.83 and −0.73 (Figure 9a), which shows they have strong negative correlations with average pore diameter. The more micropores the samples have, the smaller the average pore diameter they have, and the larger BET SSA they have, which is reasonable. Total pore volume and mesopore volume are flocking together in Figure 9b and medium negatively correlated with average pore diameter, with correlation coefficients of −0.58 and −0.59 (Figure 9a), respectively. In brief, the most important parameters influencing average pore diameter are BET SSA and micropore volume, which show strongly negative correlations with the average pore diameter.
The BET SSA is close to micropore volume in Figure 9b, and the correlation coefficient between them is 0.98 (Figure 9a), which means these two parameters are extremely positively correlated. The dot representing BET SSA is a little bit far away from the dot representing mesopore volume compared to the dot representing micropore volume in Figure 9b, and the correlation coefficient between BET SSA and mesopore volume is 0.59 (Figure 9a), which means these two parameters are medium positively correlated. The dot representing BET SSA is far away from the dot representing macropore volume in Figure 9b, with a correlation coefficient of −0.14 (Figure 9a), which shows these two parameters barely correlate. Since micropore is smaller than mesopore, it has more BET SSA than mesopore. For the same reason, mesopore has more BET SSA than macropore. In brief, the most critical parameter influencing BET SSA is micropore volume, which is positively correlated with BET SSA.
The total pore volume and the mesopore volume are so close to each other in Figure 9b, and they have an exceedingly positive correlation (correlation coefficient 0.98) (Figure 9a), which indicates that mesopore is the primary pore type in K2qn. This result is consistent with the results mentioned earlier that mesopore volume accounts for 74.97% of the total pore volume.

5.2. Relationships between Fractal Dimensions and Pore Structure Parameters

From the MDS plot in Figure 9b, we can find out D1, D2, BET SSA, and micropore volume cluster together, which indicates that these four parameters are strongly positively related. Two fractal dimensions (D1 and D2) are quite close to each other, and they have a correlation coefficient of 0.89 (Figure 9a), which means D1 and D2 have a significantly positive correlation. This result is different from the inconsistency in D1 and D2 of coals [60], which might indicate lacustrine shales with more complicated pore structures usually have rougher surfaces.
Both two fractal dimensions (D1 and D2) have strongly positive correlations (correlation coefficients larger than 0.85) with BET SSA and micropore volume, which indicates more micropores and larger BET SSA lead to more complex pore structures and much rougher surfaces. Both two fractal dimensions (D1 and D2) are moderately close to the mesopore volume in Figure 9b, which means mesopore makes a moderate contribution to the complexity of the pore structure and the roughness of the pore surface. These two dots representing D1 and D2 are far away from the dot representing macropore volume in Figure 9b, with correlation coefficients of −0.26 and −0.23 (Figure 9a). This indicates macropore makes some contribution to simpler pore structure and smoother pore surface. These two dots representing D1 and D2 are exceedingly far away from the dot representing the average pore diameter in Figure 9b, with correlation coefficients of −0.96 and −0.80 (Figure 9a), which shows larger pores are useful for making pore structure simpler and pore surface smoother.

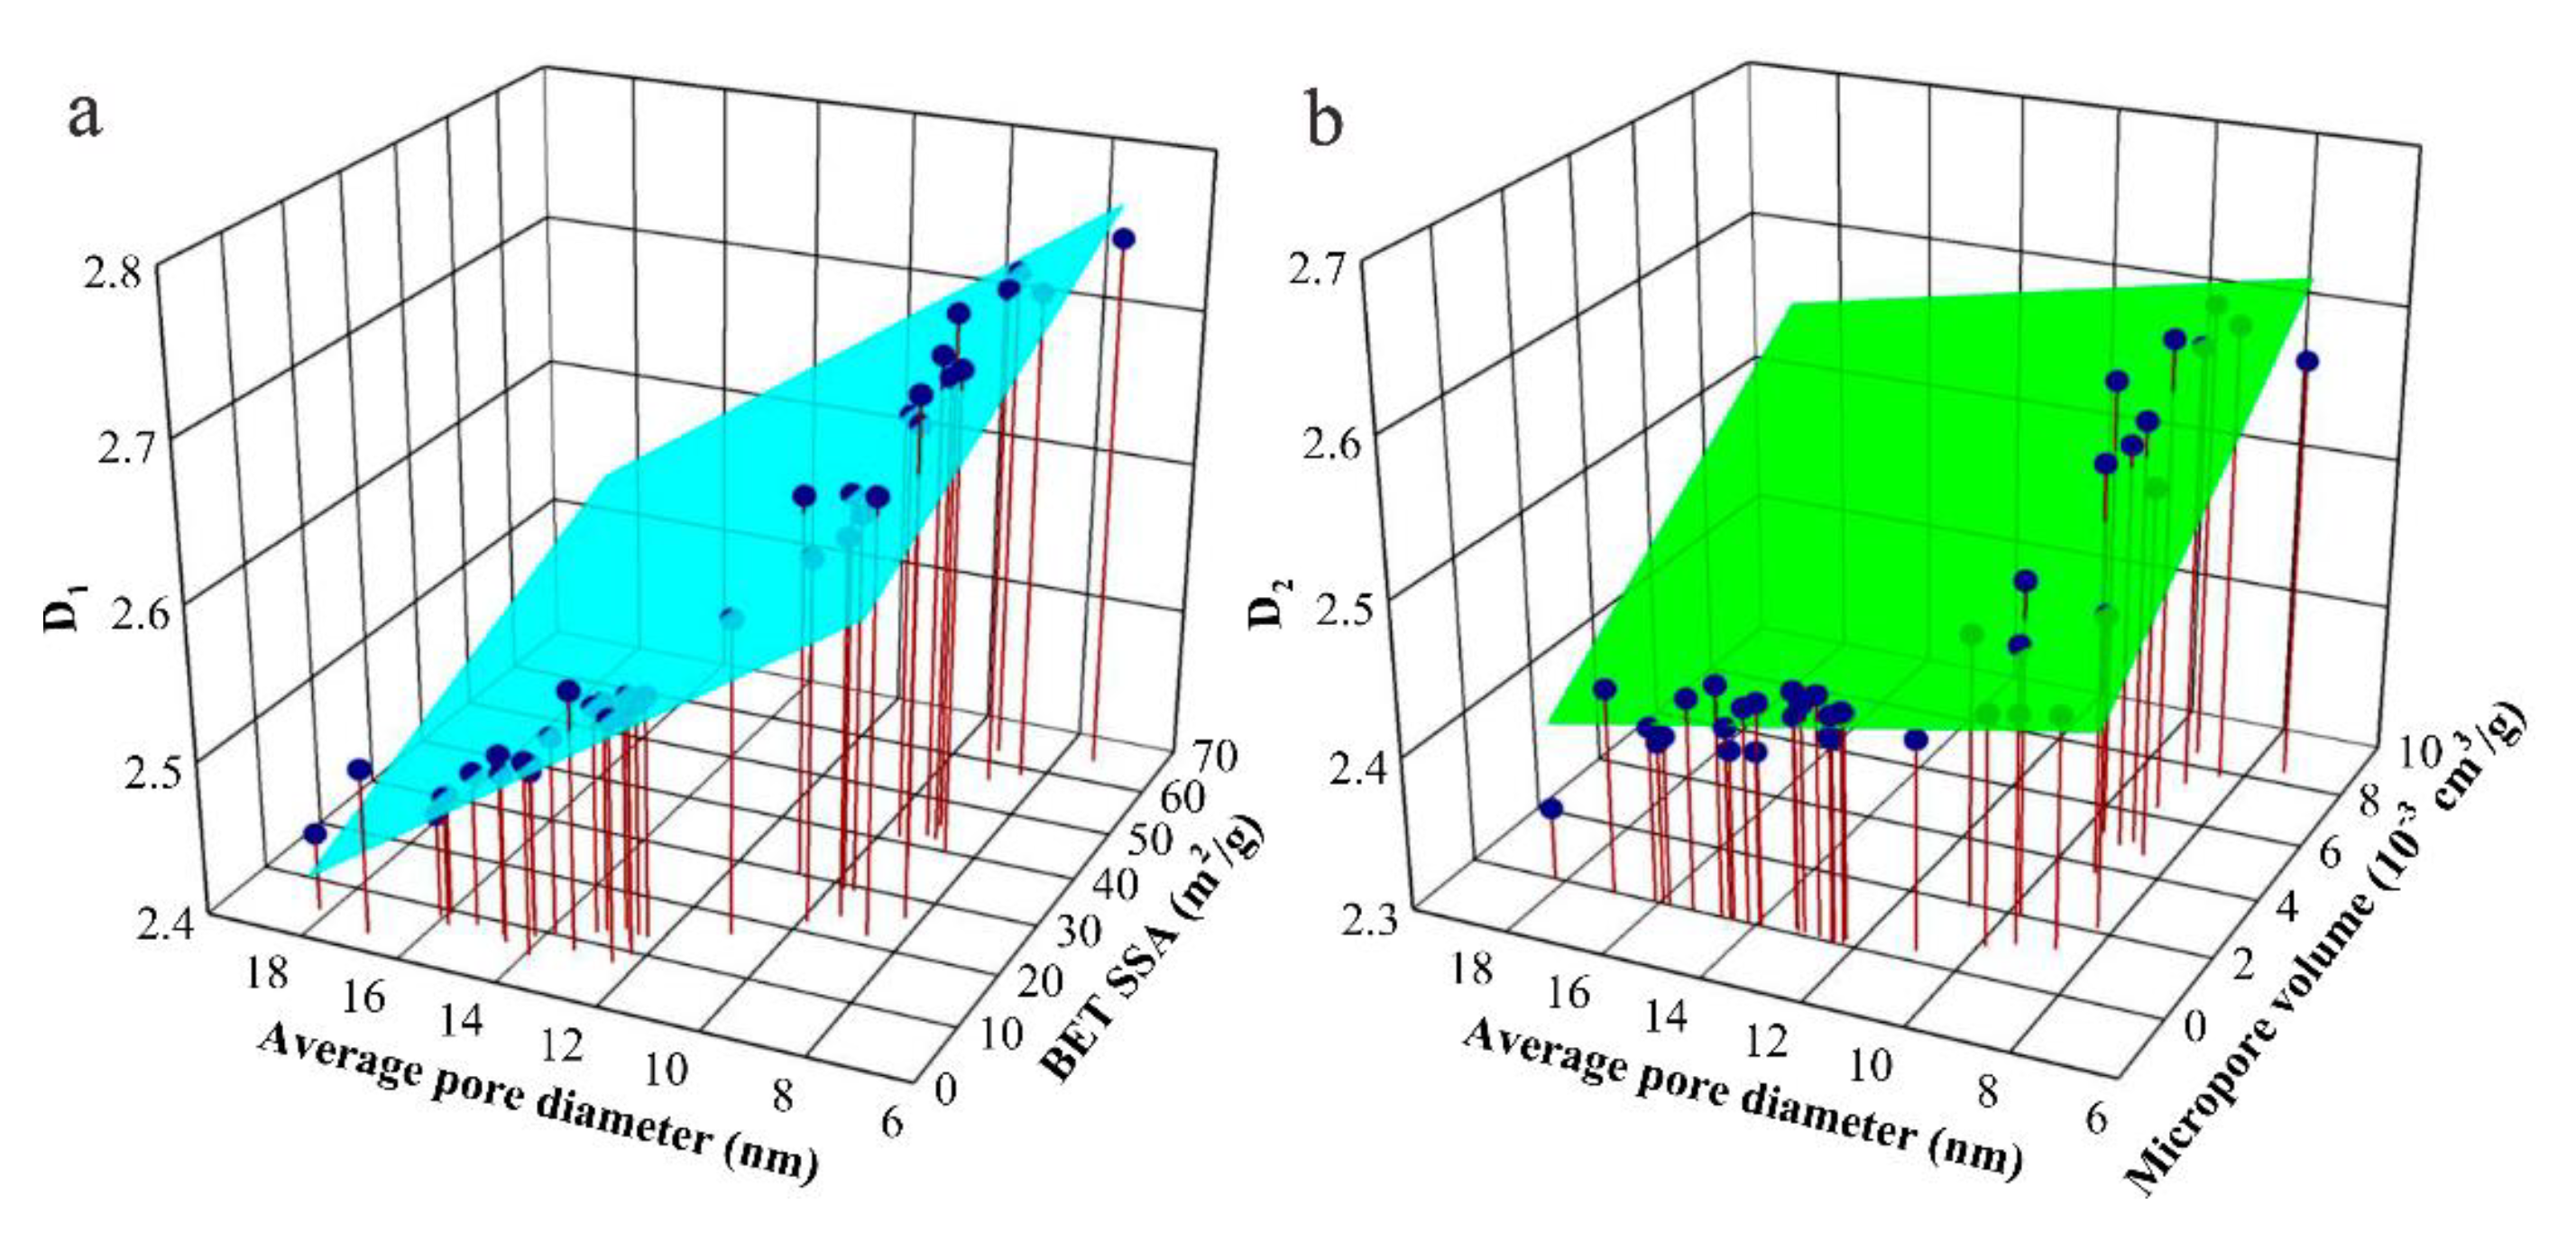
5.3. Prediction of Fractal Dimensions with Pore Structure Parameters

Multivariate linear regression is a kind of traditional regression technique of response surface modeling (RSM). Multivariate linear regression can be applied to predict a single dependent response variable using multiple independent predictor variables [22]. Stepwise regression, which is a kind of multivariate linear regression, has been used in this study to predict fractal dimensions with pore structure parameters.
Five independent variables were used in this study, including average pore diameter, BET SSA, micropore volume, mesopore volume, and macropore volume. In the criterion section, F-to-Enter is set to 4.0 (default value), and F-to-Remove is set to 3.9 (default value). P-value to reject is set to 0.05 (default value). Confidence intervals is set to 95% (default value). Generally, significance tests should be conducted on the regression equation (mainly including the test of goodness of fit and F test) and regression coefficients. However, the F test on the regression equation and the significance test on the regression coefficients are included during the regression process [22]. Therefore, only the test of goodness of fit is required. Table 1 lists the statistics from the regression models and the variance analysis results. The coefficient of determination, which is the square of multiple correlation coefficient, can be applied to judge the fitting degree of linear regression and illustrate how independent variables can explain the variations of dependent variables. The coefficient of multiple determination, which is the corrected coefficient of determination, is used to remove the effects produced by the number of explanatory variables.

5.3.1. Prediction of D1

In Model 1, as shown in Table 1, the coefficient of multiple determination is 0.960, and the P-value is less than 0.001, which is much less than the default value (0.05). It suggests that Model 1 has passed the significance test. The regression equation of Model 1 can be expressed as:
y = 0.0214 x 1 + 0.0018 x 2 + 2.8110
where y denotes D1; x 1 denotes average pore diameter (nm); x 2 denotes BET SSA (m2/g).
Figure 10a shows the 3D scatter plot and the response surface of Model 1. D1 shows a negative correlation with the average pore diameter and a positive correlation with BET SSA, which is consistent with the result mentioned above.

5.3.2. Prediction of D2

In Model 2, as shown in Table 1, the coefficient of multiple determination is 0.895, and the P-value is less than 0.001, which is much less than the default value (0.05). It suggests that Model 2 has passed the significance test. The regression equation of Model 2 can be expressed as:
y = 0.0186 x 1 0.0061 x 2 + 2.5150
where y denotes D2; x 1 denotes micropore volume (10−3 cm3/g); x 2 denotes average pore diameter (nm).
Figure 10b shows the 3D scatter plot and the response surface of Model 2. D2 shows a positive correlation with micropore volume and a negative correlation with average pore diameter, which is consistent with the result mentioned above.

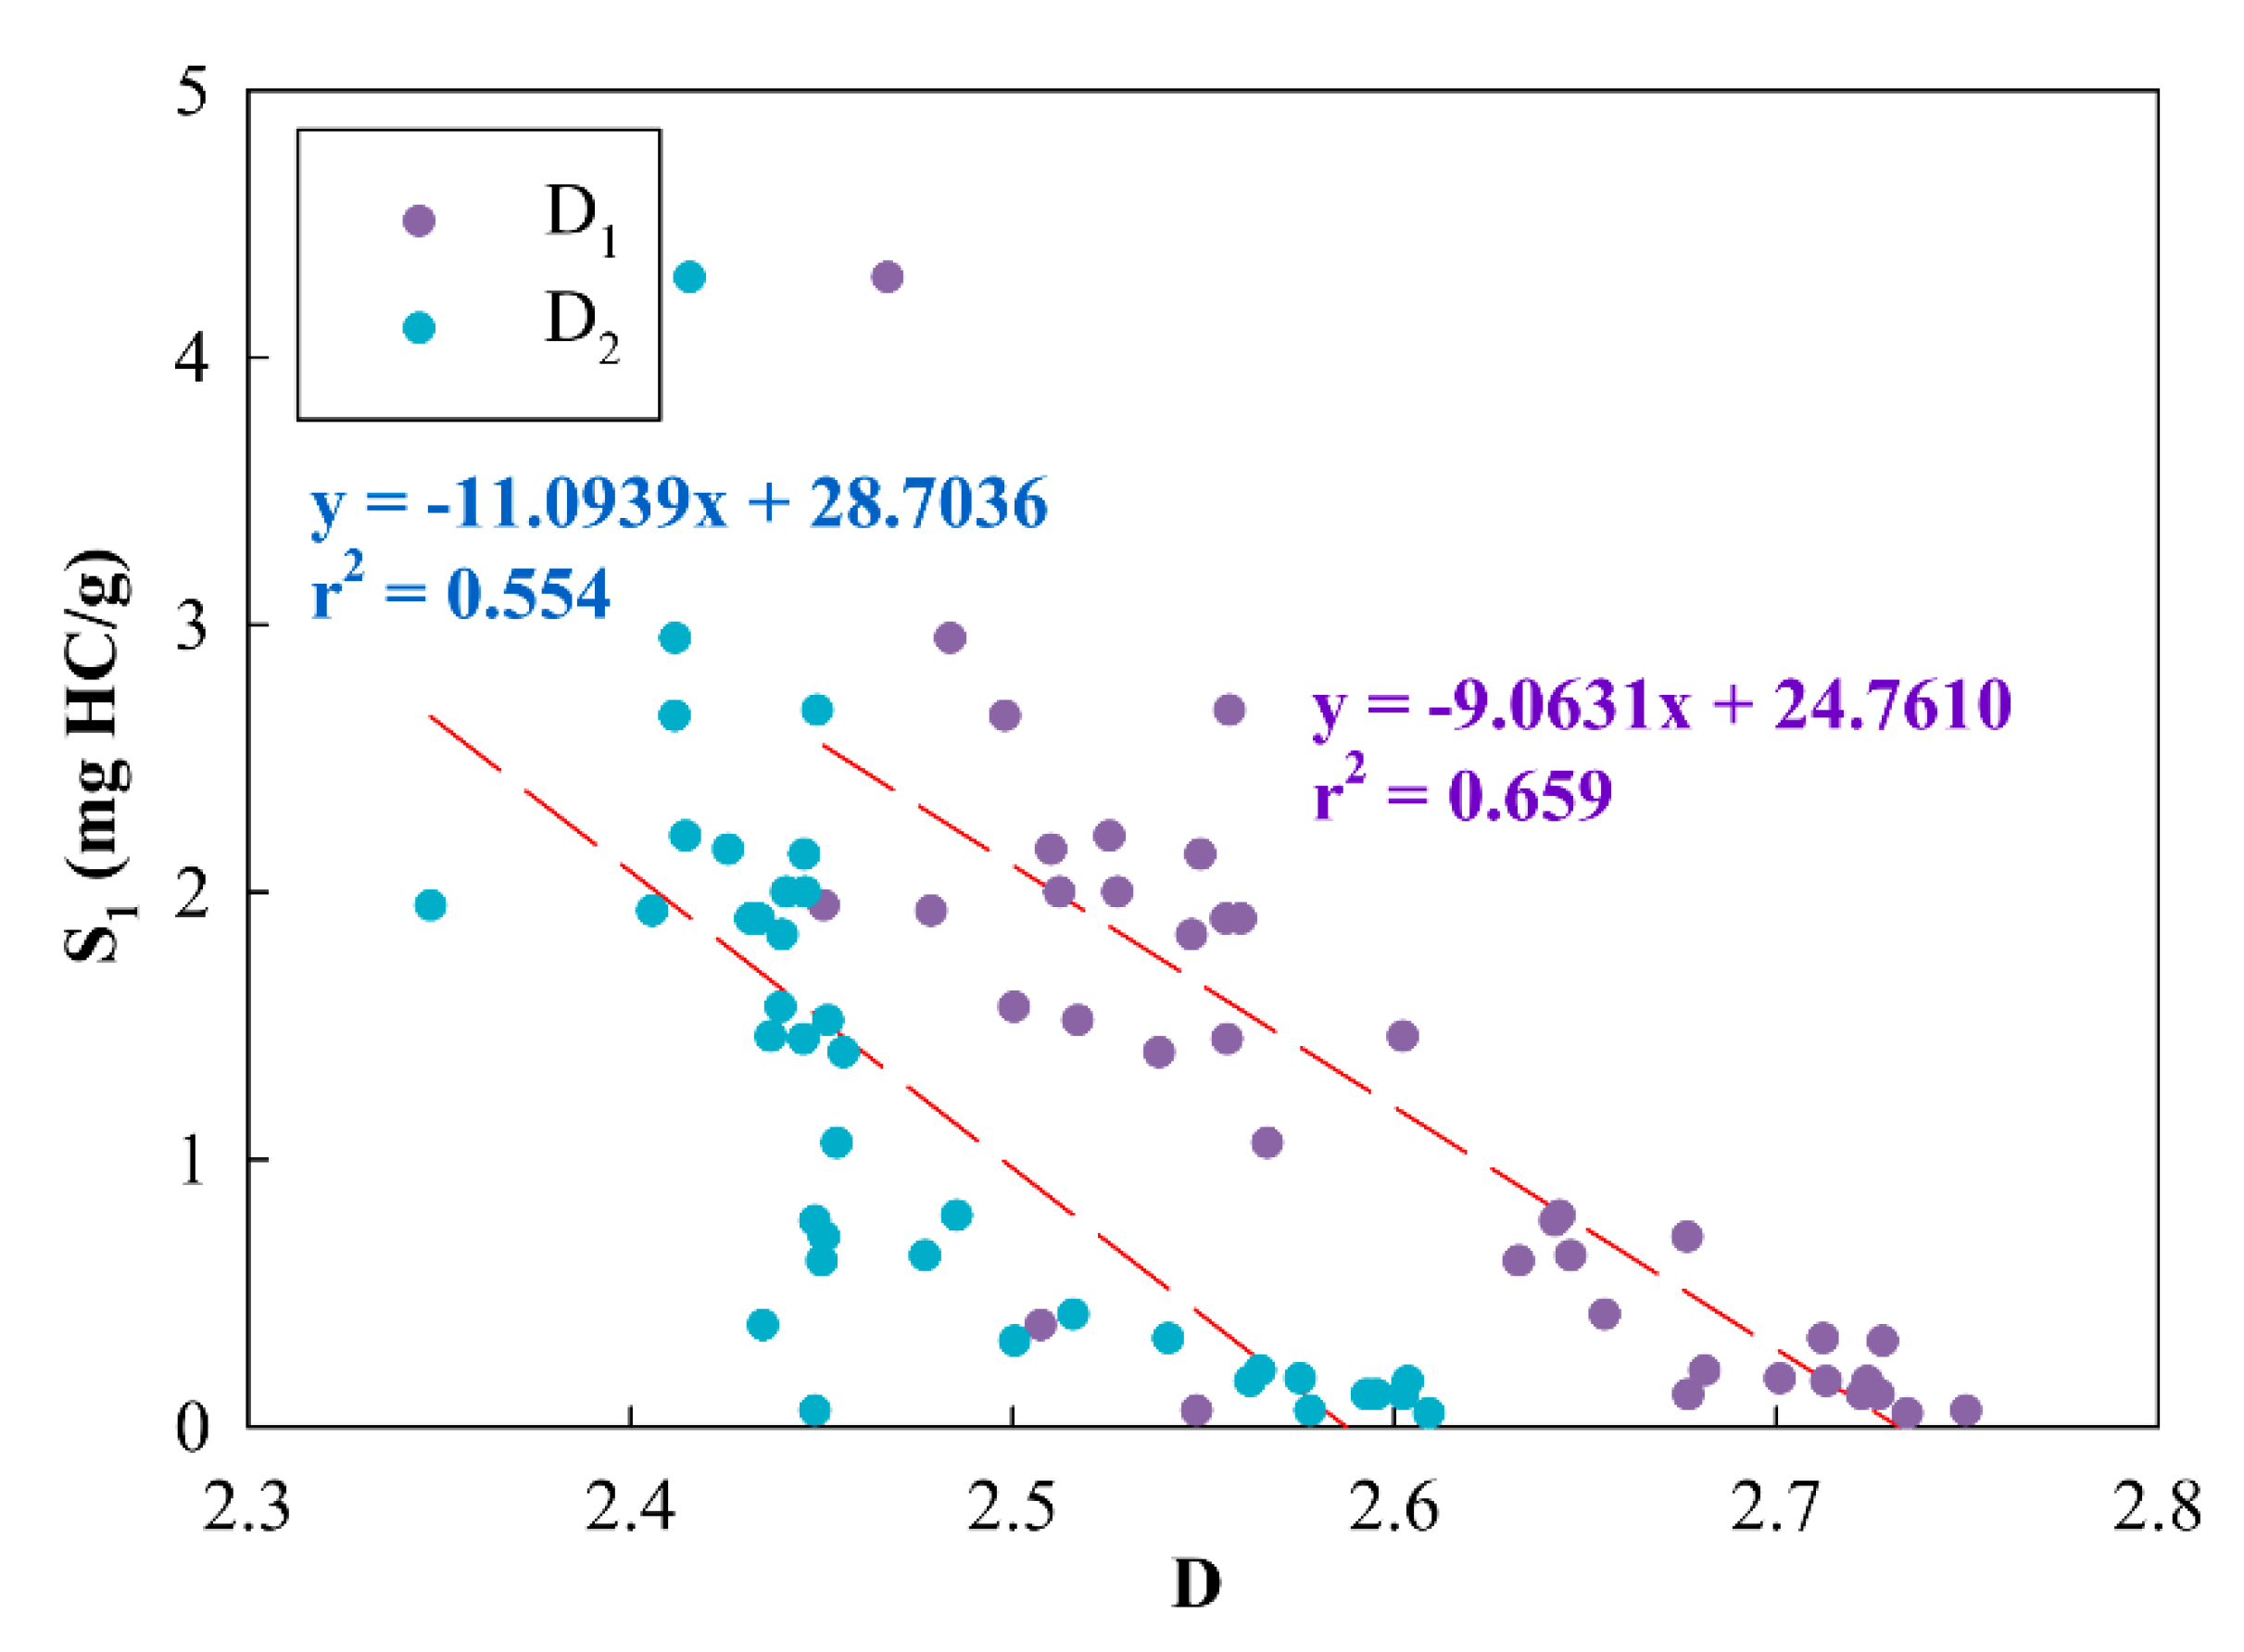
5.4. Relationships between Free Hydrocarbon Content and Fractal Dimensions

Table A1 shows the free hydrocarbon content (S1). S1 of K2qn1 is ranging from 0.06 mg HC/g to 4.30 mg HC/g, with an average of 1.95 mg HC/g. However, S1 of K2qn2,3 is in the range of 0.05–1.46 mg HC/g, with an average of 0.44 mg HC/g, which is much smaller than that of K2qn1. Therefore, K2qn1 is much better than K2qn2,3 in terms of free hydrocarbon content. Figure 11 shows the correlations between fractal dimensions (D1 and D2) and free hydrocarbon content (S1). S1 of lacustrine shale samples is negatively correlated with D1 and D2. The coefficient of determination (r2) between S1 and D1 is more significant than that between S1 and D2, which demonstrates that D1 can be applied to characterize the shale oil content. Shale samples with more free oil usually have a smaller D1, probably because free oil prefers being stored in larger pores, and a simpler pore structure makes oil flow smoother. This is quite distinct from coal and gas shale, which reveal that gas adsorption capacity is positively correlated with fractal dimensions [21]. It is because rougher surfaces (with larger fractal dimensions) can supply more adsorption sites for gas molecules. However, oil molecules, which are much bigger than gas molecules, only can be stored in larger pores (with smaller fractal dimensions).
Therefore, considering the effects of pore structure parameters on fractal dimensions, and the correlations between fractal dimensions and oil content (Figure 11), we found that lacustrine shales with larger average pore diameter, smaller BET SSA and fewer micropores will have more oil content, and these shales are better as a shale oil reservoir in terms of pore characteristics. Hence shales in K2qn1 are better than those in K2qn2,3 as a shale oil reservoir in the Songliao Basin.

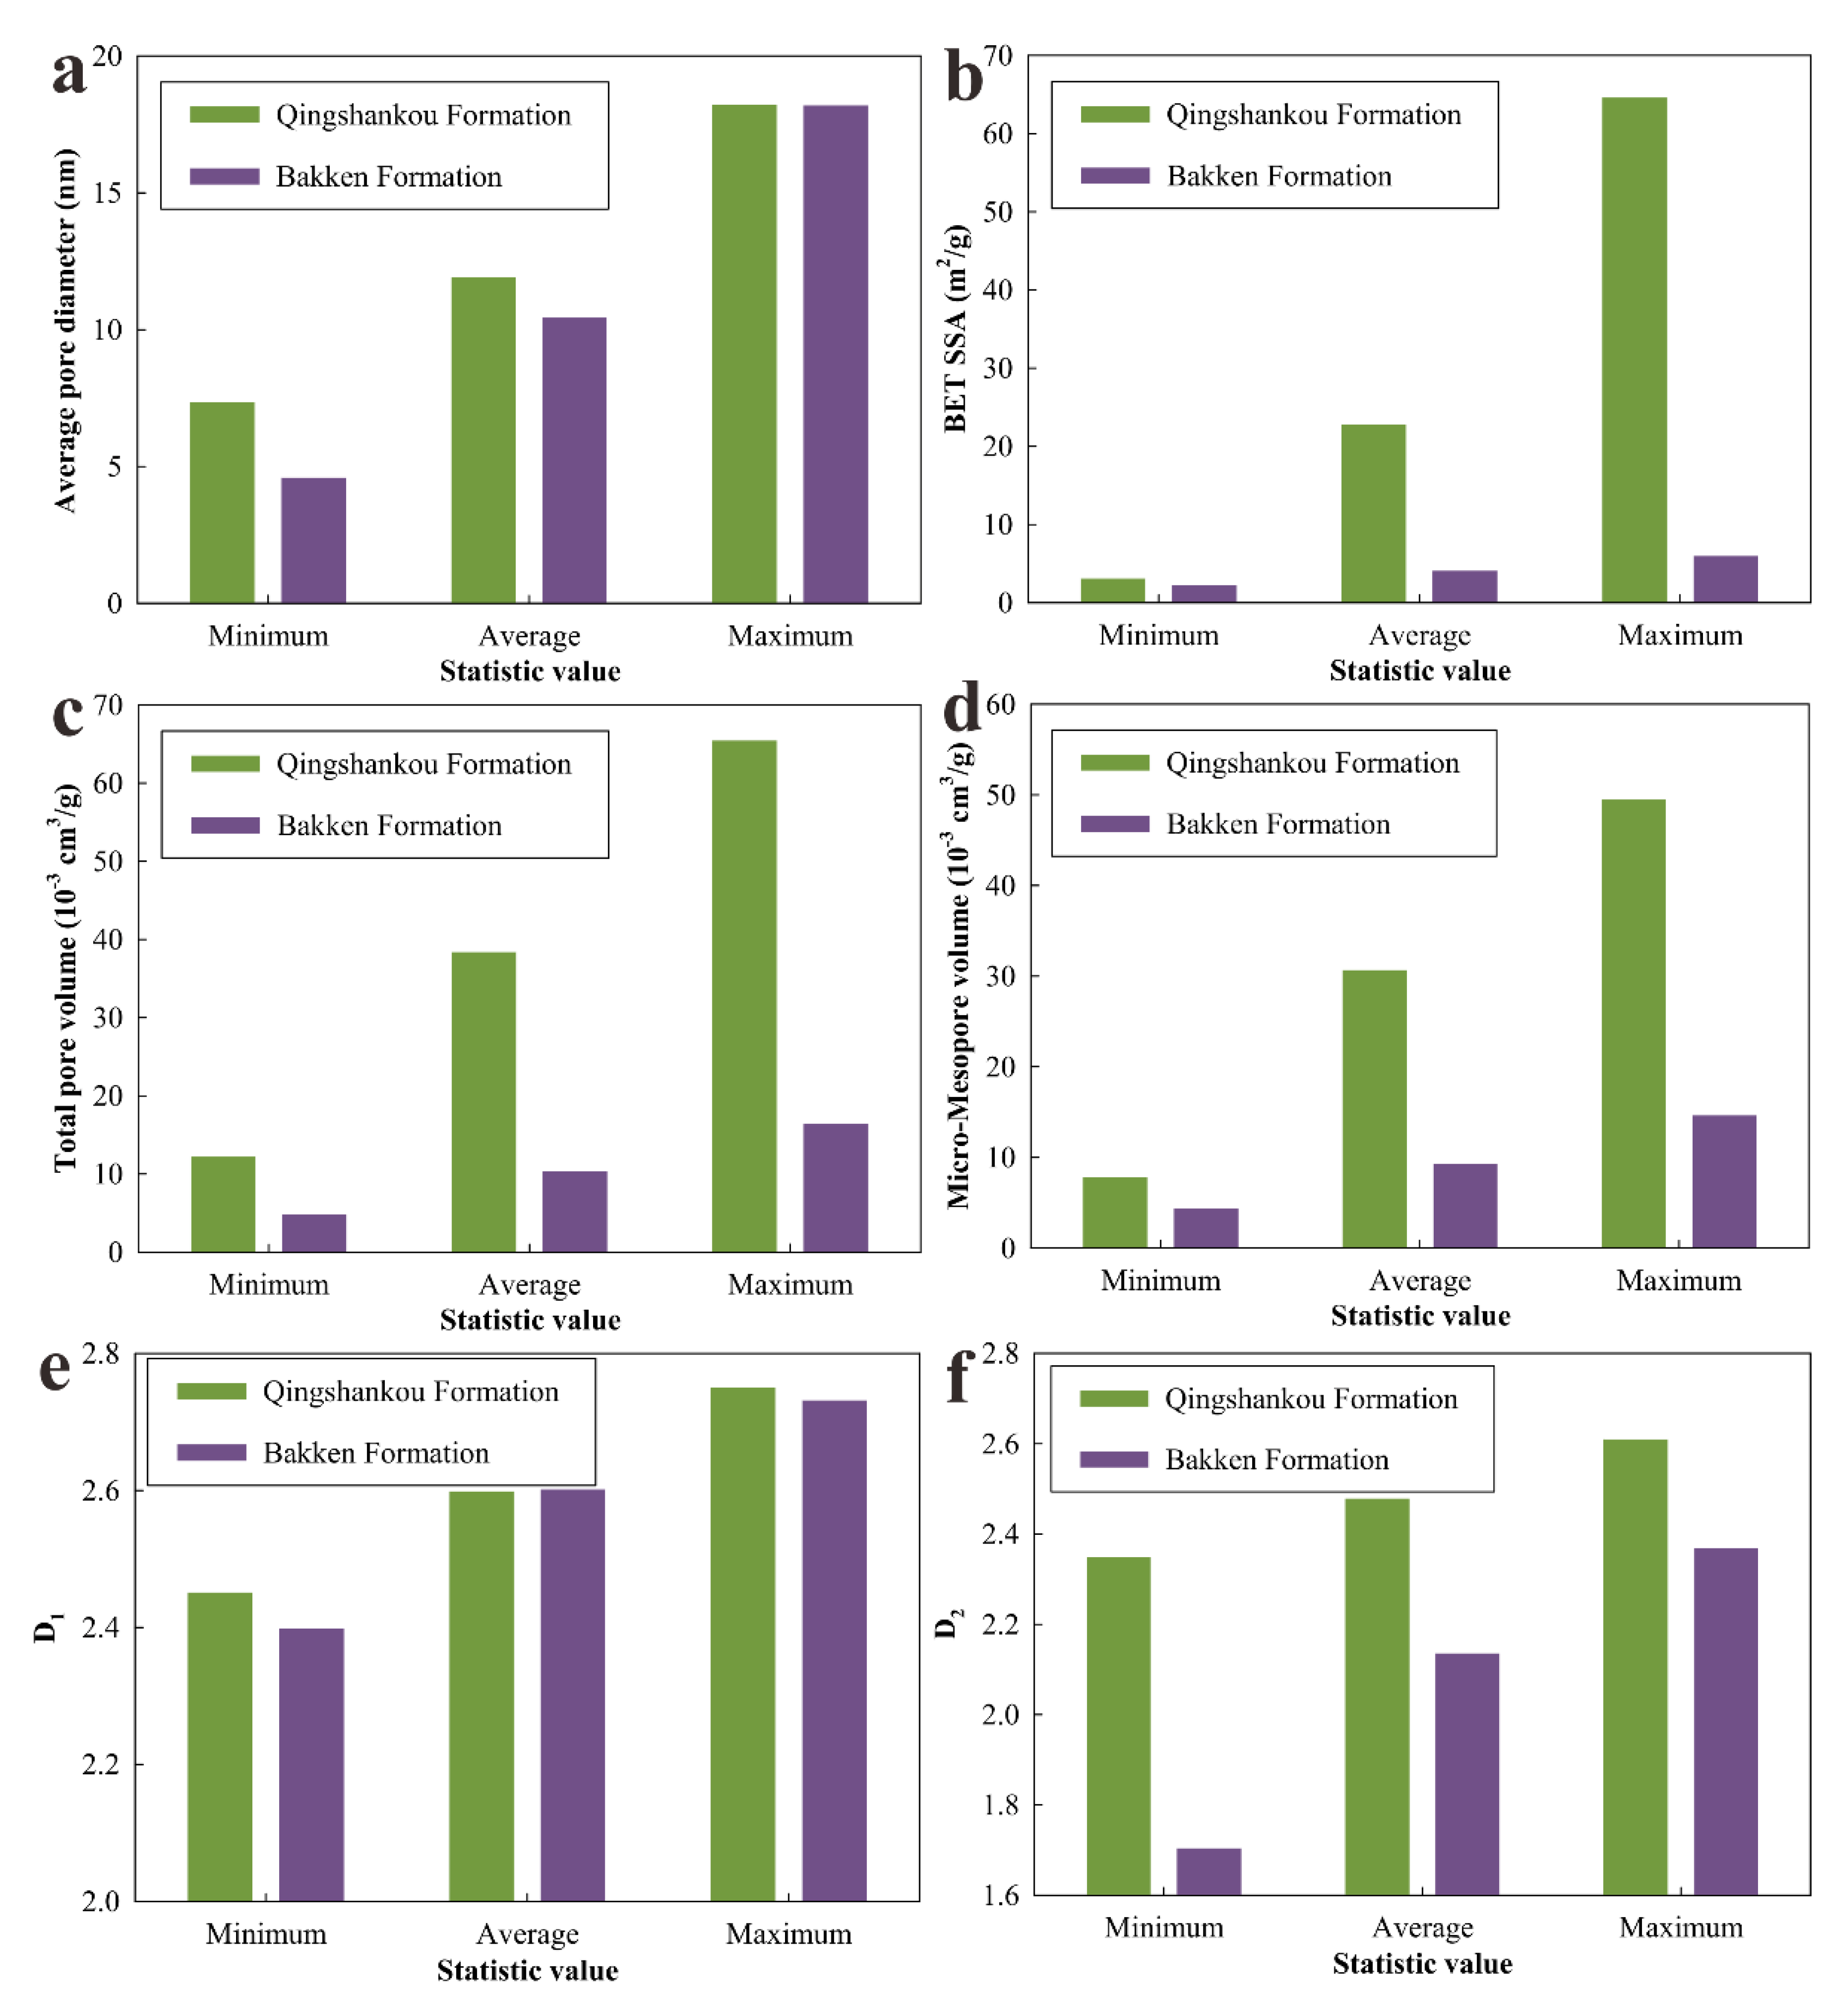
5.5. Comparison between Marine Bakken Formation Shales and Lacustrine Qingshankou Formation Shales

The Bakken Formation shale is one of the largest shale oil reservoirs worldwide located in the Williston Basin (North America) [25]. The Bakken Formation shale is a typical marine shale oil reservoir and has been studied extensively [25,26,27]. We chose marine Bakken Formation shales to compare with lacustrine Qingshankou Formation shales to see the difference of pore structure characteristics between them.
The Bakken Formation shales have organic-matter pores, interparticle pores, and intraparticle pores [27]. These kinds of pores also exist in the Qingshankou Formation shales. The isotherms from nitrogen adsorption of Middle Bakken Formation shales are closed and show distinct hysteresis loops, which indicates the existence of the mesopores in the Middle Bakken Formation [25]. However, the isotherms of Upper and Lower Bakken Formation shales are not closed and do not show visible hysteresis loops [25]. All the isotherms from nitrogen adsorption of the Qingshankou Formation shales are closed. They show apparent hysteresis loops, which are the same as Middle Bakken Formation, but different from Upper and Lower Bakken Formation. The Bakken Formation shales have both plate-shaped pores and silt-shaped pores, while the Qingshankou Formation shales have slit-shaped pores and some narrow slit-shaped pores.
Figure 12 shows the statistic values (minimum value, average value, and maximum value) of pore structure parameters and fractal dimensions in the Qingshankou Formation and Bakken Formation. Pore structure parameters and fractal dimensions of the Bakken Formation are from Reference [25]. The average pore diameter of the Qingshankou Formation (11.89 nm on average) is a little bit larger than that of the Bakken Formation (10.43 nm on average) (Figure 12a). BET SSA of the Bakken Formation (4.02 m2/g on average) is much smaller than that of the Qingshankou Formation (22.70 m2/g on average) (Figure 12b). The total pore volume of the Bakken Formation, with an average of 10.30 × 10⁻³ cm3/g, is much smaller than that of the Qingshankou Formation, with an average of 38.35 × 10⁻³ cm3/g (Figure 12c). The micro-mesopore volume of the Qingshankou Formation (30.64 × 10⁻³ cm3/g on average) is much larger than that of the Bakken Formation (9.27 × 10⁻³ cm3/g on average) (Figure 12d). The pore structure fractal dimension (D1) of the Qingshankou Formation (2.598 on average) is almost the same as D1 of the Bakken Formation (2.601 on average) (Figure 12e), which demonstrates shales of these two formations have similar complexity of pore structure. However, the pore surface fractal dimension (D2) of the Qingshankou Formation (2.478 on average) is much larger than D2 of the Bakken Formation (2.135 on average) (Figure 12f), which means the Qingshankou Formation shales have much rougher pore surface than the Bakken Formation shales. The average pore diameter is strongly negatively correlated with D1 in both Bakken Formation and Qingshankou Formation. However, the correlations between total pore volume and D1 are opposite in these two formations. The Bakken Formation shows a negative correlation [25], while the Qingshankou Formation shows a positive correlation.
This research was performed on the Qingshankou Formation shale, which is considered to be representative of lacustrine shale oil reservoirs in China. The pore characteristics of Qingshankou Formation can also represent more widely of general lacustrine organic-rich shale properties. These methods, including correlation analysis between pore structure parameters and fractal dimensions, and stepwise regression method, can be more extensively applied in other lacustrine organic-rich shales.

6. Conclusions

In this study, a total of 39 lacustrine shale samples from the Late Cretaceous Qingshankou Formation in the Songliao Basin were examined using the FE-SEM technique and low-pressure nitrogen adsorption. Fractal dimensions were calculated by the FHH model using nitrogen adsorption isotherms. The correlations between fractal dimensions and pore structure parameters were demonstrated using correlation matrix and multidimensional scaling. Prediction of fractal dimensions with pore structure parameters was analyzed using stepwise regression. Based on the results and discussion, the following conclusions can be drawn:
  • Interparticle pores are highly developed and are the most significant pore type in the Qingshankou Formation. Organic-matter pores are moderately developed and show high heterogeneity. Intraparticle pores and micro-fractures can also be found in the Qingshankou Formation.
  • The nitrogen adsorption/desorption isotherms of Qingshankou Formation shales are of Type IV, which represent mesoporous nature. According to the slope of isotherms measured by ΔVG/Δ(P/P0), most of the samples might have macropores or fractures. The hysteresis patterns are H3 and combination of H3-H4, which demonstrate these shales have slit-shaped pores produced by aggregates of plate-like particles and some narrow slit-shaped pores. Compared with shales in K2qn2,3, shales in K2qn1 have larger average pore diameter, much smaller BET SSA, and fewer micropores.
  • Both D1 and D2 in K2qn1 have narrower distributions and smaller values than those in K2qn2,3, which suggests shales in K2qn1 have simpler pore structures and smoother pore surfaces compared to shales in K2qn2,3.
  • Using correlation matrix and multidimensional scaling, we can find that BET SSA, micropore volume, D1, and D2 are positively correlated. Average pore diameter shows strongly negative relationships with BET SSA, micropore volume, D1 and D2. Free oil content has negative relationships with D1 and D2. Lacustrine shales with larger average pore diameter, smaller BET SSA, and fewer micropores will have more oil content, and these shales are better as a shale oil reservoir in terms of pore characteristics. Hence shales in K2qn1 are ideal compared to those in K2qn2,3 for a shale oil reservoir in the Songliao Basin.
  • The lacustrine Qingshankou Formation shales and the marine Bakken Formation shales have similar pore types, but they have different pore shapes. Average pore diameter, BET SSA, total pore volume, and micro-mesopore volume in the Qingshankou Formation are larger than those in the Bakken Formation. These two formations have similar complexity of pore structure, but Qingshankou Formation shales have much rougher pore surface than Bakken Formation shales.

Author Contributions

Conceptualization, X.C., Y.G., and J.C.; data curation, X.C.; formal analysis, X.C.; investigation, X.C.; methodology, X.C., J.C., and L.K.; resources, C.W.; supervision, Y.G., and C.W.; visualization, X.C.; writing—original draft, X.C.; writing—review and editing, Y.G., J.C., S.H., and S.S. All authors have read and agreed to the published version of the manuscript.

Funding

This research was supported by the National Natural Science Foundation of China (Grant No. 41790455, 41790452, and 41972096), the Fundamental Research Funds for the Central Universities (Grant No. 2652018119), and the China Geological Survey Program (DD20190502).

Acknowledgments

The authors would like to thank Bingsong Yu for his valuable suggestions on the manuscript. The authors also would like to thank Zalmai Yawar for his detailed editing of the manuscript. Special thanks to the anonymous reviewers and editors for their valuable comments.

Conflicts of Interest

The authors declare no conflict of interest.

Appendix A

Table A1. Quantitative pore parameters from low-pressure nitrogen adsorption analyses and free hydrocarbon content.
FormationSample IDDepth (m)Average Pore Diameter (nm)1 BET SSA (m2/g)Total Pore Volume
(10−3 cm3/g)
Micropore Volume (10−3 cm3/g)Mesopore Volume
(10−3 cm3/g)
Macropore Volume (10−3 cm3/g)ΔVG/Δ(P/P0) (cm3/g)2 S1
(mg HC/g)
K2qn2,3SK1S011286.5 7.34 64.57 45.10 8.41 33.18 3.51 736.25 0.06
SK1S021305.0 8.44 58.56 47.37 7.81 33.05 6.51 980.41 0.12
SK1S031319.4 9.06 44.80 34.86 6.31 22.71 5.84 945.18 0.05
SK1S041361.4 9.22 62.80 56.97 8.52 39.18 9.27 1325.12 0.17
SK1S051380.5 8.94 56.16 51.45 7.32 37.21 6.92 1060.65 0.12
SK1S061400.5 9.62 41.14 51.63 5.14 38.70 7.79 784.75 0.12
SK1S071440.3 8.95 42.24 47.12 5.02 35.96 6.14 703.65 0.18
SK1S081463.2 9.75 29.13 41.81 1.98 32.45 7.38 682.22 0.42
SK1S091474.7 9.16 37.56 41.57 3.79 31.57 6.21 751.45 0.21
SK1S101492.7 10.75 30.13 65.40 1.95 47.50 15.95 1120.61 0.64
SK1S111516.1 8.30 26.36 24.37 2.16 18.66 3.54 583.29 0.32
SK1S121539.9 9.15 42.47 45.46 4.82 32.09 8.54 1056.87 0.17
SK1S131559.8 8.59 40.00 50.73 4.67 38.06 8.00 943.46 0.33
SK1S141601.1 13.27 8.15 28.23 0.19 20.06 7.98 447.92 1.06
SK1S151619.6 9.88 21.96 44.38 0.89 34.92 8.57 838.53 0.62
SK1S161637.7 8.68 21.76 35.28 1.26 28.31 5.71 535.95 0.71
SK1S171640.0 9.57 29.30 45.87 1.44 36.55 7.88 814.66 0.79
SK1S181660.1 10.94 16.82 43.21 0.32 34.21 8.69 617.73 1.46
SK1S191700.9 9.42 24.29 49.00 1.15 40.14 7.71 706.49 0.77
K2qn1SK1S201703.5 13.06 12.73 40.89 0.10 30.82 9.97 671.08 0.06
SK1S211705.7 14.70 8.08 31.38 0.00 23.22 8.16 474.00 1.52
SK1S221709.2 12.27 13.12 41.12 0.20 32.48 8.45 548.68 1.45
SK1S231714.9 12.44 11.37 35.80 0.08 27.68 8.04 584.48 1.90
SK1S241726.8 13.88 10.35 34.91 0.00 26.06 8.85 516.84 2.00
SK1S251734.5 16.96 3.04 12.13 0.00 7.77 4.36 283.67 0.38
SK1S261739.4 12.76 13.71 41.16 0.12 33.07 7.97 795.15 1.40
SK1S271741.3 15.29 8.52 33.77 0.00 24.68 9.09 574.32 1.57
SK1S281744.3 12.45 7.63 23.42 0.01 17.94 5.47 406.42 1.90
SK1S291747.3 14.52 6.85 25.96 0.00 19.51 6.45 433.66 2.16
SK1S301750.9 14.45 11.57 44.50 0.00 34.33 10.17 654.10 2.66
SK1S311759.2 15.78 7.52 29.92 0.00 21.55 8.37 589.95 2.95
SK1S321760.3 18.22 5.05 24.35 0.00 16.34 8.01 532.01 1.95
SK1S331764.5 15.95 9.52 41.56 0.05 30.09 11.42 702.37 1.93
SK1S341767.3 16.08 8.72 35.58 0.00 26.55 9.03 631.13 4.30
SK1S351768.2 14.15 8.99 32.06 0.00 24.72 7.34 560.67 2.00
SK1S361770.0 12.26 9.65 23.23 0.09 18.23 4.91 379.43 2.68
SK1S371773.3 13.91 5.56 18.74 0.00 13.96 4.78 291.79 2.21
SK1S381777.3 12.47 13.21 38.02 0.07 29.59 8.35 1039.69 2.14
SK1S391780.4 13.19 11.98 37.46 0.10 28.02 9.34 756.46 1.84
1 BET SSA = Brunauer-Emmett-Teller specific surface area; 2 S1 = free hydrocarbon content.
Table A2. Fractal fitting parameters and fractal dimensions calculated using the FHH model.
Sample IDP/P0 > 0.5P/P0 < 0.5
Fitting Equation (1)R12D1Fitting Equation (2)R22D2
A + 33A + 3A + 33A + 3
SK1S01 y = 0.2502x + 3.1998 0.99512.74982.2494 y = 0.4219x + 3.10490.9998 2.5781 1.7343
SK1S02y = 0.2775x + 3.05250.9981 2.7225 2.1675 y = 0.3975x + 2.99250.9998 2.6025 1.8075
SK1S03y = 0.2656x + 2.77840.9971 2.7344 2.2032 y = 0.3908x + 2.72160.9997 2.6092 1.8276
SK1S04y = 0.2760x + 3.13650.9945 2.7240 2.1720 y = 0.3963x + 3.06260.9998 2.6037 1.8111
SK1S05y = 0.2730x + 3.04980.9917 2.7270 2.1810 y = 0.4071x + 2.95580.9999 2.5929 1.7787
SK1S06y = 0.3229x + 2.71240.9944 2.6771 2.0313 y = 0.4046x + 2.64800.9995 2.5954 1.7862
SK1S07y = 0.2989x + 2.77470.9905 2.7011 2.1033 y = 0.4245x + 2.68400.9997 2.5755 1.7265
SK1S08y = 0.3448x + 2.41850.9943 2.6552 1.9656 y = 0.4840x + 2.32690.9994 2.5160 1.5480
SK1S09y = 0.3186x + 2.64220.9960 2.6814 2.0442 y = 0.4350x + 2.56730.9998 2.5650 1.6950
SK1S10y = 0.3537x + 2.49800.9910 2.6463 1.9389 y = 0.5228x + 2.36350.9991 2.4772 1.4316
SK1S11y = 0.2720x + 2.34400.9937 2.7280 2.1840 y = 0.4993x + 2.21740.9995 2.5007 1.5021
SK1S12y = 0.2868x + 2.78350.9946 2.7132 2.1396 y = 0.4376x + 2.68960.9996 2.5624 1.6872
SK1S13y = 0.2876x + 2.73470.9932 2.7124 2.1372 y = 0.4591x + 2.63480.9997 2.5409 1.6227
SK1S14y = 0.4331x + 1.21150.9909 2.5669 1.7007 y = 0.5459x + 1.07200.9968 2.4541 1.3623
SK1S15y = 0.3673x + 2.18660.9933 2.6327 1.8981 y = 0.5498x + 2.05280.9982 2.4502 1.3506
SK1S16y = 0.3232x + 2.18250.9903 2.6768 2.0304 y = 0.5492x + 2.03250.9989 2.4508 1.3524
SK1S17y = 0.3566x + 2.44240.9952 2.6434 1.9302 y = 0.5145x + 2.33750.9988 2.4855 1.4565
SK1S18y = 0.3976x + 1.95250.9872 2.6024 1.8072 y = 0.5632x + 1.78610.9979 2.4368 1.3104
SK1S19y = 0.3578x + 2.31410.9918 2.6422 1.9266 y = 0.5516x + 2.15170.9981 2.4484 1.3452
SK1S20y = 0.4517x + 1.62150.9937 2.5483 1.6449 y = 0.5516x + 1.50940.9987 2.4484 1.3452
SK1S21y = 0.4828x + 1.16930.9925 2.5172 1.5516 y = 0.5482x + 1.05690.9990 2.4518 1.3554
SK1S22y = 0.4436x + 1.68520.9938 2.5564 1.6692 y = 0.5546x + 1.54840.9971 2.4454 1.3362
SK1S23y = 0.4400x + 1.53600.9911 2.5600 1.6800 y = 0.5685x + 1.39610.9989 2.4315 1.2945
SK1S24y = 0.4724x + 1.38820.9939 2.5276 1.5828 y = 0.5542x + 1.29980.9996 2.4458 1.3374
SK1S25y = 0.4925x + 0.10240.9964 2.5075 1.5225 y = 0.5652x + 0.06520.9962 2.4348 1.3044
SK1S26y = 0.4615x + 1.67830.9950 2.5385 1.6155 y = 0.5441x + 1.58320.9992 2.4559 1.3677
SK1S27y = 0.4995x + 1.17590.9945 2.5005 1.5015 y = 0.5606x + 1.10190.9987 2.4394 1.3182
SK1S28y = 0.4439x + 1.12640.9939 2.5561 1.6683 y = 0.5662x + 0.99920.9983 2.4338 1.3014
SK1S29y = 0.4898x + 0.96850.9951 2.5102 1.5306 y = 0.5743x + 0.88680.9993 2.4257 1.2771
SK1S30y = 0.5019x + 1.47910.9937 2.4981 1.4943 y = 0.5883x + 1.40540.9986 2.4117 1.2351
SK1S31y = 0.5162x + 0.98990.9970 2.4838 1.4514 y = 0.5882x + 0.96840.9959 2.4118 1.2354
SK1S32y = 0.5493x + 0.51020.9980 2.4507 1.3521 y = 0.6522x + 0.55610.9775 2.3478 1.0434
SK1S33y = 0.5212x + 1.23770.9968 2.4788 1.4364 y = 0.5942x + 1.20330.9953 2.4058 1.2174
SK1S34y = 0.5326x + 1.11920.9969 2.4674 1.4022 y = 0.5844x + 1.10480.9941 2.4156 1.2468
SK1S35y = 0.4876x + 1.24520.9957 2.5124 1.5372 y = 0.5591x + 1.16070.9996 2.4409 1.3227
SK1S36y = 0.4430x + 1.28180.9947 2.5570 1.6710 y = 0.5510x + 1.21790.9992 2.4490 1.3470
SK1S37y = 0.4745x + 0.73830.9960 2.5255 1.5765 y = 0.5855x + 0.67280.9992 2.4145 1.2435
SK1S38y = 0.4507x + 1.64210.9952 2.5493 1.6479 y = 0.5544x + 1.54580.9994 2.4456 1.3368
SK1S39y = 0.4530x + 1.53810.9944 2.5470 1.6410 y = 0.5602x + 1.44580.9997 2.4398 1.3194

References

  1. Curtis, J.B. Fractured shale-gas systems. AAPG Bull. 2002, 86, 1921–1938. [Google Scholar] [CrossRef]
  2. Jarvie, D.M.; Hill, R.J.; Ruble, T.E.; Pollastro, R.M. Unconventional shale-gas systems: The Mississippian Barnett Shale of north-central Texas as one model for thermogenic shale-gas assessment. AAPG Bull. 2007, 91, 475–499. [Google Scholar] [CrossRef]
  3. Lv, D.W.; Li, Z.X.; Chen, J.T.; Liu, H.Y.; Guo, J.B.; Shang, L.N. Characteristics of the Permian coal-formed gas sandstone reservoirs in Bohai Bay Basin and the adjacent areas, North China. J. Pet. Sci. Eng. 2011, 78, 516–528. [Google Scholar] [CrossRef]
  4. Jarvie, D.M. Shale Resource Systems for Oil and Gas: Part 2—Shale-oil Resource Systems. In Shale Reservoirs—Giant Resources for the 21st Century; AAPG Memoir; Breyer, J.A., Ed.; American Association of Petroleum Geologists: Tulsa, OK, USA, 2012; Volume 97, pp. 89–119. [Google Scholar] [CrossRef]
  5. Lv, D.W.; Chen, J.T.; Li, Z.X.; Zheng, G.Q.; Song, C.Y.; Liu, H.Y.; Meng, Y.R.; Wang, D.D. Controlling Factors, Accumulation Model and Target Zone Prediction of the Coal-bed Methane in the Huanghebei Coalfield, North China. Resour. Geol. 2014, 64, 332–345. [Google Scholar] [CrossRef] [Green Version]
  6. Lv, D.W.; Li, Z.X.; Wang, D.D.; Li, Y.; Liu, H.Y.; Liu, Y.; Wang, P.L. Sedimentary Model of Coal and Shale in the Paleogene Lijiaya Formation of the Huangxian Basin: Insight from Petrological and Geochemical Characteristics of Coal and Shale. Energy Fuels 2019, 33, 10442–10456. [Google Scholar] [CrossRef]
  7. Li, W.R.; Dong, Z.Z.; Lei, G. Integrating Embedded Discrete Fracture and Dual-Porosity, Dual-Permeability Methods to Simulate Fluid Flow in Shale Oil Reservoirs. Energies 2017, 10, 1471. [Google Scholar] [CrossRef] [Green Version]
  8. Du, F.S.; Nojabaei, B. A Review of Gas Injection in Shale Reservoirs: Enhanced Oil/Gas Recovery Approaches and Greenhouse Gas Control. Energies 2019, 12, 2355. [Google Scholar] [CrossRef] [Green Version]
  9. Reynolds, D.B.; Umekwe, M.P. Shale-Oil Development Prospects: The Role of Shale-Gas in Developing Shale-Oil. Energies 2019, 12, 3331. [Google Scholar] [CrossRef] [Green Version]
  10. Zou, C.N.; Zhu, R.K.; Chen, Z.Q.; Ogg, J.G.; Wu, S.T.; Dong, D.Z.; Qiu, Z.; Wang, Y.M.; Wang, L.; Lin, S.H.; et al. Organic-matter-rich shales of China. Earth-Sci. Rev. 2019, 189, 51–78. [Google Scholar] [CrossRef]
  11. Jia, B.; Tsau, J.S.; Barati, R. Investigation of Shale-Gas-Production Behavior: Evaluation of the Effects of Multiple Physics on the Matrix. SPE Reservoir Eval. Eng. 2019. [Google Scholar] [CrossRef]
  12. Slatt, R.M.; O’Brien, N.R. Pore types in the Barnett and Woodford gas shales: Contribution to understanding gas storage and migration pathways in fine-grained rocks. AAPG Bull. 2011, 95, 2017–2030. [Google Scholar] [CrossRef]
  13. Zhang, J.P.; Fan, T.L.; Li, J.; Zhang, J.C.; Li, Y.F.; Wu, Y.; Xiong, W.W. Characterization of the Lower Cambrian Shale in the Northwestern Guizhou Province, South China: Implications for Shale-Gas Potential. Energy Fuels 2015, 29, 6383–6393. [Google Scholar] [CrossRef]
  14. Schieber, J. Shale Microfabrics and Pore Development−An Overview with Emphasis on the Importance of Depositional Processes. In Proceedings of the Gas Shale of the Horn River Basin: Canadian Society of Petroleum Geologists, Calgary, AB, Canada, 9–11 May 2011; pp. 115–119. [Google Scholar]
  15. Ma, L.; Slater, T.; Dowey, P.J.; Yue, S.; Rutter, E.H.; Taylor, K.G.; Lee, P.D. Hierarchical integration of porosity in shales. Sci. Rep. 2018, 8, 11683–11696. [Google Scholar] [CrossRef] [PubMed]
  16. Bahadur, J.; Ruppert, L.F.; Pipich, V.; Sakurovs, R.; Melnichenko, Y.B. Porosity of the Marcellus Shale: A contrast matching small-angle neutron scattering study. Int. J. Coal Geol. 2018, 188, 156–164. [Google Scholar] [CrossRef]
  17. Loucks, R.G.; Reed, R.M.; Ruppel, S.C.; Jarvie, D.M. Morphology, genesis, and distribution of nanometer-scale pores in siliceous mudstones of the Mississippian Barnett Shale. J. Sediment. Res. 2009, 79, 848–861. [Google Scholar] [CrossRef] [Green Version]
  18. Chalmers, G.R.; Bustin, R.M.; Power, I.M. Characterization of gas shale pore systems by porosimetry, pycnometry, surface area, and field emission scanning electron microscopy/transmission electron microscopy image analyses: Examples from the Barnett, Woodford, Haynesville, Marcellus, and Doig units. AAPG Bull. 2012, 96, 1099–1119. [Google Scholar] [CrossRef]
  19. Milliken, K.L.; Rudnicki, M.; Awwiller, D.N.; Zhang, T.W. Organic matter-hosted pore system, Marcellus Formation (Devonian), Pennsylvania. AAPG Bull. 2013, 97, 177–200. [Google Scholar] [CrossRef]
  20. Schieber, J. SEM Observations on Ion-milled Samples of Devonian Black Shales from Indiana and New York: The Petrographic Context of Multiple Pore Types. In Electron Microscopy of Shale Hydrocarbon Reservoirs; AAPG Memoir; Camp, W., Diaz, E., Wawak, B., Eds.; American Association of Petroleum Geologists: Tulsa, OK, USA, 2013; Volume 102, pp. 153–171. [Google Scholar] [CrossRef]
  21. Yang, F.; Ning, Z.F.; Liu, H.Q. Fractal characteristics of shales from a shale gas reservoir in the Sichuan Basin, China. Fuel 2014, 115, 378–384. [Google Scholar] [CrossRef]
  22. Cao, X.M.; Yu, B.S.; Li, X.T.; Sun, M.D.; Zhang, L. Reservoir characteristics and well-logging evaluation of the Lower Cambrian shales in southeast Chongqing, China. Pet. Res. 2016, 1, 178–190. [Google Scholar] [CrossRef]
  23. Schieber, J.; Lazar, R.; Bohacs, K.; Klimentidis, R.; Dumitrescu, M.; Ottmann, J. An SEM Study of Porosity in the Eagle Ford Shale of Texas−Pore Types and Porosity Distribution in a Depositional and Sequence-stratigraphic Context. In The Eagle Ford Shale: A renaissance in U.S. Oil Production; AAPG Memoir; Breyer, J.A., Ed.; American Association of Petroleum Geologists: Tulsa, OK, USA, 2016; Volume 110, pp. 167–186. [Google Scholar] [CrossRef] [Green Version]
  24. Sun, M.D.; Yu, B.S.; Hu, Q.H.; Yang, R.; Zhang, Y.F.; Li, B.; Melnichenko, Y.B.; Cheng, G. Pore structure characterization of organic-rich Niutitang shale from China: Small angle neutron scattering (SANS) study. Int. J. Coal Geol. 2018, 186, 115–125. [Google Scholar] [CrossRef]
  25. Liu, K.Q.; Ostadhassan, M.; Zhou, J.; Gentzis, T.; Rezaee, R. Nanoscale pore structure characterization of the Bakken shale in the USA. Fuel 2017, 209, 567–578. [Google Scholar] [CrossRef]
  26. Li, C.X.; Kong, L.Y.; Ostadhassan, M.; Gentzis, T. Nanoscale Pore Structure Characterization of Tight Oil Formation: A Case Study of the Bakken Formation. Energy Fuels 2019, 33, 6008–6019. [Google Scholar] [CrossRef]
  27. Liu, K.Q.; Ostadhassan, M.; Sun, L.W.; Zou, J.; Yuan, Y.J.; Gentzis, T.; Zhang, Y.X.; Carvajal-Ortiz, H.; Rezaee, R. A comprehensive pore structure study of the Bakken Shale with SANS, N2 adsorption and mercury intrusion. Fuel 2019, 245, 274–285. [Google Scholar] [CrossRef]
  28. Tian, H.; Pan, L.; Xiao, X.M.; Wilkins, R.W.T.; Meng, Z.P.; Huang, B.J. A preliminary study on the pore characterization of Lower Silurian black shales in the Chuandong Thrust Fold Belt, southwestern China using low pressure N2 adsorption and FE-SEM methods. Mar. Pet. Geol. 2013, 48, 8–19. [Google Scholar] [CrossRef]
  29. Yang, R.; He, S.; Yi, J.Z.; Hu, Q.H. Nano-scale pore structure and fractal dimension of organic-rich Wufeng-Longmaxi shale from Jiaoshiba area, Sichuan Basin: Investigations using FE-SEM, gas adsorption and helium pycnometry. Mar. Pet. Geol. 2016, 70, 27–45. [Google Scholar] [CrossRef]
  30. Sun, M.D.; Yu, B.S.; Hu, Q.H.; Yang, R.; Zhang, Y.F.; Li, B. Pore connectivity and tracer migration of typical shales in south China. Fuel 2017, 203, 32–46. [Google Scholar] [CrossRef]
  31. Sun, M.D.; Yu, B.S.; Hu, Q.H.; Zhang, Y.F.; Li, B.; Yang, R.; Melnichenko, Y.B.; Cheng, G. Pore characteristics of Longmaxi shale gas reservoir in the Northwest of Guizhou, China: Investigations using small-angle neutron scattering (SANS), helium pycnometry, and gas sorption isotherm. Int. J. Coal Geol. 2017, 171, 61–68. [Google Scholar] [CrossRef] [Green Version]
  32. Chen, F.W.; Lu, S.F.; Ding, X.; Zhao, H.Q.; Ju, Y.W. Total Porosity Measured for Shale Gas Reservoir Samples: A Case from the Lower Silurian Longmaxi Formation in Southeast Chongqing, China. Minerals 2019, 9, 5. [Google Scholar] [CrossRef] [Green Version]
  33. Jia, B.; Tsau, J.S.; Barati, R. A review of the current progress of CO2 injection EOR and carbon storage in shale oil reservoirs. Fuel 2019, 236, 404–427. [Google Scholar] [CrossRef]
  34. Brunauer, S.; Deming, L.S.; Deming, W.E.; Teller, E. On a Theory of the van der Waals Adsorption of Gases. J. Am. Chem. Soc. 1940, 62, 1723–1732. [Google Scholar] [CrossRef]
  35. Kuila, U.; Prasad, M. Specific surface area and pore-size distribution in clays and shales. Geophys. Prospect. 2013, 61, 341–362. [Google Scholar] [CrossRef]
  36. Ma, X.; Guo, S.B. Comparative Study on Shale Characteristics of Different Sedimentary Microfacies of Late Permian Longtan Formation in Southwestern Guizhou, China. Minerals 2019, 9, 20. [Google Scholar] [CrossRef] [Green Version]
  37. Zhang, X.L.; Wu, C.F.; He, J.X.; Ren, Z.Q.; Zhou, T.T. The Controlling Effects of Compositions on Nanopore Structure of Over-Mature Shale from the Longtan Formation in the Laochang Area, Eastern Yunnan, China. Minerals 2019, 9, 403. [Google Scholar] [CrossRef] [Green Version]
  38. Bu, H.L.; Ju, Y.W.; Tan, J.Q.; Wang, G.C.; Li, X.S. Fractal characteristics of pores in non-marine shales from the Huainan coalfield, eastern China. J. Nat. Gas Sci. Eng. 2015, 24, 166–177. [Google Scholar] [CrossRef]
  39. Liu, X.J.; Xiong, J.; Liang, L.X. Investigation of pore structure and fractal characteristics of organic-rich Yanchang formation shale in central China by nitrogen adsorption/desorption analysis. J. Nat. Gas Sci. Eng. 2015, 22, 62–72. [Google Scholar] [CrossRef]
  40. Ma, Y.Z.; Gomez, E.; Phillips, D.; Dorion, C.; Moore, W.R. Simpson’s Paradox in Evaluating and Developing Unconventional Resources. In Proceedings of the IAMG Annual Conference, State College, PA, USA, 10–16 August 2019. [Google Scholar]
  41. Feng, Z.Q.; Wang, C.S.; Graham, S.; Koeberl, C.; Dong, H.L.; Huang, Y.J.; Gao, Y. Continental Scientific Drilling Project of Cretaceous Songliao Basin: Scientific objectives and drilling technology. Palaeogeogr. Palaeoclimatol. Palaeoecol. 2013, 385, 6–16. [Google Scholar] [CrossRef]
  42. Gao, Y.; Wang, C.S.; Wang, P.J.; Gao, Y.F.; Huang, Y.J.; Zou, C.C. Progress on Continental Scientific Drilling Project of Cretaceous Songliao Basin (SK-1 and SK-2). Sci. Bull. 2019, 64, 73–75. [Google Scholar] [CrossRef] [Green Version]
  43. Wan, X.Q.; Zhao, J.; Scott, R.W.; Wang, P.J.; Feng, Z.H.; Huang, Q.H.; Xi, D.P. Late Cretaceous stratigraphy, Songliao Basin, NE China: SK1 cores. Palaeogeogr. Palaeoclimatol. Palaeoecol. 2013, 385, 31–43. [Google Scholar] [CrossRef]
  44. Gao, Y.; Ibarra, D.E.; Wang, C.S.; Caves, J.K.; Chamberlain, C.P.; Graham, S.A.; Wu, H.C. Mid-latitude terrestrial climate of East Asia linked to global climate in the Late Cretaceous. Geology 2015, 43, 287–290. [Google Scholar] [CrossRef]
  45. Wang, C.S.; Feng, Z.Q.; Zhang, L.M.; Huang, Y.J.; Cao, K.; Wang, P.J.; Zhao, B. Cretaceous paleogeography and paleoclimate and the setting of SKI borehole sites in Songliao Basin, northeast China. Palaeogeogr. Palaeoclimatol. Palaeoecol. 2013, 385, 17–30. [Google Scholar] [CrossRef]
  46. Feng, Z.Q.; Jia, C.Z.; Xie, X.N.; Zhang, S.; Feng, Z.H.; Cross, T.A. Tectonostratigraphic units and stratigraphic sequences of the nonmarine Songliao basin, northeast China. Basin Res. 2010, 22, 79–95. [Google Scholar] [CrossRef]
  47. Graham, S.A.; Hendrix, M.S.; Johnson, C.L.; Badamgarav, D.; Badarch, G.; Amory, J.; Porter, M.; Barsbold, R.; Webb, L.E.; Hacker, B.R. Sedimentary record and tectonic implications of Mesozoic rifting in southeast Mongolia. Geol. Soc. Am. Bull. 2001, 113, 1560–1579. [Google Scholar] [CrossRef]
  48. Ren, J.Y.; Tamaki, K.; Li, S.T.; Zhang, J.X. Late Mesozoic and Cenozoic rifting and its dynamic setting in Eastern China and adjacent areas. Tectonophysics 2002, 344, 175–205. [Google Scholar] [CrossRef]
  49. Wang, C.S.; Scott, R.W.; Wan, X.Q.; Graham, S.A.; Huang, Y.J.; Wang, P.J.; Wu, H.C.; Dean, W.E.; Zhang, L.M. Late Cretaceous climate changes recorded in Eastern Asian lacustrine deposits and North American Epieric sea strata. Earth-Sci. Rev. 2013, 126, 275–299. [Google Scholar] [CrossRef]
  50. Gao, Y.; Wang, C.S.; Liu, Z.F.; Du, X.J.; Ibarra, D.E. Diagenetic and paleoenvironmental controls on Late Cretaceous clay minerals in the Songliao Basin, northeast China. Clays Clay Miner. 2015, 63, 469–484. [Google Scholar] [CrossRef]
  51. Gregg, S.J.; Sing, K.S.W. Adsorption, Surface Area and Porosity, 2nd ed.; Academic Press: New York, NY, USA, 1982; p. 303. [Google Scholar]
  52. Rouquerol, J.; Avnir, D.; Fairbridge, C.W.; Everett, D.H.; Haynes, J.H.; Pernicone, N.; Ramsay, J.D.F.; Sing, K.S.W.; Unger, K.K. Recommendations for the characterization of porous solids (Technical Report). Pure Appl. Chem. 1994, 66, 1739–1758. [Google Scholar] [CrossRef]
  53. Groen, J.C.; Peffer, L.A.A.; Perez-Ramírez, J. Pore size determination in modified micro- and mesoporous materials. Pitfalls and limitations in gas adsorption data analysis. Microporous Mesoporous Mater. 2003, 60, 1–17. [Google Scholar] [CrossRef]
  54. McGavack, J., Jr.; Patrick, W.A. The adsorption of sulfur dioxide by the gel of silicic acid. J. Am. Chem. Soc. 1920, 42, 946–978. [Google Scholar] [CrossRef] [Green Version]
  55. Cohan, L.H. Sorption Hysteresis and the Vapor Pressure of Concave Surfaces. J. Am. Chem. Soc. 1938, 60, 433–435. [Google Scholar] [CrossRef]
  56. Sing, K.S.W.; Everett, D.H.; Haul, R.A.W.; Moscou, L.; Pierotti, R.A.; Rouquerol, J.; Siemieniewska, T. Reporting Physisorption Data for Gas/Solid Systems with Special Reference to the Determination of Surface Area and Porosity (Recommendations 1984). Pure Appl. Chem. 1985, 57, 603–619. [Google Scholar] [CrossRef]
  57. Hazra, B.; Wood, D.A.; Vishal, V.; Varma, A.K.; Sakha, D.; Singh, A.K. Porosity controls and fractal disposition of organic-rich Permian shales using low-pressure adsorption techniques. Fuel 2018, 220, 837–848. [Google Scholar] [CrossRef]
  58. Yu, K.; Ju, Y.W.; Qi, Y.; Qiao, P.; Huang, C.; Zhu, H.J.; Feng, H.Y. Fractal Characteristics and Heterogeneity of the Nanopore Structure of Marine Shale in Southern North China. Minerals 2019, 9, 242. [Google Scholar] [CrossRef] [Green Version]
  59. Qi, H.; Ma, J.; Wong, P.Z. Adsorption isotherms of fractal surfaces. Colloids Surf. A 2002, 206, 401–407. [Google Scholar] [CrossRef]
  60. Yao, Y.B.; Liu, D.M.; Tang, D.Z.; Tang, S.H.; Huang, W.H. Fractal characterization of adsorption-pores of coals from North China: An investigation on CH4 adsorption capacity of coals. Int. J. Coal Geol. 2008, 73, 27–42. [Google Scholar] [CrossRef]
  61. Rigby, S.P. Predicting surface diffusivities of molecules from equilibrium adsorption isotherms. Colloids Surf. A 2005, 262, 139–149. [Google Scholar] [CrossRef]
  62. Pfeifer, P.; Wu, Y.J.; Cole, M.W.; Krim, J. Multilayer Adsorption on a Fractally Rough Surface. Phys. Rev. Lett. 1989, 62, 1997–2000. [Google Scholar] [CrossRef]
  63. Li, A.; Ding, W.L.; He, J.H.; Dai, P.; Yin, S.; Xie, F. Investigation of pore structure and fractal characteristics of organic-rich shale reservoir: A case study of Lower Cambrian Qiongzhusi formation in Malong block of eastern Yunnan Province, South China. Mar. Pet. Geol. 2016, 70, 46–57. [Google Scholar] [CrossRef]
  64. Jaroniec, M. Evaluation of the Fractal Dimension from a Single Adsorption Isotherm. Langmuir 1995, 11, 2316–2317. [Google Scholar] [CrossRef]
  65. Pfeifer, P.; Avnir, D. Chemistry in noninteger dimensions between two and three. I. Fractal theory of heterogeneous surfaces. J. Chem. Phys. 1983, 79, 3558–3565. [Google Scholar] [CrossRef]
  66. Torgerson, W.S. Multidimensional Scaling: I. Theory and Method. Psychometrika 1952, 17, 401–419. [Google Scholar] [CrossRef]
  67. Shepard, R.N. The Analysis of Proximities: Multidimensional Scaling with an Unknown Distance Function. I. Psychometrika 1962, 27, 125–140. [Google Scholar] [CrossRef]
  68. Kruskal, J.B. Multidimensional Scaling by Optimizing Goodness of Fit to a Nonmetric Hypothesis. Psychometrika 1964, 29, 1–27. [Google Scholar] [CrossRef]
  69. Mancell, S.A.; Deutsch, C.V. Multidimensional Scaling. Geostatistics Lessons. Deutsch, J.L., Ed.; 2019. Available online: http://geostatisticslessons.com/pdfs/mds.pdf (accessed on 25 December 2019).
Figure 1. (a) Location map of the Songliao Basin (modified after [41]); (b) major structural zones in the Songliao Basin (modified after [41]); (c) structural cross-section across the central part of the Songliao Basin (modified after [46]); and (d) stratigraphic histogram of Qingshankou Formation in the SK-1s well (modified after [43]) and sampling depths.
Energies 13 02027 g001
Figure 2. FE-SEM images of organic-matter pores. (a) SK1S16, mudstone; (b) SK1S16, mudstone; (c) SK1S32, mudstone; (d) SK1S16, mudstone; (e) SK1S16, mudstone; (f) SK1S38, mudstone; (g) SK1S16, mudstone; (h) SK1S32, mudstone; (i) SK1S36, mudstone; (j) SK1S36, mudstone; (k) SK1S36, mudstone; and (l) SK1S36, mudstone.
Energies 13 02027 g002
Figure 3. FE-SEM images of interparticle pores. (a) SK1S16, mudstone; (b) SK1S38, mudstone; (c) SK1S16, mudstone; (d) SK1S38, mudstone; (e) SK1S38, mudstone; and (f) SK1S38, mudstone.
Energies 13 02027 g003
Figure 4. FE-SEM images of intraparticle pores. (a) SK1S16, mudstone; (b) SK1S25, mudstone; (c) SK1S25, mudstone; (d) SK1S25, mudstone; (e) SK1S16, mudstone; and (f) SK1S36, mudstone.
Energies 13 02027 g004
Figure 5. FE-SEM images of micro-fractures. (a) SK1S36, mudstone; (b) and (c) SK1S16, mudstone.
Energies 13 02027 g005
Figure 6. Low-pressure nitrogen adsorption/desorption isotherms of studied lacustrine samples in (a) K2qn1 and (b) K2qn2,3.
Energies 13 02027 g006
Figure 7. The statistic values of pore structure parameters and fractal dimensions in K2qn1 and K2qn2,3. (a) Average pore diameter; (b) BET SSA; (c) total pore volume; (d) micropore volume; (e) mesopore volume; (f) macropore volume; (g) D1; and (h) D2.
Energies 13 02027 g007
Figure 8. The plots of lnV versus ln(ln(P0/P)) of studied lacustrine samples in (a) K2qn1 and (b) K2qn2,3.
Energies 13 02027 g008
Figure 9. (a) Correlation matrix, and (b) multidimensional scaling of multivariate pore structure parameters and fractal dimensions of studied lacustrine samples in K2qn.
Energies 13 02027 g009
Figure 10. The 3D scatter plots and the response surfaces of (a) Model 1, and (b) Model 2.
Energies 13 02027 g010
Figure 11. The 2D scatter plot of free hydrocarbon content versus fractal dimensions.
Energies 13 02027 g011
Figure 12. The statistic values of pore structure parameters and fractal dimensions in the Qingshankou Formation and Bakken Formation. (a) Average pore diameter; (b) BET SSA; (c) tota pore volume; (d) micro-mesopore volume; (e) D1; and (f) D2.
Energies 13 02027 g012
Table 1. Statistics of the regression models and the variance analysis.
ModelMultiple Correlation CoefficientCoefficient of DeterminationCoefficient of Multiple DeterminationF Statisticp-Value
10.981 0.962 0.960 459.630 < 0.001
20.949 0.901 0.895 163.618 < 0.001

