Medieval Climate in the Eastern Mediterranean: Instability and Evidence of Solar Forcing


1
Lamont-Doherty Earth Observatory, Columbia University, 61 Route 9W, Palisades, NY 10964, USA
2
Institute of Earth Sciences, The Hebrew University of Jerusalem, Givat Ram, Jerusalem, Israel
3
Geological Survey of Israel, Givat Ram, Jerusalem, Israel
*
Author to whom correspondence should be addressed.
Atmosphere 2019, 10(1), 29; https://doi.org/10.3390/atmos10010029
Submission received: 10 December 2018
/
Revised: 5 January 2019
/
Accepted: 8 January 2019
/
Published: 13 January 2019
(This article belongs to the Special Issue Climate Variabilities and Changes in the Mediterranean Basin and their Impacts on Mediterranean Societies)
Abstract
:This paper examines the hydroclimate history of the Eastern Mediterranean (EM) region during the 10th to 14th centuries C.E., a period known as the Medieval Climate Anomaly (MCA), a time of significant historical turmoil and change in the region. The study assembles several regional hydroclimatic archives, primarily the Dead Sea reconstructed lake level curve together with the recently extracted deep-lake sediment record, the Soreq Cave speleothem record and its counterpart, the EM marine sediment record and the Cairo Nilometer record of annual maximum summer flood levels in lower Egypt. The Dead Sea record is a primary indicator of the intensity of the EM cold-season storm activity while the Nilometer reflects the intensity of the late summer monsoon rains over Ethiopia. These two climate systems control the annual rainfall amounts and water availability in the two regional breadbaskets of old, in Mesopotamia and Egypt. The paleoclimate archives portray a variable MCA in both the Levant and the Ethiopian Highlands with an overall dry, early-medieval climate that turned wetter in the 12th century C.E. However, the paleoclimatic records are markedly punctuated by episodes of extreme aridity. In particular, the Dead Sea displays extreme low lake levels and significant salt deposits starting as early as the 9th century C.E. and ending in the late 11th century. The Nile summer flood levels were particularly low during the 10th and 11th centuries, as is also recorded in a large number of historical chronicles that described a large cluster of droughts that led to dire human strife associated with famine, pestilence and conflict. During that time droughts and cold spells also affected the northeastern Middle East, in Persia and Mesopotamia. Seeking an explanation for the pronounced aridity and human consequences across the entire EM, we note that the 10th–11th century events coincide with the medieval Oort Grand Solar Minimum, which came at the height of an interval of relatively high solar irradiance. Bringing together other tropical and Northern Hemisphere paleoclimatic evidence, we argue for the role of long-term variations in solar irradiance in shaping the early MCA in the EM and highlight their relevance to the present and near-term future.
1. Introduction
The Eastern Mediterranean region (EM), which is centered in the Levantine Sea Basin, is surrounded by the land areas of the Anatolian peninsulas to the north, the Middle East, including the Levant, Arabian Peninsula, Iraq (ancient Mesopotamia) and Iran to the east and the eastern part of coastal North Africa to the south. In terms of its climate, the EM comprises a transition zone from the broad arid desert climate of North Africa and the Middle East, to the temperate and relatively wet regions of southeastern Europe. Southern Turkey to the north and a narrow coastal strip in the Levant and Egypt, enjoys a relatively mild climate with wet and cool winters and warm to sultry, rainless summers. Here, we focus on the hydroclimatic history of this region, in particular the Middle East and Egypt, during the early part of the last millennium—the time interval known as the Medieval Climate Anomaly (MCA) that extended from about 950 to 1300 C.E.
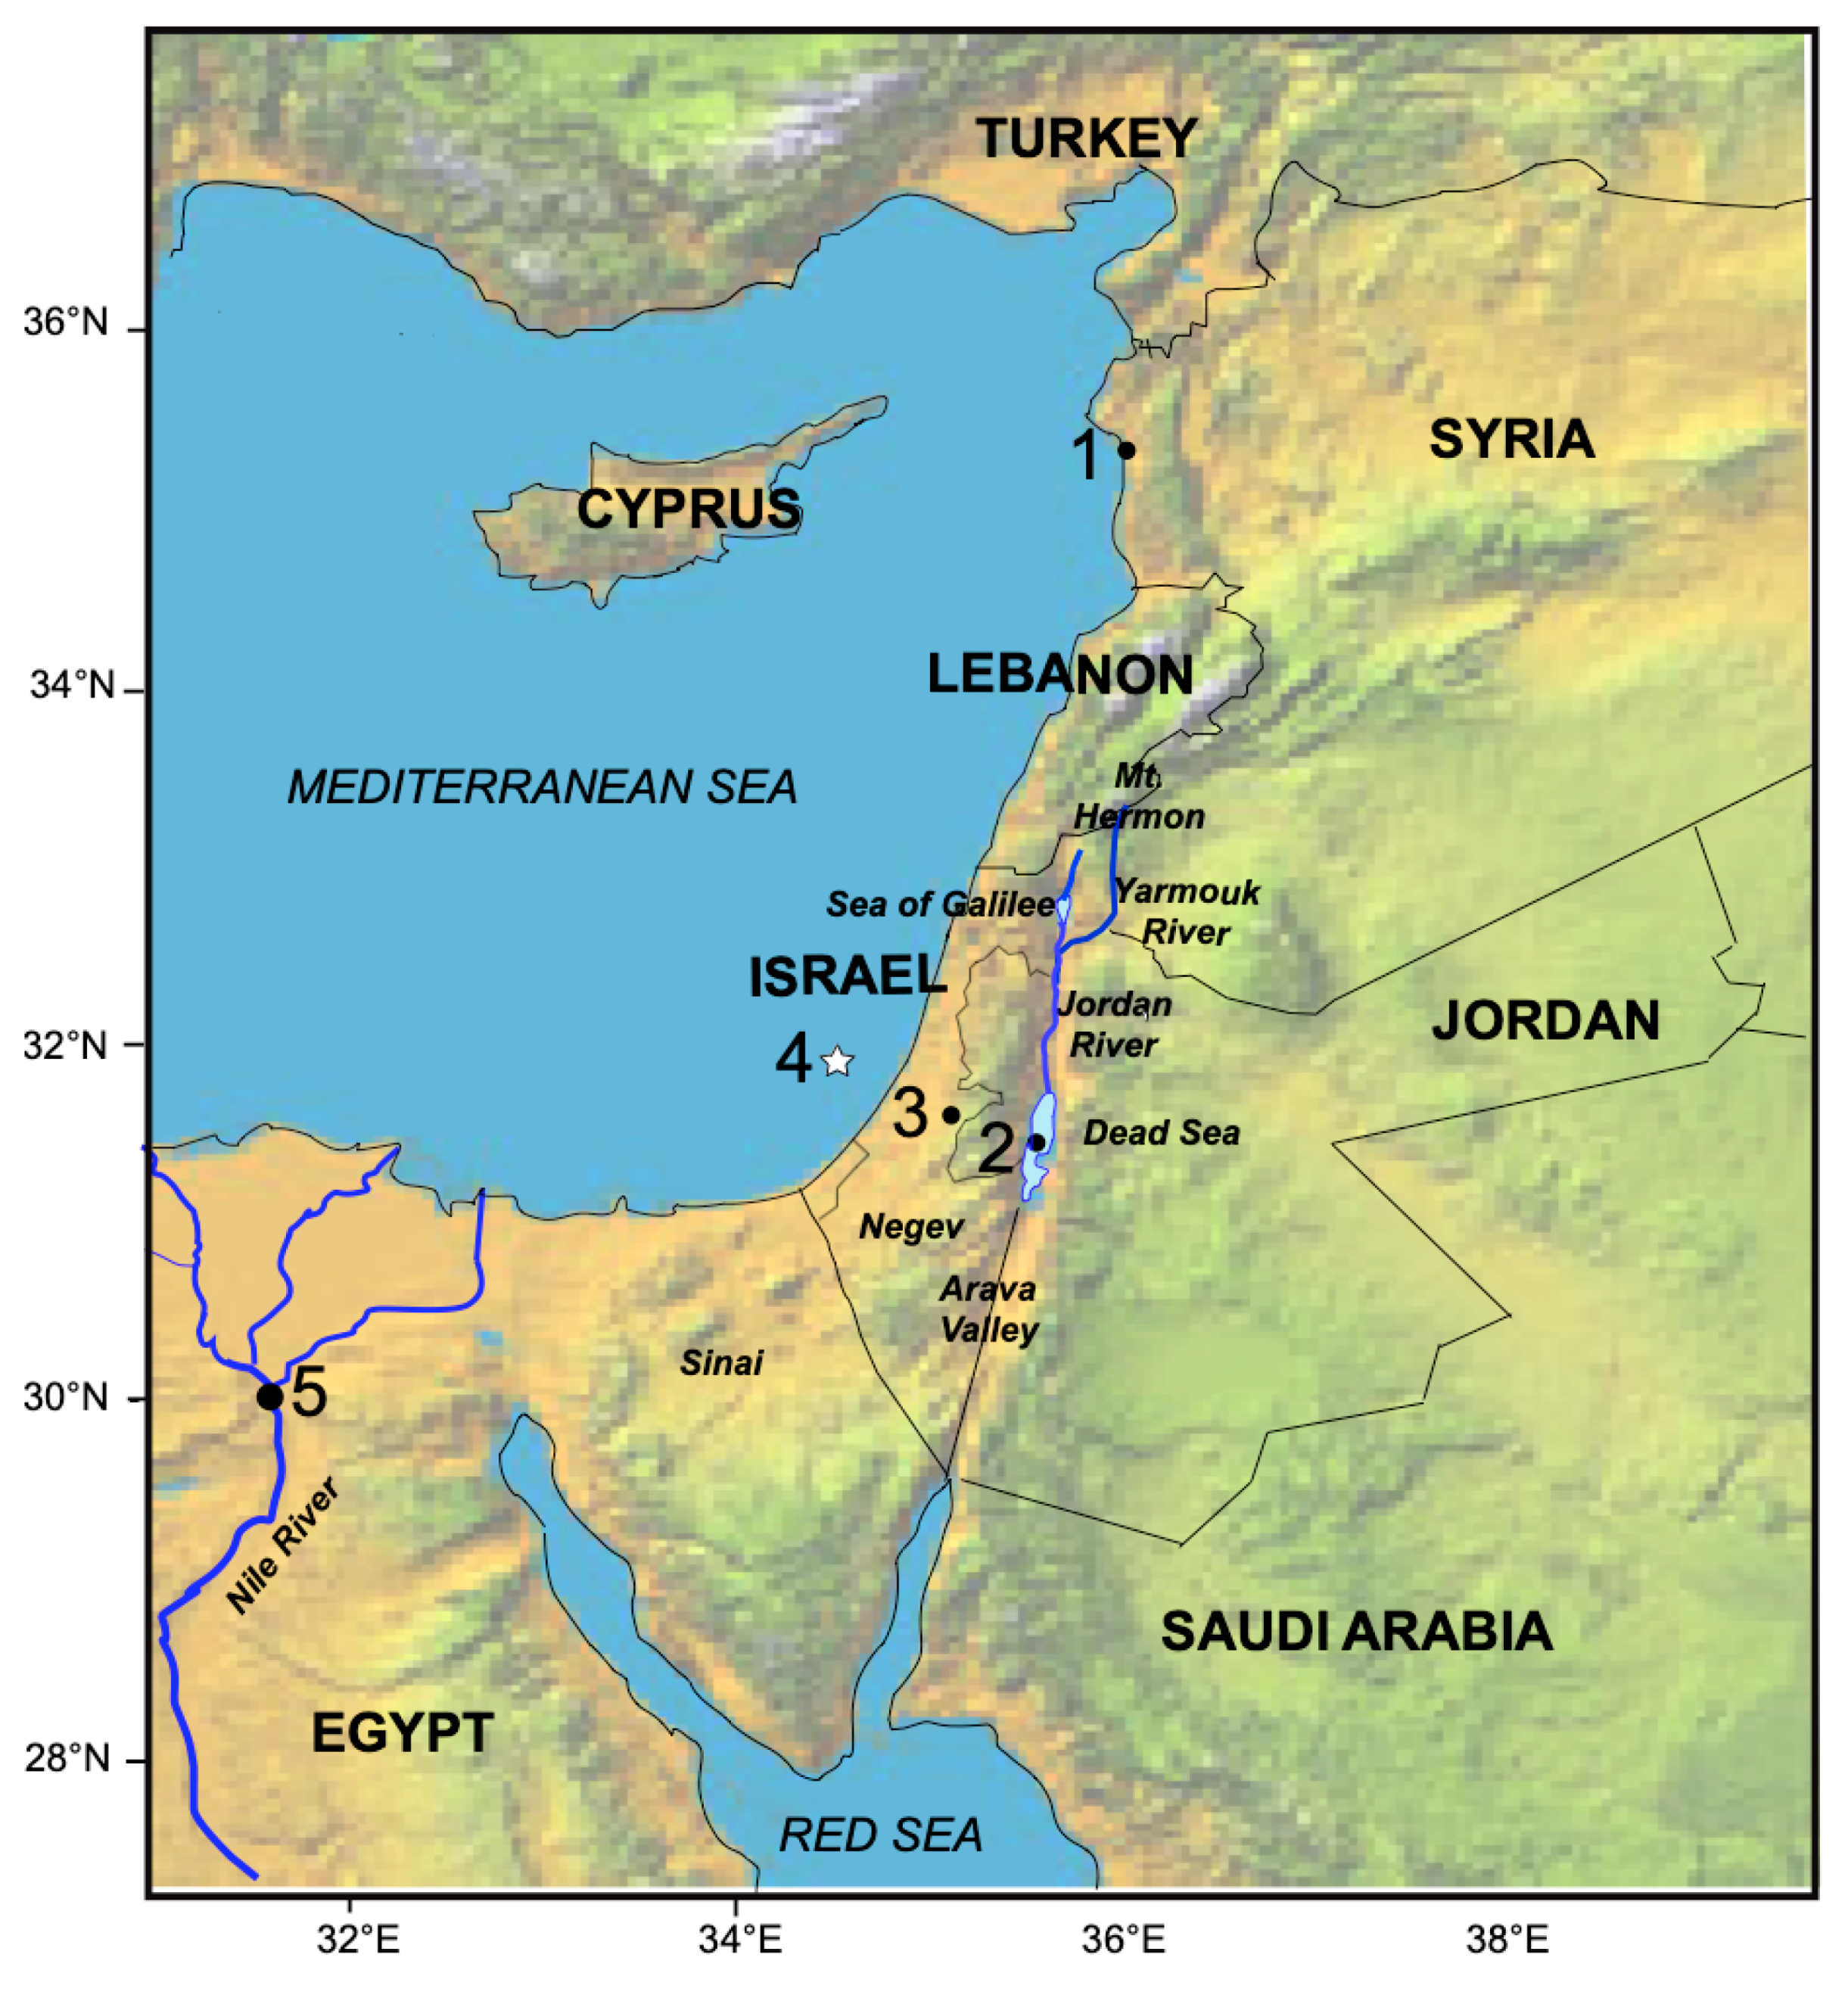
Historically known as the cradle of civilization, the countries of the Middle East and Egypt endured at the edge of the Sahara-Arabia desert belt by painstakingly harvesting moderate to sparse winter rainfall amounts and scarce ground and underground water sources. Importantly, the EM human narrative has been linked with the hydroclimatic history of its two large river systems: the Tigris and Euphrates Rivers to the north and the Nile River in eastern North Africa. These large rivers carry water from rainfall rich areas in the Anatolian and Ethiopian highland, respectively, to nourish the thriving breadbaskets of Mesopotamia and Egypt [1,2]. The Levant, which is presently occupied by Syria, Lebanon, Jordan, Israel and the Palestinian Authority, has historically been fed by rivers draining a range of coastal mountains stretching north-to-south parallel to the region’s geomorphic valley that extends from northern Syria to the Red Sea. Within the south Levant segment of this valley runs the Jordan River that drains the watersheds of Mt. Hermon and the Golan Heights in northern Israel and flows into the Dead Sea (Figure 1).
The occurrence of droughts in the Levant has particular historical and current significance [11,12]. Coupled general circulation models predict that with the continuing rise in atmospheric greenhouse gas (GHG) concentrations and the associated warming of the planet, the EM will progressively become more arid together with the rest of the Mediterranean Basin [13,14,15,16]. While GHG-forced drying evolved slowly compared to year-to-year natural variability, there are signs that the century-long anthropogenic precipitation trend has already affected the likelihood of severe multi-year drought events in the Levant [14,17]. Droughts, particularly multi-year ones, directly impact the people who make their living on rain-fed agriculture. They also affect the overall health and security of the region’s rapidly growing population, which has been increasingly concentrated in the region’s urban centers [18,19,20]. The future of the East Mediterranean will inevitably be determined by a combination of anthropogenic and natural climate processes [15]. Thus, it is important to explore the range of possible climatic phenomena and mechanisms leading to hydrological variability and change in the region. Here, we focus on the hydroclimate conditions during the MCA period.
The MCA is known as a time of frequent and long-lasting droughts in subtropical areas [21,22,23] and thus appears to be a suitable time interval for examining the patterns and climate drivers of EM droughts. However, the degree to which the MCA was a time interval of coherent and globally uniform unique climate, has been recently challenged [24]. The implications of these recent finding for the EM are therefore interesting and important. Information on the MCA in the EM is scant and often inconsistent. These inconsistencies may stem from the heterogeneity of climate variability in the region but the main factor is the region’s limited number of period paleo-climatic records. Moreover, most of the existing evidence offers only coarse temporal resolution, suitable for the study of multi-decadal to centennial time scales to which in most cases there is an added impediment imposed by the 25 to 50-year temporal uncertainty that is associated with 14C dating. These factors interfere with the matching of different records when trying to map the pattern of the period’s climate. To understand the period investigators pull together information from various sources [22] and even historical period documents, in the latter case with the intention of linking the climatic history to human resilience and societal change [11,17,25,26,27,28,29,30]. These studies and others, show that during the MCA, EM hydroclimate variability was large, fluctuating from significantly dry states to relatively wet ones, thus indicating a climatically uneven period.
This paper brings together existing evidence from different paleoclimatic sources and historical documentary evidence that cover the MCA in the EM. We examine the consistency between these records in order to determine the main features of the period climate and its variability and understand their cause and global connections. The results of this effort constitute a new understanding of the MCA in the EM and its broader surroundings. As it turns out, the EM climate of the early MCA was significantly drier than the second half of the period. The severity of the early MCA climate is attested by key EM paleoclimate archives and is consistent with the narrative emerging from well-dated historical accounts that describe frequent and unusual climatic events over the entire region—from Egypt in the southwest to present-day Iraq and Iran in the northeast. This paper furthermore seeks a physical explanation for the cause of this period of extreme climate and suggests that it is consistent with and most likely caused by an extended time interval of low solar irradiance, namely the Oort Grand Solar Minimum.
The paper begins with a brief survey of present-day climatic setting of the EM in Section 2, followed by a discussion of the paleoclimatic evidence from the region in Section 3. Section 4 proposes a physical explanation for the particular adverse climate of the early medieval during the 10th and 11th centuries C.E. and discusses the relevance of this period’s climate to the present. A summary and conclusions follow in Section 5.
2. Climatic Setting of the Southeastern EM
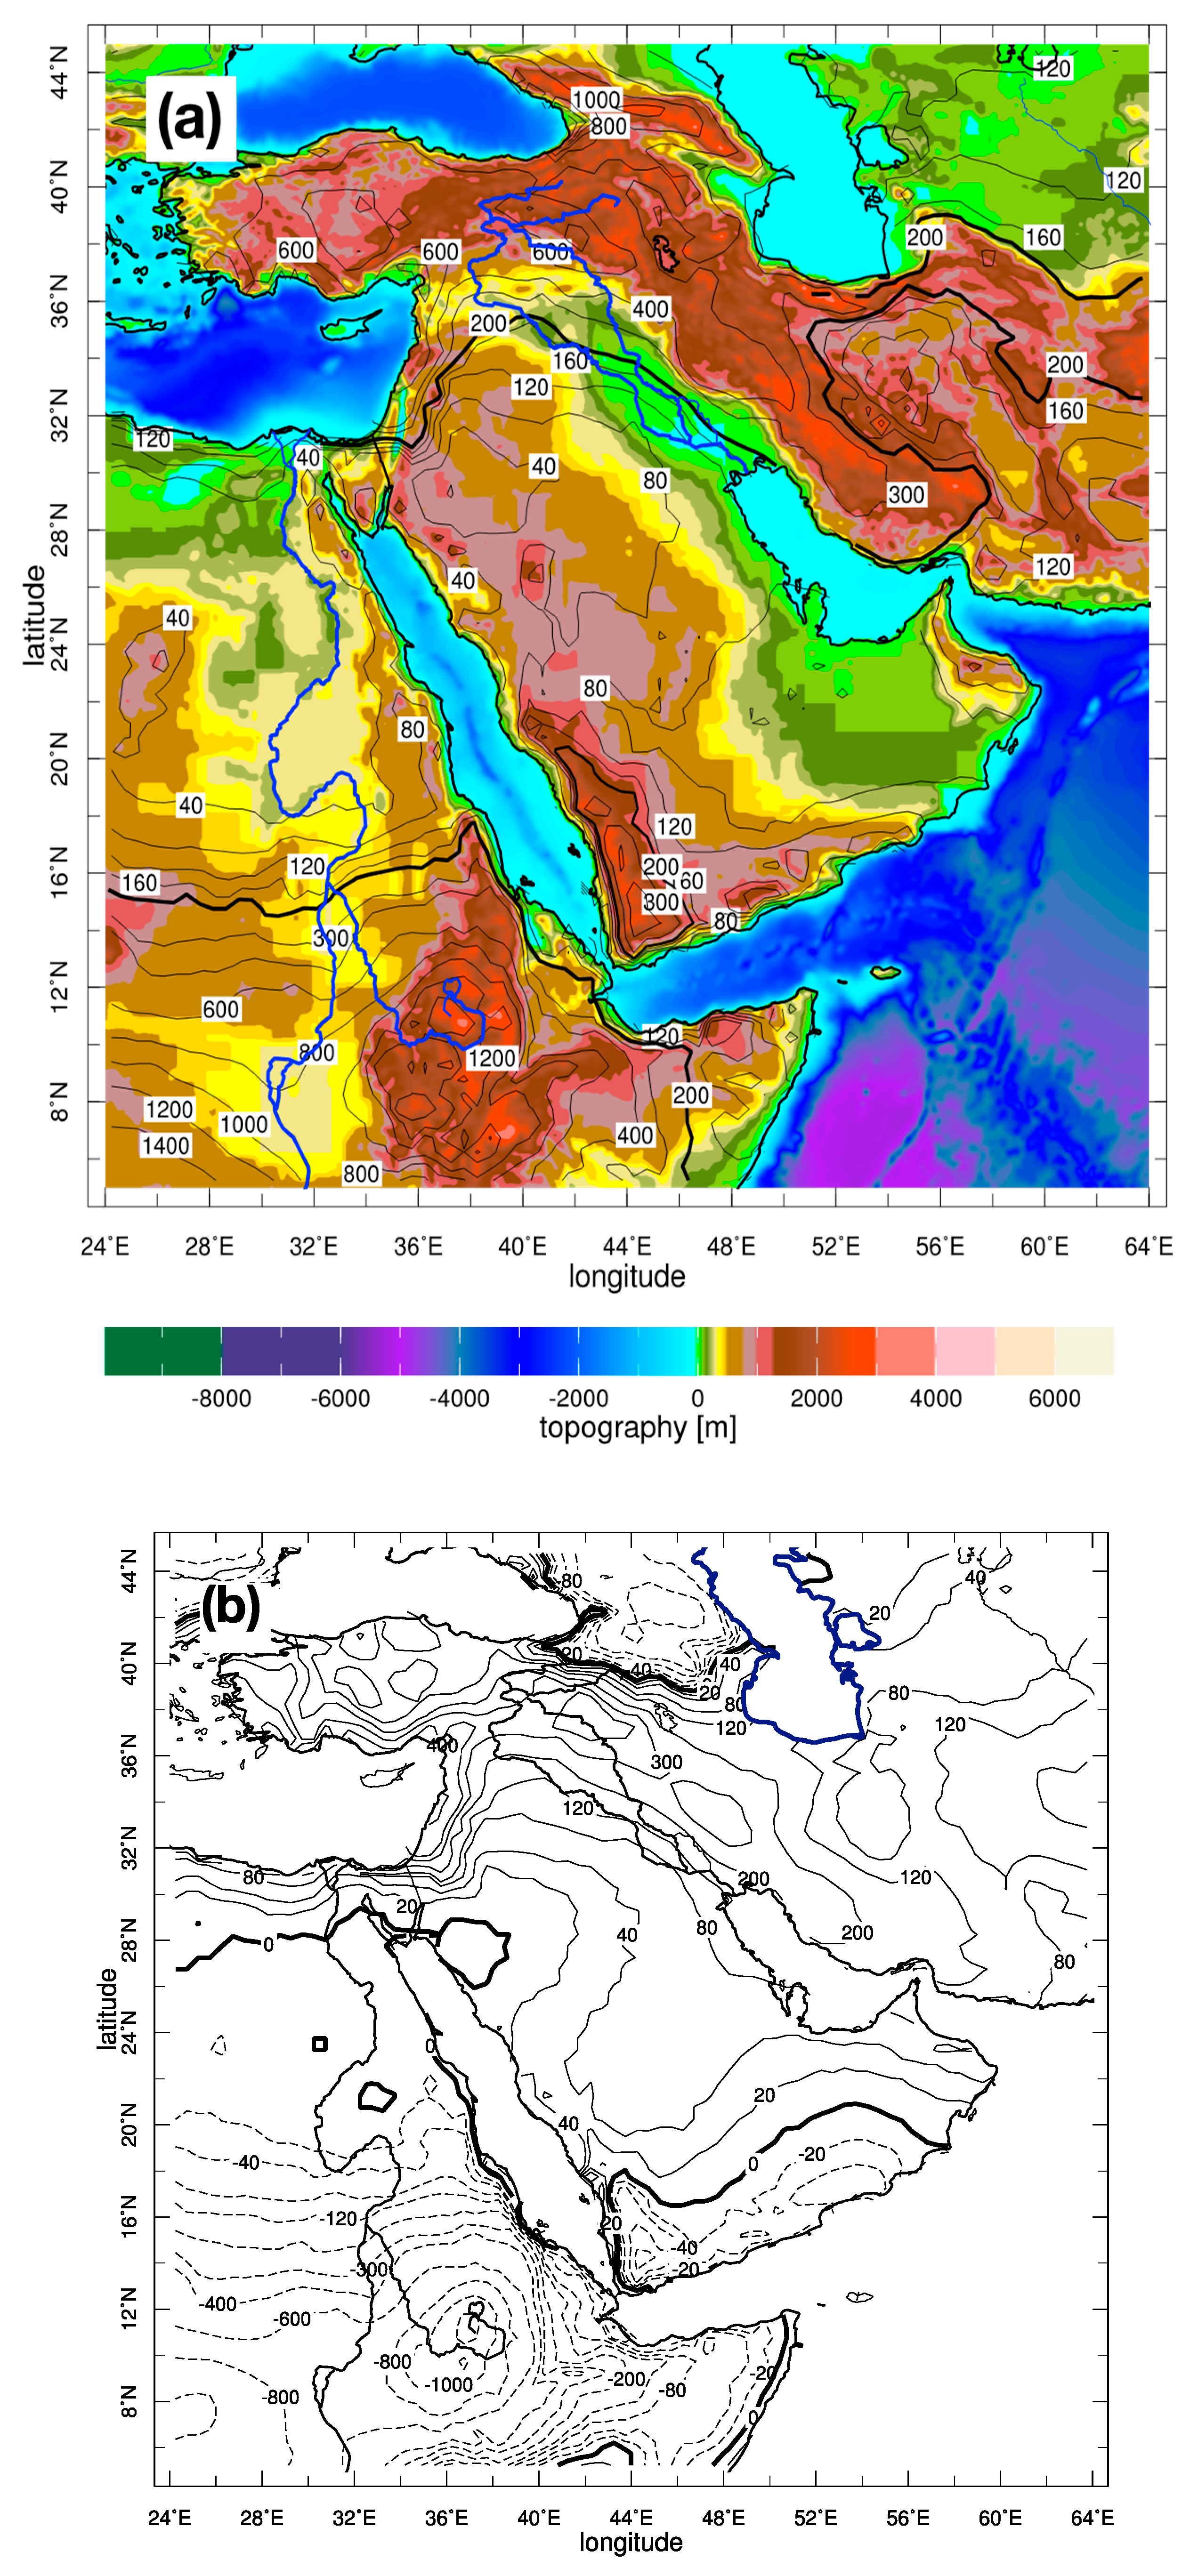
The southeastern EM experiences a wide range of climatic conditions, shaped by the vicinity to the Mediterranean at the edge of the African-Arabian desert belt and by the topography (Figure 2a). Currently, mild and rainy winters and hot and humid summers prevail along the southeastern Mediterranean coastal plains and the nearby mountains. To the north the Taurus, Elburz and Zagros mountain chains, which form a crescent shaped zone, also receive sufficiently large rainfall amount. However, inland and over much of Egypt, the Arabian Peninsula and eastern Syria and Iraq, arid-to-hyper arid conditions prevail [16,31,32].
In the Levant and the rest of the Middle East the rainy season extends from October to April (Figure 2b). These rains are delivered by cyclonic storms that form over the Mediterranean Sea and travel east, carrying Mediterranean moisture to precipitate over the land [33,34,35]. In the Nile Valley, in East Africa and over the southern Arabian Peninsula, rainfall is a summer phenomenon, associated with the African summer monsoon eastern extension (Figure 2). The monsoonal rains that fall on the Ethiopian Highlands feed the Nile summer floods that have been used to water Egypt’s summer crops since the dawn of civilization [8,9,26,36].
The EM cold-season climate is subject to interannual and longer variations governed by small- and large-scale atmospheric systems affected by local and remote conditions [33,35,37]. Some of these systems exhibit multi-year trends and variations. A particular example of the latter is the North Atlantic Oscillation (NAO) phenomenon. This is the name given to the synchronous variations in the strength of the two dominant winter pressure system in the North Atlantic, the Icelandic Low and the Azores High [38]. The NAO variability is considered to be chaotic, associated with the internal large-scale turbulent dynamics of the winter Northern Hemisphere atmosphere. However, during the second half of the 20th century, the NAO displayed a prolonged positive trend, superimposed by decadal variations. Beginning in the mid 1960s, this trend lead to progressively drier winters in the Mediterranean northern-rim countries until it abated in the mid-1990s [15]. In the southeastern EM however, in the southern Levan and coastal North Africa, a positive NAO is generally linked with an increase in wintertime precipitation and a negative NAO with reduced winter rainfall [15,35].
Variations in East African monsoon rainfall, in the region that affects the flow of the Nile, are known to occur in response to large-scale, tropical, ocean-atmosphere interactions, particularly the El Niño/Southern Oscillation phenomenon and decadal and longer changes in sea surface temperatures (SSTs) in the North Atlantic Ocean [39,40,41]. An anti-phase relationship between the long-term variability of southern Levant cold-season precipitation and summer rainfall in the Sahel, was demonstrated by Kushnir and Stein [42]. They showed that during the past ~150 years, decadal and longer variations in wintertime precipitation in Jerusalem has been negatively correlated with summer monsoon rainfall in the North African Sahel region. Kushnir and Stein also showed that this anti-phase relationship was present during the entire Holocene. For that they compared centennial and millennial variations in sub-Saharan lake levels with variations in the level of the Dead Sea, which is considered a reliable indicator of cold season rainfall in the Levant. This Sahel-Levant anti-phase hydroclimatic relationship was linked by Kushnir and Stein to long-term SST variations in the North Atlantic Ocean, a phenomenon referred to as the Atlantic Multidecadal Oscillation (AMO) [43,44]. Whereas a cold North Atlantic is associated with droughts in the Sahel it tends to lead to wet Levant winters and vice-versa.
Kushnir and Stein [42] also discussed rare and abrupt Holocene events during which droughts in the Levant occur in-phase with droughts in the Sahel. These events occurred in phase with extreme cooling events in the North Atlantic and the Northern Hemisphere [45,46]. We shall point out later in this manuscript to an early MCA event that is reminiscent of these Holocene abrupt cooling events.
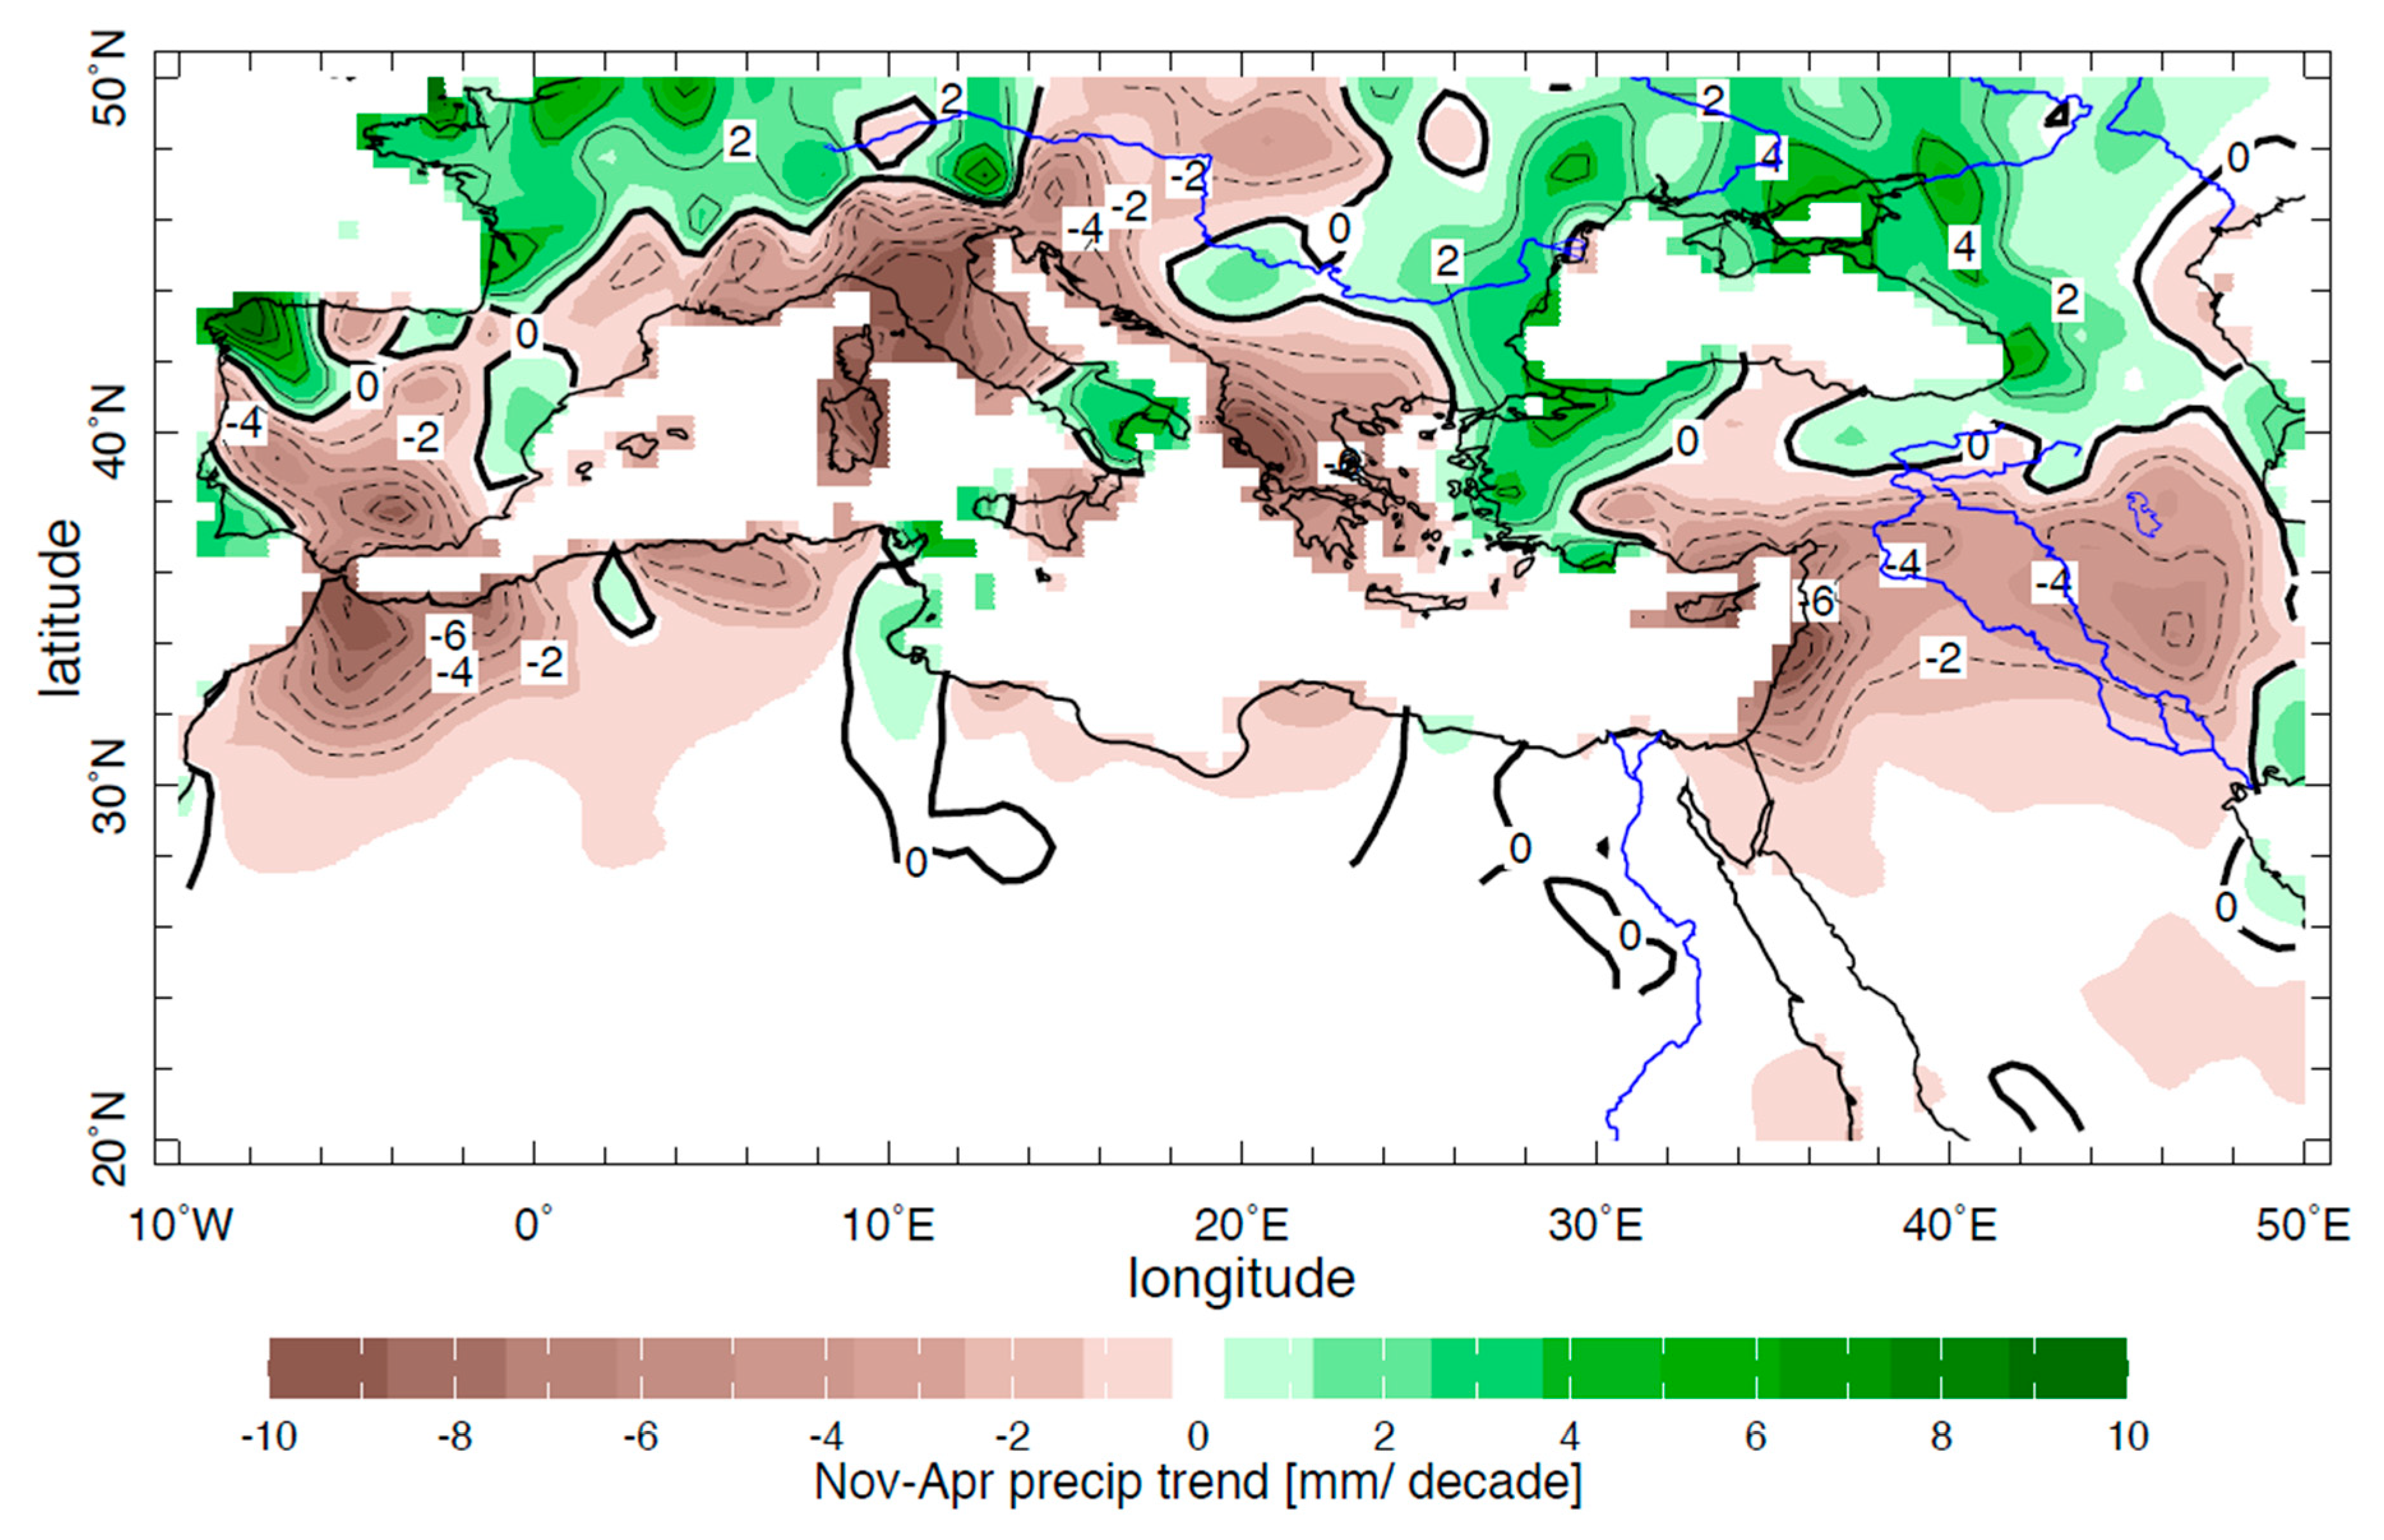
As indicated in the Introduction, anthropogenic climate change is expected to strongly affect the Mediterranean Basin, particularly in the eastern sector. Figure 3 shows the 20th century trend in Mediterranean cold season precipitation due to the increase in GHG concentrations. The trend pattern was derived following the method described in Kelley et al. [15] and explained briefly in the figure caption. It demonstrates the relative severity of anthropogenic forcing in the EM land areas. It is reasonable to expect that during future increases in GHG concentrations this drying trend will continue to affect the region’s rainfall in a similar way. However, as Kelley et al. demonstrated, the Mediterranean was also affected by natural NAO variations and these can exacerbate or alleviate the adverse impact of anthropogenic forcing. The combination of anthropogenic climate change and natural, short-term climate variability also led to the recent severe drought in Middle East Fertile Crescent [18]. It is the concern for future occurrences of similar negative (or conversely, positive) impacts of natural climate variability, particularly such that extend over multiple years, that motivates the present study. Climatologists often turn to the pre-industrial period, which was unperturbed by anthropogenic influences, to study natural climate variations that can exert a long-term impact on the climate and humans. As described below, we find such a relevant example in the early medieval period.
3. EM climate during the MCA
3.1. The Levant
An important indicator for past hydroclimate variability in the EM during the Holocene is the reconstructed Dead Sea level curve [27,47]. The Dead Sea (Figure 1) is an hypersaline, terminal lake, which collects rainfall from a large watershed that extends from Mt. Hermon in the north to the vicinity of the Gulf of Aqaba in the south [48]. The lake records the time-integrated balance between precipitation and evaporation from the watershed and the lake surface. As indicated above (Section 2) the input to the lake is due primarily to cold-season Mediterranean cyclones [31,33,35]. The precipitation from these weather systems is collected primarily over the Hermon mountain watershed and flows to the Dead Sea in the Jordan River and its main tributary, the Yarmouk River (which forms a natural border between Syria and Jordan). However, the lake also receives rainfall generated by generally less frequent southern systems that precipitate over the southern part of its watershed. These systems draw part of their moisture from the tropical sources [33,49,50]. The lake levels during the last several millennia were reconstructed from surveys at several coastal sites, through sedimentary identification of shore deposits and radiocarbon dating based on terrestrial organic debris recovered from the studied sedimentary sections [27,47]. Following Migowski’s reconstructed lake level curve (replicated here in Figure 4a), we find that the lake attained peak levels of 380–390 m below mean sea level (bmsl) around 1400 years BP (550 C.E., with a 1σ error of 50 years) and then fell precipitously to a low of ~412 m bmsl between the 8th and 11th centuries C.E. The sharp drop in lake levels is indicative of an overall very dry interval in the southern Levant. The lake rose again to a height of ~400 m bmsl during the 13th–14th centuries, indicating the resumption of a wetter climate regime with more precipitation in the southern Levant during the second half of the MCA. During the rest of the millennium the lake continued to fluctuate between low levels of ~403 m bmsl, in the 16th century and a peak level of 392 m bmsl in the early decades of the 20th century. Dead Sea levels declined again to ~400 m bmsl between ~1920 and ~1960, which were years of relatively dry winters in the Levant [42,48]. Since the damming of the Jordan River at the southern end of the Sea of Galilee and the diversion of the Yarmouk River, all in the mid to late 1960s, the lake has experienced a continual sever level drop. The recent lake decline facilitated a re-assessment of its Common Era levels. A survey of the recently exposed coastal site at Ein Kedem, a saline hot water spring flowing into the lake, determined that the lake fell to ~420 m bmsl during the 11th century [51], emphasizing the severity of the early-medieval, southern Levant drought.
In 2010–2011 a 450 m long sediment core was drilled by the International Continental Scientific Drilling Program (ICDP) from the floor of the Dead Sea at a depth of about 300 m below the lake surface (Figure A1 and see [4]). The core comprises sequences of “muds” (mostly primary aragonite and fine detritus material) that were deposited during wet intervals, and salts (halites) that were deposited during hyper-arid periods in the lake’s watershed [5]. We emphasize that the salt is possibly the best indicator for extremely arid conditions in the lake watershed and its deposition is associated with a sharp decline in the lake level [52]. The chronology of the core was established by U-Th and radiocarbon methods [53,54]. The radiocarbon dating of the Holocene segment revealed that a prominent salt unit was deposited between ~800 and ~1100 C.E. (Figure A1). The salt age coincides with that of the low lake stand that was independently dated at the Dead Sea shores by the combined works of Bookman et al. [47], Migowski et al. [27] and Stern [51] described in the previous paragraph (Figure 4a). Thus, we conclude that according to the Dead Sea level and bottom sediment records and within the accuracy of 14C dating, the Levant climate in early medieval, from the 9th to the end of the 11th century was characterized by arid conditions and that during the 12th century a change in the MCA climate brought wetter conditions to the region.
Indication of EM climate instability during the MCA can also be gleaned from a marine sediment core retrieved close to the coast of Israel ([Figure 1 and see [56]). During the middle of the first millennium CE the marine record (Figure 4b) displays a transition from low oxygen isotope ratios, that is, a negative δ18O value, of −0.3‰ according to the Vienna Pee Dee Belemnite (VPDB) standard, around 1300 years BP (~650 C.E., with a 1σ error of 60 years), to a high positive value of +0.3‰ VPDB, around 950 years BP (1000 C.E., with a 1σ error of ~70 years). Around 750 years BP (1200 C.E. ± 60 years) the smoothed δ18O curve indicates a relatively low value of ~1‰ VPDB and then a gradual increase to 6‰ VPDB around 300 years BP (1650 C.E.). Speleothems from the Soreq Cave in central Israel (Figure 1 and see [6]) follow a similar path during the same 1300-year interval, where the maxima and minima speleothem δ18O values match in the timing and phase with the variation found in the marine core (Figure 4b and [7]).
The interpretation of the speleothem record in Figure 12 of [6] is that low δ18O values imply a wetter than normal climate while high values imply a dryer climate. We note however, that the low δ18O values also correspond to a situation where fresher and warmer sea surface waters are present in the vapor source area in the EM [57]. Taking into consideration the uncertainty associated with 14C dating, we find the combined marine-speleothem record is consistent with the Dead Sea Level record in Figure 4a. It also suggests that in the southern Levant, the early MCA was a period of relatively dry and cold winters and the late MCA was wet and relatively warm. As we saw in the Dead Sea level record, the speleothem and marine core indicate that the middle of first millennium CE (matching the Byzantine era in the Levant) witnessed a 1–2 century-long interval that was considerably wetter than the entire MCA.
Kaniewski et al. [3] analyzed a sediment core extracted from alluvial deposits close to the coast of northern Syria in Jableh, located near the city of Latakia (Figure 1). Their pollen analysis extended back to the beginning of the 10th century and indicates a dry climate during the early medieval, between 900 C.E. and the early 11th century. After this, the record indicated a shift to a wetter climate that extended until the beginning of the 13th century when the climate turned dryer again. The pattern depicted by the pollen analysis (not shown here but see Figure 5 in reference [3]) is consistent with the Dead Sea record and the marine and speleothem δ18O records discussed above. All these Levant records thus indicate that the EM MCA displayed two different climate regimes: a dry early period that transitioned, relatively abruptly, to a wet interval during the second half of the MCA. The dry MCA interval began as early as 1200 years BP, in the 8th century, reached its driest state during the 11th century and ended around the end of the 11th century or early in the 12th century C.E. We note that the time of transition from the dry to the wet state cannot be determined accurately because of the 14C dating error that measures several decades.
3.2. The Nile Valley
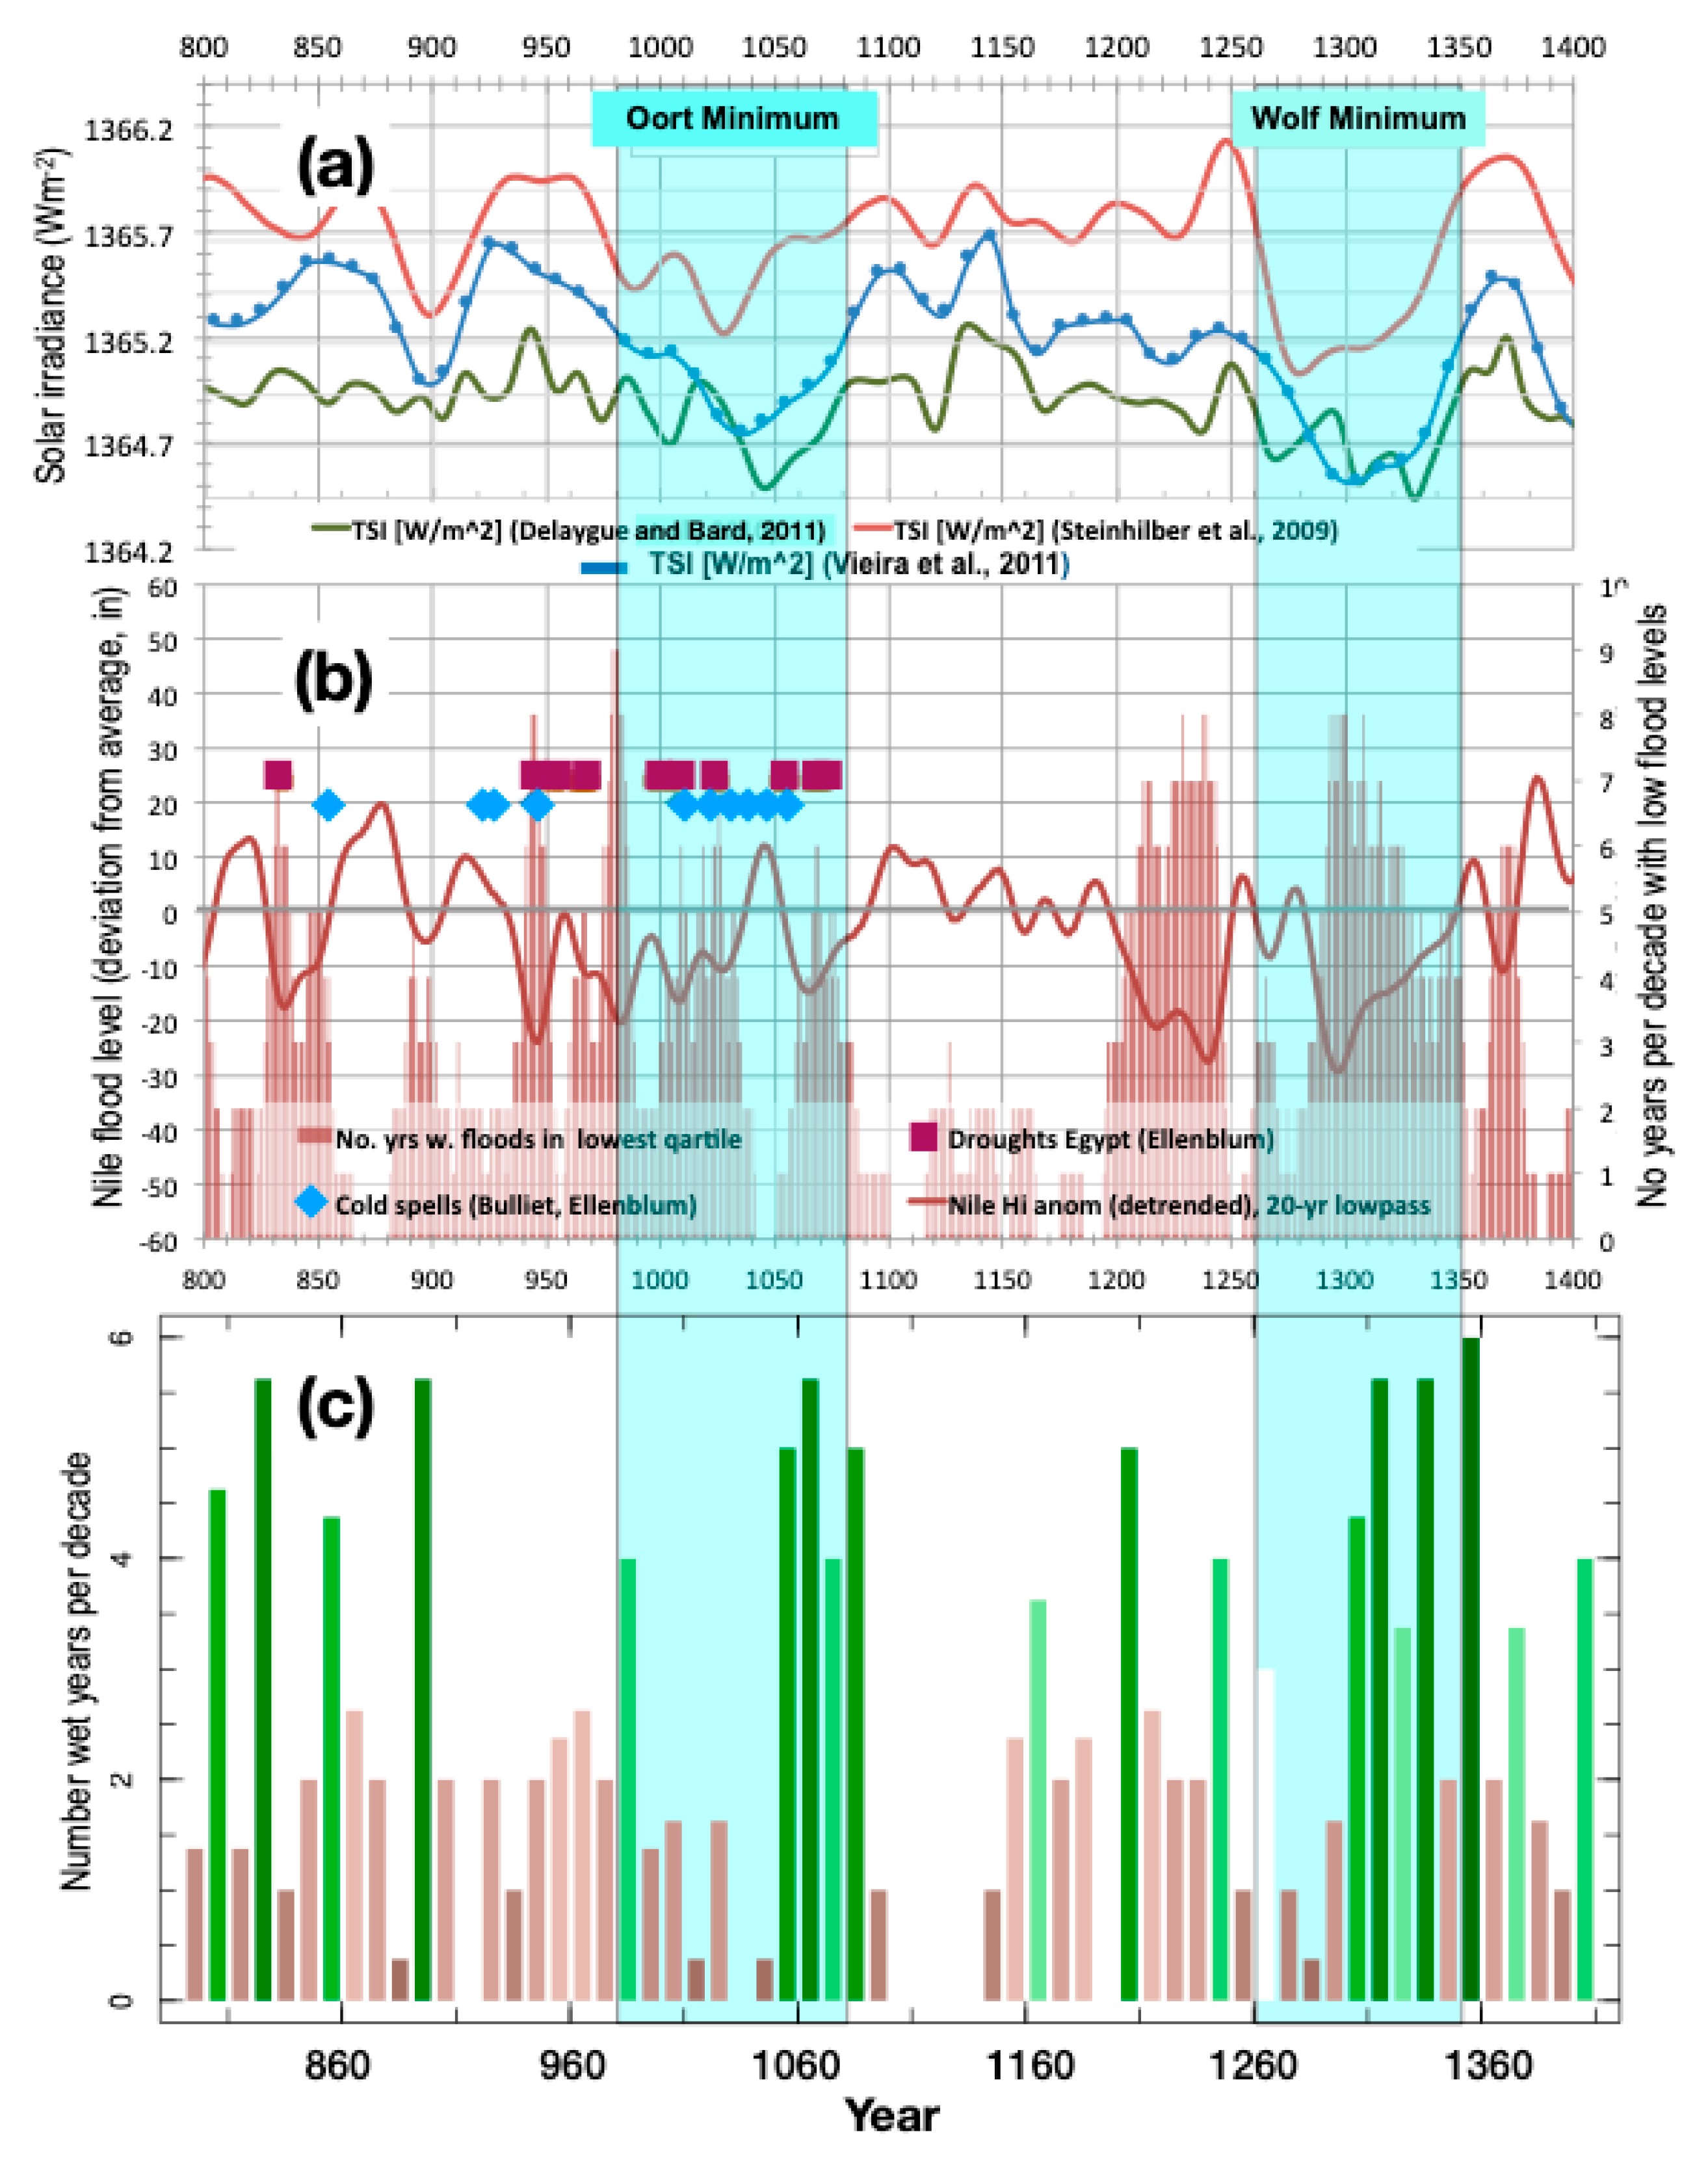
The importance of the Nile to Egypt’s livelihood dictated regular monitoring of the Nile level during the summer flood season. Nile record-keeping was based on measurements taken with gauges, usually level-marked columns planted in the river bed, referred to as Nilometers [8,9,26,58,59]. A historical archive of twice-annual measurements, taken at the beginning and peak of the summer flood season, was consistently recorded at the Nilometer of Roda Island in Cairo (Figure 1) from the 7th to the 16th century C.E. and less regularly afterwards [60]. The record survived in excellent form due to the efforts of Toussoun [61] and was made suitable for climate studies largely due to the meticulous work of Popper [8]. Popper, a Berkeley University, Semitic Language scholar, carefully scrutinized the historical record converting the Arabic lunar calendar years into their Gregorian solar calendar equivalence. He also compared and consolidated three sources of data in the original record and offered a way to detrend the record to account for the gradual accumulation of river-carried sediments in the riverbed. These cleaned up data served as a basis for many recent climatological studies [9,58,60,62]. At this point, we refer to the extensive work done by Hassan [26,59] who studied the River’s record in the Common Era and its drivers and the influence of the flood variability on society. Hassan pointed out that during the MCA the River displayed extremely low flood levels between 930 and 1070 C.E. and between 1180 and 1350 C.E. High flood levels were observed during 1070–1180 and 1350–1470. The MCA Nile flood levels record at the Cairo, Roda Island Nilometer are shown here in Figure 5b. We chose to present a low-pass version of the record by filtering the annual flood values so as to retain variations with a period of 20 years and longer. Also shown in this Figure 5b is a bar diagram representing the number of low-flood events in a running 11-year window. The latter is, as expected, in agreement with the smooth continuous curve of decadal flood variability.
An additional source of information of the EM MCA comes from the mining of period chronicles for evidence of climate-related human experiences. Documentary evidence can yield rich and temporally precise content and add a valuable human perspective to the often sparse and less precisely dated geological record [67,68]. Such sources of information also provide direct evidence of the impact of the climate on humans and the environment. This sort of information, specific to medieval Egypt, was presented and interpreted in the studies of Hassan [26,59] and in a recent historical treatise by Ellenblum [28]. Scanning period chronicles between 800 and 1100 C.E., Ellenblum found only sporadic documentary evidence for Nile Valley droughts before ~950. However, after 950, a cluster of severe droughts, which continued until the mid 11th century hit the region, landing debilitating blows to the population of Egypt. As Hassan and Ellenblum describe in detail, the historical accounts tell about drought and famine that caused mass starvation and plague in several occasions. The extensive suffering led to civic unrest and a change of regime in Egypt. These droughts were directly related to the failure of the Nile summer floods, as can be seen in Figure 5b, where the timing of corresponding 10th and 11th centuries historical accounts of drought is marked according to the event year above the continuous Nile flood record. The contrast between the rarity of drought events from the early 9th to the mid-10th century and the drought clusters during the following century and a half, suggest the influence of a connection to a global climatic cause. It should be added that according to the historical accounts, the most devastating drought cluster occurred between the late 1020s and the mid 1050s. The climatic significance of this time interval will be discussed further below. Ellenblum also reports that during this interval, droughts were also reported in the Levant consistent with the Dead Sea level record discussed above.
3.3. The northeastern Middle East: Iraq and Iran
In a different historical analysis, Bulliet [29], argued based on documentary evidence that the northeastern regions of the Middle East of present-day Iran and Iraq, experienced recurrent episodes of extremely cold and dry winters during the late 10th and 11th centuries. These unusual cold spells (marked by blue diamonds in Figure 5b) occurred during the time when droughts frequented the Nile Valley and spread into the Levant. These cold events also led to widespread food scarcity and hunger in the northern lands [28,29]. According to Bulliet, the cold-dry winters of the 10th to 11th centuries extended northward into Khurasan and the steps of Turkmenistan, between the Caspian Sea and Lake Aral, hitting the grazing pastures of these central Asian regions and driving the local pastoralist tribes off the steps and into the Middle East in search for more fertile warmer environment. The close association between the timing of waves of Turkman and Seljuk invasions from Khurasan and the timing of historical accounts of cold winters, gives strong support to the idea of a climate driven “Domino Effect” proposed by Ellenblum [28]. As described in Bulliet’s book, and re-told and graphically mapped by Ellenblum, these pastoralist invasions put the Turkmen tribes in direct violent conflict with the people of the northern Middle East, in Iran and Mesopotamia, leading to political instability and eventually to a political and religious transformation of the entire Middle East region in the 11th century [28,29].
Paleoclimate proxy evidence that supports the historical accounts of cold and dry conditions in the Middle East and Central Asia during the early MCA, comes from [7] described above and from the analysis of pollen records derived from sediment cores drilled in the Dead Sea [69] and in northwest Aral Sea, north of Turkmenistan [70]. The Litt et al. [69] pollen analysis indicates a significant drop in temperature in the Dead Sea watershed between ~900 and 1100 C.E. during an arid period. Sorrel et al. [70], point out that cold and dry conditions existed in the region surrounding the Aral Sea between the early 10th and mid-12th century AD (identified in their paper as the P3 interval). Additional support for the occurrence of unusually cold EM comes from the comprehensive study of the MCA in Byzantium by Xoplaki et al. [71]. That study includes numerous references to unusually cold waves during the 11th century. In particular, they indicate that: “Taken together, the paleoclimate records show evidence for rather stable and wet climatic conditions between AD 900 and AD 1100 … and likely a series of cold winters between AD 1000 and AD 1100… [71]. Based on geological and documentary evidence, Xoplaki et al. further argue that after 1100 C.E., the climate in Anatolia became drier to the extent that agricultural production in Byzantium declined markedly. Byzantium’s declined at that time was exacerbated due to repeated invasions of Turkman and Seljuk tribes from the east (see also [28]). Notably, the hydrological shift in Anatolia, from a relatively wet interval before 1100 to a dry interval after, is in antiphase to the similarly timed shift in the Levant. As we shall point again below, this antiphase between Anatolian and the Levant hydroclimate is consistent with the NAO impact on the EM, discussed in Section 2 above and suggests that this Atlantic-centered pattern of variability played a role in the EM climate transitions during the MCA.
3.4. Summary of Evidence
Together, paleoclimate proxies from different sources (and with different temporal resolutions), as well as a wealth of historical accounts, depict a non-uniform, “unstable” MCA in the EM, in which the climate displayed a marked reversal in phase in roughly mid-period. Whereas the Middle East and Egypt were subject to a dry climate during the first century and a half and a wet climate for the rest of the MCA, the climate of Anatolia changed in anti-phase, with a wet first half and dry second half of the period. All the historical accounts emphasize that the most extreme weather events, where the Nile floods repeatedly failed in Egypt and unusually cold dry winters co-occurred in the north-eastern flank of the EM, were clustered between the mid 10th century and the mid 11th century. We discuss this coincidence and its causes below.
4. Proposed Climate Mechanisms
To put the 11th century Near East climate in a broader climatic context and look for an explanation for the unusual events of that time, we present reconstructions of Common Era solar irradiance variations based on cosmogenic nuclei concentration [63]. The impacts of short and long-term variations in solar irradiance on climate, are discussed in numerous studies and review articles. However, actual evidence and understanding of the impact and mechanisms involved, remain a target of scientific debate [72,73,74,75,76].
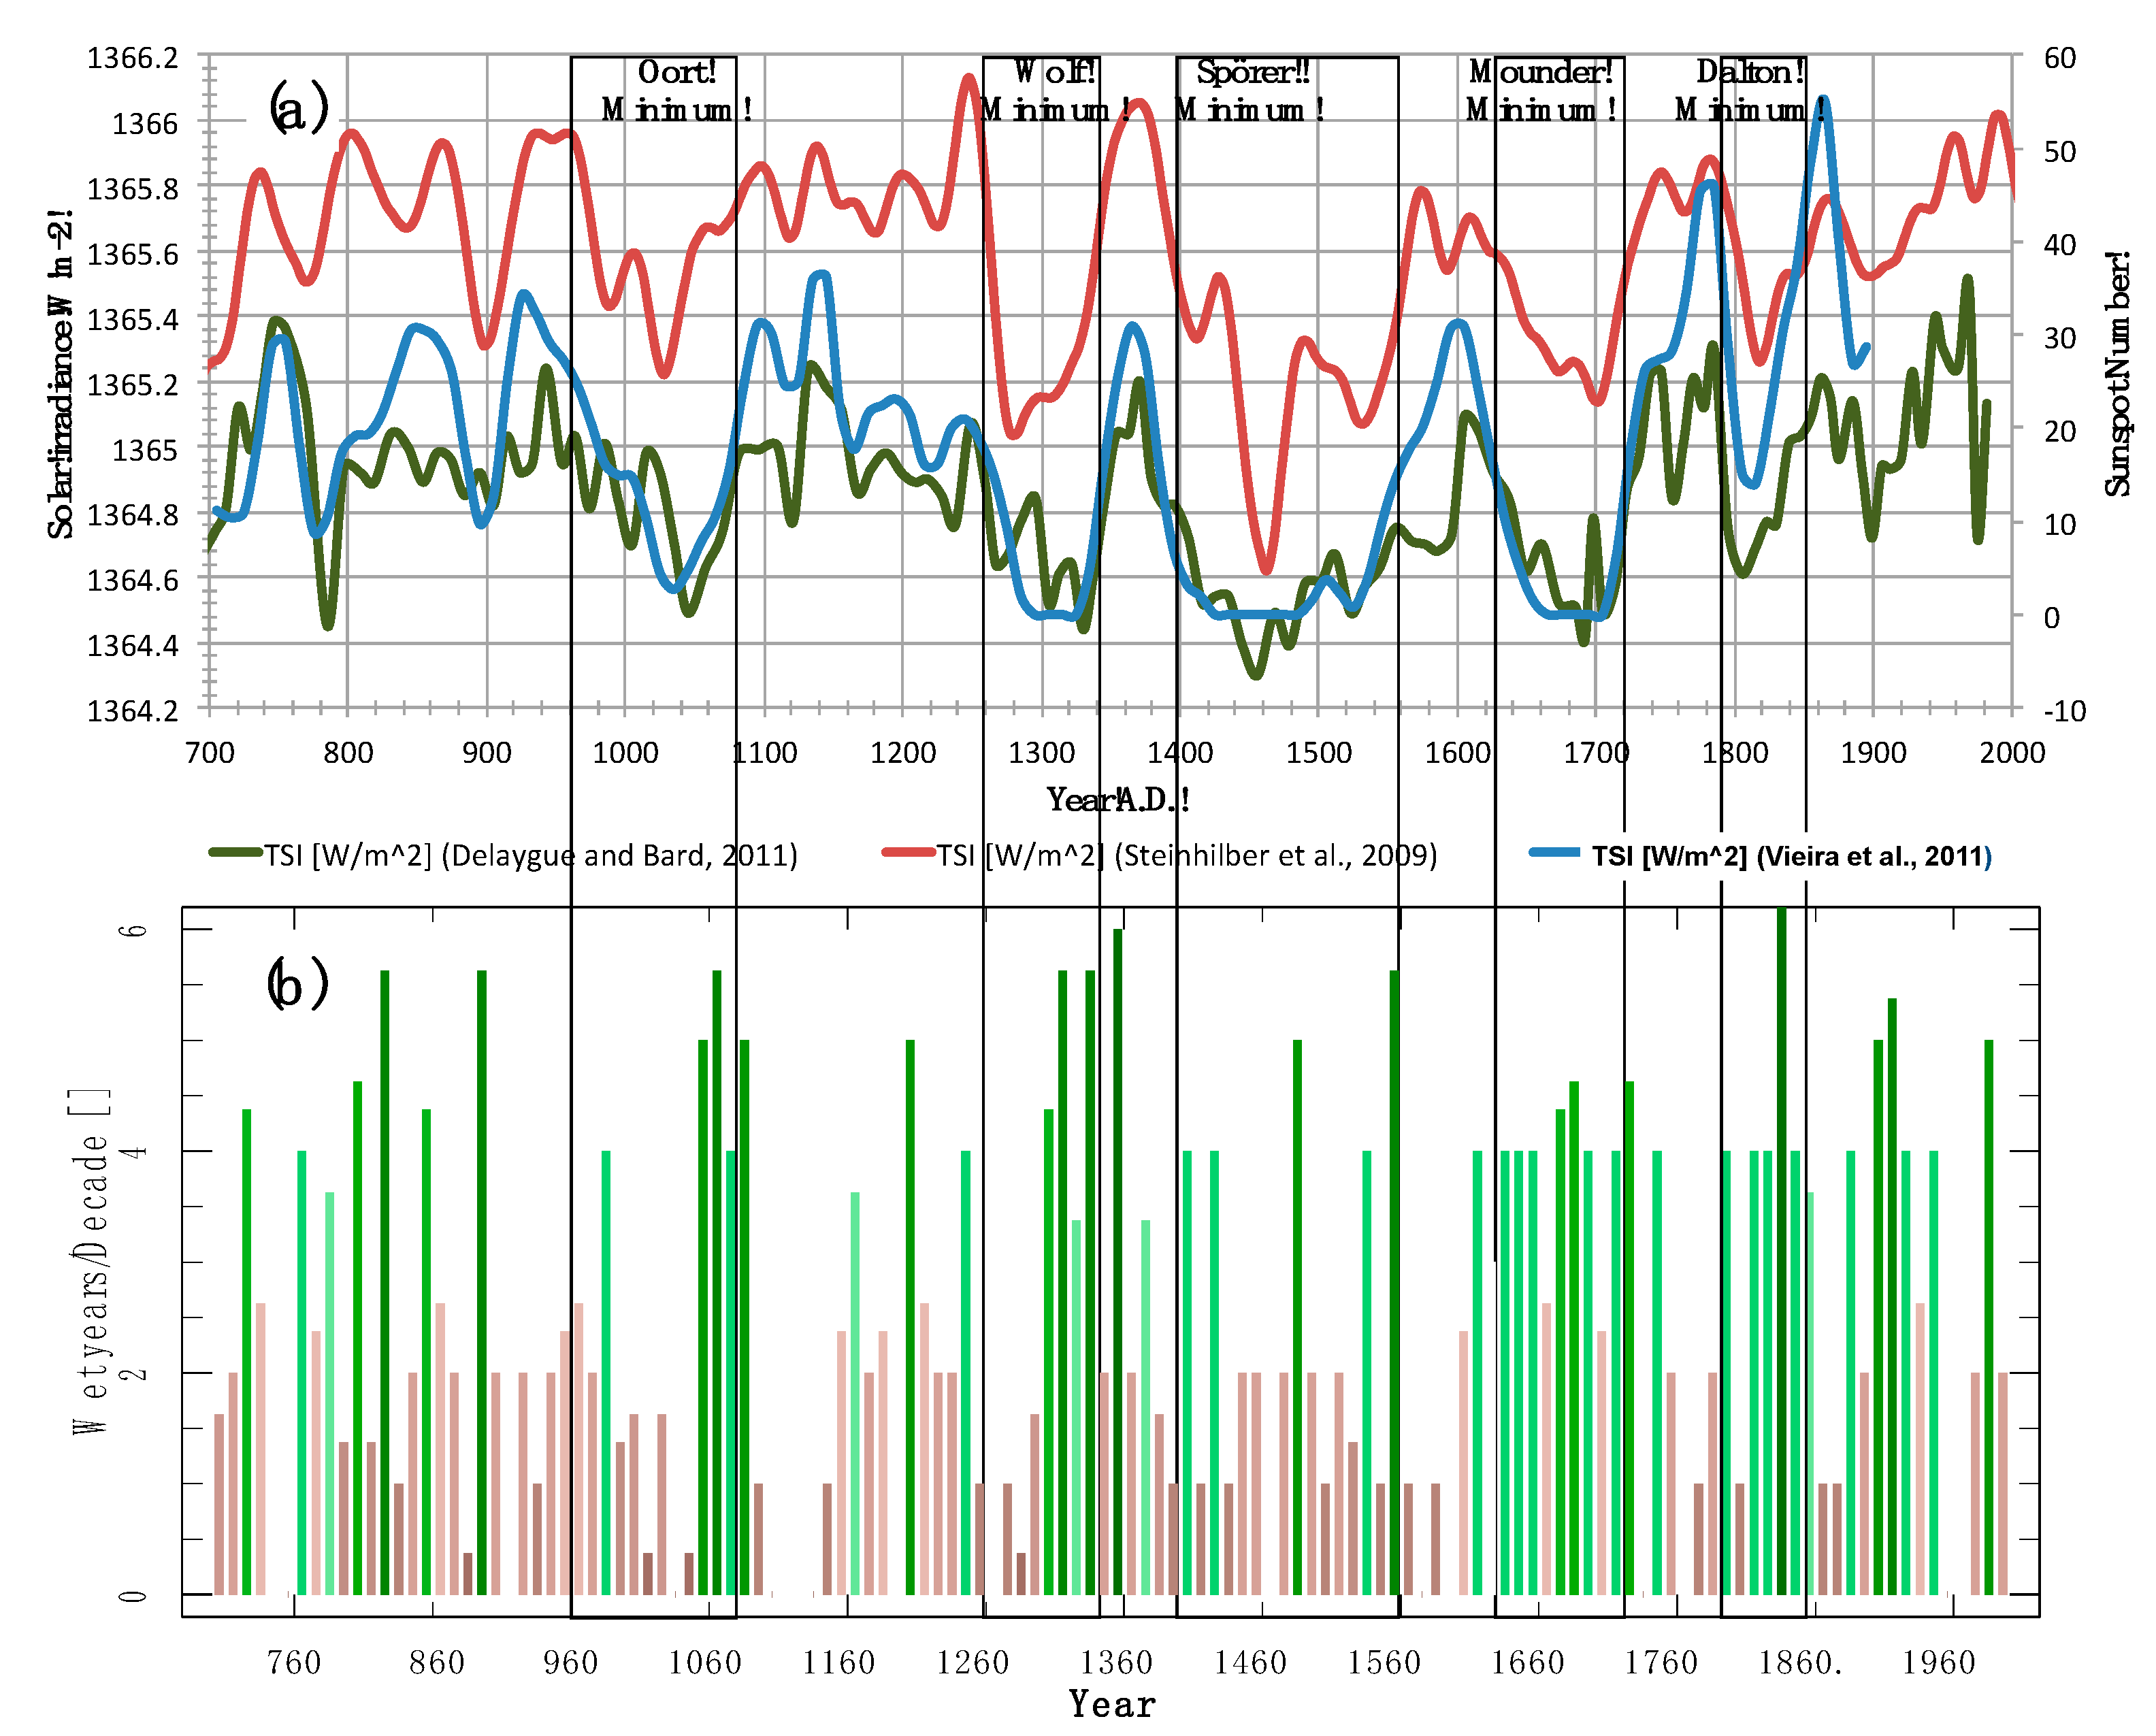
In Figure 5a and Figure A2a, we show three time-series of the changes in solar irradiance throughout the MCA. Two of the three time-series are estimates of the Solar Constant derived from the concentration of cosmogenic 10Be particle flux detected in Antarctic ice cores [63,64]. The third time-series shows the estimated number of sunspots as derived from measurements of 14C in tree rings [65,77]. All these time-series are of relatively low resolution, retaining fluctuations with times scales of 1–3 decades, thus emphasizing the longer periods, multi-decadal changes in solar irradiance. With this resolution, which filters out the more familiar 11-year sunspot cycle, the time series exhibit the well-known sequence of last millennium “Grand Solar Minima”: the Oort, Wolf, Spörer, Maunder and Dalton minima, each lasting from half to a full century and longer (see Figure A2a and [78]). A comparison between these time series points at the level of existing uncertainties in both intensity and timing of these minima. The timing uncertainty is particularly evident before the early 17th century, that is, before the availability of regular observations of the sunspot number, which have provided a well-dated, annual proxy for the intensity of solar irradiance (Figure A2a and [77]). During the medieval era, between 800 and 1400 C.E., the record displays two extended irradiance minima: the Oort Minimum and the Wolf Minimum (Figure 5a). The decline of the solar intensity associate with the Oort Minimum started in the late 10th century and ended in ~1080, reaching lowest levels between 1030 and 1050 depending on the data source. The Wolf Minimum decline in irradiance started in ~1260 and lasted till ~1350 reaching lowest values between 1280 and 1300. These two grand minima broadly correspond to extended minima in the Nile flood levels (Figure 5a,b). In particular, the Oort Minimum interval overlaps in part the mid-10th to mid-11th century period of droughts and strife in the EM that is described in the Hassan’s, Bulliet’s and Ellenblum’s historical accounts.
An association between Nile flood levels and solar irradiance has been stipulated before by Ruzmaikin et al. [79]. These authors also pointed at the El Niño/Southern Oscillation (ENSO) phenomenon as the mechanism linking between the change in irradiance and the Nile flood levels. Evidence that ENSO variability is influenced by the variations in solar irradiance can be found in several studies based on modern observations and climate model experiments that link the short, 11-year solar cycle to variations in ENSO phase and intensity [75,80,81,82]. Other studies have argued for a similar, consistent link between solar variability and ENSO on longer times scales, based on analysis of paleoclimate proxy observations [74,76,83] and see also Figure A2.
The more direct connection between low Nile flood levels and the warm phase of ENSO has also been known [36] and is linked with the suppression of the African summer monsoon during El Niño years [39]. This suppression is most likely associated with the warming of the upper troposphere and the increase in the tropical atmosphere static stability, which is forced by the warm SST and the related enhanced convection in the east equatorial Pacific during El Niño [84,85]. The opposite is true during La Niña years [36], when the African summer monsoon is more active and the rains in the Ethiopian plateau are plentiful. This Nile-ENSO relationship has been considered robust enough to be used for reconstruction of the pre-instrumental El Niño activity from the historical Nile flood record [58,62].
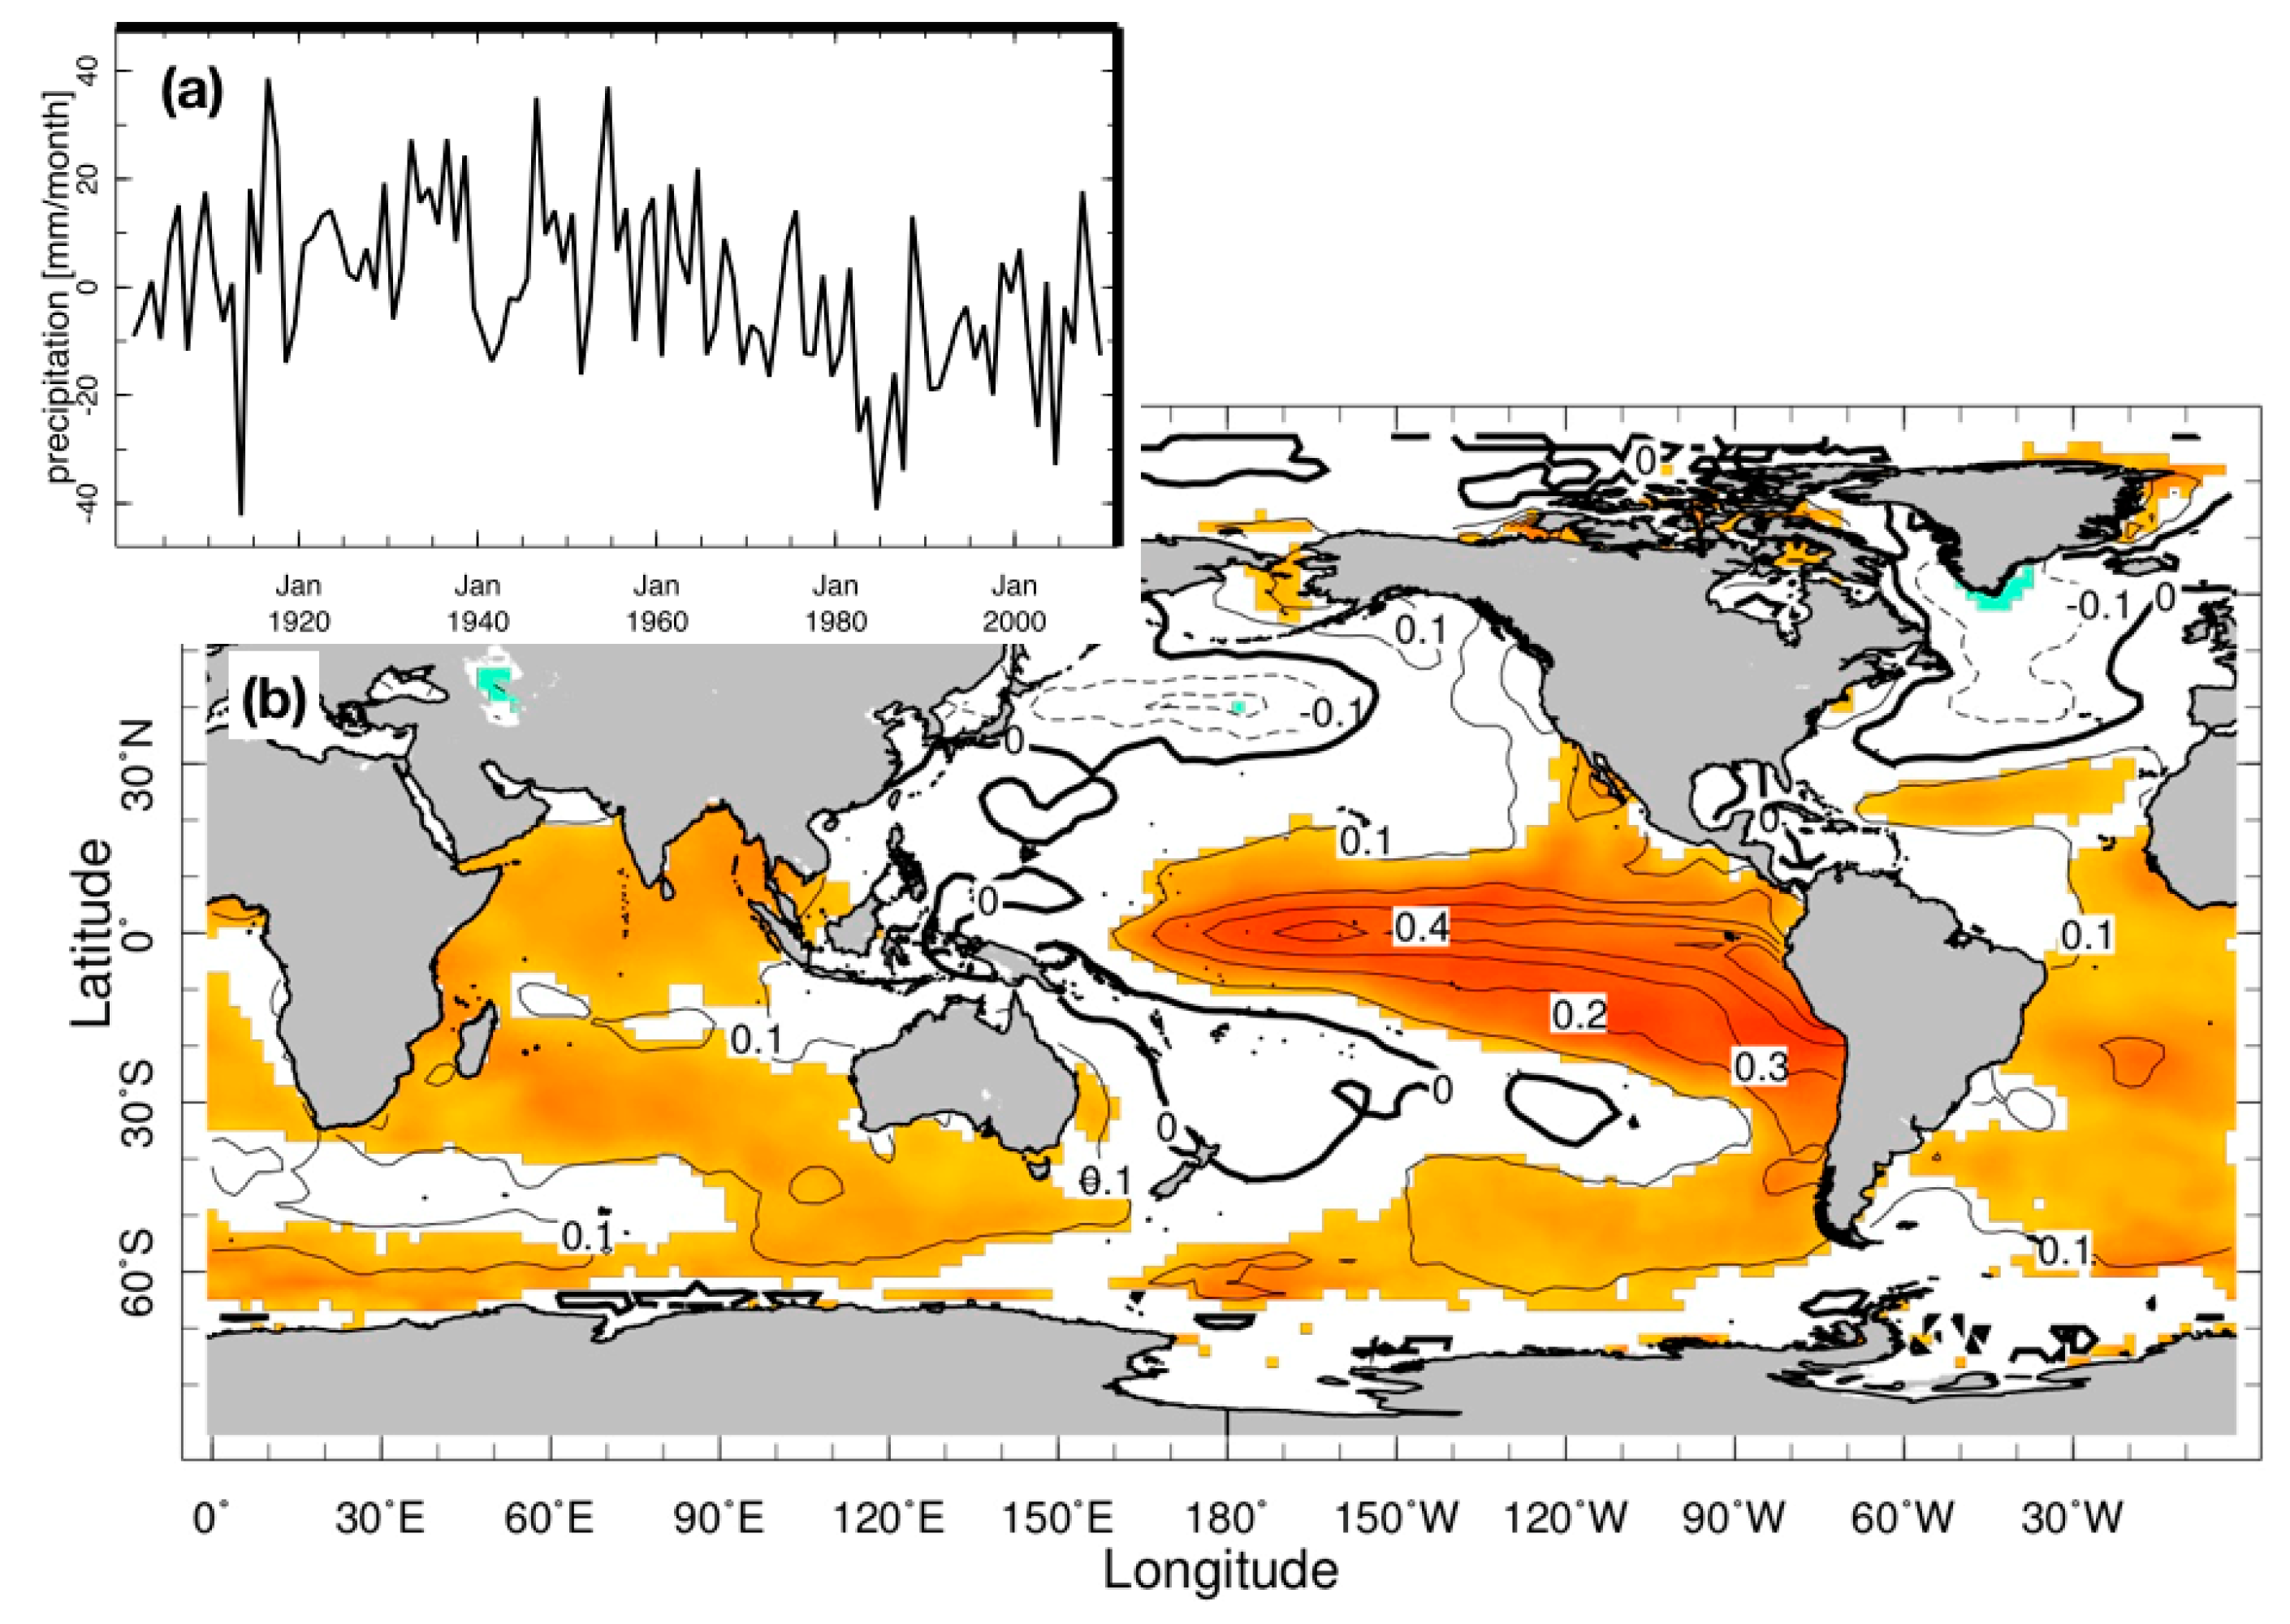
A view of the global departure of SST from normal in years of low rainfall in the Ethiopian highlands, provides evidence for the El Niño suppression of the Nile summer floods (Figure 6). The figure shows the regression of present-day summer SST on a time series of Ethiopian highland summer rainfall (the rainfall time series was inverted to display the related SST anomaly during dry years). The recent ~100-year summer rainfall record in the region corresponding to the origins of the Blue Nile and Atbara Rivers (Figure 6a) mimics the overall 20th century summer Sahel rainfall record [86]. The time series displays both high-frequency interannual fluctuations and a dramatic shift from wet to dry long-term conditions in the mid-1960s. The regression with SST (Figure 6b) has largest values and is most significant in the eastern equatorial Pacific. Here warm SSTs prevail (i.e., El Niño state) when rainfall is low in the Ethiopian highlands and vice versa. Warmer than normal SSTs also tend to prevail in the Indian Ocean and the South Atlantic when rainfall over the origins of the Blue Nile and Atbara River is lower than normal.
Supporting evidence for intensified El Niño activity during the 11th century comes from the tree-ring based North American Drought Atlas (NADA [87,88]). The atlas provides gridded annual data of the Palmer Drought Severity Index (PDSI) reconstructed from a large number of tree ring chronologies from the contiguous US, Mexico and western Canada [66]. The PDSI is a normalized measure of soil moisture that is calculated from the time integrated precipitation (P) and temperature (which is used in lieu of evaporation, E). PDSI is negative when the balance of P-E is negative (drought) and positive when P-E is positive. The trees are sensitive to soil moisture changes and thus the annual PDSI value can be reconstructed from their ring chronologies by fitting between their width and actual observations during a common period [66].
During most of the medieval era, tree ring chronologies from the western US and Northern Mexico—the region where precipitation is directly influence by ENSO (see [87]), exhibit evidence of prolonged and severe droughts or “megadroughts” [66,88,89]. However, two pronounced multi-year breaks in medieval megadroughts are evident in the 11th and 13th centuries (see Figure 2a in Reference [66]). In Figure 5c we provide proxy evidence for ENSO activity by plotting the number of wet years per decade between 800 and 1400 C.E., in the US Southwest and northern Mexico. Here a wet year is defined by an average PDSI value >1 in the area bounded by the latitudes of 22.5° N and 37.5° N and the longitudes of 125° W and 97.5° W. The first persistent break in the drought, defined by a cluster of significantly wet decades (i.e., more than 3 wet years per decade) occurred between 1040 and 1090 and the second break is between 1300 and 1340 (Figure 5c). These relatively wet intervals appear to be closely associated with the latter parts of the medieval Oort and Wolf grand solar minima. In fact, a comparison of the longer record of solar irradiance and the Western US and the long-record of NADA PDSI in the ENSO-impacted region of southwestern North America (Figure A2b), shows that all five grand solar minima of the last millennium (Figure A2a) are closely associated with clusters of significantly wet decades and, by inference, with decades of frequent and possibly strong El Niños [88,90]. The apparent delay of these wet clusters with respect to the irradiance minima, appears consistent with a similar delayed impact of the response to solar minima found by Waple et al. [74] and Breitenmoser et al. [76].
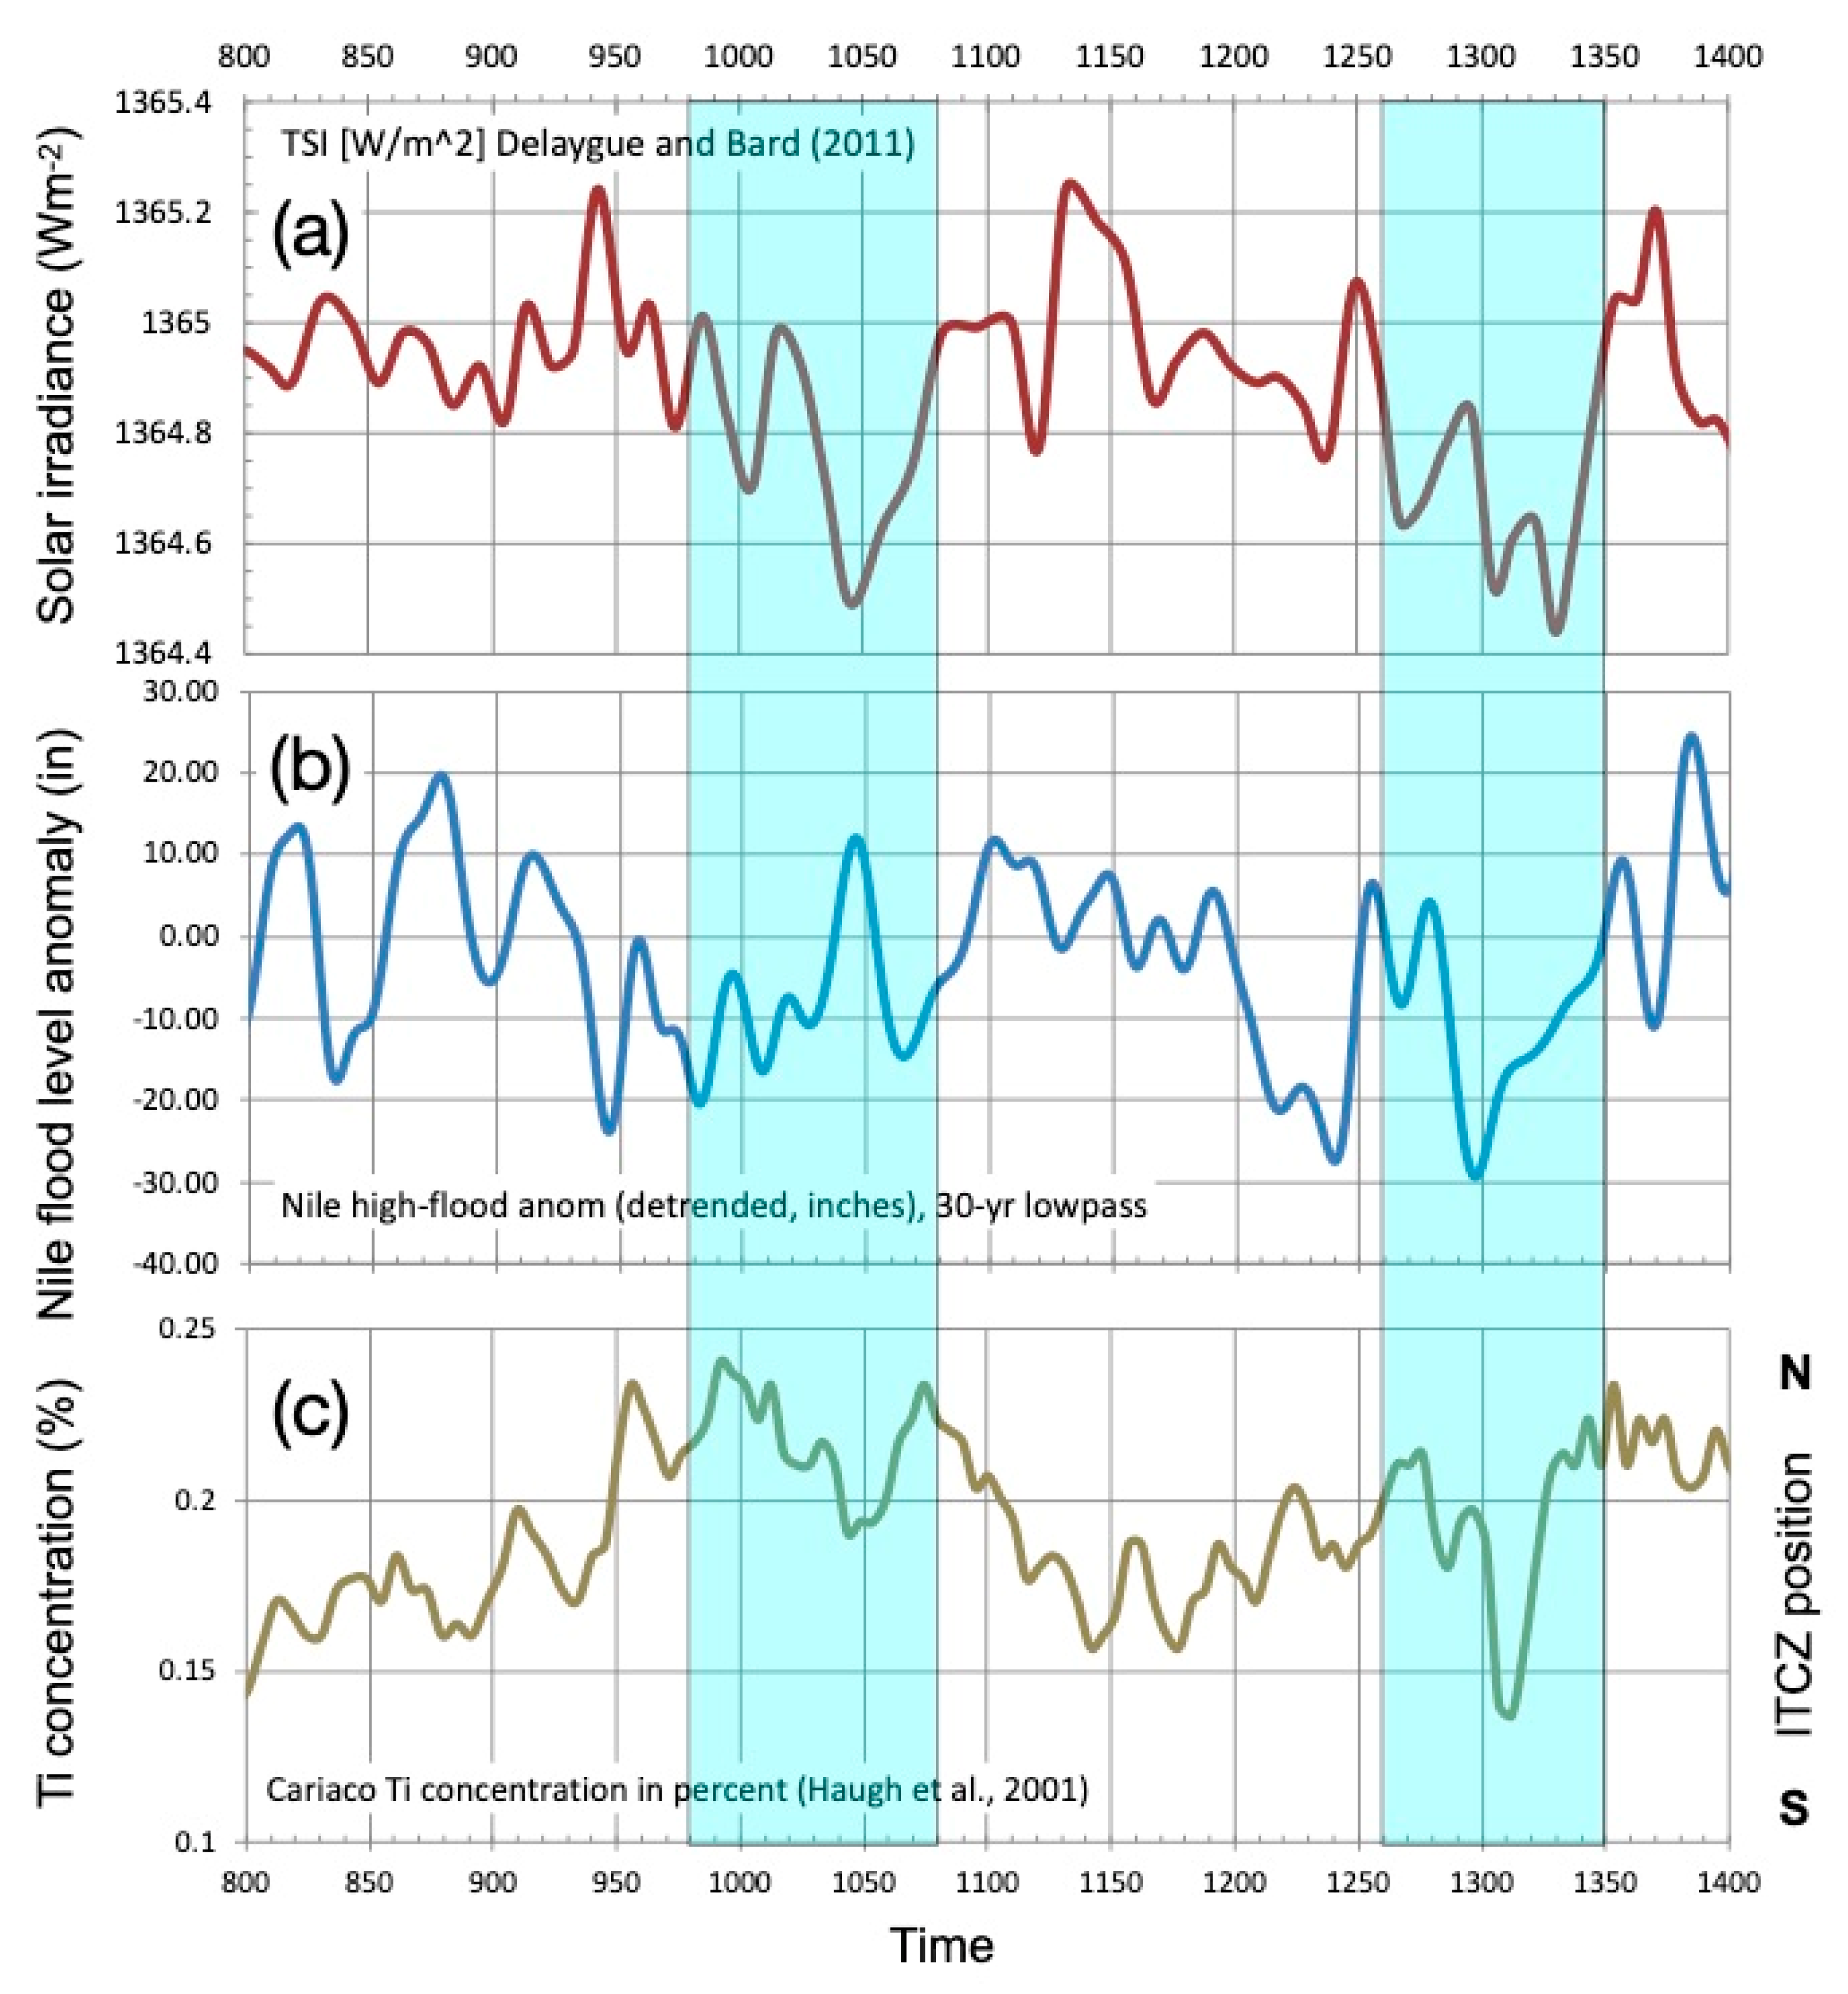
Additional evidence for a change in ENSO behavior during the Oort Minimum can be found in the well-studied, high-resolution, Cariaco sediment record [91,92]. The Cariaco record (Figure 7c), displays relatively high concentrations of Titanium (Ti) during the medieval, indicative of the intensity of precipitation in northern South America. When the Atlantic Intertropical Convergence Zone (ITCZ) moves northward, rainfall in Venezuela is intense and the region’s rivers carry sediments rich with Ti into the Caribbean. This leads to high Ti concentrations in the marine sediment core. Such ITCZ state is associated with either La Niña conditions in the tropical Pacific or with a relatively warm North Atlantic Ocean (see [91] Supplemental Figure 1). However, the concentration of Ti drops sharply in the 11th century, indicating a southward displacement of the ITCZ. This occurs in coincidence with the Oort Minimum (Figure 7a) and the interval of low Nile floods (Figure 7b), suggesting a short lapse to El Niño and/or a cold North Atlantic state [93]. A similar drop in Ti occurs during the Wolf Minimum in the 14th century (Figure 7c).
The 11th century AD minimum in southwest US droughts and the close occurrence of low Nile flood levels provide further evidence for role of the solar irradiance variability in the extreme climate events in Egypt during the early medieval. The fact that the Wolf Minimum is also associated with a lull in the Nile floods and a wet interval in southwest US, lends further credence to the argument. We note however that the early cluster of droughts, during the first half of the 10th century, is not synchronized with low values of solar irradiance, as according to the reconstructions presented in Figure 3a the Oort Minimum began only between 980 and 990 C.E. Moreover, according the tree ring-based PDSI reconstruction, drought conditions prevailed in the southwest US in the 10th century, centered on the year 936 C.E., indicating that at that time, the eastern equatorial Pacific was, on average, in a cold phase. Similarly, a marked minimum in Nile flood during the first half of the 13th century does not seem to be related to a wet period in the tree ring series and occurs in the absence of a solar minimum, at a time preceding the Wolf Minimum. Such irregularity could be expected as both the hydroclimate of southwest US and the Nile food levels are not perfectly correlated with ENSO and are influenced by other factors, including SST changes in other parts of the global ocean. The Nile sources, as evident in Figure 6, are also influenced by the degree of interhemispheric SST contrast in the Atlantic and by Indian Ocean SSTs. Southwestern North America responds most strongly to ENSO and less strongly to tropical North Atlantic SST changes [94] or to Indian Ocean SST variability.
As indicate by our historical sources and summarized above, the Nile Valley drought cluster of the 11th century overlapped a time of an unusual wave of dry and cold winters in the northeast Middle East and central Asia. Such cold conditions are also consistent with the concomitant Wolf solar minimum. Waple et al. [74] presented patterns of reconstructed, near surface temperatures association with solar variations from the mid-17 to the mid-19 century. Their analysis emphasizes the low frequencies (periods > 40 years), which are consistent with the time scales of the grand solar minima. Although the analysis time interval does not include the medieval era, their Sun-temperature relationship patterns are consistent with a cooling of Central Asia during a solar minimum. Interestingly, the figures in [74] indicate that the surface temperature response lags the irradiance time series by several decades and tends to spread westward with time. Such westward spread was also noted by Ellenblum [28] based on historical accounts. In particular, these accounts suggest that the cold driven nomad invasions in the east, started in the 1020s C.E. in the northeastern Middle East and spread westward to the Danube region in the 1050s (see [28] Figure 1).
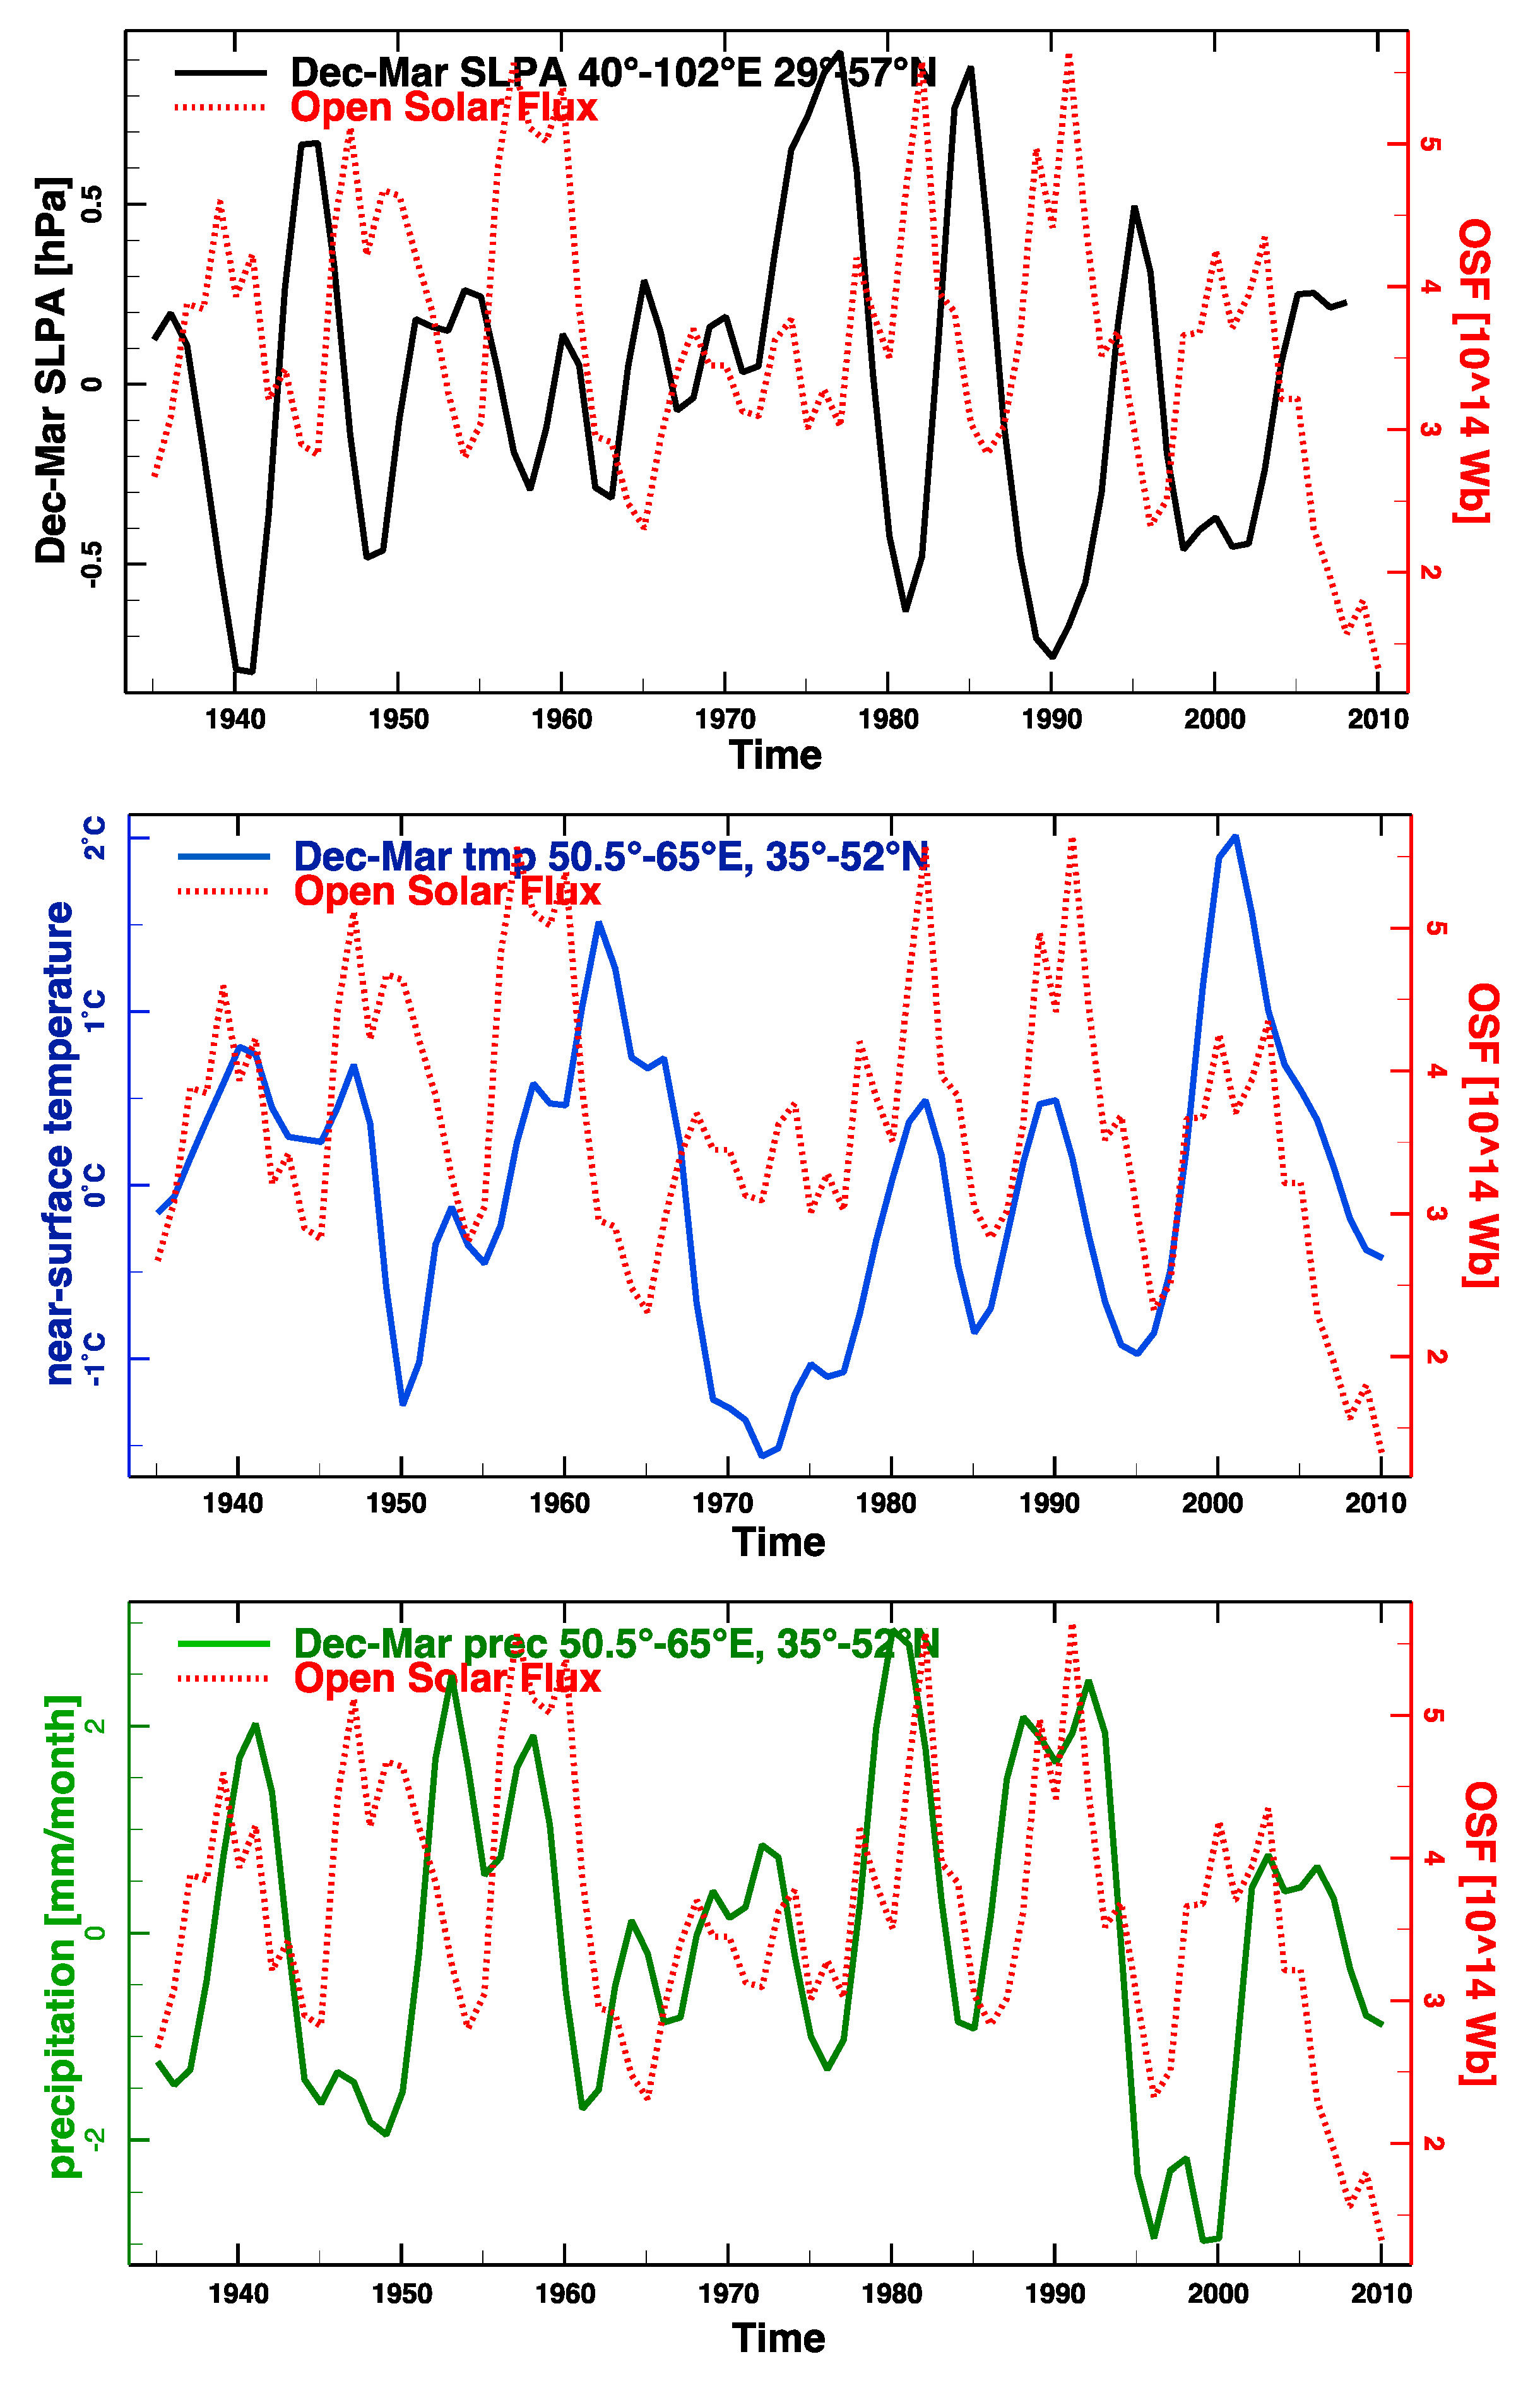
Recent observations and modeling studies [75,95,96] examined the response of the Northern Hemisphere to the 11-year (Schwabe) solar cycle. While the response to these decadal variations in solar flux cannot provide a perfect analog to the impact of a grand solar minimum, one could learn from their effect on the general direction of the impact of reduced (or intensified) irradiance on climate. These studies, point at the tendency of winters with low irradiance to display an extreme negative phase of the North Atlantic Oscillation (NAO) and abnormally cold temperatures in Eastern Europe and Central Asia. The cold temperatures are related both to the NAO, which in its negative phase prevents warm and moist Atlantic air from entering Eurasia and to a stronger than normal and more westward extended Siberian High. The Siberian High is a continental winter system that is centered over Mongolia and that when it extends westward, towards Eastern Europe and the EM, causes dry and cold weather in the Middle East [33]. In Figure 8, we plot the last 76-year record of solar variability (represented here by the time series of the Open Solar Flux (OSF, a measure of solar irradiance intensity, see [96]) and the sea level pressure averaged over the SH domain, filtered in time to emphasize decadal variations. The anti-phase relationship between these two time-series stands out clearly with a correlation of 0.48, which is significant at the 95% level (given an estimated number of degrees of freedom of 22). Figure 8 also shows the temperature and precipitation time series in the Caspian-Aral Seas region, which exhibit a noticeable in-phase relationship to the OSF time series—i.e., indicating cold and dry conditions during solar minima. The correlations between the OSF time series and temperature (0.20) and precipitation (0.29) are not significant. However, the 11-year cycles seen in this figure, in particular in the more recent half of the record, are consistent with the intensification of the Siberian High depicted in the sea level pressure graph. Taken as an imperfect indicator for the expected influence of the longer and more intense cycles of solar variability, those associated with the grand solar minima, this graphic comparison supports the assertion that the cold 11th century, Middle East and Central Asian winters recorded in historical documents of Bulliet and Ellenblum were the local climate response to the Oort solar minimum.
The simultaneous droughts that occurred in the East Mediterranean Levant region and in the Nile Valley, during the Oort solar minimum is different from the antiphase relationship between the African monsoon intensity and Levant wintertime precipitation, described in Kushnir and Stein [42]. This in-phase, Sahel-Levant relationship appears to be associated with a series of prominent events referred to as Holocene Rapid Climate Change (RCC, [46]). The RCC were cold events that influenced the entire Northern Hemisphere and were likely connected to long-term minima in solar radiation as pointed out by Bond et al. [97]. In their discussion of the RCC phenomenon impact on the Sahel-Levant climate connection, Kushnir and Stein [42] brought up the Bond et al. argument that these millennial events were forced by millennial variations in solar irradiance. The early medieval event in this study appears to fit in the same mold. In fact, the most recent solar events studied in Bond et al., which led to sharp cooling of the North Atlantic Ocean, occurred at the time of the Oort Minimum (see [97] Figure 5).
As it turns out, the impact of a grand solar minimum is far from a hypothetical issue. In recent years the overall amplitude of the Schwabe (11-year) solar cycles has been gradually declining, that after displaying peak amplitudes in the middle of the 20th century [98]. The decline in the Schwabe cycle amplitude led to speculations regarding an imminent 21st century grand solar minimum [99]. These speculations lead to several modeling studies aimed at exploring the impact of such phenomenon in a GHG warming world [100,101,102,103,104]. The overall impression from these modeling studied is that the global impact of a grand solar minimum is small compare to the expected, mid-21st century impact of anthropogenic warming [101]. However, the local impacts could be significant and could reduce by up to a 20% the warming in surface air temperature due to increased GHG concentrations, depending on the emission scenario and the intensity of the solar minimum. An assessment of the specific impact on the EM in both temperature and precipitation will require further study that is beyond the scope of this one.
5. Summary and Conclusions
During the first half of the Medieval Climate Anomaly, between the early 10th century and the late 11th century, the lands surrounding the East Mediterranean simultaneously experienced an unusual dry climate. In the Levant, the Dead Sea lake bottomed at the lowest level since the late Bronze Age. At the same time, the Nile River floods in lower Egypt repeatedly fell below the levels required for proper flooding of the agricultural fields, causing wide-spread human suffering. Throughout this time interval, the northeastern Middle East experienced unusually cold and dry winters, a climate that had likely triggered the period’s nomadic invasions from Central Asia into Iran, Iraq and subsequently Anatolia. This periods of aridity and cold weather coincided with the Oort grand solar minimum that reached its peak between 1030 and 1050 C.E. Climate indicators from North and Central America show that the Oort Minimum was also linked with intensified El Niño activity, which is known to suppress the African summer monsoon rains in the Ethiopian Highlands and in Central Asia led to a stronger than normal winter Siberian High. A repeat of some of these coinciding changes, in particular the low Nile floods and wet interval in US Southwest, happened also during the Wolf solar minimum, between the mid-13th and mid-14th centuries. The Dead Sea record is not temporally detailed enough to discern the lake’s response to the Wolf minimum.
In conclusion, our study proposes additional evidence to the sensitivity of the East Mediterranean to changes in external radiative forcing. The implication of such regional sensitivity to natural variations in solar irradiance is different from that found in the response to changes in GHG concentrations, as it is quasi-oscillatory and could act to exacerbate or alleviate the anthropogenic impact. If it strikes in the wrong phase (i.e., if solar irradiance drops into a protracted minimum phase), the combined regional impact could be severe. Our study of the early MCA East Mediterranean climate is thus relevant in the present GHG forced climate. It suggests that if an extended solar minimum, akin to the Oort minimum, forms in the future, it could exacerbate the regional droughts in the Middle East compared to what is expected from anthropogenic warming alone. At the same time however, a solar minimum may reduce the warming impact associated with the rise in GHG concentrations.
Author Contributions
Writing—original draft preparation and writing—review and editing, Y.K. and M.S.
Funding
This research was funded by the Dead Sea Deep Drill Center of Excellence (COE) of the Israel Science Foundation (grants # 1736/11 and 1436/14 and by NSF award AGS-1734760.
Acknowledgments
This paper benefitted from conversations with Wallace Broecker of the Columbia University, Lamont-Doherty Earth Observatory. We are thankful to Professor Ronnie Ellenblum of the Hebrew University of Jerusalem for his support and for sharing with us earlier versions of his book. Y. Kushnir acknowledges the generous support of the Hebrew University of Jerusalem Lady Davis Foundation Trust during an extended visit to the Fredy & Nadine Herrmann Institute of Earth Sciences. The authors also wish to thank Dr. Izhak Felix, a co-author of the Kondrashov et al. (2005) paper cited in the text, for graciously providing the annually resolved Cairo Nilometer record. We also thank the two anonymous reviewers whose comments helped to improve the paper. This is Lamont-Doherty Earth Observatory contribution number 8277.
Conflicts of Interest
The authors declare no conflicts of interest.
Appendix A
Figure A1.
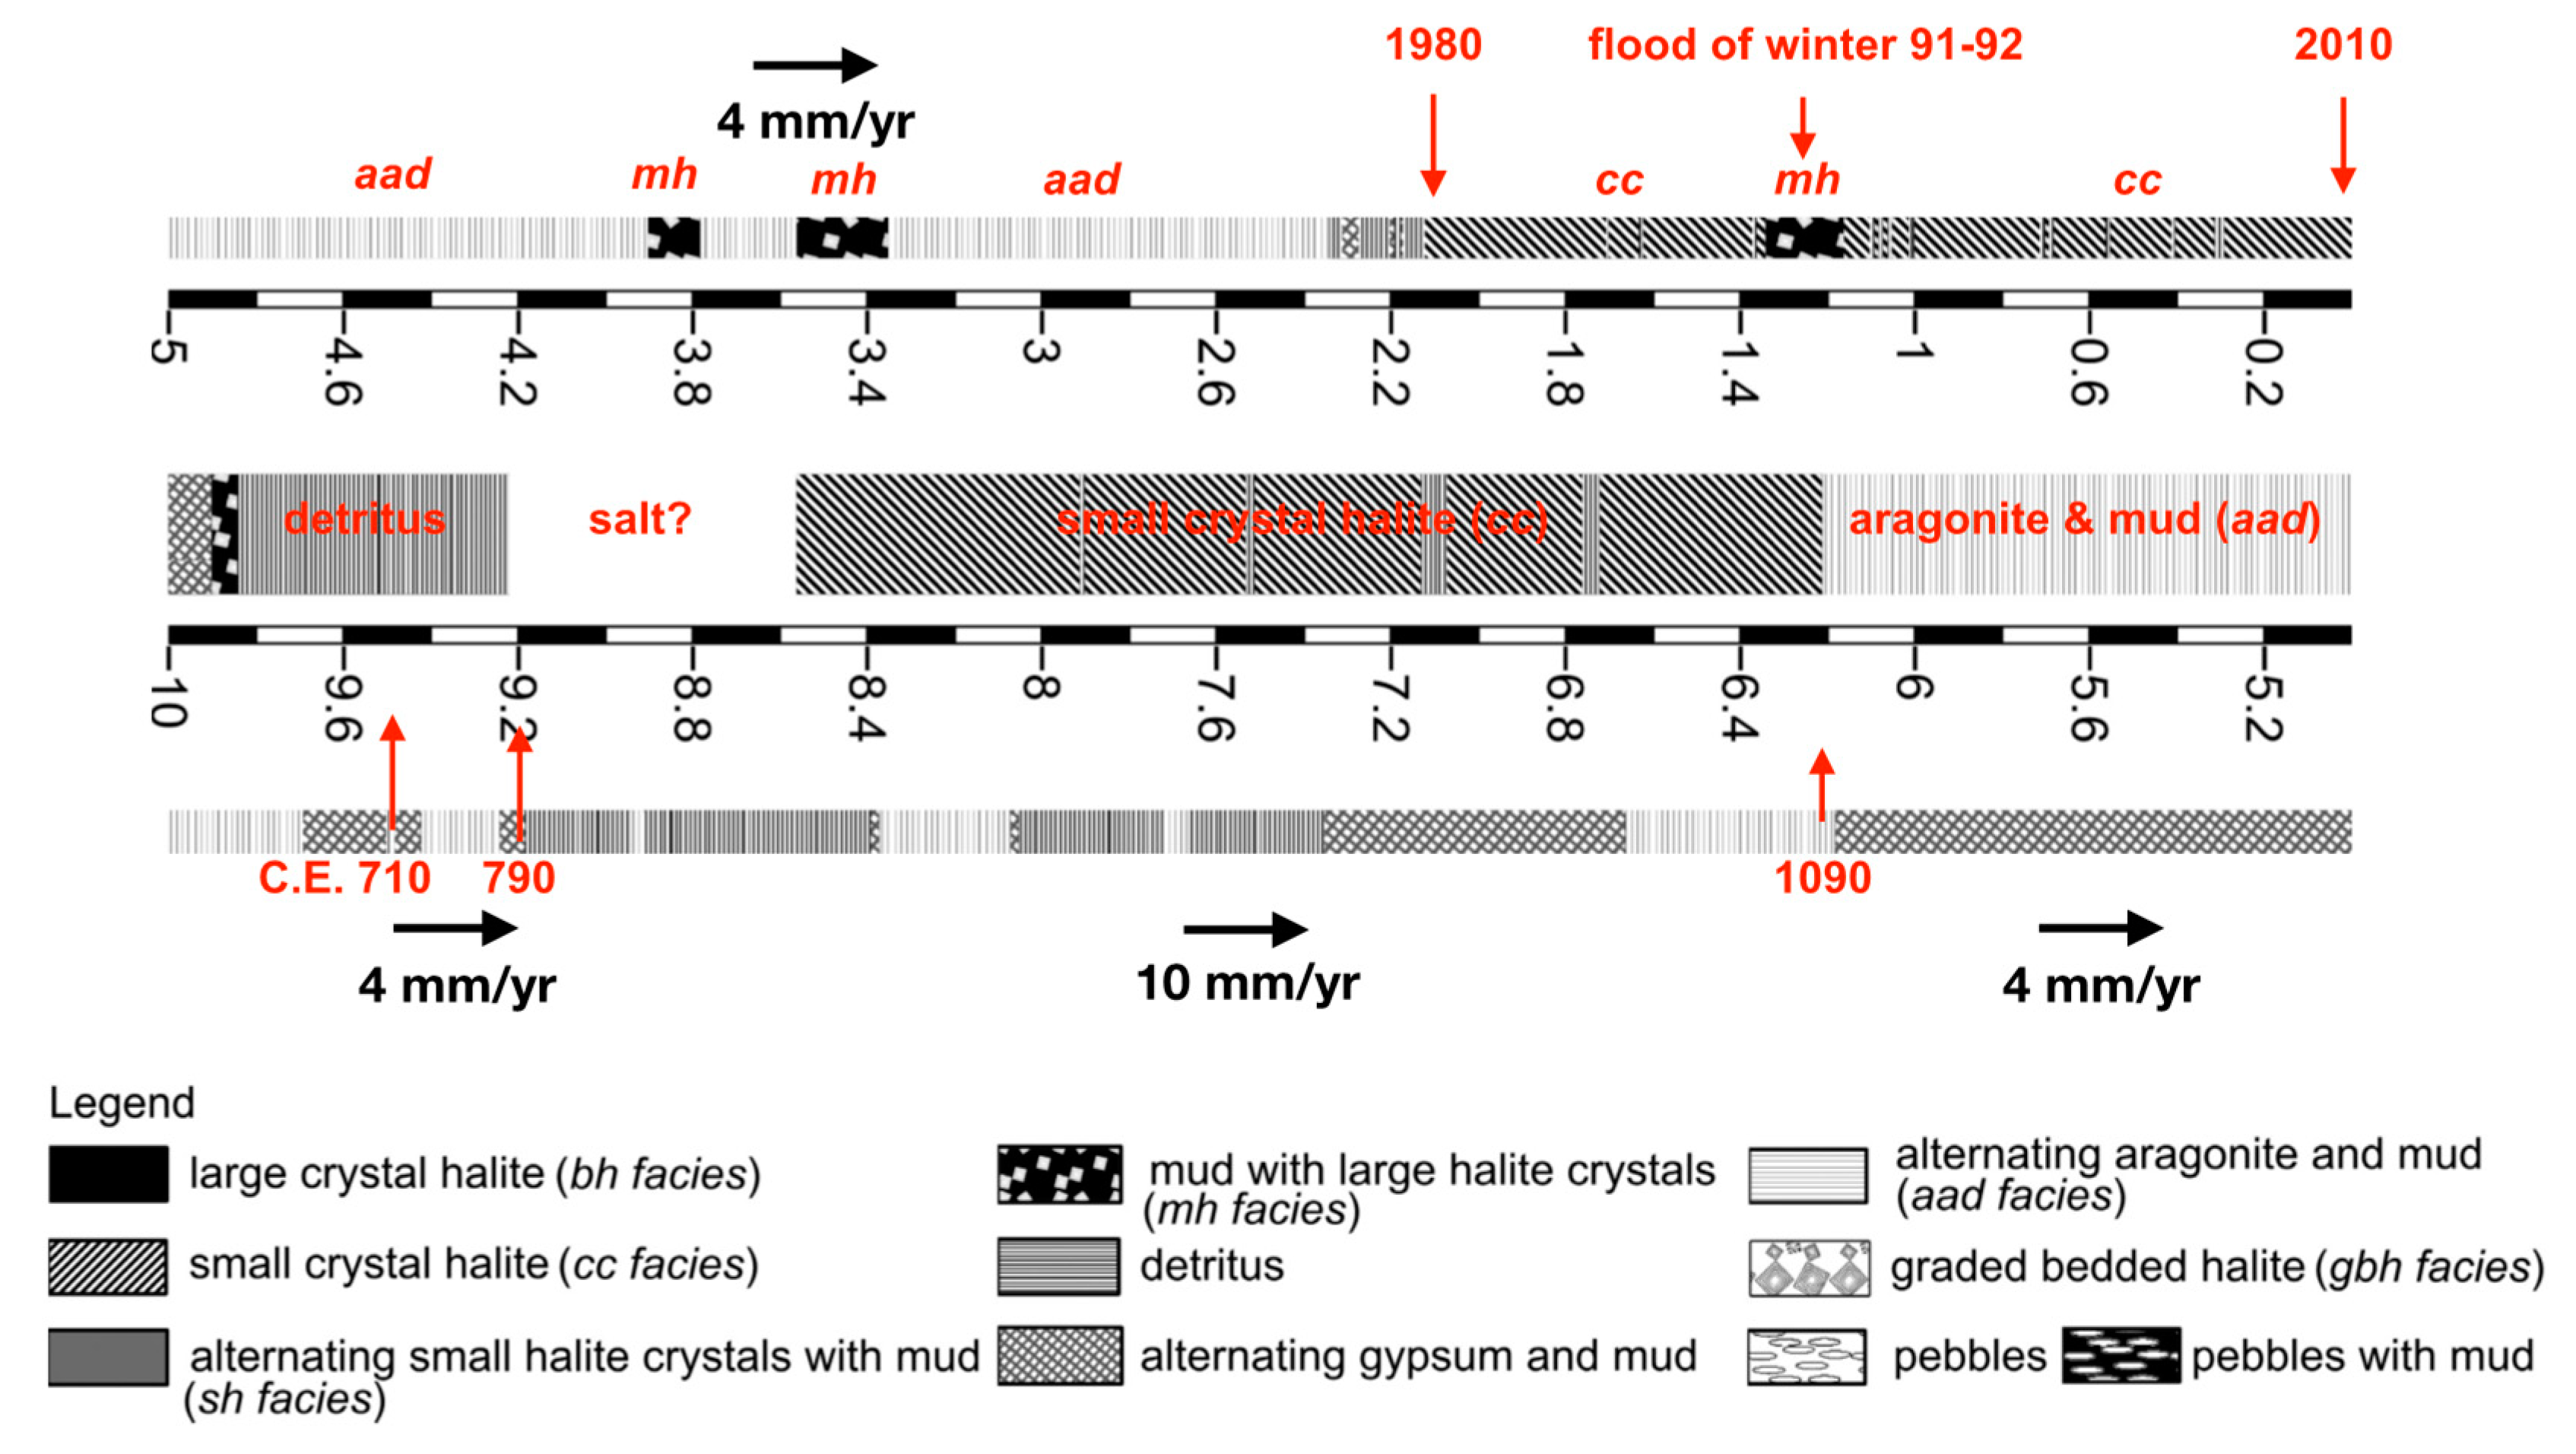
Stratigraphy of the upper sections of the Dead Sea deep sediment core recovered in the winter of 2010–2011 (see reference [4]). The segment shown here is part of the full core stratigraphy presented in Reference [103]. The different types of core facies are shown in the legend. To find the dates of the drought-related salt layer, between the depth of 9.2 m and 6.2 m, we use the nearest 14C dated location, at a depth of 9.49 m (marked by the arrow). This depth location was dated by Kitagawa et al. [54] as having an age of 1300 ± 40 years BP, corresponding to the year of 710 C.E. ± 40 years. We then use a sedimentation rates of ~4 mm/year (the estimated rate for all types of sediments except for salt) to estimate the date at the bottom of the salt layer and a sedimentation rate of ~10 mm/yr for salt to determine the date at the top of the salt layer. Based on this we calculate that the salt was deposited between about 790 and 1090 C.E.
Figure A1.
Stratigraphy of the upper sections of the Dead Sea deep sediment core recovered in the winter of 2010–2011 (see reference [4]). The segment shown here is part of the full core stratigraphy presented in Reference [103]. The different types of core facies are shown in the legend. To find the dates of the drought-related salt layer, between the depth of 9.2 m and 6.2 m, we use the nearest 14C dated location, at a depth of 9.49 m (marked by the arrow). This depth location was dated by Kitagawa et al. [54] as having an age of 1300 ± 40 years BP, corresponding to the year of 710 C.E. ± 40 years. We then use a sedimentation rates of ~4 mm/year (the estimated rate for all types of sediments except for salt) to estimate the date at the bottom of the salt layer and a sedimentation rate of ~10 mm/yr for salt to determine the date at the top of the salt layer. Based on this we calculate that the salt was deposited between about 790 and 1090 C.E.

Figure A2.
A full last millennium segment of the (a) solar irradiance curve and (b) wet years per decade record in the El Niño impacted region in southwest US and Northern Mexico (see Figure 5c).
Figure A2.
A full last millennium segment of the (a) solar irradiance curve and (b) wet years per decade record in the El Niño impacted region in southwest US and Northern Mexico (see Figure 5c).

References
- Issar, A.S.; Adar, E. Progressive development of water resources in the Middle East for sustainable water supply in a period of climate change. Philos. Trans. R. Soc. A-Math. Phys. Eng. Sci. 2010, 368, 5339–5350. [Google Scholar] [CrossRef] [PubMed] [Green Version]
- Hillel, D. Rivers of Eden. The Struggle for Water and the Quest for Peace in the Middle East; Oxford University Press: New York, NY, USA, 1994; 365p. [Google Scholar]
- Kaniewski, D.; Van Campo, E.; Paulissen, E.; Weiss, H.; Bakker, J.; Rossignol, I.; Van Lerberghe, K. The medieval climate anomaly and the little Ice Age in coastal Syria inferred from pollen-derived palaeoclimatic patterns. Glob. Planet. Change 2011, 78, 178–187. [Google Scholar] [CrossRef]
- Neugebauer, I.; Brauer, A.; Schwab, M.J.; Waldmann, N.D.; Enzel, Y.; Kitagawa, H.; Torfstein, A.; Frank, U.; Dulski, P.; Agnon, A.; et al. Lithology of the long sediment record recovered by the ICDP Dead Sea Deep Drilling Project (DSDDP). Quat. Sci. Rev. 2014, 102, 149–165. [Google Scholar] [CrossRef]
- Kiro, Y.; Goldstein, S.L.; Lazar, B.; Stein, M.J.B. Environmental implications of salt facies in the Dead Sea. GSA Bulletin 2016, 128, 824–841. [Google Scholar] [CrossRef]
- Bar-Matthews, M.; Ayalon, A. Speleothems as palaeoclimate indicators, a case study from Soreq Cave located in the Eastern Mediterranean Region, Israel. In Dev Paleoenviron Res; Battarbee, R.W., Gasse, F., Stickley, C.E., Eds.; Springer: Dordrecht, The Netherlands, 2004; pp. 363–391. [Google Scholar]
- Schilman, B.; Ayalon, A.; Bar-Matthews, M.; Kagan, E.J.; Almogi-Labin, A. Sea-Land paleoclimate correlation in the Eastern Mediterranean region during the Late Holocene. Israel J Earth Sci 2002, 51, 181–190. [Google Scholar] [CrossRef]
- Popper, W. The Cairo nilometer: studies in Ibn Taghrî Birdî’s chronicles of Egypt: I; University of California Press: Berkeley, CA, USA, 1951; p. 269. [Google Scholar]
- De Putter, T.; Loutre, M.F.; Wansard, G. Decadal periodicities of Nile River historical discharge (AD 622-1470) and climatic implications. Geophys. Res. Lett. 1998, 25, 3193–3196. [Google Scholar] [CrossRef]
- Gasse, F.; Vidal, L.; Develle, A.L.; Van Campo, E. Hydrological variability in the Northern Levant: a 250 ka multi-proxy record from the Yammoûneh (Lebanon) sedimentary sequence. Clim. Past 2011, 7, 1261–1284. [Google Scholar] [CrossRef] [Green Version]
- Kaniewski, D.; Van Campo, E.; Weiss, H. Drought is a recurring challenge in the Middle East. Proc. Natl. Acad. Sci. USA 2012, 109, 3862–3867. [Google Scholar] [CrossRef] [PubMed] [Green Version]
- Kharraz, J.E.; El-Sadek, A.; Ghaffour, N.; Mino, E. Water scarcity and drought in WANA countries. Proc. Eng. 2012, 33, 14–29. [Google Scholar] [CrossRef] [Green Version]
- Collins, M.; Knutti, R.; Arblaster, J.; Dufresne, J.-L.; Fichefet, T.; Friedlingstein, P.; Gao, X.; Gutowski, W.; Johns, T.; Krinner, G. Long-term Climate Change: Projections, Com-mitments and Irreversibility. In Climate Change 2013: The Physical Science Basis. Contribution of Working Group I to the Fifth Assessment Report of the Intergovernmental Panel on Climate Change; Stocker, T.F., Qin, D., Plattner, G.-K., Tignor, M., Allen, S.K., Boschung, J., Nauels, A., Xia, Y., Bex, V., Midgley, P.M., Eds.; Cambridge University Press: Cambridge, UK; New York, NY, USA, 2013; pp. 1029–1136. [Google Scholar]
- Kelley, C.; Ting, M.F.; Seager, R.; Kushnir, Y. Mediterranean precipitation climatology, seasonal cycle, and trend as simulated by CMIP5. Geophys. Res. Lett. 2012, 39. [Google Scholar] [CrossRef] [Green Version]
- Kelley, C.; Ting, M.F.; Seager, R.; Kushnir, Y. The relative contributions of radiative forcing and internal climate variability to the late 20th Century winter drying of the Mediterranean region. Clim. Dyn. 2012, 38, 2001–2015. [Google Scholar] [CrossRef]
- Lelieveld, J.; Hadjinicolaou, P.; Kostopoulou, E.; Chenoweth, J.; El Maayar, M.; Giannakopoulos, C.; Hannides, C.; Lange, M.A.; Tanarhte, M.; Tyrlis, E.; et al. Climate change and impacts in the Eastern Mediterranean and the Middle East. Clim. Chang. 2012, 114, 667–687. [Google Scholar] [CrossRef] [PubMed] [Green Version]
- Cook, B.I.; Anchukaitis, K.J.; Touchan, R.; Meko, D.M.; Cook, E.R. Spatiotemporal drought variability in the Mediterranean over the last 900 years. J. Geophys. Res. Atmos. 2016, 121, 2060–2074. [Google Scholar] [CrossRef] [PubMed] [Green Version]
- Kelley, C.P.; Mohtadi, S.; Cane, M.A.; Seager, R.; Kushnir, Y. Climate change in the Fertile Crescent and implications of the recent Syrian drought. Proc. Natl. Acad. Sci. USA 2015, 112, 3241–3246. [Google Scholar] [CrossRef] [PubMed]
- Gleick, P. Water, Drought, Climate Change, and Conflict in Syria. Weather Clim. Soc. 2014. [Google Scholar] [CrossRef]
- Trigo, R.M.; Gouveia, C.M.; Barriopedro, D. The intense 2007–2009 drought in the Fertile Crescent: Impacts and associated atmospheric circulation. Agric. For. Meteorol. 2010, 150, 1245–1257. [Google Scholar] [CrossRef]
- Diaz, H.F.; Trigo, R.; Hughes, M.K.; Mann, M.E.; Xoplaki, E.; Barriopedro, D. Spatial and Temporal Characteristics of Climate in Medieval Times Revisited. Bull. Am. Meteorol. Soc. 2011, 92, 1487–1499. [Google Scholar] [CrossRef]
- Graham, N.E.; Ammann, C.M.; Fleitmann, D.; Cobb, K.M.; Luterbacher, J. Support for global climate reorganization during the “Medieval Climate Anomaly”. Clim. Dyn. 2011, 37, 1217–1245. [Google Scholar] [CrossRef]
- Otto-Bliesner, B.L.; Brady, E.C.; Fasullo, J.; Jahn, A.; Landrum, L.; Stevenson, S.; Rosenbloom, N.; Mai, A.; Strand, G. Climate variability and change since 850 CE: An ensemble approach with the community earth system model. Bull. Am. Meteorol. Soc. 2016, 97, 735–754. [Google Scholar] [CrossRef]
- Ahmed, M.; Anchukaitis, K.J.; Asrat, A.; Borgaonkar, H.P.; Braida, M.; Buckley, B.M.; Büntgen, U.; Chase, B.M.; Christie, D.A.; Cook, E.R.; et al. Continental-scale temperature variability during the past two millennia. Nat. Geosci. 2013, 6, 339–346. [Google Scholar] [Green Version]
- Xoplaki, E.; Luterbacher, J.; Wagner, S.; Zorita, E.; Fleitmann, D.; Preiser-Kapeller, J.; Sargent, A.M.; White, S.; Toreti, A.; Haldon, J.F. Modelling Climate and Societal Resilience in the Eastern Mediterranean in the Last Millennium. Hum. Ecol. 2018, 46, 367–379. [Google Scholar] [CrossRef] [PubMed]
- Hassan, F.A. Extreme Nile floods and famines in Medieval Egypt (AD 930-1500) and their climatic implications. Quat. Int. 2007, 173, 101–112. [Google Scholar] [CrossRef]
- Migowski, C.; Stein, M.; Prasad, S.; Negendank, J.F.W.; Agnon, A. Holocene climate variability and cultural evolution in the Near East from the Dead Sea sedimentary record. Quat. Res. 2006, 66, 421–431. [Google Scholar] [CrossRef]
- Ellenblum, R. The Collapse of the Eastern Mediterranean Climate Change and the Decline of the East; Cambridge University Press: New York, NY, USA, 2012; p. 270. [Google Scholar]
- Bulliet, R.W. Cotton, Climate, and Camels in Early Islamic Iran: A Moment in World History; Columbia University Press: New York, NY, USA, 2011; p. 167. [Google Scholar]
- Preiser-Kapeller, J. A Collapse of the Eastern Mediterranean? New results and theories on the interplay between climate and societies in Byzantium and the Near East, ca. 1000-1200 AD. arXiv, 2017; arXiv:1705.04013. [Google Scholar]
- Enzel, Y.; Arnit, R.; Dayan, U.; Crouvi, O.; Kahana, R.; Ziv, B.; Sharon, D. The climatic and physiographic controls of the eastern Mediterranean over the late Pleistocene climates in the southern Levant and its neighboring deserts. Glob. Planet Chang. 2008, 60, 165–192. [Google Scholar] [CrossRef]
- Kushnir, Y.; Dayan, U.; Ziv, B.; Morin, E.; Enzel, Y. Climate of the Levant: Phenomena and Mechanisms. In Quaternary of the Levant: Environments, Climate Change, and Humans; Enzel, Y., Bar-Yosef, O., Eds.; Cambridge University Press: Cambridge, UK, 2017; pp. 31–44. [Google Scholar]
- Alpert, P.; Osetinsky, I.; Ziv, B.; Shafir, H. Semi-objective classification for daily synoptic systems: Application to the Eastern Mediterranean climate change. Int. J. Climatol. 2004, 24, 1001–1011. [Google Scholar] [CrossRef]
- Seager, R.; Liu, H.; Henderson, N.; Simpson, I.; Kelley, C.; Shaw, T.; Kushnir, Y.; Ting, M. Causes of increasing aridification of the Mediterranean region in response to rising greenhouse gases. J. Clim. 2014. [Google Scholar] [CrossRef]
- Ziv, B.; Dayan, U.; Kushnir, Y.; Roth, C.; Enzel, Y. Regional and global atmospheric patterns governing rainfall in the southern Levant. Int. J. Climatol. 2006, 26, 55–73. [Google Scholar] [CrossRef] [Green Version]
- Eltahir, E.A.B. El Nino and the natural variability in the flow of the Nile river. Water Resour. Res. 1996, 32, 131–137. [Google Scholar] [CrossRef]
- Dünkeloh, A.; Jacobeit, J. Circulation dynamics of Mediterranean precipitation variability 1948-98. Int. J. Climatol. 2003, 23, 1843–1866. [Google Scholar] [CrossRef] [Green Version]
- Hurrell, J.W.; Kushnir, Y.; Ottersen, G.; Visbeck, M. An overview of the North Atlantic Oscillation. In The North Atlantic Oscillation: Climatic Significance and Environmental Impact; Hurrell, J.W., Kushnir, Y., Ottersen, G., Visbeck, M., Eds.; American Geophysical Union, Geophysical Monograph Series: Washington, DC, USA, 2003; Volume 134, pp. 1–35. [Google Scholar]
- Giannini, A.; Saravanan, R.; Chang, P. Oceanic forcing of Sahel rainfall on interannual to interdecadal time scales. Science 2003, 302, 1027–1030. [Google Scholar] [CrossRef]
- Pomposi, C.; Kushnir, Y.; Giannini, A. Moisture budget analysis of SST-driven decadal Sahel precipitation variability in the twentieth century. Clim. Dyn. 2015, 44, 3303–3321. [Google Scholar] [CrossRef]
- Biasutti, M.; Held, I.M.; Sobel, A.H.; Giannini, A. SST forcings and Sahel rainfall variability in simulations of the twentieth and twenty-first centuries. J. Clim. 2008, 21, 3471–3486. [Google Scholar] [CrossRef]
- Kushnir, Y.; Stein, M. North Atlantic influence on 19th-20th century rainfall in the Dead Sea watershed, teleconnections with the Sahel, and implication for Holocene climate fluctuations. Quat. Sci. Rev. 2010, 29, 3843–3860. [Google Scholar] [CrossRef]
- Knight, J.R. The Atlantic Multidecadal Oscillation inferred from the forced climate response in coupled general circulation models. J. Clim. 2009, 22, 1610–1625. [Google Scholar] [CrossRef]
- Zhang, R.; Delworth, T.L. Impact of Atlantic multidecadal oscillations on India/Sahel rainfall and Atlantic hurricanes. Geophys. Res. Lett. 2006, 33. [Google Scholar] [CrossRef] [Green Version]
- Denton, G.H.; Karlén, W. Holocene climatic variations—Their pattern and possible cause. Quat. Res. 1973, 3, 155–205. [Google Scholar] [CrossRef]
- Mayewski, P.A.; Rohling, E.E.; Stager, J.C.; Karlen, W.; Maasch, K.A.; Meeker, L.D.; Meyerson, E.A.; Gasse, F.; van Kreveld, S.; Holmgren, K.; et al. Holocene climate variability. Quat. Res. 2004, 62, 243–255. [Google Scholar] [CrossRef]
- Bookman, R.; Enzel, Y.; Agnon, A.; Stein, M. Late Holocene lake levels of the Dead Sea. Geol. Soc. Am. Bull. 2004, 116, 555–571. [Google Scholar] [CrossRef]
- Enzel, Y.; Bookman, R.; Sharon, D.; Gvirtzman, H.; Dayan, U.; Ziv, B.; Stein, M. Late Holocene climates of the Near East deduced from Dead Sea level variations and modem regional winter rainfall. Quat. Res. 2003, 60, 263–273. [Google Scholar] [CrossRef]
- de Vries, A.; Tyrlis, E.; Edry, D.; Krichak, S.; Steil, B.; Lelieveld, J. Extreme precipitation events in the Middle East: Dynamics of the Active Red Sea Trough. J. Geophys. Res. Atmos. 2013, 118, 7087–7108. [Google Scholar] [CrossRef] [Green Version]
- Kahana, R.; Ziv, B.; Enzel, Y.; Dayan, U. Synoptic climatology of major floods in the Negev Desert, Israel. Int. J. Climatol. 2002, 22, 867–882. [Google Scholar] [CrossRef] [Green Version]
- Stern, O. Geochemistry, Hydrology and Paleo-Hydrology of Ein Qedem Spring System; Report GSI/17/2010; Geologocal Survey of Israel: Jerusalem, Israel, 2010; p. 91. (In Hebrew) [Google Scholar]
- Kiro, Y.; Goldstein, S.L.; Garcia-Veigas, J.; Levy, E.; Kushnir, Y.; Stein, M.; Lazar, B. Relationships between lake-level changes and water and salt budgets in the Dead Sea during extreme aridities in the Eastern Mediterranean. Earth Planet. Sci. Lett. 2017, 464, 211–226. [Google Scholar] [CrossRef]
- Torfstein, A.; Goldstein, S.L.; Kushnir, Y.; Enzel, Y.; Haug, G.; Stein, M. Dead Sea drawdown and monsoonal impacts in the Levant during the last interglacial. Earth Planet. Sci. Lett. 2015, 412, 235–244. [Google Scholar] [CrossRef]
- Kitagawa, H.; Stein, M.; Goldstein, S.L.; Nakamura, T.; Lazar, B.; Party, D.S. Radiocarbon Chronology of the Dsddp Core at the Deepest Floor of the Dead Sea. Radiocarbon 2017, 59, 383–394. [Google Scholar] [CrossRef]
- Schilman, B.; Almogi-Labin, A.; Bar-Matthews, M.; Labeyrie, L.; Paterne, M.; Luz, B. Long- and short-term carbon fluctuations in the Eastern Mediterranean during the late Holocene. Geology. 2001, 29, 1099–1102. [Google Scholar] [CrossRef]
- Schilman, B.; Bar-Matthews, M.; Almogi-Labin, A.; Luz, B. Global climate instability reflected by Eastern Mediterranean marine records during the late Holocene. Palaeogeogr. Palaeocl. 2001, 176, 157–176. [Google Scholar] [CrossRef]
- Kolodny, Y.; Stein, M.; Machlus, M. Sea-Rain-Lake relation in the Last Glacial East Mediterranean revealed by a delta O-18-delta C-13 in Lake Lisan aragonites. Geochim. Cosmochim. Ac. 2005, 69, 4045–4060. [Google Scholar] [CrossRef]
- Eltahir, E.A.B.; Wang, G. Nilometers, El Nino, and climate variability. Geophys. Res. Lett. 1999, 26, 489–492. [Google Scholar] [CrossRef]
- Hassan, F.A. Historical Nile floods and their implications for climatic change. Science 1981, 212, 1142–1145. [Google Scholar] [CrossRef]
- Kondrashov, D.; Feliks, Y.; Ghil, M. Oscillatory modes of extended Nile River records (AD 622–1922). Geophys. Res. Lett. 2005, 32. [Google Scholar] [CrossRef]
- Toussoun, O. Mémoire sur l’histoire du Nil. Memoires de l’Institut d’Egypte 1925, 18, 366–404. [Google Scholar]
- Quinn, W.H. A study of Southern Oscillation-related climatic activity for AD 622–1900 incorporating Nile River flood data. In El Nino and the Southern Oscillation; Markgraf, H.F.D.a.V., Ed.; Cambridge University Press: Cambridge, UK, 1992; pp. 119–149. [Google Scholar]
- Steinhilber, F.; Beer, J.; Fröhlich, C. Total solar irradiance during the Holocene. Geophys. Res. Lett. 2009, 36, L19704. [Google Scholar] [CrossRef]
- Delaygue, G.; Bard, E. An Antarctic view of Beryllium-10 and solar activity for the past millennium. Clim. Dyn. 2011, 36, 2201–2218. [Google Scholar] [CrossRef]
- Vieira, L.E.A.; Solanki, S.K.; Krivova, N.A.; Usoskin, I.J.A. Evolution of the solar irradiance during the Holocene. Astron. Astrophys. 2011, 531, A6. [Google Scholar] [CrossRef]
- Cook, E.R.; Woodhouse, C.A.; Eakin, C.M.; Meko, D.M.; Stahle, D.W. Long-term aridity changes in the western United States. Science 2004, 306, 1015–1018. [Google Scholar] [CrossRef] [PubMed]
- Domínguez-Castro, F.; Vaquero, J.M.; Marín, M.; Gallego, M.C.; García-Herrera, R. How useful could Arabic documentary sources be for reconstructing past climate? Weather 2012, 67, 76–82. [Google Scholar] [CrossRef] [Green Version]
- Jones, P.D.; Briffa, K.R.; Osborn, T.J.; Lough, J.M.; van Ommen, T.D.; Vinther, B.M.; Luterbacher, J.; Wahl, E.R.; Zwiers, F.W.; Mann, M.E.; et al. High-resolution palaeoclimatology of the last millennium: A review of current status and future prospects. Holocene 2009, 19, 3–49. [Google Scholar] [CrossRef]
- Litt, T.; Ohlwein, C.; Neumann, F.H.; Hense, A.; Stein, M. Holocene climate variability in the Levant from the Dead Sea pollen record. Quaternary Sci Rev 2012, 49, 95–105. [Google Scholar] [CrossRef]
- Sorrel, P.; Popescu, S.M.; Klotz, S.; Suc, J.P.; Oberhansli, H. Climate variability in the Aral Sea basin (Central Asia) during the late Holocene based on vegetation changes. Quat. Res. 2007, 67, 357–370. [Google Scholar] [CrossRef]
- Xoplaki, E.; Fleitmann, D.; Luterbacher, J.; Wagner, S.; Haldon, J.F.; Zorita, E.; Telelis, I.; Toreti, A.; Izdebski, A. The Medieval Climate Anomaly and Byzantium: A review of the evidence on climatic fluctuations, economic performance and societal change. Quat. Sci. Rev. 2016, 136, 229–252. [Google Scholar] [CrossRef]
- Gray, L.J.; Beer, J.; Geller, M.; Haigh, J.D.; Lockwood, M.; Matthes, K.; Cubasch, U.; Fleitmann, D.; Harrison, G.; Hood, L.; et al. Solar Influences on Climate. Rev. Geophys. 2010, 48. [Google Scholar] [CrossRef]
- Lean, J.L. Cycles and trends in solar irradiance and climate. WIREs Clim. Chang. 2010, 1, 111–122. [Google Scholar] [CrossRef]
- Waple, A.M.; Mann, M.E.; Bradley, R.S. Long-term patterns of solar irradiance forcing in model experiments and proxy based surface temperature reconstructions. Clim. Dyn. 2002, 18, 563–578. [Google Scholar] [CrossRef]
- Thiéblemont, R.; Matthes, K.; Omrani, N.-E.; Kodera, K.; Hansen, F. Solar forcing synchronizes decadal North Atlantic climate variability. Nat. Commun. 2015, 6, 8268. [Google Scholar] [CrossRef] [PubMed] [Green Version]
- Breitenmoser, P.; Beer, J.; Broennimann, S.; Frank, D.; Steinhilber, F.; Wanner, H. Solar and volcanic fingerprints in tree-ring chronologies over the past 2000years. Palaeogeogr. Palaeoclimatol. Palaeoecol. 2012, 313, 127–139. [Google Scholar] [CrossRef]
- Solanki, S.K.; Usoskin, I.G.; Kromer, B.; Schüssler, M.; Beer, J. Unusual activity of the Sun during recent decades compared to the previous 11,000 years. Nature 2004, 431, 1084–1087. [Google Scholar] [CrossRef] [PubMed] [Green Version]
- Usoskin, I.; Solanki, S.; Kovaltsov, G. Grand minima and maxima of solar activity: New observational constraints. Astron. Astrophys. 2007, 471, 301–309. [Google Scholar] [CrossRef]
- Ruzmaikin, A.; Feynman, J.; Yung, Y.L. Is solar variability reflected in the Nile River? J. Geophys. Res.-Atmos. 2006, 111. [Google Scholar] [CrossRef] [Green Version]
- Meehl, G.A.; Arblaster, J.M.; Branstator, G.; van Loon, H. A coupled air-sea response mechanism to solar forcing in the Pacific region. J. Clim. 2008, 21, 2883–2897. [Google Scholar] [CrossRef]
- Meehl, G.A.; Arblaster, J.M.; Matthes, K.; Sassi, F.; van Loon, H. Amplifying the Pacific climate system response to a small 11-year solar cycle forcing. Science 2009, 325, 1114–1118. [Google Scholar] [CrossRef]
- van Loon, H.; Meehl, G.A.; Shea, D.J. Coupled air-sea response to solar forcing in the Pacific region during northern winter. J. Geophys. Res. 2007, 112, D02108. [Google Scholar] [CrossRef]
- Mann, M.E.; Cane, M.A.; Zebiak, S.E.; Clement, A. Volcanic and solar forcing of the tropical Pacific over the past 1000 years. J. Clim. 2005, 18, 447–456. [Google Scholar] [CrossRef]
- Chiang, J.C.H.; Sobel, A.H. Tropical tropospheric temperature variations caused by ENSO and their influence on the remote tropical climate. J. Clim. 2002, 15, 2616–2631. [Google Scholar] [CrossRef]
- Pomposi, C.; Giannini, A.; Kushnir, Y.; Lee, D.E. Understanding Pacific Ocean influence on interannual precipitation variability in the Sahel. Geophys. Res. Lett. 2016, 43, 9234–9242. [Google Scholar] [CrossRef]
- Giannini, A.; Biasutti, M.; Held, I.M.; Sobel, A.H. A global perspective on African climate. Clim. Chang. 2008, 90, 359–383. [Google Scholar] [CrossRef]
- Li, J.; Xie, S.-P.; Cook, E.R.; Huang, G.; D’Arrigo, R.; Liu, F.; Ma, J.; Zheng, X.-T. Interdecadal modulation of El Niño amplitude during the past millennium. Nat. Clim. Chang. 2011, 1, 114. [Google Scholar] [CrossRef]
- Cook, E.R.; Seager, R.; Cane, M.A.; Stahle, D.W. North American drought: Reconstructions, causes, and consequences. Earth-Science Reviews 2007, 81, 93–134. [Google Scholar] [CrossRef]
- Cook, E.R.; Seager, R.; Heim, R.R.; Vose, R.S.; Herweijer, C.; Woodhouse, C. Megadroughts in North America: placing IPCC projections of hydroclimatic change in a long-term palaeoclimate context. J. Quat. Sci. 2010, 25, 48–61. [Google Scholar] [CrossRef]
- Seager, R.; Kushnir, Y.; Herweijer, C.; Naik, N.; Velez, J. Modeling of tropical forcing of persistent droughts and pluvials over western North America: 1856-2000. J. Clim. 2005, 18, 4065–4088. [Google Scholar] [CrossRef]
- Haug, G.H.; Hughen, K.A.; Sigman, D.M.; Peterson, L.C.; Rohl, U. Southward migration of the intertropical convergence zone through the Holocene. Science 2001, 293, 1304–1308. [Google Scholar] [CrossRef]
- Haug, G.H.; Günther, D.; Peterson, L.C.; Sigman, D.M.; Hughen, K.A.; Aeschlimann, B. Climate and the Collapse of Maya Civilization. Science 2003, 299, 1731–1735. [Google Scholar] [CrossRef]
- Giannini, A.; Kushnir, Y.; Cane, M.A. Interannual variability of Caribbean rainfall, ENSO, and the Atlantic Ocean. J. Clim. 2000, 13, 297–311. [Google Scholar] [CrossRef]
- Kushnir, Y.; Seager, R.; Ting, M.; Naik, N.; Nakamura, J. Mechanisms of Tropical Atlantic SST Influence on North American Precipitation Variability. J. Clim. 2010, 23, 5610–5628. [Google Scholar] [CrossRef]
- Ineson, S.; Scaife, A.A.; Knight, J.R.; Manners, J.C.; Dunstone, N.J.; Gray, L.J.; Haigh, J.D. Solar forcing of winter climate variability in the Northern Hemisphere. Nat. Geosci. 2011, 4, 753–757. [Google Scholar] [CrossRef] [Green Version]
- Woollings, T.; Lockwood, M.; Masato, G.; Bell, C.; Gray, L. Enhanced signature of solar variability in Eurasian winter climate. Geophys. Res. Lett. 2010, 37. [Google Scholar] [CrossRef] [Green Version]
- Bond, G.; Kromer, B.; Beer, J.; Muscheler, R.; Evans, M.N.; Showers, W.; Hoffmann, S.; Lotti-Bond, R.; Hajdas, I.; Bonani, G. Persistent solar influence on north Atlantic climate during the Holocene. Science 2001, 294, 2130–2136. [Google Scholar] [CrossRef]
- Lockwood, M.; Rouillard, A.P.; Finch, I.D. The Rise and Fall of Open Solar Flux During the Current Grand Solar Maximum. Astrophys. J. 2009, 700, 937. [Google Scholar] [CrossRef]
- Lockwood, M. Reconstruction and Prediction of Variations in the Open Solar Magnetic Flux and Interplanetary Conditions. Living Rev. Sol. Phys. 2013, 10, 4. [Google Scholar] [CrossRef]
- Anet, J.G.; Rozanov, E.V.; Muthers, S.; Peter, T.; Brönnimann, S.; Arfeuille, F.; Beer, J.; Shapiro, A.I.; Raible, C.C.; Steinhilber, F.; et al. Impact of a potential 21st century “grand solar minimum” on surface temperatures and stratospheric ozone. Geophys. Res. Lett. 2013, 40, 4420–4425. [Google Scholar] [CrossRef] [Green Version]
- Ineson, S.; Maycock, A.C.; Gray, L.J.; Scaife, A.A.; Dunstone, N.J.; Harder, J.W.; Knight, J.R.; Lockwood, M.; Manners, J.C.; Wood, R.A. Regional climate impacts of a possible future grand solar minimum. Nat. Commun. 2015, 6, 7535. [Google Scholar] [CrossRef] [Green Version]
- Lockwood, M.; Harrison, R.G.; Owens, M.J.; Barnard, L.; Woollings, T.; Steinhilber, F. The solar influence on the probability of relatively cold UK winters in the future. Environ. Res. Lett. 2011, 6. [Google Scholar] [CrossRef]
- Martin-Puertas, C.; Matthes, K.; Brauer, A.; Muscheler, R.; Hansen, F.; Petrick, C.; Aldahan, A.; Possnert, G.; van Geel, B. Regional atmospheric circulation shifts induced by a grand solar minimum. Nat. Geosci. 2012, 5, 397–401. [Google Scholar] [CrossRef]
- Meehl, G.A.; Arblaster, J.M.; Marsh, D.R. Could a future “solar minimum” like the Maunder minimum stop global warming? Geophys. Res. Lett. 2013, 40. [Google Scholar] [CrossRef]
Figure 1.
Regional map of the Levant showing the geographical features discussed in Section 2 and Section 3 of the paper. The numbered bold dots indicate the locations of the paleoclimate archives discuss in Section 3: (1) Jableh (the location of the sediment core described in reference [3]; (2) The Dead Sea (the black dot is where the deep core discussed in references [4] and [5] was extracted); (3) The Soreq Cave [6]; (4) The marine sediment core [7]; (5) The Cairo Nilometer [8,9]. The figure was modified after Gasse et al. [10].

Figure 2.
(a) The climatological annual rainfall in the eastern Mediterranean (contours) superimposed on the region’s topography (colors). Contours are in mm year−1 drawn at uneven intervals to bring out the details in the rainfall poor areas. The isohyet of 200 mm year−1 is highlighted to separate between the part of the region under arid climate and the relatively wet Mediterranean or monsoon climates. (b) The difference between cold (October–March) and warm (April–September) season rainfall, emphasizing the seasonal partition of precipitation throughout the region. The zero contours are highlighted by a bold line. Precipitation annual totals are calculated from the gridded, 0.5°, 1901–2007 climatology, from the University of East Anglia, Climatic Research Unit. Topography data are from the 5-Minute Gridded Global Relief Data Collection (ETOPO5), World Data Service for Geophysics, Boulder.

Figure 3.
The trend in cold-season precipitation due to GHG forcing during the 20th century (colors and contours in mm decade−1). Calculated by projecting the annual, cold-season (November–April) precipitation between 1902 and 2009 on the time series of annual GHG radiative forcing during the same period. Precipitation is from the University of East Anglia, Climate Research Unit TS3.1 gridded data. Greenhous gas annual forcing time series is from the Goddard Institute of Space Studies, “Forcings in GISS Climate Model, Well-Mixed Greenhouse Gases Historical Data” web page (https://data.giss.nasa.gov/modelforce/ghgases/). For more information on the method used to calculate the trend see [15].

Figure 4.
(a) The solid black line depicts the late Holocene Dead Sea level record reconstructed from a survey of several shore areas and dated by 14C analysis of buried organic debris, as described in [27,47]. In dashed red lines are the modification made to the earlier curve after studying the Ein Kedem site that was exposed in recent lake level drops by [51]. The horizonal orange line marks the level of the Sill—a natural barrier that separates the lake into a deep northern part and shallow southern section. (b) The late Holocene smoothed curve of δ18O values measured in a Mediterranean sediment core close to the coast of southern Israel analyzed by Schilman et al. [55], together with the δ18O record retrieved from the Soreq Cave speleothems analyzed by Bar-Matthews and Ayalon [6]. Panel (a) is adapted from [42] and panel (b) from [7]. The time axis is in units of 1000 “years before present,” where the year 0 stands for 1950, 1 indicates the year 950 C.E., 2 is 50 B.C.E., etc.

Figure 5.
(a) Solar irradiance variations during the last millennium and a half. Shown are two estimates of total solar irradiance (TSI, scale in W m−2 on the left) based on 10Be concentration in ice cores according to [63] (in red) and [64] (in green). The blue line is the smoothed, reconstructed number of sunspots, based on 14C from tree rings according to [65] (scale on right). The times of the Oort and Wolf Grand Minima are indicated by blue vertical stripes. (b) The Nile flood record (solid line), smoothed to retain fluctuations with a period of 20 years and longer and the number of years in an 11-year window with flood levels in the lowest quartile of the distribution of annual levels recorded between A.D. 641 and A.D. 1470 (vertical bars). Also shown are years when period chronicles indicate droughts in Egypt according to [28] (brown squares) and in the years of cold winters in Iraq and Iran according to [29] and [28] (blue diamonds). (c) The number of wet years in a decade, in an area bounded by 22.5° N and 37.5° N and 125° W and 97.5° W, in Southwest US and northern Mexico, where El Niño has a marked influence on precipitation. The analysis is based on the North American Drought Atlas (NADA, [66]) gridded Palmer Drought Severity (PDSI) values (positive value indicates wet and negative is dry). Wet years are years with an area-averaged PDSI value > 1. The average PDSI value in the area indicated, varies between −2 and 2.

Figure 6.
In (b) is the regression of global SST on a time series representing monsoon season (June–September) rainfall in the Ethiopian Highlands, which contains the origins of the Blue Nile and Atbara River. The rainfall was averaged in the box: 30–38° E and 8–16° N and is shown in (a). Regression contours are drawn every 0.1 °C per one standard deviation of the rainfall time series. The area where the regression is significant (α ≤ 5%, two sided, based on the local correlation) is highlighted in color, with blue indicating negative and orange positive values. The darker the value the large is the significance.

Figure 7.
The relationship between (a) solar irradiance variations (from [64], in Wm−2), (b) Nile River summer flood level deviation from average at Roda Island, Cairo, Egypt (in inches) and (c) the concentration of Titanium (Ti, in %) in a sediment core extracted from the Cariaco Basin on the northern shelf of Venezuela (see [91]). In (c) we indicated along the right ordinate, the relation between Ti and the position of the ITCZ as argued in [91]. The transparent blue ribbons mark the time of the Oort and Wolf Grand Solar Minima). Time is in calendar years C.E.

Figure 8.
Decadal variations in winter (December–March) Central Asia sea level pressure in hPa (a), temperature in °C (b) and precipitation in mm/month (c) compared with the “11-year” cycle of Open Solar Flux in 1014 Wb (dotted red line in all three panels). Meteorological data were averages in the domains indicated in the figures.

© 2019 by the authors. Licensee MDPI, Basel, Switzerland. This article is an open access article distributed under the terms and conditions of the Creative Commons Attribution (CC BY) license (http://creativecommons.org/licenses/by/4.0/).
Share and Cite
MDPI and ACS Style
Kushnir, Y.; Stein, M. Medieval Climate in the Eastern Mediterranean: Instability and Evidence of Solar Forcing. Atmosphere 2019, 10, 29. https://doi.org/10.3390/atmos10010029
AMA Style
Kushnir Y, Stein M. Medieval Climate in the Eastern Mediterranean: Instability and Evidence of Solar Forcing. Atmosphere. 2019; 10(1):29. https://doi.org/10.3390/atmos10010029
Chicago/Turabian StyleKushnir, Yochanan, and Mordechai Stein. 2019. "Medieval Climate in the Eastern Mediterranean: Instability and Evidence of Solar Forcing" Atmosphere 10, no. 1: 29. https://doi.org/10.3390/atmos10010029
Note that from the first issue of 2016, this journal uses article numbers instead of page numbers. See further details here.