


Abstract
The position of the cotectic curve separating quartz and feldspar stability fields in the rhyolite system Qz–Ab–Or(–An–H2O) depends on pressure, making it a potential geobarometer applicable to high-silica volcanic products if melt water contents (H2Omelt) are known. Until recently, the applicability of this geobarometer has been limited because pressure effects can be largely obscured by the effects of nearly ubiquitous normative anorthite (An, CaAl2Si2O8) in rhyolitic melts. In this study, we present new phase equilibria data that allow us to constrain the position of thermal minima and quartz–sanidine–plagioclase triple points on the quartz–feldspar cotectic curves at various pressures and melt normative An contents. Data were derived by conducting crystallization experiments to determine phase relations at the following conditions: 200 MPa, 1·4 wt % H2Omelt, 3·5 wt % An; 200 MPa, 1·3 wt % H2Omelt, 7 wt % An; 500 MPa, 3 wt % H2Omelt, 3·5 wt % An; 500 MPa, 1·4 wt % H2Omelt, 3·5 wt % An; 500 MPa, 1·3 wt % H2Omelt, 7 wt % An. Using this dataset with published phase equilibria results, we present a geobarometer based on the main parameters influencing cotectic compositions in the rhyolitic system: pressure, H2Omelt and melt An content. Our new geobarometer DERP (DEtermining Rhyolite Pressures) is calibrated to calculate pressures of magma storage from cotectic glass compositions with up to 7 wt % normative melt An. DERP is calibrated for any H2Omelt in the pressure range 50–500 MPa. Its application is restricted to high-silica rhyolitic systems saturated with respect to quartz and feldspar(s). DERP was tested against various independent methods for estimating rhyolite pressures available in the literature (with an overall error of less than 100 MPa). Comparing pressures estimated with DERP and rhyolite-MELTS, which are based on the same approach, suggests that rhyolite-MELTS underestimates the effect of An.
INTRODUCTION
Rhyolitic volcanic products are often interpreted to result from explosive volcanism, which might have strong environmental impacts (e.g. Newhall & Self, 1982; Wilson & Walker, 1985; Fierstein & Hildreth, 1992; Bonadonna et al., 2005; Blundy & Cashman, 2008; Branney et al., 2008; Castro & Dingwell, 2009; Ellis et al., 2013). Eruptive style depends on magma ascent mechanisms, magma storage conditions such as temperature (T) and pressure (P), as well as compositional parameters such as melt volatile content. However, despite an excellent knowledge of rhyolite petrology, it is not trivial to obtain information on the pressure (or depth) of magma chambers in natural systems. Methods commonly applied are amphibole geothermobarometry (Anderson & Smith, 1995; Bachmann & Dungan, 2002; Ridolfi & Renzulli, 2012) and the calculation of fluid saturation pressures from melt inclusion compositions (e.g. Anderson et al., 1989; Anderson & Brown, 1993; Liu et al., 2006). However, Ca- and H2Omelt-poor rhyolites are devoid of amphibole. Furthermore, the application of the fluid saturation approach implies, besides fluid saturation of the investigated melt, that the H2O and CO2 content of glasses are representative of pre-eruptive storage conditions, which is not necessarily the case. Another approach in quartz-bearing volcanic rocks is to exploit the sensitivity of the titanium content of quartz to pressure and temperature, using the TitaniQ geothermobarometer (Thomas et al., 2010; Huang & Audétat, 2012). Titanium in quartz geobarometry is widely applied in rhyolitic systems, but its accuracy is still under debate (Thomas & Watson, 2012; Wilson et al., 2012; Thomas et al., 2015): the two models available yield very different results with the same input parameters (Thomas et al., 2010; Huang & Audétat, 2012). Regardless of which calculation model is applied, the TitaniQ approach also requires an accurate knowledge of T from independent geothermometers (see Putirka, 2008, for a review) and of the aTiO2 in the melt (Ghiorso & Evans, 2008; Ghiorso & Gualda, 2013; Kularatne & Audétat, 2014).
One alternative for constraining pressure in rhyolitic systems is to apply the phase relationships in rhyolitic systems. Phase diagrams in the haplogranite system quartz (Qz, SiO2)–albite (Ab, NaAlSi3O8)–orthoclase (Or, KAlSi3O8), considered as the best simplified system to interpret granites and rhyolites, have been investigated experimentally in detail for more than 60 years. In particular, early experiments at water-saturated conditions (e.g. Tuttle & Bowen, 1958; Luth et al., 1964; Luth, 1969; Steiner et al., 1975) showed that increasing pressure leads to a shift of the cotectic lines separating the quartz and feldspar primary fields away from the Qz apex (Fig. 1a). Thus, in a first approach, if the calculated CIPW normative Qz–Ab–Or content of a rhyolitic melt saturated with quartz and feldspar is plotted on the ternary diagram, it is thought that its position can be used to constrain the pressure at which those phases equilibrated. This procedure, usually referred to as the ternary projection, is widely used and the phase diagrams investigated at water-saturated conditions have been applied to estimate crystallization pressures in many rhyolitic systems (e.g. El-Sayed, 2003). However, it has been recognized for some years that the comparison of natural systems with the water-saturated Qz–Ab–Or system may not be valid for water-undersaturated and Ca-bearing rhyolitic systems (e.g. Nekvasil & Bunham, 1987; Nekvasil, 1988) and various alternatives have been proposed to constrain the depth of rhyolitic magma chambers (e.g. Blundy & Cashman, 2001; Almeev et al., 2012; Gualda & Ghiorso, 2013a, 2013b, 2014; Putirka et al., 2014; Bolte et al., 2015).
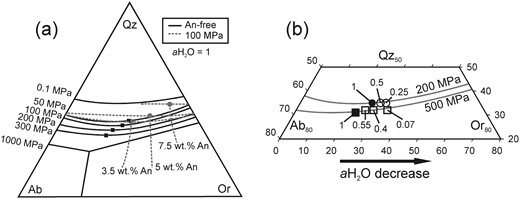
(a) Ternary projection of cotectic curves and minimum points at various pressures and normative melt An contents. Black squares and lines are free of An and differ only by pressure as noted in the diagram and contain data from Tuttle & Bowen (1958) and Luth et al. (1964). Grey circles and lines represent the effect of different amounts of normative melt An as noted in the diagram at 100 MPa constant P. Data from James & Hamilton (1969). (b) Ternary projection of An-free minimum points labeled with varying aH2O at 200 and 500 MPa (circles and squares respectively). Data from Tuttle & Bowen (1958), Holtz et al. (1992b) and Becker et al. (1998).
In recent years, the rhyolite-MELTS model (Gualda & Ghiorso, 2013a, 2014) has become a popular tool to predict the pressure dependence of cotectic compositions. Rather than relying on the haplogranite projection, rhyolite-MELTS uses a thermodynamic model calibrated on experiments in natural systems for its estimations (Gualda et al., 2012). Because of its broad applicability, rhyolite-MELTS is now widely used to constrain the magma storage conditions of rhyolitic magma chambers (e.g. Bégué et al., 2014a, 2014b; Gardner et al., 2014; Pamukcu et al., 2015).
Although the effect of pressure on the position of the water-saturated quartz–feldspar cotectic has been known for more than 60 years, using the early studies to constrain pressures in natural systems has remained difficult because the cotectic curve positions also vary as a function of melt H2O and normative anorthite content (An, CaAl2Si2O8). As explained by Nekvasil & Burnham (1987) and Nekvasil (1988), the shift of the thermal minimum point of the Qz–feldspar cotectic curve towards the Ab apex with increasing pressure in a water-saturated system, observed by Tuttle & Bowen (1958), is the result of two independent processes: the increase of pressure and the increase of water dissolved in the melt, owing to the higher melt water-solubility at higher pressures. A broad experimental database on the effect of water-undersaturation at constant pressure in the haplogranite system is available as a result of the increased attention this issue drew beginning in the early 1990s (Holtz et al., 1992b, 2001a; Pichavant et al., 1992; Becker et al., 1998; Kirschen & Pichavant, 2001). These studies confirmed that, whereas a decrease in pressure shifts the cotectic thermal minimum in the Qz–Ab–Or projection towards the Qz apex and reduces the size of the Qz stability field, a decrease in water activity reduces the Ab/(Ab + Or) ratio of the temperature minimum point on the Qz–feldspar cotectic curves with little to no observable effect on the Qz content (Fig. 1b). At higher pressures, where the sanidine stability field intersects with the Qz stability field to form a triple point with Qz, Ab, Or (and melt) being stable, a decrease in water activity will, in a similar manner, reduce the size of the sanidine stability field in favor of the albite stability field. However, all these experimental studies were carried out in the simplified haplogranite system containing only SiO2, Al2O3, Na2O and K2O, and their application to natural rhyolites, containing FeO and CaO as further major oxides, is hence restricted. This limitation was initially overcome by the experiments of James & Hamilton (1969), conducted in the quaternary system Qz–Ab–Or–An, which demonstrated that the presence of CaO leads to a shift of the Qz–plagioclase–sanidine triple point away from the Ab apex. The projection of Ca-bearing compositions from the quaternary system on the Qz–Ab–Or-plane, and especially of surfaces in which plagioclase and quartz, plagioclase and sanidine, and sanidine and quartz are coexisting reveals effects comparable with yet not similar to the effect of changing pressure, as illustrated in Fig. 1a. With increasing An content, the shift of the projected two phase surfaces, hereafter addressed as cotectic curves for given An contents, is similar to the effect of decreasing pressure in the system Qz–Ab–Or (Fig. 1a). Therefore, these observations indicate that the well-known pressure dependence of the cotectic curves in the haplogranite system cannot directly be implemented for the description of natural rhyolites. Blundy & Cashman (2001) proposed a correction that accounts for normative melt An to overcome this issue that relies mainly on the three phase diagrams determined by James & Hamilton (1969) at 100 MPa and water-saturated conditions.
Although the correction proposed by Blundy & Cashman (2001) improved the accuracy of pressure determination from cotectic compositions significantly, recent experimental results from Wilke et al. (2015) indicate that this approach, based on the experimental database of James & Hamilton (1969), obtained only at 100 MPa and more importantly under water-saturated conditions, is insufficient to establish an accurate geobarometer from the composition of Ca-bearing cotectic melts. In particular, it is known that the effect of water activity plays a significant role in the composition of plagioclase (e.g. Lange et al., 2009), which may affect the primary plagioclase field and cotectic positions in the system Qz–Ab–Or–An–H2O.
In this study, we first determine the Qz–Ab–Or proportions of cotectic melts (melts coexisting with quartz and one feldspar) and of piercing points in water-undersaturated, Ca-bearing rhyolitic systems with fixed An contents and water activity. We discuss six sections in the quaternary systems Qz–Ab–Or–An established at 200 and 500 MPa, at several low water activities [equivalent to bulk H2O contents of ∼1·3 and 3 wt %, calculated with the model of Burnham (1979)] and for normative melt An contents of 3·5 and 7 wt %. The results can be directly applied to water-poor high-temperature rhyolitic systems such as those observed in the Snake River Plain, USA (e.g. Bonnichsen et al., 2008; Branney et al., 2008; Almeev et al., 2012; Ellis et al., 2013). Our results, combined with those of previous studies, are then used to propose an empirical approach for determining magma storage pressure from the composition of melts in equilibrium with quartz and feldspar(s). Of central importance to this task is knowing the position of the temperature minimum point on the quartz–feldspar cotectic curve at defined conditions. At conditions in which two feldspar phases are stable, this minimum point coincides with the intersection of the quartz–feldspar and the plagioclase–sanidine cotectic curves and becomes a triple point. In the H2O-free haplogranite system under a pressure high enough to stabilize sanidine and Ab-rich feldspar, the triple point becomes a eutectic point. The effects of pressure and water activity on the position of the triple point or of the thermal minimum for complex compositions (especially Ca-bearing systems) projected into the ternary Qz–Ab–Or system are described in this study. To reduce drastically the potential for semantic confusion, whenever a statement concerns both kind of points, we will subsequently refer to them as minimum points and make a finer distinction only when necessary for understanding.
STARTING MATERIALS AND EXPERIMENTAL PROCEDURE
For investigating phase relationships in multicomponent systems, such as the system Qz–Ab–Or–An(–H2O), the extent of fields of primary phases, as well as the positions of cotectic curves and their minimum points, can be constrained best by performing crystallization experiments using different starting compositions and by focusing on the identification of the liquidus phase and temperature of each composition. In this study, phase equilibria obtained at 200 and 500 MPa were determined for compositions containing 3·5 wt % An and 1·4 wt % H2O (Table 1, conditions A and D), at 500 MPa for compositions containing 3·5 wt % An and 3 wt % H2O (Table 1, conditions C), and at 200 and 500 MPa for compositions containing 7 wt % An and 1·3 wt % H2O (Table 1, conditions B and E). An additional set of phase equilibria obtained at 200 MPa for compositions with 3·5 wt % An and 3 wt % H2O was investigated at 200 MPa by Wilke et al. (2015) and is listed in Table 1 as conditions F, as it closely complements the experiments of this study.
List of investigated conditions
| No. | P (MPa) | H2O (wt %) | An (wt %)* | SM† |
|---|---|---|---|---|
| A | 200 | 1·4 | 3·5 | HYW |
| B | 200 | 1·3 | 7·0 | HYS |
| C | 500 | 3·0 | 3·5 | REF‡ |
| D | 500 | 1·4 | 3·5 | HYW |
| E | 500 | 1·3 | 7·0 | HYS |
| F‡ | 200 | 3·0 | 3·5 | REF‡ |
| No. | P (MPa) | H2O (wt %) | An (wt %)* | SM† |
|---|---|---|---|---|
| A | 200 | 1·4 | 3·5 | HYW |
| B | 200 | 1·3 | 7·0 | HYS |
| C | 500 | 3·0 | 3·5 | REF‡ |
| D | 500 | 1·4 | 3·5 | HYW |
| E | 500 | 1·3 | 7·0 | HYS |
| F‡ | 200 | 3·0 | 3·5 | REF‡ |
Small amounts of FeO (1–2·5 wt %) and TiO2 (0·2–0·4 wt %) were added to the starting compositions to better simulate conditions close to natural rhyolites. The concentrations were chosen to be in the same range as those observed in the Snake River Plain (Almeev et al., 2012; Bolte et al., 2015) because this study was primarily undertaken to constrain magma storage depths for such highly explosive, high-temperature, water-undersaturated rhyolites. For each set of phase equilibria determined at the conditions A–F, experiments using different starting materials with different Qz–Ab–Or ratios were carried out at various temperatures. The primary goal of the experiments was to constrain the liquidus temperature and the liquidus phase of each composition. Hydrated glass powders with known H2O concentrations were used as starting materials (see determination technique below); no further volatile components were added to the experimental capsules. Because the relevant experiments for bracketing liquidus temperatures are either crystal free (above liquidus) or contain very small crystal contents (just below the liquidus), the melt water content at which the first crystals are detected is almost identical to that of the starting pre-hydrated glasses. This approach was applied to obtain sets of phase equilibria at well-constrained water contents and differs from previous studies on phase relations in the system Qz–Ab–Or(–An–H2O) (Tuttle & Bowen, 1958; Luth et al., 1964; James & Hamilton, 1969; Manning, 1981; Pichavant, 1987; Holtz et al., 1992b). In these previous studies, either gels or dry glasses were used and volatiles were added to the capsules to ensure the presence of a fluid phase. For experiments at water-saturated conditions, this means of adding volatiles was not problematic, as water activity is unity in the presence of an excess of water. To achieve water-undersaturated conditions, CO2 was added to reduce the water activity of the fluid phase. However, to avoid high proportions of a fluid phase in the capsule, which would lead to incongruent dissolution of silicates into the fluid phase and would modify the melt composition, only small amounts of CO2 and H2O could be added (see Holtz et al., 1992b, fig. 1), leading to a large uncertainty in water activity. In this study, we thus preferred to apply a fluid-absent approach, in which the water activity could be held constant (apart from a slight increase owing to the formation of water-free minerals) for a series of experiments by preparing hydrous glasses with well-characterized H2O concentrations.
Starting glasses were synthesized by mixing oxide (SiO2, TiO2, Al2O3, Fe2O3) and carbonate (CaCO3, Na2CO3, K2CO3) powders in the desired proportions and melting them twice at 1600°C in a 1 atm furnace using a platinum crucible. Each melting step was followed by crushing the derived glass in a steel mortar and then grinding it in an agate mortar. Dry glass powders were then sealed with the desired amount of H2O by arc welding in Au80Pd20 capsules (30 mm in length and 6 mm in diameter). To generate hydrous starting materials, the capsules were held at 1200°C and 200 MPa for 24 h in an internally heated pressure vessel [IHPV; see Berndt et al. (2002) for description] pressurized with Ar. A slow-speed saw was used to cut the top and bottom parts of each hydrous glass cylinder to check for homogeneity in major element and H2O contents. The remainder of each pre-hydrated glass cylinder was once more crushed and ground as described above and then used as a starting material for the crystallization experiments.
A total of 26 different starting compositions containing ∼1·3 wt % H2O were synthesized for this study (Tables 2–6; Supplementary Data Appendix Table 1; supplementary data are available for downloading at http://www.petrology.oxfordjournals.org). Eighteen of these starting compositions, named HYS1–HYS8, HYS15–HYS21 and HYS23–HYS25, contain 7 wt % An, 2·5 wt % FeO and 0·4 wt % TiO2. These compositions were used to constrain phase equilibria at 200 and 500 MPa for the conditions B and E (Table 1). The remaining eight compositions, named HYW1–HYW8, contain 3·5 wt % An, 1 wt % FeO and 0·2 wt % TiO2. The FeO and TiO2 contents were lower than for the compositions with 7 wt % An, considering that the expected liquidus temperatures were lower and that less Fe and Ti is incorporated in melts at lower T. HYW compositions were used for phase equilibria at 200 and 500 MPa at conditions A and D (Table 1). For one set of phase equilibria at 500 MPa, experiments were conducted with glasses synthesized and described in the study of Wilke et al. (2015) (AC50, BA5, BC5, BD25, C, DC5 and D), containing ∼3 wt % H2O and 3·5 wt % normative An (conditions C in Table 1). The starting glasses for these experiments contained 1 wt % FeO and 0·2 wt % TiO2. The water concentration of the starting materials designed to contain 1·3 wt % H2O and 3 wt % H2O is in the range 1·35 ± 0·15 wt % and 2·95 ± 0·50 wt % H2O. The exact water concentration of each composition is given in Tables 2–6 (for details see also Supplementary Data).
Experimental run products at conditions A (200 MPa)
| Run | t | T | Products | H2O | melt | feldspar | ||||||
|---|---|---|---|---|---|---|---|---|---|---|---|---|
| (h) | (°C) | (wt %) | Qz | Ab | Or | An | Cor* | Ab | Or | An | ||
| HYW1 | 24 | 1200 | start glass | 1·32 | 45·3 | 26·5 | 21·5 | 3·5 | 0·2 | |||
| YX98 | 286 | 960 | qtz | 38·0 | 31·4 | 25·0 | 3·1 | –0·1 | ||||
| YX90 | 310 | 930 | qtz, plg | 40·6 | 29·6 | 23·1 | 3·9 | 0·1 | n.p. | |||
| YX122 | 275 | 900 | qtz, plg | 37·2 | 28·4 | 26·5 | 2·9 | 0·3 | n.p. | |||
| YX130 | 340 | 870 | qtz, plg | 36·0 | 28·1 | 28·7 | 2·4 | 0·1 | n.p. | |||
| HYW2 | 24 | 1200 | start glass | 1·55 | 44·4 | 9·8 | 38·5 | 3·4 | 0·1 | |||
| YX99 | 286 | 960 | qtz | 42·7 | 10·1 | 39·9 | 3·8 | 0·1 | ||||
| YX91 | 310 | 930 | qtz | 40·8 | 10·8 | 41·6 | 3·8 | 0·2 | ||||
| YX123 | 275 | 900 | qtz | 41·0 | 10·0 | 41·1 | 3·5 | 0·3 | ||||
| YX131 | 340 | 870 | qtz, san | 39·1 | 10·4 | 42·5 | 3·6 | 0·5 | 11·4 | 87·4 | 1·2 | |
| HYW3 | 24 | 1200 | start glass | 1·18 | 26·5 | 19·4 | 47·2 | 3·4 | 0·2 | |||
| YX100 | 286 | 960 | — | 27·9 | 19·6 | 46·8 | 3·6 | 0·3 | ||||
| YX92 | 310 | 930 | san | 29·9 | 19·8 | 44·0 | 3·6 | 0·2 | 23·2 | 71·8 | 5·0 | |
| YX124 | 275 | 900 | san | 33·2 | 18·1 | 40·8 | 3·4 | 0·6 | 21·2 | 75·5 | 3·3 | |
| YX132 | 340 | 870 | san | 37·3 | 17·3 | 38·6 | 2·8 | 0·6 | 22·3 | 74·4 | 3·3 | |
| HYW4 | 24 | 1200 | start glass | 1·45 | 40·7 | 0·0 | 52·0 | 3·4 | 0·8 | |||
| YX101 | 286 | 960 | — | 41·1 | 0·0 | 51·2 | 3·4 | 1·0 | ||||
| YX93 | 310 | 930 | — | 40·9 | 0·0 | 50·9 | 3·5 | 1·0 | ||||
| YX125 | 275 | 900 | qtz | 41·7 | 0·0 | 50·3 | 3·4 | 1·1 | ||||
| YX133 | 340 | 870 | qtz, san | 41·0 | 0·0 | 50·7 | 3·6 | 1·2 | 0·0 | 98·8 | 1·2 | |
| HYW5 | 24 | 1200 | start glass | 1·32 | 36·1 | 23·7 | 34·3 | 3·3 | 0·1 | |||
| YX102 | 286 | 960 | — | 35·3 | 24·0 | 34·6 | 3·5 | 0·0 | ||||
| YX94 | 310 | 930 | plg | 35·7 | 23·9 | 34·4 | 3·5 | 0·0 | n.p. | |||
| YX126 | 275 | 900 | qtz, plg | 36·6 | 21·6 | 35·0 | 2·7 | 0·4 | n.p. | |||
| YX134 | 340 | 870 | qtz, plg | 36·3 | 21·4 | 35·6 | 2·4 | 0·4 | 57·4 | 21·0 | 21·6 | |
| HYW6 | 24 | 1200 | start glass | 1·39 | 36·0 | 14·4 | 42·7 | 3·5 | 0·2 | |||
| YX103 | 286 | 960 | — | 36·5 | 14·6 | 42·4 | 3·4 | 0·2 | ||||
| YX95 | 310 | 930 | — | 36·2 | 14·8 | 43·0 | 3·4 | –0·1 | ||||
| YX127 | 275 | 900 | — | 37·0 | 14·0 | 41·9 | 3·4 | 0·4 | ||||
| YX135 | 340 | 870 | qtz, san | 37·4 | 13·7 | 42·3 | 3·4 | 0·4 | 15·6 | 80·8 | 3·6 | |
| HYW7 | 24 | 1200 | start glass | 1·52 | 43·1 | 5·0 | 44·9 | 3·4 | 0·6 | |||
| YX104 | 286 | 960 | — | 43·6 | 5·2 | 44·3 | 3·4 | 0·6 | ||||
| YX96 | 310 | 930 | qtz | 41·6 | 5·7 | 45·9 | 3·6 | 0·4 | ||||
| YX128 | 275 | 900 | qtz | 41·4 | 5·1 | 45·5 | 3·6 | 0·7 | ||||
| YX136 | 340 | 870 | qtz | 40·0 | 5·1 | 47·1 | 3·5 | 0·7 | ||||
| HYW8 | 24 | 1200 | start glass | 1·16 | 28·2 | 39·2 | 26·0 | 3·2 | 0·5 | |||
| YX105 | 286 | 960 | plg | 27·5 | 40·3 | 27·2 | 2·3 | –0·1 | 74·4 | 7·9 | 17·7 | |
| YX97 | 310 | 930 | plg | 30·1 | 37·4 | 28·1 | 1·8 | 0·0 | n.p. | |||
| YX129 | 275 | 900 | plg | 34·7 | 31·3 | 28·3 | 1·8 | 0·5 | n.p. | |||
| YX137 | 340 | 870 | qtz, plg | 34·7 | 32·1 | 28·1 | 1·8 | 0·3 | n.p. | |||
Qz, normative quartz content; Ab, normative anorthite; Or, normative orthoclase; An, normative anorthite; Cor, normative corundum; qtz, quartz minerals present in the sample; plg, plagioclase minerals present; san, sanidine; n.p., not possible.
*Negative corundum values reflect the amount of Cor that is missing to convert all available CaO to An.
Experimental run products in conditions B (200 MPa)
| Run | t | T | Products | H2O | melt | feldspar | ||||||
|---|---|---|---|---|---|---|---|---|---|---|---|---|
| (h) | (°C) | (wt %) | Qz | Ab | Or | An | Cor* | Ab | Or | An | ||
| HYS1 | 24 | 1200 | start glass | 1·23 | 36·7 | 32·0 | 18·8 | 6·9 | 0·0 | |||
| YX25 | 168 | 1020 | — | 38·4 | 32·0 | 18·3 | 7·3 | 0·0 | ||||
| YX17 | 168 | 990 | plg | 38·5 | 30·9 | 20·1 | 6·9 | 0·0 | 55·2 | 2·6 | 42·2 | |
| YX9 | 180 | 960 | qtz, plg | 38·7 | 29·9 | 22·0 | 5·0 | 0·2 | 62·7 | 4·2 | 33·1 | |
| YX1 | 157 | 930 | qtz, plg | 36·4 | 29·9 | 24·3 | 4·3 | 0·1 | 65·7 | 6·2 | 28·1 | |
| HYS2 | 24 | 1200 | start glass | 1·27 | 37·2 | 12·0 | 39·2 | 6·6 | 0·1 | |||
| YX26 | 168 | 1020 | — | 37·0 | 12·7 | 40·1 | 6·4 | –0·2 | ||||
| YX18 | 168 | 990 | — | 37·5 | 12·4 | 39·4 | 6·6 | –0·2 | ||||
| YX10 | 180 | 960 | — | 37·7 | 11·7 | 39·2 | 6·8 | –0·1 | ||||
| YX2 | 157 | 930 | plg | 37·5 | 11·8 | 39·4 | 6·5 | –0·1 | 30·5 | 5·8 | 63·7 | |
| HYS3 | 24 | 1200 | start glass | 1·44 | 25·3 | 19·9 | 44·2 | 6·6 | 0·4 | |||
| YX27 | 168 | 1020 | plg | 25·0 | 21·0 | 43·9 | 6·7 | 0·2 | n.p. | |||
| YX19 | 168 | 990 | plg | 25·2 | 19·7 | 43·9 | 6·8 | 0·4 | 38·6 | 7·6 | 53·8 | |
| YX11 | 180 | 960 | plg | 26·0 | 19·0 | 45·2 | 5·3 | 0·2 | 43·7 | 12·3 | 44·0 | |
| YX3 | 157 | 930 | plg | 27·0 | 18·7 | 45·5 | 4·7 | 0·2 | 44·7 | 16·0 | 39·3 | |
| HYS4 | 24 | 1200 | start glass | 1·00 | 37·2 | 21·6 | 29·5 | 6·7 | 0·0 | |||
| YX28 | 168 | 1020 | — | 38·7 | 21·8 | 29·2 | 7·2 | 0·0 | ||||
| YX20 | 168 | 990 | — | 38·5 | 21·1 | 29·3 | 7·1 | 0·1 | ||||
| YX12 | 180 | 960 | qtz, plg | 38·1 | 21·2 | 30·3 | 5·9 | –0·1 | 47·3 | 4·7 | 48·0 | |
| YX4 | 157 | 930 | qtz, plg | 37·0 | 20·5 | 33·4 | 4·5 | 0·0 | 52·4 | 8·0 | 39·6 | |
| HYS5 | 24 | 1200 | start glass | 1·34 | 30·3 | 16·4 | 41·0 | 6·9 | 0·1 | |||
| YX29 | 168 | 1020 | — | 31·4 | 16·2 | 41·6 | 6·9 | 0·1 | ||||
| YX21 | 168 | 990 | — | 31·6 | 15·3 | 41·6 | 7·0 | 0·2 | ||||
| YX13 | 180 | 960 | plg | 31·9 | 15·3 | 41·7 | 6·9 | 0·2 | 32·8 | 6·2 | 61·0 | |
| YX5 | 157 | 930 | plg | 32·4 | 15·4 | 42·7 | 5·8 | 0·2 | 37·7 | 7·5 | 54·8 | |
| HYS6 | 24 | 1200 | start glass | 1·12 | 15·7 | 46·7 | 26·5 | 6·8 | 0·0 | |||
| YX30 | 168 | 1020 | plg | 16·8 | 47·2 | 28·2 | 4·9 | –0·4 | 67·3 | 7·5 | 25·2 | |
| YX22 | 168 | 990 | plg | 18·7 | 42·6 | 29·9 | 4·8 | –0·1 | 69·9 | 9·0 | 21·1 | |
| YX14 | 180 | 960 | plg | 20·4 | 40·6 | 31·0 | 4·2 | –0·1 | 70·8 | 11·5 | 17·7 | |
| YX6 | 157 | 930 | plg | 21·8 | 38·1 | 31·5 | 3·3 | –0·3 | 71·5 | 13·5 | 15·0 | |
| HYS7 | 24 | 1200 | start glass | 1·32 | 20·8 | 32·3 | 35·1 | 6·9 | 0·3 | |||
| YX31 | 168 | 1020 | plg | 20·8 | 34·3 | 35·8 | 6·4 | 0·0 | 53·7 | 6·3 | 40·0 | |
| YX23 | 168 | 990 | plg | 22·2 | 31·1 | 36·9 | 5·6 | 0·3 | 56·6 | 11·3 | 32·1 | |
| YX15 | 180 | 960 | plg | 22·4 | 30·4 | 37·6 | 5·0 | 0·0 | 59·8 | 14·7 | 25·5 | |
| YX7 | 157 | 930 | plg | 23·4 | 29·2 | 38·0 | 4·2 | –0·1 | 60·4 | 17·0 | 22·6 | |
| HYS8 | 24 | 1200 | start glass | 1·34 | 27·8 | 37·7 | 23·0 | 7·0 | 0·3 | |||
| YX32 | 168 | 1020 | — | 27·5 | 40·4 | 23·4 | 6·5 | –0·2 | ||||
| YX24 | 168 | 990 | plg | 30·2 | 36·3 | 24·3 | 5·6 | 0·5 | 62·6 | 4·9 | 32·5 | |
| YX16 | 180 | 960 | plg | 30·1 | 35·2 | 25·0 | 5·1 | 0·2 | 67·4 | 6·1 | 26·5 | |
| YX8 | 157 | 930 | plg | 31·3 | 34·0 | 25·8 | 4·4 | 0·0 | 67·2 | 5·7 | 27·1 | |
| HYS15 | 24 | 1200 | start glass | 1·32 | 45·5 | 17·1 | 26·4 | 6·7 | 0·2 | |||
| DYX9 | 161 | 1020 | qtz | 44·1 | 17·8 | 26·7 | 7·4 | 0·1 | ||||
| DYX5 | 164 | 990 | qtz | 43·0 | 17·6 | 27·3 | 7·5 | 0·2 | ||||
| DYX1 | 187 | 960 | qtz, plg | 39·8 | 18·6 | 30·7 | 5·9 | 0·0 | n.p. | |||
| HYS16 | 24 | 1200 | start glass | 1·38 | 49·3 | 0·0 | 39·0 | 6·8 | 0·1 | |||
| DYX10 | 161 | 1020 | qtz | 46·4 | 0·0 | 40·4 | 7·6 | 0·2 | ||||
| DYX6 | 164 | 990 | qtz | 45·9 | 0·0 | 42·2 | 7·6 | 0·2 | ||||
| DYX2 | 187 | 960 | qtz, plg | 42·4 | 0·0 | 45·3 | 7·0 | 0·1 | n.p. | |||
| HYS17 | 24 | 1200 | start glass | 1·49 | 43·1 | 6·3 | 39·5 | 6·5 | –0·1 | |||
| DYX11 | 161 | 1020 | — | 43·3 | 6·1 | 38·8 | 7·1 | 0·1 | ||||
| DYX7 | 164 | 990 | — | 43·1 | 6·2 | 38·4 | 7·1 | –0·1 | ||||
| DYX3 | 187 | 960 | qtz | 41·3 | 6·5 | 40·0 | 7·1 | –0·1 | ||||
| HYS18 | 24 | 1200 | start glass | 1·36 | 36·7 | 0·0 | 52·2 | 6·8 | 0·0 | |||
| DYX12 | 161 | 1020 | — | 37·2 | 0·0 | 51·6 | 7·1 | 0·1 | ||||
| DYX8 | 164 | 990 | — | 37·3 | 0·0 | 51·2 | 7·2 | 0·1 | ||||
| DYX4 | 187 | 960 | plg | 36·9 | 0·0 | 51·7 | 6·9 | 0·0 | n.p. | |||
Qz, normative quartz content; Ab, normative anorthite; Or, normative orthoclase; An, normative anorthite; Cor, normative corundum; qtz, quartz minerals present in the sample; plg, plagioclase minerals present; n.p., not possible.
*Negative corundum values reflect the amount of Cor that is missing to convert all available CaO to An.
Experimental run products at conditions C (500 MPa)
| Run | t | T | Products | H2O | melt | feldspar | ||||||
|---|---|---|---|---|---|---|---|---|---|---|---|---|
| (h) | (°C) | (wt %) | Qz | Ab | Or | An | Cor | Ab | Or | An | ||
| AC7 | 24 | 1040 | start glass | 2·73 | 39·6 | 13·9 | 37·9 | 3·4 | 0·7 | |||
| YX81 | 286 | 930 | qtz | 36·5 | 14·3 | 42·4 | 3·4 | 0·3 | ||||
| YX57 | 261 | 900 | qtz | 36·7 | 14·1 | 40·7 | 3·4 | 0·3 | ||||
| YX73 | 196 | 870 | qtz, san | 34·7 | 15·9 | 38·6 | 4·6 | 0·5 | 15·2 | 83·2 | 1·6 | |
| AC5 | 24 | 1040 | start glass | 2·76 | 35·6 | 14·2 | 42·2 | 3·3 | 0·2 | |||
| YX58 | 261 | 900 | — | 35·6 | 14·2 | 42·2 | 3·3 | 0·2 | ||||
| YX74 | 196 | 870 | qtz, san | 34·4 | 14·0 | 43·7 | 3·4 | 0·2 | 11·2 | 88·1 | 0·7 | |
| BA5 | 24 | 1040 | start glass | 3·10 | 44·1 | 24·6 | 27·0 | 3·4 | 0·8 | |||
| YX83 | 286 | 930 | qtz | 39·8 | 22·9 | 28·7 | 3·4 | 0·7 | ||||
| YX59 | 261 | 900 | qtz | 36·4 | 25·0 | 29·3 | 3·6 | 0·4 | ||||
| YX75 | 196 | 870 | qtz | 34·9 | 24·5 | 31·0 | 3·8 | 0·5 | ||||
| BC5 | 24 | 1040 | start glass | 2·95 | 36·7 | 23·3 | 32·4 | 3·2 | 0·7 | |||
| YX84 | 286 | 930 | — | 36·7 | 23·3 | 32·4 | 3·2 | 0·7 | ||||
| YX60 | 261 | 900 | qtz | 35·3 | 24·1 | 32·2 | 3·4 | 0·4 | ||||
| YX76 | 196 | 870 | qtz | 33·9 | 23·9 | 33·8 | 3·4 | 0·5 | ||||
| BC25 | 24 | 1040 | start glass | 3·42 | 32·8 | 19·5 | 39·4 | 3·3 | 0·3 | |||
| YX61 | 261 | 900 | — | 32·8 | 19·5 | 39·4 | 3·3 | 0·3 | ||||
| YX77 | 196 | 870 | — | 32·4 | 19·6 | 40·5 | 3·3 | 0·2 | ||||
| C | 24 | 1040 | start glass | 2·95 | 29·3 | 15·2 | 47·8 | 3·3 | 0·2 | |||
| YX85 | 286 | 930 | — | 29·3 | 15·2 | 47·8 | 3·3 | 0·2 | ||||
| YX62 | 261 | 900 | san | 30·1 | 15·3 | 46·3 | 3·3 | 0·2 | 11·4 | 87·7 | 0·9 | |
| YX78 | 196 | 870 | san | 32·3 | 15·1 | 44·1 | 3·6 | 0·2 | 11·8 | 87·5 | 0·7 | |
| DC5 | 24 | 1040 | start glass | 2·81 | 30·7 | 27·7 | 32·8 | 3·4 | 0·6 | |||
| YX63 | 261 | 900 | — | 30·7 | 27·7 | 32·8 | 3·4 | 0·6 | ||||
| YX79 | 196 | 870 | plg | 30·2 | 27·3 | 34·0 | 3·3 | 0·4 | 62·2 | 20·0 | 17·8 | |
| D | 24 | 1040 | start glass | 2·66 | 34·1 | 42·3 | 18·7 | 3·6 | 1·3 | |||
| YX86 | 286 | 930 | plg | 32·8 | 39·7 | 19·3 | 3·1 | 1·2 | 75·9 | 3·9 | 20·2 | |
| YX64 | 261 | 900 | plg | 34·0 | 37·7 | 20·3 | 2·5 | 1·0 | 79·4 | 5·8 | 14·8 | |
| YX80 | 196 | 870 | qtz, plg | 33·5 | 36·3 | 22·0 | 2·2 | 0·8 | 82·4 | 6·3 | 11·3 | |
Qz, normative quartz content; Ab, normative anorthite; Or, normative orthoclase; An, normative anorthite; Cor, normative corundum; qtz, quartz minerals present in the sample; plg, plagioclase minerals present; san, sanidine.
Experimental run products at conditions D (500 MPa)
| Run | t | T | Products | H2O | melt | feldspar | ||||||
|---|---|---|---|---|---|---|---|---|---|---|---|---|
| (h) | (°C) | (wt %) | Qz | Ab | Or | An | Cor* | Ab | Or | An | ||
| HYW1 | 24 | 1200 | start glass | 1·32 | 45·3 | 26·5 | 21·5 | 3·5 | 0·2 | |||
| YX114 | 213 | 1050 | qtz | 40·5 | 29·1 | 23·4 | 3·9 | 0·4 | ||||
| YX106 | 214 | 1020 | qtz | 36·5 | 32·3 | 24·6 | 4·0 | 0·0 | ||||
| YX138 | 280 | 990 | qtz | 35·6 | 31·2 | 25·3 | 4·1 | 0·3 | ||||
| HYW2 | 24 | 1200 | start glass | 1·55 | 44·4 | 9·8 | 38·5 | 3·4 | 0·1 | |||
| YX115 | 213 | 1050 | qtz | 42·0 | 9·9 | 40·0 | 3·8 | 0·4 | ||||
| YX107 | 214 | 1020 | qtz | 39·7 | 10·8 | 42·0 | 4·0 | 0·3 | ||||
| YX139 | 280 | 990 | qtz | 38·1 | 10·6 | 43·6 | 3·9 | 0·4 | ||||
| HYW3 | 24 | 1200 | start glass | 1·18 | 26·5 | 19·4 | 47·2 | 3·4 | 0·2 | |||
| YX116 | 213 | 1050 | — | 41·7 | 0·5 | 50·5 | 3·3 | 1·0 | ||||
| YX108 | 214 | 1020 | — | 27·7 | 19·3 | 46·9 | 3·4 | 0·2 | ||||
| YX140 | 280 | 990 | san | 28·6 | 18·4 | 46·0 | 3·5 | 0·6 | 17·9 | 79·1 | 3·0 | |
| YX158 | 230 | 960 | san | 32·7 | 18·7 | 42·4 | 3·5 | 0·5 | 21·9 | 75·9 | 2·2 | |
| YX166 | 257 | 930 | qtz, san | 33·1 | 18·8 | 40·6 | 3·7 | 0·6 | 24·9 | 70·2 | 4·9 | |
| HYW4 | 24 | 1200 | start glass | 1·45 | 40·7 | 0·0 | 52·0 | 3·4 | 0·8 | |||
| YX117 | 213 | 1050 | — | 41·7 | 0·5 | 51·1 | 3·3 | 0·9 | ||||
| YX109 | 214 | 1020 | — | 41·4 | 0·4 | 51·2 | 3·3 | 0·9 | ||||
| YX141 | 280 | 990 | qtz | 40·0 | 0·5 | 52·5 | 3·4 | 1·0 | ||||
| HYW5 | 24 | 1200 | start glass | 1·32 | 36·1 | 23·7 | 34·3 | 3·3 | 0·1 | |||
| YX118 | 213 | 1050 | — | 37·3 | 22·4 | 33·9 | 3·5 | 0·3 | ||||
| YX110 | 214 | 1020 | qtz | 36·1 | 23·6 | 33·9 | 3·5 | 0·1 | ||||
| YX142 | 280 | 990 | qtz | 35·2 | 23·4 | 35·0 | 3·5 | 0·3 | ||||
| YX159 | 230 | 960 | qtz, plg | 33·5 | 23·4 | 36·9 | 3·3 | 0·3 | 56·9 | 19·4 | 23·7 | |
| YX167 | 257 | 930 | qtz, plg | 33·1 | 23·3 | 37·3 | 3·1 | 0·3 | n.p. | |||
| HYW6 | 24 | 1200 | start glass | 1·39 | 36·0 | 14·4 | 42·7 | 3·5 | 0·2 | |||
| YX119 | 213 | 1050 | — | 37·3 | 14·1 | 42·2 | 3·5 | 0·3 | ||||
| YX111 | 214 | 1020 | — | 36·5 | 14·9 | 42·5 | 3·4 | 0·2 | ||||
| YX143 | 280 | 990 | qtz | 37·4 | 13·9 | 42·1 | 3·4 | 0·4 | ||||
| YX160 | 230 | 960 | qtz | 35·3 | 14·2 | 44·1 | 3·5 | 0·4 | ||||
| YX168 | 257 | 930 | qtz, san | 34·9 | 14·8 | 43·1 | 4·0 | 0·4 | 15·6 | 82·3 | 2·1 | |
| HYW7 | 24 | 1200 | start glass | 1·52 | 43·1 | 5·0 | 44·9 | 3·4 | 0·6 | |||
| YX120 | 213 | 1050 | — | 43·9 | 5·0 | 44·2 | 3·4 | 0·6 | ||||
| YX112 | 214 | 1020 | qtz | 41·6 | 5·3 | 45·6 | 3·4 | 0·6 | ||||
| YX144 | 280 | 990 | qtz | 39·9 | 5·2 | 47·3 | 3·6 | 0·6 | ||||
| HYW8 | 24 | 1200 | start glass | 1·16 | 28·2 | 39·2 | 26·0 | 3·2 | 0·5 | |||
| YX121 | 213 | 1050 | — | 28·0 | 40·3 | 25·6 | 3·6 | 0·3 | ||||
| YX113 | 214 | 1020 | plg | 27·1 | 41·7 | 26·2 | 2·9 | –0·1 | 74·5 | 8·4 | 17·1 | |
| YX145 | 280 | 990 | plg | 30·6 | 36·3 | 27·0 | 2·5 | 0·4 | 75·0 | 12·4 | 12·6 | |
| YX161 | 230 | 960 | qtz, plg | 31·5 | 34·9 | 28·1 | 2·3 | 0·4 | n.p. | |||
| YX169 | 257 | 930 | qtz, plg | 30·0 | 35·9 | 28·5 | 2·5 | 0·2 | 72·0 | 20·4 | 7·6 | |
| HYW3 + 5 | 24 | 1200 | start glass | 1·25 | 31·3 | 21·5 | 40·8 | 3·4 | 0·1 | |||
| YX154 | 230 | 960 | qtz, san | 32·9 | 20·1 | 40·5 | 3·5 | 0·4 | 27·7 | 67·5 | 4·8 | |
| YX162 | 257 | 930 | qtz, san | 33·4 | 20·8 | 38·9 | 3·4 | 0·4 | 28·2 | 68·2 | 3·6 | |
| HYW3 + 6 | 24 | 1200 | start glass | 1·29 | 31·3 | 16·9 | 44·9 | 3·5 | 0·2 | |||
| YX155 | 230 | 960 | qtz, san | 33·5 | 15·9 | 44·3 | 3·4 | 0·5 | 17·5 | 79·6 | 2·9 | |
| YX163 | 257 | 930 | qtz, san | 34·1 | 17·0 | 41·6 | 3·8 | 0·5 | 19·0 | 78·4 | 2·6 | |
| HYW3 + 8 | 24 | 1200 | start glass | 1·17 | 27·4 | 29·3 | 36·6 | 3·3 | 0·3 | |||
| YX156 | 230 | 960 | san† | 31·5 | 26·6 | 36·1 | 2·8 | 0·5 | 52·9 | 38·1 | 9·0 | |
| YX164 | 257 | 930 | qtz, san† | 31·2 | 27·4 | 35·9 | 2·6 | 0·4 | 47·0 | 46·2 | 6·8 | |
| HYW5 + 8 | 24 | 1200 | start glass | 1·24 | 32·1 | 31·4 | 30·2 | 3·3 | 0·3 | |||
| YX157 | 230 | 960 | qtz, plg | 33·0 | 29·5 | 32·0 | 2·5 | 0·4 | 66·6 | 18·9 | 14·5 | |
| YX165 | 257 | 930 | qtz, plg | 32·6 | 28·6 | 33·2 | 2·4 | 0·3 | 63·2 | 25·5 | 11·3 | |
Qz, normative quartz content; Ab, normative anorthite; Or, normative orthoclase; An, normative anorthite; Cor, normative corundum; qtz, quartz minerals present in the sample; plg, plagioclase minerals present; san, sanidine; n.p., not possible.
*Negative corundum values reflect the amount of Cor that is missing to convert all available CaO to An.
†This crystallization of sanidine is discussed in the text.
Experimental run products at conditions E (500 MPa)
| Run | t | T | Products | H2O | melt | feldspar | ||||||
|---|---|---|---|---|---|---|---|---|---|---|---|---|
| (h) | (°C) | (wt %) | Qz | Ab | Or | An | Cor* | Ab | Or | An | ||
| HYS1 | 24 | 1200 | start glass | 1·23 | 36·7 | 32·0 | 18·8 | 6·9 | 0·0 | |||
| YX49 | 191 | 1050 | qtz, plg | 36·3 | 32·8 | 20·7 | 6·7 | 0·1 | 56·8 | 3·0 | 40·2 | |
| YX33 | 162 | 1020 | qtz, plg | 34·8 | 33·0 | 22·7 | 5·9 | 0·1 | n.p. | |||
| YX41 | 186 | 990 | qtz, plg | 32·3 | 32·1 | 25·5 | 4·6 | –0·1 | 68·2 | 6·5 | 25·3 | |
| HYS2 | 24 | 1200 | start glass | 1·27 | 37·2 | 12·0 | 39·2 | 6·6 | 0·1 | |||
| YX50 | 191 | 1050 | — | 38·1 | 12·3 | 39·0 | 6·9 | –0·1 | ||||
| YX34 | 162 | 1020 | qtz | 36·7 | 12·2 | 39·9 | 7·0 | 0·0 | ||||
| YX42 | 186 | 990 | qtz | 34·6 | 13·0 | 40·7 | 6·7 | –0·3 | ||||
| HYS3 | 24 | 1200 | start glass | 1·44 | 25·3 | 19·9 | 44·2 | 6·6 | 0·4 | |||
| YX51 | 191 | 1050 | — | 26·5 | 20·1 | 42·9 | 6·9 | 0·5 | ||||
| YX35 | 162 | 1020 | plg | 25·6 | 20·7 | 43·8 | 6·7 | 0·4 | 41·2 | 10·0 | 48·8 | |
| YX43 | 186 | 990 | plg | 26·2 | 19·4 | 44·2 | 5·5 | 0·2 | 44·2 | 18·8 | 37·0 | |
| HYS4 | 24 | 1200 | start glass | 1·00 | 37·2 | 21·6 | 29·5 | 6·7 | 0·0 | |||
| YX52 | 191 | 1050 | qtz | 36·8 | 23·0 | 29·8 | 6·6 | –0·2 | ||||
| YX36 | 162 | 1020 | qtz, plg | 35·0 | 23·3 | 31·7 | 6·4 | –0·1 | n.p. | |||
| YX44 | 186 | 990 | qtz, plg | 32·5 | 22·5 | 34·3 | 5·1 | –0·3 | n.p. | |||
| HYS5 | 24 | 1200 | start glass | 1·34 | 30·3 | 16·4 | 41·0 | 6·9 | 0·1 | |||
| YX53 | 191 | 1050 | — | 31·1 | 16·6 | 41·0 | 6·8 | –0·1 | ||||
| YX37 | 162 | 1020 | — | 31·3 | 16·5 | 41·3 | 6·9 | 0·1 | ||||
| YX45 | 186 | 990 | — | 31·9 | 16·1 | 41·8 | 6·5 | 0·1 | ||||
| YX87 | 286 | 930 | san | 33·2 | 15·3 | 41·4 | 5·4 | 0·0 | 17·8 | 78·1 | 4·2 | |
| HYS6 | 24 | 1200 | start glass | 1·12 | 15·7 | 46·7 | 26·5 | 6·8 | 0·0 | |||
| YX54 | 191 | 1050 | plg | 17·4 | 45·1 | 28·4 | 5·3 | –0·2 | 70·7 | 10·0 | 19·3 | |
| YX38 | 162 | 1020 | plg | 18·3 | 45·0 | 29·8 | 3·6 | –0·6 | 71·6 | 11·7 | 16·7 | |
| YX46 | 186 | 990 | plg | 18·9 | 41·9 | 30·0 | 3·2 | –0·7 | 71·6 | 14·9 | 13·5 | |
| HYS7 | 24 | 1200 | start glass | 1·32 | 20·8 | 32·3 | 35·1 | 6·9 | 0·3 | |||
| YX55 | 191 | 1050 | plg | 21·2 | 33·8 | 35·8 | 6·1 | –0·1 | 57·2 | 8·4 | 34·4 | |
| YX39 | 162 | 1020 | plg | 21·4 | 33·1 | 37·2 | 5·0 | –0·2 | 60·2 | 12·8 | 27·0 | |
| YX47 | 186 | 990 | plg | 23·1 | 31·1 | 37·1 | 4·1 | –0·3 | 59·2 | 22·0 | 18·8 | |
| HYS8 | 24 | 1200 | start glass | 1·34 | 27·8 | 37·7 | 23·0 | 7·0 | 0·3 | |||
| YX56 | 191 | 1050 | plg | 27·2 | 39·5 | 23·0 | 6·7 | –0·1 | 63·1 | 4·1 | 32·8 | |
| YX40 | 162 | 1020 | plg | 28·8 | 38·2 | 24·3 | 5·7 | –0·1 | 68·2 | 6·8 | 25·0 | |
| YX48 | 186 | 990 | plg | 29·4 | 36·4 | 25·0 | 4·2 | –0·4 | 71·7 | 8·1 | 20·2 | |
| HYS17 | 24 | 1200 | start glass | 1·49 | 43·1 | 6·3 | 39·5 | 6·5 | –0·1 | |||
| YX65 | 216 | 1020 | qtz | 39·4 | 6·5 | 41·5 | 7·5 | –0·1 | ||||
| HYS18 | 24 | 1200 | start glass | 1·36 | 36·7 | 0·0 | 52·2 | 6·8 | 0·0 | |||
| YX66 | 216 | 1020 | — | 37·4 | 0·4 | 51·9 | 6·6 | –0·1 | ||||
| HYS19 | 24 | 1200 | start glass | 1·44 | 39·3 | 7·9 | 52·8 | 6·5 | 0·0 | |||
| YX67 | 216 | 1020 | — | 37·3 | 6·3 | 44·9 | 6·6 | –0·1 | ||||
| YX88 | 286 | 930 | qtz, san | 34·6 | 6·9 | 46·4 | 6·5 | –0·2 | 6·2 | 92·0 | 1·8 | |
| HYS20 | 24 | 1200 | start glass | 1·43 | 36·0 | 6·5 | 45·4 | 6·2 | –0·2 | |||
| YX68 | 216 | 1020 | — | 30·9 | 10·0 | 46·7 | 7·0 | 0·1 | ||||
| YX89 | 286 | 930 | qtz, san | 34·3 | 10·4 | 45·1 | 6·1 | 0·0 | 9·6 | 88·5 | 1·9 | |
| HYS21 | 24 | 1200 | start glass | 1·36 | 30·6 | 26·1 | 30·8 | 6·7 | 0·2 | |||
| YX69 | 216 | 1020 | — | 32·0 | 24·9 | 30·8 | 7·0 | 0·3 | ||||
| HYS23 | 24 | 1200 | start glass | 1·45 | 48·0 | 27·1 | 13·0 | 6·9 | 0·1 | |||
| YX70 | 216 | 1020 | qtz | 38·8 | 31·7 | 16·0 | 8·0 | 0·3 | ||||
| HYS24 | 24 | 1200 | start glass | 1·30 | 38·9 | 49·8 | 0·0 | 6·8 | 0·6 | |||
| YX71 | 216 | 1020 | qtz, plg | 38·3 | 49·8 | 0·0 | 5·7 | 1·1 | n.p. | |||
| HYS25 | 24 | 1200 | start glass | 1·33 | 44·9 | 42·4 | 0·0 | 6·9 | 0·6 | |||
| YX72 | 216 | 1020 | qtz, plg | 39·0 | 48·6 | 0·0 | 6·2 | 1·0 | n.p. | |||
Qz, normative quartz content; Ab, normative anorthite; Or, normative orthoclase; An, normative anorthite; Cor, normative corundum; qtz, quartz minerals present in the sample; plg, plagioclase minerals present; n.p., not possible.
*Negative corundum values reflect the amount of Cor that is missing to convert all available CaO to An.
During the progress of the experimental work at conditions D (see Table 1), it was observed that starting materials HYW1–8 were insufficient to determine the position of the triple point of the intersection of the three stability fields with satisfactory precision. To investigate compositions closer to the minimum point, 50:50 mixtures (by weight) of the starting materials HYW3 + 5, HYW3 + 6, HYW3 + 8 and HYW5 + 8 were made by mixing appropriate amounts of each material in an agate mortar. The composition of these mixed starting materials is known from stoichiometric calculations.
For each crystallization experiment, ∼30 mg of pre-hydrated glass powder was loaded into a Au80Pd20 capsule (12 mm in length and 2·8 mm in diameter) that was closed subsequently by arc-welding. For every experiment, eight capsules were placed next to each other in the IHPV. The experiments were conducted in a temperature range of 870–1050°C, which was reached with a heating rate of 50°C min–1. The duration of the experiments varied between ∼160 h (∼6 days) and 340 h (∼14 days) depending on T. Experiments were quenched at isobaric conditions (200 or 500 MPa) by switching off the furnace, resulting in a cooling of ∼300°C within the first minute. According to the model of Pitzer & Sterner (1994), the intrinsic oxygen fugacity (fO2) of the IHPV was between QFM + 1·75 and QFM + 1·85 (where QFM is the quartz–fayalite–magnetite buffer) for experiments conducted at 200 MPa and between QFM + 2 and QFM + 2·3 for experiments conducted at 500 MPa. However, it is known that the fO2 in the IHPV sample container decreases with water activity (e.g. Botcharnikov et al., 2005). From comparisons with previous studies (Berndt et al., 2002; Botcharnikov et al., 2005; Almeev et al., 2012), and using the model of Kress & Carmichael (1991), we estimate that the effective fO2 in our experiments was thus approximately QFM – 1·2 at conditions A and B, QFM – 0·3 at conditions C and QFM – 1 at conditions D and E.
ANALYTICAL TECHNIQUES
The Cameca SX 100 Electron Probe Microanalyzer (EPMA) of the Institute for Mineralogy of the Leibniz University of Hannover was used to determine the chemical composition of the starting materials and experimental samples. Minerals that formed during crystallization experiments were analyzed using a focused beam with a 15 kV excitation voltage, 15 nA beam current and 10 s counting time for all elements. Standard minerals were measured as a reference material in each session (Jarosewich et al., 1980) and these measurements were used to correct the data from the experiments for the daily instrumental drift. Whenever possible, five measurements were taken on different grains for every feldspar phase per sample. Quartz was only only qualitatively. Two different measurement settings were used for the analysis of glasses. Initially, we employed a 15 kV excitation voltage, 4 nA beam current, a beam diameter defocused to 10 µm and 10 s counting time for each element. Subsequently, another analytical setting with a 15 kV excitation voltage, 15 nA beam current, a beam diameter defocused to 10 µm and counting times of 4 s for Na and K and 10 s for other elements was applied. This second setting with a higher beam current significantly improved counting statistics without leading to an observable loss of alkalis. All glass measurements were standardized using the MM-3 rhyolitic glass standard, a natural high-silica obsidian that was well characterized by Nash (1992). In general, 20 glass measurements were taken per sample. In some rare cases, however, the high sample crystallinity restricted the number of glass analyses to lower values. Samples that were found to be above the liquidus were analyzed 10 times to check for homogeneity and to confirm that they were identical to the starting glasses, and this procedure was used as an indication that no crystals were present elsewhere in the capsule.
The water content of all HYS and HYW starting glasses was determined by near-infrared (NIR) spectroscopy performed on a Bruker IFS88 FTIR spectrometer coupled with an A590 IR microscope. The procedure was identical to that applied by Wilke et al. (2015) and is briefly summarized here. Samples were first prepared as doubly polished glass wafers of ∼300 µm thickness, of which 100 µm × 100 µm spots were analyzed. Spectra were collected using a tungsten white light source, a CaF2 beam splitter and a HgCdTe detector. Water concentrations were calculated using the absorption bands at 5200 cm–1 and 4520 cm–1 that are assigned to stretching and bending combination modes of H2O molecules and vibration modes of hydroxyl groups respectively. A tangential background correction and the absorption coefficients ɛ4520 = 1·41 mol–1 cm–1 and ɛ5200 = 1·66 mol–1 cm–1 as determined by Withers & Behrens (1999) for rhyolitic glass were used. The density of our material was estimated to be 2·35 ± 0·02 g cm–3 and the effect of compositional variation on the glass density in the investigated rhyolitic system leads to a variation of the calculated glass H2O content of less than ±0·02 wt % (Withers & Behrens, 1999). Parts from the top and the bottom of the synthesized starting materials HYS 1, 2, 5 and 6 were also analyzed by Karl Fischer titration (KFT) measurements to confirm the NIR results. The titration procedure has been described by Behrens et al. (1996). The results of the KFT measurements agree within error with the findings from NIR spectroscopy.
RESULTS
More than 150 experiments were used to constrain phase relationships for the five conditions listed in Table 1. Glass was observed in all run products. Most experimental samples contained one or two solid phases, which were identified as quartz (qtz, if addressed as a crystallized mineral phase), sanidine (san) or plagioclase (plg). The back-scattered electron (BSE) images in Fig. 2 show typical phase assemblages resulting from the experiments. It should be noted that the size of the feldspar crystals seldom exceeds 10 µm. In some cases, especially where intergrowth of feldspar and quartz occurs, feldspar crystals are smaller than 1 µm, making reliable analysis by microprobe challenging and in some cases impossible. For samples that were derived from experiments directly below the liquidus (maximum 30°C) the degree of crystallization is usually <10 wt % (calculated by mass balance). In rare cases small amounts of magnetite crystallized in some samples, but the results of glass measurements indicate that Fe also alloyed with the Pd of the capsule material. Therefore, the amount of magnetite present in the run products is difficult to discuss in this study. In the following descriptions and discussions we will refer to samples as above the liquidus if no tectosilicate phases are present as run products. Temperature minima of the investigated systems described below are given with an estimated error of ±15°C, as the temperature step between two experiments was always 30°C.
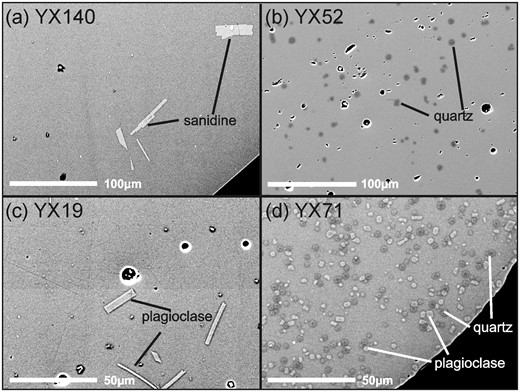
Back-scattered electron (BSE) images of experimental samples. (a) Sample YX140 from an experimental run at 990°C and 500 MPa for 280 h using starting material HYW3, leading to sanidine crystallization. (b) Sample YX52 from an experimental run at 1050°C and 500 MPa for 191 h using starting material HYS4, leading to quartz crystallization. (c) Sample YX19 from an experimental run at 990°C and 200 MPa for 168 h using starting material HYS3, leading to plagioclase crystallization. (d) Sample YX71 from an experimental run at 1020°C and 500 MPa for 216 h using starting material HYS24 leading to crystallization of both quartz and plagioclase. The images were edited digitally to increase the contrast for better visibility of the crystals.
The experimental results and the Ab–Or–An contents of feldspars and glasses are given together with run duration and temperatures in Tables 2–6. The Qz–Ab–Or content of glasses, normalized to 100%, is also plotted in the corresponding ternary projections (Fig. 3) where different symbols indicate the composition of the coexisting mineral assemblage. The average compositions of all analyzed glasses are given in Supplementary Data Appendix Tables 2–6.
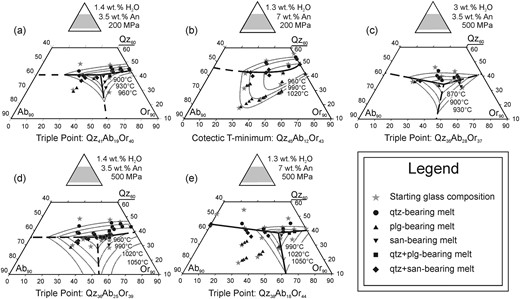
(a)–(e) Ternary projections (Qz + Ab + Or = 100) of melt compositions derived from experiments at the different conditions indicated. (a)–(e) correspond to conditions A–E respectively in the text. Different symbols represent melts coexisting with different mineral phase assemblages. Continuous lines represent cotectic curves in areas where sufficient data are available to constrain their position. Dashed lines indicate a projection of the cotectic curves not verified by existing data. Dotted lines represent liquidus lines.
The sum of the analyses is consistent with glasses containing either ∼1·3 or ∼3 wt % H2O. The glasses sometimes show a considerably lower FeO concentration than the starting materials, which may be due to the crystallization of magnetite but also to the formation of Pd–Fe alloys in the capsules (Barr & Grove, 2010). The glasses from crystallization experiments with HYS starting glasses, designed to contain 2·5 wt % FeO, were found to contain an average of 1·58 wt % FeO. For the HYW glasses that were designed to contain 1 wt % of FeO, an average of 0·84 wt % FeO was determined in the glasses. We also noted that FeO contents might vary significantly within an investigated experimental product. A more detailed discussion on Fe loss and possible explanations is given in the Supplementary Data.
The microprobe analyses of analyzed feldspars are given in Supplementary Data Appendix Table 7. Feldspars that contain approximately Or >35 wt % are referred to as sanidine. Other feldspars are referred to as plagioclase to avoid confusion from a more complex nomenclature. This rule of discrimination for feldspars leads to two easily distinguishable populations for all experimental systems with the exception of conditions D (see Table 1; Supplementary Data Appendix Table 7). Reasons for this behavior are discussed below (see phase equilibria at conditions D).
Phase equilibria at 200 MPa, 1·4 wt % H2O, 3·5 wt % normative An content (conditions A)
Experiments in this system were undertaken over a temperature range between 960 and 870°C. Products and run conditions are listed in Table 2. Two feldspar populations can be clearly distinguished (Table 2). Qtz was observed as the only stable tectosilicate phase in eight samples, only plg in four samples and only san in three samples (all with starting composition HYW3). A considerable number of samples were found to be cotectic and either hosted both qtz and plg (six samples) or qtz and san (three samples). No sample was found to contain both plg and san. The fitted liquidus lines in Fig. 3a agree with the experimental results from all samples except for products from starting material HYW8, an indication that equilibrium might not have been reached for these samples. One possible reason might be that the liquidus temperature of the composition HYW8 is much higher than that of the other investigated compositions and that equilibrium conditions would be reached only if high proportions of plg would crystallize (note that this would also strongly change the An composition of the coexisting melt; see discussion below). We conclude that the position of the Qz–Ab–Or triple point for the conditions 3·5 wt % An, aH2O ∼0·15 and 200 MPa is approximately Qz41Ab19Or40. This is in good agreement with the triple point composition of Qz42Ab21Or37 obtained in our previous study for a comparable system with ∼3 wt % H2O (Wilke et al., 2015). According to previous results on the effect of aH2O on the minimum composition (Holtz et al., 1992b, 2001a), changes in water activity mainly affect the Ab/Or ratio, which is confirmed by comparing the triple point composition from Fig. 3a with the data of Wilke et al. (2015). The minimum temperature is estimated to be at 885 ± 15°C.
Phase equilibria at 200 MPa, 1·3 wt % H2O, 7 wt % normative An content (conditions B)
Experiments at these conditions were undertaken over a temperature range between 1020 and 930°C. Products and run conditions are listed in Table 3. Plg was found to be the only feldspar phase crystallizing at the investigated conditions (see Supplementary Data Appendix Table 7). This indicates that there is no composition at which qtz, san and plg may crystallize simultaneously as liquidus phases. It should be noted that it is still possible for sanidine to crystallize in this system, although we found no experimental evidence for this. We infer that under these conditions a comparably small sanidine stability field is still located in the Or corner of the ternary projection. The evidence we present implies, however, that the sanidine stability field does not intersect with the qtz stability field. Qtz was observed as the only stable tectosilicate phase in five samples and only plg in 21 samples. Six samples were found to be cotectic, hosting both qtz and plg. The fitted liquidus isotherms agree with most experimental results except for products with low Qz and high Ab values that differ the most in composition from the position of the T-minimum (Fig. 3b). This can be an indication that equilibrium might not have been reached for these samples. We conclude that the position of the cotectic T-minimum point in this rhyolitic system with 7 wt % An at an aH2O of ∼0·15 and 200 MPa is approximately Qz45Ab12Or43. The minimum temperature is estimated to be at 945 ± 15°C.
Phase equilibria at 500 MPa, 3 wt % H2O, 3·5 wt % normative An content (conditions C)
Experiments were undertaken over a temperature range between 930 and 870°C. Products and run conditions are listed in Table 4. Two feldspar populations can be clearly distinguished. Qtz was observed as the only stable tectosilicate phase in seven samples, only plg in three samples and only san in two samples. Three samples were found to be cotectic and either host both qtz and plg (one sample) or qtz and san (two samples). No sample was found to host both plg and san. The fitted liquidus isotherms (Fig. 3c) agree well with all experimental products. The composition of the triple point and minimum temperature are estimated to be Qz35Ab28Or37 and 840 ± 15°C, respectively.
Phase equilibria at 500 MPa, 1·4 wt % H2O, 3·5 wt % normative An content (conditions D)
Experiments were undertaken over a temperature range between 1050 and 930°C. Products and run conditions are listed in Table 5. Two feldspar populations can be distinguished in all but two samples (see Table 5; Supplementary Data Appendix Table 7). The feldspars found in samples YX156 and YX164, both produced from HYW3 + 8, lay within the san field (barely in the case of YX156), but have the lowest Or contents of san recorded for this study. This makes the classification of these feldspars somewhat arbitrary.
The melt composition of YX156 obtained at 960°C is considerably depleted in normative An. The initial value of ∼3·5 wt % An in the starting material decreased to 2·75 wt %, which is usually an indicator of plg crystallization. This phenomenon could be explained as a result of co-precipitation of san and plg and the intergrowth of both phases may occur on a scale below the resolution of the microprobe. The sample is excluded from Fig. 3d because of its unclear phase assemblage, but the Qz–Ab–Or coordinates given in Table 5 fit a position where the san–plg cotectic curve for this system could occur, considering the An-depleted nature of the sample. Sample YX164, obtained at a lower temperature of 930°C, shows the same uncommon feldspar composition and also contains qtz. The glass composition can be interpreted as being close to the system’s triple point, albeit for a melt An content of 2·59 wt %.
Although the problematic experiments YX156 and YX164 may provide some information about phase equilibria, we focus on the samples with clear phase identification to determine the cotectic curves and the triple point. Qtz was observed as the only stable tectosilicate phase in 13 samples, only plg in two samples and only san in two samples, not counting YX156. Some samples were found to be cotectic and host either both qtz and plg (six samples, not counting YX164) or qtz and san (six samples). The fitted liquidus isotherms (Fig. 3d) are consistent with all investigated compositions. The composition of the triple point and T-minimum are estimated to be Qz36Ab25Or39 and 1005 ± 15°C, respectively.
Phase equilibria at 500 MPa, 1·3 wt % H2O, 7 wt % normative An content (conditions E)
Experiments were conducted over a temperature range between 1050 and 930°C (1050, 1020, 990, 930°C), with no experiments conducted at 960°C. Products and run conditions are listed in Table 6. Two feldspar populations can be clearly distinguished. Qtz was observed as the only stable tectosilicate phase in five samples, only plg in 11 samples and only san in one sample. Some samples were found to be cotectic and host either both qtz and plg (seven samples) or qtz and san (two samples). No sample was found to host both plg and san. The fitted liquidus isotherms (Fig. 3e) are consistent with the compositions close to cotectic compositions. but are difficult to reconcile with more Ab-rich samples. This effect appears to be the same as that observed at conditions B. The composition of the triple point and T-minimum are estimated to be Qz38Ab18Or44 and 960 ± 15°C, respectively.
DISCUSSION
Attainment of equilibrium and limitations of data interpretation
Attainment of equilibrium
Experimental petrology in highly viscous rhyolitic systems is always confronted with the question of the attainment of equilibrium. Possible problems are nucleation delay owing to slow diffusion, especially in experiments at temperatures well below the liquidus, and sluggish crystal growth. As nucleation occurs preferentially at grain boundaries of the initial starting glass powder (Pichavant, 1987; Becker et al., 1998), the use of fine-grained glass powders as starting material in our experiments helps to avoid nucleation delay related to undercooling. Another significant factor for the attainment of equilibrium is the experimental run duration. Becker et al. (1998) conducted experiments comparable with those presented in this study on rhyolitic melts with 1 wt % H2O at 960–1180°C and concluded that near-equilibrium conditions slightly below the liquidus were attained within 72 h. Melt viscosities in the study of Becker et al. (1998), calculated using the model of Hess & Dingwell (1996), range from 105·71 to 104·09 poise, which are either comparable with or slightly lower than the range of melt viscosities in our study (106·35–104·58 poise). Thus, the diffusivity of cations in the silicate melt is similar in both experimental studies. Run durations in our experiments (157–261 h) are longer than the 72 h duration used by Becker et al. (1998). These longer durations were intentionally chosen to compensate for the slightly higher melt viscosity.
To further investigate the attainment of equilibrium, reversal experiments were performed following the approach described by Pichavant (1987). We selected four compositions for which the liquidus conditions were bracketed between 1020 and 1050°C (YX34, YX35, YX112 and YX113). Thus, the run products of these experiments (all performed at 500 MPa) contained qtz (YX34, YX112) or plg (YX35, YX113) at 1020°C and were crystal-free at 1050°C. The run products obtained at 1020°C were sealed in Au80Pd20 capsules and heated again to 1050°C at 500 MPa for 336 h in an IHPV. If near-equilibrium conditions are attained, the products of these reversal experiments should be crystal-free. Liquidus conditions were obtained for the reversal runs (1050°C) with YX34, YX35 and YX112. In the product of the reversal run with YX113, however, plagioclase was still present. One possible reason for this discrepancy could be technical; for example, owing to slight differences in temperature during the crystallization and reversal runs at 1050°C that might occur as a result of potential inhomogeneous temperature distribution within the IHPV hot zone. We deem it more likely, however, that the failed attempt of resorbing the minerals in YX113 means that the crystallization experiment with YX113 starting material HYW8 at 1050°C (YX121), which showed no sign of crystallization, was indeed undercooled and not in a true state of equilibrium.
We assume that the reason why the reversal of YX113 failed whereas the other reversal experiments succeeded is related to the large compositional difference between YX113 (and HYW8), and the triple point of the system. This effect potentially affects other samples that deviate substantially in composition from their triple point. Fortunately, this is not a significant problem when determining cotectic lines, as the melt compositions are still directly linked to the coexisting phase(s) and are hence indicative of the stability field position. However, disequilibrium does make the determination of liquidus line positions more difficult: if the sample was quenched before the attainment of equilibrium, then the melt composition of an experimental product obtained at a certain T cannot be used to draw liquidus isotherms. We drew liquidus lines in Fig. 3 bearing this in mind, but we emphasize that, especially in the systems with higher water activities (low liquidus T), some samples with a large compositional distance to the minimum point were discarded when doing so.
An content of melts in experiments containing plagioclase
A problem for the correct determination of the position of cotectic curves and minimum points can be the change in melt normative An content with crystallization. The crystallization of plg leads to Ca depletion in the host melt, causing a subsequent drop in the melt An content. As a main goal of this study is to describe rhyolite systems at a certain level of normative melt An, it is imperative to be aware that the glass composition of a plg-bearing sample cannot be used directly to estimate the position of a cotectic curve, as its melt An content deviates from that of the starting glass. A comparable problem may occur in samples that underwent significant crystallization of qtz, in which an increase in melt An can be expected. As our experiments were designed to observe systems close to the liquidus, extensive qtz crystallization is rather uncommon, but nonetheless must be addressed in a few instances.
The problem of changing An contents was tackled by closely examining samples of particular interest for constraining the position of the cotectic curves and, if serious deviations were found, reducing their weightings in determining cotectic curve positions. It is worth noting that owing to our knowledge of the impact of An (James & Hamilton, 1969) even samples with altered melt An contents deliver qualitative information on the position of the cotectic curve (separating qtz and one feldspar). James & Hamilton (1969) pointed out that a decrease in normative melt An will cause the minimum point to shift towards the Ab apex, which was also confirmed by Wilke et al. (2015) and in this study.
Comparison with previous studies in An-bearing systems
Our expanded database of phase equilibria in An-bearing rhyolitic systems is useful to predict quantitatively the effect of normative An on the position of a system’s minimum point at various pressures and aH2O. Table 7 lists all the minimum points that are known to the authors and relevant for the following discussion. The error on the Qz–Ab–Or proportions listed in Table 7 is difficult to estimate accurately, considering that several factors that are difficult to quantify need to be taken into account. For example, the position of the minimum point depends on the shape of the isotherms in Fig. 3a–e. Exact compositions of cotectic melts in this study were constrained from microprobe analyses, but glass analyses were not performed in early studies (Tuttle & Bowen, 1958; Luth et al., 1964; James & Hamilton, 1969; Steiner et al., 1975). Using the same approach, except for aH2O, which is probably more accurate in this study (see above), Holtz et al. (1992b) estimated uncertainties of ±2–2·5 wt % on the normative Qz, Ab and Or contents. A similar error is also realistic for this study, even if the aH2O is better constrained, as an additional source of error [compared with Holtz et al. (1992b)] is the possible variation of An content in the melt in run products containing plg.
List of known minimum points in the Qz–Ab–Or–(An)–H2O system
| No. | Ref. | P | aH2O | T | An | Qz | Ab | Or | Ab-join | Or-join |
|---|---|---|---|---|---|---|---|---|---|---|
| (MPa) | (°C) | (wt %) | (wt %) | (wt %) | (wt %) | (wt %)* | (wt %)* | |||
| 1 | a | 50 | 1 | 760 | 0 | 39 | 29 | 32 | 43 | 47 |
| 2 | a | 100 | 1 | 720 | 0 | 37 | 37 | 26 | 41 | 46 |
| 3 | a | 200 | 1 | 685 | 0 | 35 | 39 | 26 | 38 | 43 |
| 4 | a | 300 | 1 | 680 | 0 | 32 | 42 | 26 | 35 | 41 |
| 5 | b | 400 | 1 | 660 | 0 | 30 | 47 | 23 | 32 | 43 |
| 6 | c | 500 | 1 | 650 | 0 | 27 | 50 | 23 | 31 | 37 |
| 7 | c | 1000 | 1 | 630 | 0 | 22 | 56 | 22 | 26 | n.a. |
| 8 | d | 200 | 1 | 685 | 0 | 36 | 39 | 25 | 40 | 43 |
| 9 | d | 200 | 0·5 | 775 | 0 | 35 | 36 | 29 | 40 | 41 |
| 10 | d | 200 | 0·25 | 830 | 0 | 35 | 34 | 31 | n.a. | n.a. |
| 11 | d | 500 | 1 | 645 | 0 | 31 | 47 | 22 | 32 | 43 |
| 12 | d | 500 | 0·55 | 735 | 0 | 32 | 43 | 25 | n.a. | n.a. |
| 13 | d | 500 | 0·4 | 790 | 0 | 32 | 40 | 28 | n.a. | n.a. |
| 14 | e | 500 | 0·07 | 990 | 0 | 32 | 35 | 33 | 32 | 38 |
| 15 | g | 100 | 1 | 730 | 3 | 39 | 30 | 31 | n.a. | n.a. |
| 16 | g | 100 | 1 | 745 | 5 | 42 | 22 | 36 | n.a. | n.a. |
| 17 | g | 100 | 1 | 780 | 7·5 | 48 | 10 | 42 | n.a. | n.a. |
| 18 | h† | 200 | 0·15 | 885 | 3·5 | 41 | 19 | 40 | n.a. | 44 |
| 19 | i† | 200 | 0·47 | 790 | 3·5 | 42 | 21 | 37 | n.a. | n.a. |
| 20 | h‡ | 200 | 0·13 | 945 | 7 | 45 | 12 | 43 | n.a. | 48 |
| 21 | h† | 500 | 0·09 | 1005 | 3·5 | 36 | 25 | 39 | n.a. | n.a. |
| 22 | h† | 500 | 0·28 | 840 | 3·5 | 35 | 28 | 37 | n.a. | n.a. |
| 23 | h‡ | 500 | 0·08 | 975 | 7 | 38 | 18 | 44 | 46 | n.a. |
References: a, Tuttle & Bowen (1958); b, Steiner et al. (1975); c, Luth et al. (1964); d, Holtz et al. (1992b); e, Becker et al. (1998); g, James & Hamilton (1969); h, this study; i, Wilke et al. (2015).
*wt % of Qz-component.
†+ 1 wt % FeO + 0·2 wt % TiO2.
‡+ 2 wt % FeO + 0·4 wt % TiO2.
In Fig. 4, the An-bearing minimum point compositions (15–23, Table 7) are plotted together with An-free minima (2, 10 and 14, Table 7) for given P and aH2O. Our experimental results confirm the trend already known from the data of James & Hamilton (1969): an increase of the An component in the melt causes the minimum point to shift away from the Ab apex as the plg stability field expands. However, a detailed investigation of the results of James & Hamilton (1969) and of the datasets obtained in this study and that of Wilke et al. (2015) reveals significant differences. Figure 4 indicates that the effect of An on the shift of the minimum point that is deduced from our experimental dataset at 200 MPa (compare Fig. 4b with an aH2O range of 0·13–0·25) and 500 MPa (compare Fig. 4c with an aH2O range 0·07–0·09) is more pronounced than that observed by James & Hamilton (1969) (compare Fig. 4a with aH2O = 1). We consider that the main reason for this difference is related to a higher uncertainty in the determination of the minimum points. In particular, these seminal results of James & Hamilton (1969) were obtained almost half a century ago using significantly less accurate analytical instruments. This may explain the apparently very small effect of An on the minimum point composition in their study when comparing the systems with 0 and 3·5 wt % An, the relatively strong effect when comparing systems with 3·5 and 5 wt % An and an intermediate effect when comparing systems with 5 and 7·5 wt % An (Fig. 4a). This strongly non-linear effect of An on the minimum point composition predicted by the results of James & Hamilton (1969) is difficult to reconcile with the results of Wilke et al. (2015) as well as this study and may simply be due to a larger uncertainty of the minimum points.
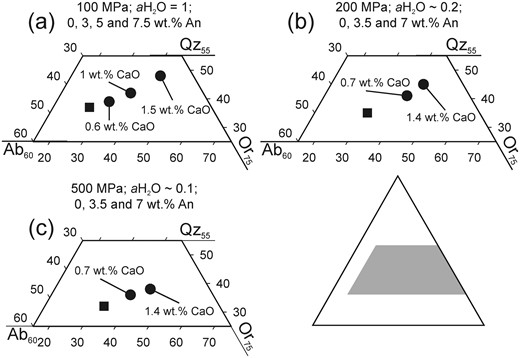
Ternary projection of known An-bearing minimum points plotted together with a comparable An-free minimum point (filled square) obtained at similar P and aH2O. Data from Tuttle & Bowen (1958) and James & Hamilton (1969) in (a), Holtz et al. (1992b) and this study in (b), and Becker et al. (1998) and this study in (c).
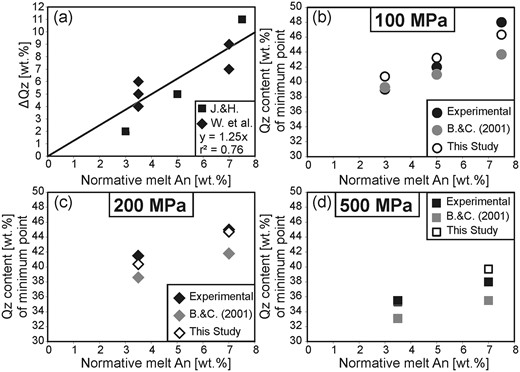
(a) Difference in Qz content between An-bearing minimum points and correlated An-free reference minimum points obtained at the same pressure (ΔQz). J.&H. refers to James & Hamilton (1969) and W. et al. includes point from both Wilke et al. (2015) and this study. (b–d) Comparison between minimum points estimated either by the method described by Blundy & Cashman (2001) (grey symbols) or the correlation equation noted in (a) (open symbols). Black symbols represent the actual experimentally determined Qz content of a minimum point at the given An content.
We compared equation (1) with the An-correction equation given by Blundy & Cashman (2001), which can also be used to estimate the effect of An on the shift of the minimum point (Figs. 5b–d). An-free minimum point 2 (Table 7) determined by Tuttle & Bowen (1958) at 100 MPa was used to calculate the Qz content of minimum points at 3, 5 and 7·5 wt % An, corresponding to the existing experimental dataset from James & Hamilton (1969). At higher pressures (Fig. 5c and d), the An-free, water-saturated minimum points 8, 200 MPa, and 11, 500 MPa, both from Holtz et al. (1992b), were used to predict the Qz content of minimum points at 3·5 and 7 wt % An, corresponding to the experimental results of Wilke et al. (2015) and this study. Figure 5b–d show plots of the change in the Qz component with increasing An both for experimentally determined and for predicted values. At 200 MPa and 3·5 wt % An, the average experimentally determined Qz value in Fig. 5c is 41·5 wt %. The average is calculated from the two points 18 and 19 (41 wt % Qz and 42 wt % Qz; see Table 7). Both points differ only in water activity (aH2O = 0·15 for point 18 and aH2O = 0·47 for point 19), which should not lead to a shift in the Qz component of the minimum point (Holtz et al., 1992b). Their 1 wt % difference in Qz content is well within the expected error range for the experimental determination of minimum points. In a similar manner, the Qz content of a system with 3·5 wt % An at 500 MPa was assumed to be 35·5 wt %, regarding experimental points 21 and 22.
The Blundy & Cashman (2001) equation accurately predicts the Qz content of the minimum points determined by James & Hamilton (1969) for 3 and 5 wt % An at 100 MPa (points 15 and 16, respectively, Table 7) but it underestimates the Qz content at 7·5 wt % An (point 17). This reasonable agreement with data of James & Hamilton (1969) should nonetheless be expected, as the model of Blundy & Cashman (2001) is based on that dataset. However, the Blundy & Cashman (2001) model systematically underestimates the Qz content of minimum points determined experimentally at 200 and 500 MPa by ∼3 wt % Qz (see Fig. 5c and d). Equation (1) shows no such systematic misestimates and an average deviation from the experimental values of only ∼1 wt %. Using the Blundy & Cashman (2001) equation to predict Ab and Or values of the experimentally determined minimum points yields differences considerably higher compared with the Qz content calculations, but this discrepancy does not affect strongly the pressure estimated from the cotectic composition of rhyolitic melts (Gualda & Ghiorso, 2013a).
Implications for geobarometry
As equation (1) accounts for the influence of An on the Qz content of the cotectic and minimum point compositions, it is now possible to link the normative Qz content of natural melts representing minimum point compositions to the pressure (P) under which they formed. We thus present a series of equations based on a combination of linear fits to the data presented in Table 7 that improve geobarometry based on the position of cotectic curves in the system Qz–Ab–Or–An–H2O and on the projection of natural sample compositions into the reference Qz–Ab–Or system. The position of a composition in the ternary projection Qz–Ab–Or can be described exactly using only the two parameters Qz and the feldspar ratio Ab/(Ab + Or) (Qz + Ab + Or = 100). If the effects of P, H2O content and normative melt An content variability on both parameters are known, then the composition of a rhyolitic melt coexisting with quartz and one or two feldspars can be linked to a unique P, as described below.
General formulation of the barometer for An-free minimum compositions
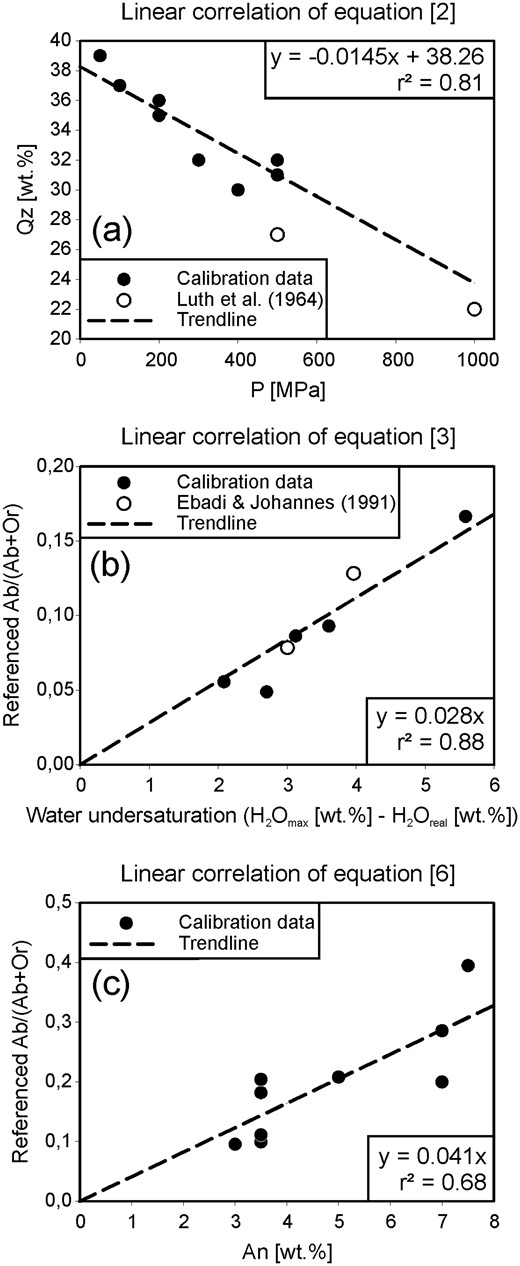
Fits of the linear correlations used to construct the DERP geobarometer. (a) Linear fit that leads to the formulation of equation (2). The data of Luth et al. (1964) were not used for the calibration of the fit for the reasons explained in the text but are plotted here to illustrate the quality of the fit. (b) Linear fit that leads to the formulation of equation (3). Data from Ebadi & Johannes (1991) were not used for the calibration of this fit, because owing the technical difficulties of this study they do not provide the full range of quality information needed to be included as an official reference point in Table 7. The data available from Ebadi & Johannes (1991) are, however, useful in this figure to serve as a quality check for the displayed fit. (c) Linear fit that leads to the formulation of equation (6).
Minimum compositions in the H2O-free Qz–Ab–Or reference system
Feldspar ratios of minimum points recalculated for dry conditions
| Ref. | P | H2O | Ab/(Ab + Or)real | Ab/(Ab + Or)dry |
|---|---|---|---|---|
| (MPa) | (wt %) | |||
| a | 50 | 2·83 | 0·48 | 0·40 |
| a | 100 | 4·00 | 0·59 | 0·48 |
| a | 200 | 5·66 | 0·60 | 0·44 |
| a | 300 | 6·93 | 0·62 | 0·42 |
| b | 400 | 8·00 | 0·67 | 0·45 |
| c | 500 | 8·94 | 0·68 | 0·43 |
| c | 1000 | 12·65 | 0·72 | 0·36 |
| d | 200 | 5·91 | 0·61 | 0·44 |
| d | 200 | 3·50 | 0·55 | 0·46 |
| d | 200 | 2·15 | 0·52 | 0·46 |
| d | 500 | 9·85 | 0·68 | 0·41 |
| d | 500 | 5·42 | 0·63 | 0·48 |
| d | 500 | 4·00 | 0·59 | 0·48 |
| e | 500 | 1·00 | 0·51 | 0·49 |
| average | 0·44 | |||
| 1σ | 0·03 |
References: a, Tuttle & Bowen (1958); b, Steiner et al. (1975); c, Luth et al. (1964); d, Holtz et al. (1992b); e, Becker et al. (1998).
However, the constant Ab/(Ab + Or) feldspar ratio of 0·44 for dry eutectic melts, independent of pressure, is a prerequisite for a simple formulation of our empirical barometer (see below). We emphasize that even if the behavior of truly dry systems deviates in unforeseen ways from the behavior of hydrous systems, this would in no way alter the possibility to describe the behavior of hydrous systems using equation (3) and the dry reference system with Ab/(Ab + Or)dry = 0·44.
Extension of the model to cotectic compositions
To make the geobarometry applicable to not only minimum compositions but also cotectic melts, it is important to model the position of the cotectic curves for the dry reference system. Because the feldspar ratios of dry minimum points are constantly 0·44, independent of pressure (see above), the position of the cotectic curves can be modeled from the phase relations in the H2O-free and An-free Qz–Ab–Or system.
To fix the position of the cotectic curves separating the quartz and the feldspar primary fields in the dry Qz–Ab–Or system, it was assumed that dry, An-free cotectic curves run parallel at different pressures. This assumption is justified by the observation that in the available experimental dataset (see Table 7) the cotectic curves of any two systems of identical An and H2O content run approximately parallel, within expected experimental error margins. Further, the cotectic curves separating the quartz and feldspar primary fields were assumed to be straight lines connecting the minimum point of the ternary system with eutectic points in the binary systems Qz–Ab and Qz–Or (Fig. 7). This assumption is a simplification, but determining whether and to what degree these cotectic curves are actually curved is beyond the resolution of the available experimental data and therefore deemed negligible for the practical purpose of geobarometry. Based on the observations on the phase stabilities established previously (conditions 1–5, 8, 9, 11 and 14; see references in Table 7), equations (4) and (5) were formulated to predict the difference in quartz content between a given cotectic composition and the corresponding minimum point (ΔQz) as a function of the Ab/(Ab + Or) ratio in a dry system:
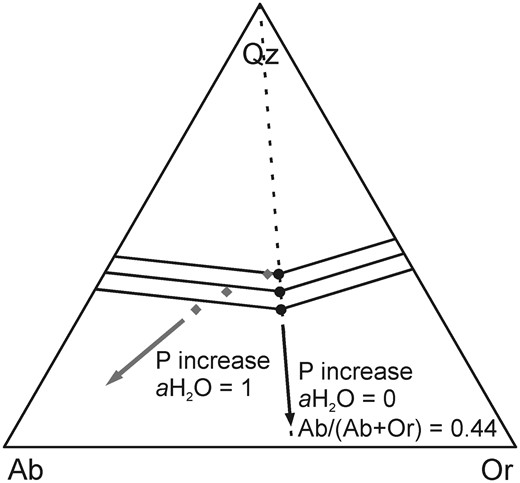
Minimum points calculated for dry systems with aH2O = 0 (black dots) using equation (3). Grey diamonds indicate the position of the corresponding minimum points determined experimentally in water-saturated systems at 50, 200 and 500 MPa.
Barometry using corrections to apply the dry reference Qz–Ab–Or system to An-bearing compositions
This geobarometer, henceforth referred to as DERP (DEtermination of Rhyolite Pressures), is applicable to rhyolitic glass compositions in equilibrium with quartz and at least one feldspar at pressures up to 500 MPa, with normative melt An contents of up to 7 wt % and any amount of dissolved H2O. The only inputs required are normative melt Qz, Ab, Or, An and H2O contents. However, it should be noted that these values may change also with variations in TiO2, FeO and MgO contents, owing to the CIPW calculation scheme. We provide an MS-Excel spreadsheet in the Supplementary Data that allows P to be calculated either directly from glass major element compositions, using an implemented CIPW calculation mechanism, or from Qz, Ab, Or, An and H2O contents.
Constraints with respect to accuracy
Although the experiments presented in this study simulate natural compositions more closely than any other systematic investigation known to us, natural rhyolites contain a number of components that may affect the Qz–Ab–Or projection. For example, both fluorine (F) and boron (B) are known to shift the minimum point in the ternary projection in a comparable way to the pressure effect (Manning, 1981; Pichavant, 1987). Although the effect of B is probably negligible for common rhyolites containing less than 1 wt % B, small amounts of F in the melt may cause a significant error in predicting crystallization pressures with DERP. Manning (1981) experimentally investigated rhyolitic compositions with three different levels of F content and the results indicate that even 0·25 wt % F in a melt will lead to an overestimation of ∼100 MPa. We chose not to implement the effect of F directly into DERP because we deem that three experimentally investigated systems (all at 100 MPa) represent an insufficient database to extend the DERP barometer. The formulation of DERP implies that excess aluminum (normative corundum) does not affect the pressure estimation. This assumption is justified by experiments testing the effect of excess aluminum on phase relations in the haplogranitic system. These experiments show that, although liquidus temperatures may be slightly lower in peraluminous melts, the cotectic curves of systems saturated with an Al-rich phase (mullite) are not significantly different from those in the haplogranitic system (Holtz et al., 1992a).
As a first step to evaluate the accuracy of DERP geobarometry, the model can be used to predict the pressure of the minimum points used for its calibration (Table 7). The average deviation between experimental and calculated pressure for the 23 datapoints used for the calibration of DERP is 72 MPa (∼40% average relative deviation). This value can serve as a minimum estimate for the model’s accuracy. However, as any model should be able to at least reproduce its calibration data, it is mandatory to compare the calculated results with independent pressure estimates from other geobarometers, as far as possible. A problem is the general lack of existing data for cotectic rhyolite glass compositions that come with sound pressure estimates from independent barometers, considering that high-silica rhyolitic melts are often free of amphibole. Gualda & Ghiorso (2013a) provided a number of studies in which independent data are listed that are suitable to check for the accuracy of the geobarometry using the compositions of cotectic rhyolitic melts. Starting from this list we compiled rhyolitic melt data from various locations suitable for DERP geobarometry, for which P estimates from independent approaches are available (Table 9). These P estimates are derived from different methods, including amphibole- and TitaniQ-geobarometry and fluid-saturation pressures (see references in Table 9). The rhyolite-MELTS geobarometer was not used here, but is discussed below in a separate section for the reasons explained there in detail.
Comparison of DERP estimated pressures with literature data
| Name | Unit | Type1 | Barometer | Pproposed | 1σ | PDERP | 1σ | PMC-DERP2 | 1σ | Source |
|---|---|---|---|---|---|---|---|---|---|---|
| (glass) | (MPa) | (MPa) | (MPa) | (MPa) | (MPa) | (MPa) | ||||
| Young Toba Tuff | YTT | matrix | Amphibole3 | 300 | 40 | 392 | 34 | 366 | 68 | Chesner, 1998; Chesner & Luhr, 2010 |
| Bishop Tuff | Ig1Eb | inclusion | Fl. sat.4 | 148 | 19 | 160 | 40 | 160 | 57 | Roberge et al., 2013; Chamberlain et al., 2015 |
| Bishop Tuff | Ig2Na | inclusion | Fl. sat.4 | 169 | 41 | 184 | 59 | 193 | 139 | Roberge et al., 2013; Chamberlain et al., 2015 |
| Oruanui | P 1 & 2 | matrix | Amphibole | 132 | 63 | 149 | 65 | 141 | 202 | Allan et al., 2012 |
| Roitoiti | 1–4 | matrix | Amphibole | 103 | 26 | 97 | 77 | 25 | 205 | Schmitz & Smith, 2004; Deering et al., 2011 |
| Blacktail Creek Tuff | matrix | Exp5/TitaniQ6 | 175 | 75 | 235 | 90 | 198 | 102 | Bolte et al., 2015 | |
| Tunnel Spring Tuff | inclusion | TitaniQ6 | 460 | 89 | 222 | 97 | 196 | 288 | Audétat, 2013 | |
| Bandelier Tuff | Upper | inclusion | TitaniQ6 | 193 | 40 | 251 | 100 | 251 | 90 | Audétat, 2013 |
| Central Plateau Member | Dry Creek7 | matrix | TitaniQ6 | 254 | 52 | 287 | n.a. | n.p. | Vazquez et al., 2009 | |
| Chalk Mt. Rhyolite | inclusion | TitaniQ6 | 190 | 70 | 173 | 47 | 181 | 101 | Audétat, 2015 | |
| Whakamaru eruption | matrix | Amphibole | 119 | 51 | 129 | 51 | 113 | 121 | Matthews et al., 2012 | |
| Novarupta Dome Rhyolite | inclusion | Fl. sat.4 | 73 | 12 | 125 | n.a. | n.p. | Lowenstern, 1993 | ||
| Mangakino | KI1 | matrix | Amphibole | 125 | 31 | 110 | 114 | 106 | 166 | Cooper et al., 2016 |
| Mangakino | KI2 | matrix | Amphibole | 115 | 29 | 0 | 72 | 0 | 162 | Cooper et al., 2016 |
| Mangakino | KI3 | matrix | Amphibole | 140 | 35 | 493 | 121 | 496 | 137 | Cooper et al., 2016 |
| Mangakino | RH1 | matrix | Amphibole | 120 | 30 | 150 | 67 | 152 | 101 | Cooper et al., 2016 |
| Mangakino | RH2 | matrix | Amphibole | 100 | 25 | 70 | 102 | 75 | 106 | Cooper et al., 2016 |
| Wangrah Suite Granite | DG | synth | Experimental | 200 | n.p. | 155 | n.p. | 151 | 102 | Klimm et al., 2008 |
1Type of glass used for P determination in this study. Inclusions in both quartz and feldspar were used depending on available dataset.
2P calculated with DERP by Monte-Carlo simulation with mean composition and 1σ of published rhyolite; 1000 random normally distributed compositions.
3Gardner et al. (2002) argued that the amphiboles in this study do not represent equilibrium conditions, proposing a pressure <150 MPa based on fluid saturation.
4Fluid saturation pressure.
5Based on phase stability experiments.
6TitaniQ pressures included in this table exclusively calculated by the method proposed by Huang & Audétat (2012).
7Representative for a group of CPM lava flows of similar pressure values for TitaniQ as well as for DERP.
n.a., not available; n.p., not possible.
DERP was used to calculate pressures for the above samples in two ways. One approach consisted of calculating the pressure from the glass compositions for the corresponding petrological units (Table 9, column PDERP). However, when few compositions or measurements are available, this approach can lead to high uncertainties, especially for strongly heterogeneously distributed datasets. To avoid such a problem, we calculated a second P value (listed as PMC-DERP in Table 9) using a Monte-Carlo approach. In this approach, 1000 normally distributed compositions were calculated based on the mean compositions and standard deviations given in the publications. Each of these compositions was then used to calculate P with DERP. The mean value and standard deviation (1σ) of the 1000 calculated pressures is then given in Table 9. This method leads to a higher standard deviation of estimated P but minimizes inaccuracies owing to outliers or strongly heterogeneously distributed data. To illustrate the accuracy of DERP, the Pproposed of Table 9 is plotted against both pressures calculated with DERP in Fig. 8a and b. Both calculation approaches manage, with few exceptions, to reproduce the independently calculated P within reasonable error.
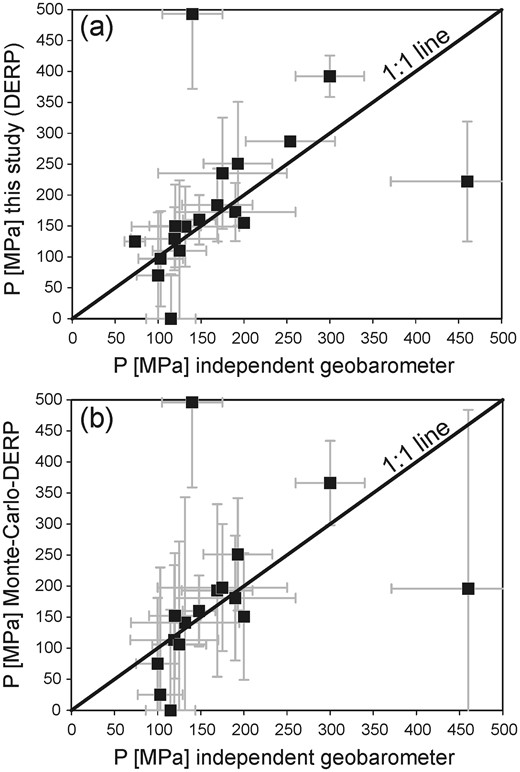
Comparison of pressures from the literature versus pressures calculated with DERP as listed in Table 9. In (a) the P for DERP was calculated as the mean value of P calculated for all available compositions in the dataset. In (b) the mean composition and standard deviation of a rhyolitic unit were used for a Monte-Carlo simulation and the P was calculated with DERP for 1000 random normally distributed compositions resulting from that simulation.
The two most spectacular mismatches come from the Tunnel Spring Tuff (Audétat, 2013), which is underestimated by DERP by ∼250 MPa, and the Kidnappers Ignimbrite 3 (KI3) of the Mangakino volcano (Cooper et al., 2016), which is overestimated by as much as 350 MPa. In the case of the Tunnel Spring Tuff, the reason for the two estimates’ dissonance might actually not come from DERP but rather be a consequence of the nature of the TitaniQ method of the independent approach. Audétat (2013) noted for the Tunnel Spring Tuff a zonation of the quartz grains that he explained by an increase in temperature by ∼110°C, a decrease in pressure by ∼350 MPa, or a combination of these effects. Audétat (2013) concluded that the zonation is mostly attributed to temperature changes but it appears possible that if a change in pressure actually was the predominant effect, the later conditions recorded in quartz rims might indeed be identical to the ∼200 MPa estimated by DERP. The second major mismatch, the KI3 ignimbrite of the Mangakino volcano, is interesting in so far as pressures for the other four investigated units of this volcano are reproduced well by DERP. The KI3 ignimbrite was noted by Cooper et al. (2016) for its exceptional melt composition. They proposed that this unit records a new recharge of the volcano’s magma chamber with less evolved melt. Although this apparently does not affect the amphibole phenocrysts used for the independent geobarometer, it obviously jeopardizes the DERP estimated pressure. This might be either because DERP is recording here the pressure at which the new, primitive melt was generated or, more likely, the new melt did not fully equilibrate with the tectosilicates of the old magma and was therefore not truly cotectic, despite appearing so in specimens.
Excluding the two outliers described above, the mean difference between the independent P and the P calculated by DERP is 38 MPa for PDERP and 37 MPa for PMC-DERP. We emphasize that the application of DERP must be accompanied by critical examination of any results. As melt inclusions, unlike matrix glass, are hardly ever in direct contact with feldspar and quartz at the same time, it is impossible to know in advance whether their compositions are cotectic or not. We propose that the application of DERP to melt inclusions should by default be accompanied by fluid saturation studies. The combination of both methods may be able to provide evidence for whether a melt is cotectic in composition and whether its volatile content actually represents fluid-saturated conditions.
Constraints with respect to precision
The uncertainty of pressure estimations using DERP is mainly related to three factors: the accuracy of the Qz–Ab–Or ternary projections used to construct the barometer, the quality of the linear fits used to describe the empirical behavior of the systems and the analytical uncertainties related to the determination of natural glass compositions. As explained previously in detail, the approach to constrain the position of the minimum points in the ternary projections in Fig. 3a–e results from a number of observations (analysis of residual melts in the experiments, constraints from liquidus temperature isopleths, constraints from liquidus phase) that are taken into account in the final representation of the phase diagram. The resulting uncertainty on the compositions of the minimum points is estimated to be at least ±2–2·5 wt % (Holtz et al., 1992b; see above) but may be higher for cotectic curves that are sometimes poorly constrained in some parts of the Qz–Ab–Or diagram, especially in terms of Ab-Qz compositions.
The error of the equations presented in this study is given as a coefficient of determination (Figs 5a and 6). Of course, we have already implied that there is a correlation between P, H2O and An content with these equations, and that this correlation is linear. Based on the empirical data available, such fitting appears justified, but future studies with higher resolution data may be able to detect nonlinear behavior in detail. (For more information on the mathematical data treatment see the barometer construction section of this study.) The third major source of error is related to the analytical uncertainty of the investigated natural glass compositions, which may differ depending on the quality of the data. DERP is based on calculation of a CIPW-norm and a systematic error on the measurement of SiO2, Al2O3, CaO, Na2O and K2O concentrations may substantially change the calculated pressure. The calculated pressure may be significantly affected if analytical errors lead to a shift of a cotectic glass composition recalculated for the projection in the dry reference system Qz–Ab–Or, from a position on the Qz–Ab cotectic curve to a position on the Qz–Or cotectic curve (minimum transit) or vice versa.
To illustrate the precision that can be obtained with the cotectic approach we used a natural glass composition analyzed in one sample of the Blacktail Creek Tuff (BCT, Table 10; see also table 1 of Bolte et al., 2015), and simulated the effect of random errors in composition, which occur inevitably either owing to analytical uncertainties or as a result of natural inhomogeneities, on the results of DERP geobarometry (Gualda & Ghiorso, 2014). We chose the BCT sample analyzed by Bolte et al. (2015) as a reference because the melt coexisted with quartz and two feldspars and the quenched glass matrix has been extensively measured (n = 58). The P of this system has also been estimated with a wide variety of methods including TitaniQ and an independent experimental approach (phase relationships of natural sample). We assume that the determined P range of 130–240 MPa given by Bolte et al. (2015) represents the state of the art in current petrological methods. If the mean value of the BCT composition (Table 10) is used to calculate P with DERP, the resulting pressure is 235 MPa (see Table 9). For the Monte-Carlo simulation we generated a set of 1000 normally distributed compositions based on the mean value and standard deviation given for the BCT by Bolte et al. (2015) for the relevant oxides SiO2, Al2O3, FeO, MgO, CaO, Na2O, K2O and H2O using the R software package. Figure 9 shows a histogram of calculated pressures with all these oxides allowed to vary independently. The overall scatter is large with calculated pressures varying from about –200 to 500 MPa. However, the peak of calculated pressures with frequencies >100 is clearly centered in the range 100–300 MPa. For this Monte-Carlo simulation of pressures, the mean value is 198 MPa with 1σ of 102 MPa (see Table 9), a result that falls within the pressure range proposed by Bolte et al. (2015). Although the mean P calculated with the Monte-Carlo simulation matches the P proposed by Bolte et al. (2015) more accurately than the P calculated from the mean melt composition only, the high 1σ of 102 MPa seems not to reflect the performance of the DERP geobarometer with respect to reproducibility and overall error, considering the results shown in Fig. 8.
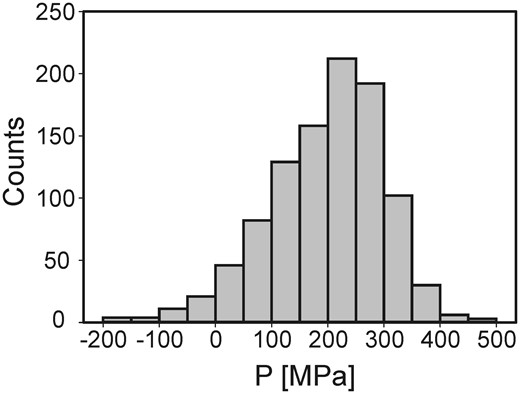
Histogram of calculated pressures for 1000 compositions derived for the Blacktail Creek Tuff (BCT) (see Table 10) by normally distributed Monte-Carlo simulation.
Natural glass composition of Blacktail Creek Tuff (BCT) from Bolte et al. (2015, Table 1)
| BCT glass | mean | 1σ | (%) |
|---|---|---|---|
| SiO2 | 77·02 | 0·82 | 1·1 |
| TiO2 | 0·18 | 0·01 | 5·6 |
| Al2O3 | 11·95 | 0·18 | 1·5 |
| FeO | 1·21 | 0·11 | 9·1 |
| MgO | 0·13 | 0·06 | 46·2 |
| CaO | 0·50 | 0·03 | 6·0 |
| Na2O | 2·93 | 0·17 | 5·8 |
| K2O | 5·70 | 0·25 | 4·4 |
| H2O | 2·00 | 0·50 | 25·0 |
To demonstrate the implications of compositional shifts and of the precision of analytical datasets on pressures calculated with DERP, we performed Monte-Carlo simulations to check for the individual role of the main oxide components (SiO2, Al2O3,FeO, MgO, CaO, Na2O, K2O and H2O), applied to the BCT composition described above. The results are shown in Fig. 10, which shows that a variation of SiO2 content of 1 wt %, which would correspond to ∼0·7 wt % normative Qz in the case of the BCT rhyolite, results in a change in P of ∼45 MPa. The change in pressure with changing SiO2 is linear, as the ratio of all other parameters influencing the normative contents (Ab, Or, An) and the H2O content remain constant. The histogram in Fig. 10b shows that SiO2 alone cannot be responsible for the full range of pressures determined in the multivariate Monte-Carlo simulation shown in Fig. 9.
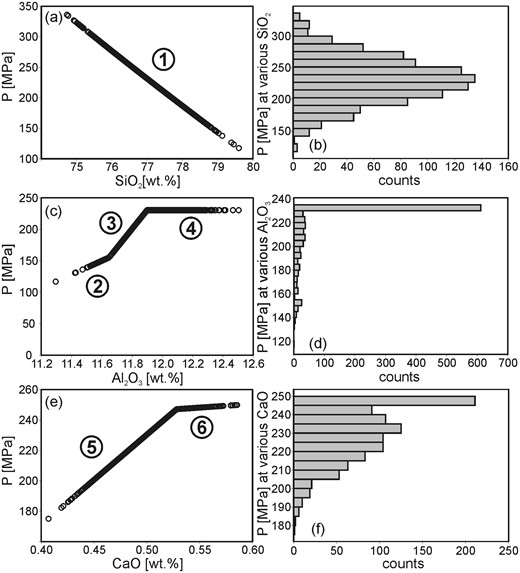
Illustration of the impact of varying oxides on the calculated pressure. For each relevant oxide pressure was calculated for 1000 Gaussian normally distributed values, whereas the other oxides were held constant at their mean value (BCT, Table 10). Circled numbers correspond to changes in pressure–oxide dependence predicted by DERP, which can be explained as follows: (1) linear Qz–P dependence; (2) corundum deficit limiting An formation; (3) corundum deficit after minimum transit (change from Qz–Ab cotectic to Qz–Or cotectic); (4) excess corundum; (5) An–P dependence; (6) minimum transit; (7) Ab–P dependence; (8) minimum transit; (9) corundum deficit limiting An formation; (10) corundum deficit limiting Ab formation (no An); (11) Or–P dependence; (12) corundum deficit limiting An formation; (13) minimum transit; (14) Qz–Or cotectic H2O–P dependence; (15) Qz–Ab cotectic H2O–P dependence.
The role of Al2O3 is shown in Fig. 10c and d. At high Al2O3 contents, there is a range of compositions where Al2O3 does not influence P because the CIPW norm predicts normative corundum and the proportions Qz/Ab/Or/An remain constant (Holtz et al., 1992a). In the compositional range without normative corundum, the calculated P decreases with decreasing Al2O3 because the amount of normative An is decreasing with a concomitant very slight increase in normative Qz (the CIPW norm calculates small amounts of wollastonite). The small variation of the slope of the curve in Fig. 10c observed at ∼11·7 wt % Al2O3 is a result of a change of the reference cotectic curve with changing An content (minimum transit). The compositions with more than 11·7 wt % Al2O3 plot along the Qz–Or cotectic, whereas compositions with less Al2O3 plot along the Qz–Ab cotectic.
The interplay of subtle changes in the CIPW norm and of projections on either the Qz–Ab or the Qz–Or cotectic also explain the various trends observed in the additional diagrams with changing CaO, Na2O and K2O (Fig. 10e–k). A detailed analysis of Fig. 10g–k shows that the correct analysis of the alkalis is crucial for an accurate determination of pressure. Figure 10g and i shows that the most extreme P variations are probably related to changes in Na2O and K2O content. In the BCT composition, variations of 0·1 wt % Na2O can affect the P estimated with DERP by ∼50 MPa. This strong effect is observed in the Na2O range ∼2·6–3 wt %. In this compositional range the compositions are peraluminous and plot on the Qz–Ab cotectic.
The effect of water on DERP is illustrated in Fig. 10m and n. The two different slopes of the curves in this figure are related to projections of the BCT composition on the Qz–Ab cotectic on the one hand (for low water contents) and on the projections on the Qz–Or cotectic on the other hand (for high water contents). For samples plotting on the Qz–Or cotectic, a change of 1 wt % H2O results in a variation of the predicted P of ∼35 MPa, whereas the effect is lower for samples plotting on the Qz–Ab cotectic.
As illustrated above, problems with the determination of Na2O and K2O contents can have strong consequences on P estimated by DERP. However, depending on the compositional field of the glasses (projection onto the Qz–Ab or Qz–Or cotectic; peraluminous composition or not) small compositional changes may have either negligible or important implications for the pressure estimation. As a consequence, a unique uncertainty value on the pressure estimation cannot be proposed and it is recommended to test the effect of possible compositional variations with DERP (available as an MS-Excel sheet in the Electronic Appendix) for each case study.
Comparison with the rhyolite-MELTS model
As mentioned above, the rhyolite-MELTS pressure estimation procedure is based on the same properties of the granitic system (positions of cotectic lines as function of pressure) as DERP. It is therefore interesting to test if the calibration (and calculation mechanism) presented in this study, based on new experimental constraints, leads to a significant improvement when compared with rhyolite-MELTS. Figure 11a and b compares P calculated with rhyolite-MELTS (x-axis) and DERP (y-axis). Rhyolite-MELTS P values are derived from Bégué et al. (2014b) in the case of Fig. 11a and from Pamukcu et al. (2015) in the case of Fig. 11b. In both cases, the pressures calculated with DERP are significantly higher than those calculated by rhyolite-MELTS. For the glasses analyzed by Bégué et al. (2014b), 5·5 wt % H2O was used to calculate pressures with DERP, based on estimations of typical melt water contents in the Taupo Volcanic Zone made by Allan et al. (2012) and Cooper et al. (2016). It is also emphasized that Pamukcu et al. (2015) determined pressures from glasses considered to be minimum compositions that coexisted with quartz and two feldspars. To evaluate the reason for the P gap observed between rhyolite-MELTS and DERP, the difference in P estimates between the two geobarometers for the data given by Pamukcu et al. (2015) is plotted against normative An content in Fig. 12. The results indicate a positive correlation between the pressure difference from the two models and the An content of the glasses. The differences in pressure estimation between DERP and rhyolites-MELTS could therefore at least partially be attributed to the different handling of the effect of normative melt An content on minimum compositions.
![(a) Pressures estimated either with rhyolite-MELTS by Bégué et al. (2014a) (x-axis) or DERP (y-axis). Each data point refers to a rhyolitic eruption in the Taupo Volcanic Zone [see Bégué et al. (2014a) for geological details]. The error bars represent 1σ of the average of numerous samples analyzed for every eruption. For the calculation with DERP, the water content was assumed to be 5·5 wt %. (b) Pressures estimated for the Peach Spring Tuff either with rhyolite-MELTS by Pamukcu et al. (2015) (x-axis), Q2F condition, or DERP (y-axis). As Pamukcu et al. (2015) implied water saturation for their calculations, the results of the calculations with DERP were obtained using a melt water content of 4 wt %. As no error was given for the data of Pamukcu et al. (2015), no error can be calculated for the DERP estimated pressures.](https://oup.silverchair-cdn.com/oup/backfile/Content_public/Journal/petrology/58/4/10.1093_petrology_egx034/1/m_egx034f11.jpeg?Expires=1716389010&Signature=qdQ2M8cpkRFOIivzuTNAfE42koOBdZwjnDlBAPOm9oSrQIV12XEjqAuq3UDFLdmQsKLf-G7qHgjS3zDq8vn3bwCHHCeDV2Xqvy8SKhqQQhQwg3McGm6lt5XPDfaW08b~7Dq2E9ZIP12KnnWTyd26owrzfpYF7~QQnF-WIhg927c0TR4vAF9nR5twumc-~DGGw2U0GJTmbieybYwYy2iovWhO9z6oToTi1x6jksscaejKgFFxN0Pgfk0AW5sUxJBIlLWFfA5v5P13jl-FjMJKpcnTWXxrF5tsIlY5segrHM4dCbOk1Vw~COlpFDXjEEhpKdGI6FQA~OpIZVUWmo36Wg__&Key-Pair-Id=APKAIE5G5CRDK6RD3PGA)
(a) Pressures estimated either with rhyolite-MELTS by Bégué et al. (2014a) (x-axis) or DERP (y-axis). Each data point refers to a rhyolitic eruption in the Taupo Volcanic Zone [see Bégué et al. (2014a) for geological details]. The error bars represent 1σ of the average of numerous samples analyzed for every eruption. For the calculation with DERP, the water content was assumed to be 5·5 wt %. (b) Pressures estimated for the Peach Spring Tuff either with rhyolite-MELTS by Pamukcu et al. (2015) (x-axis), Q2F condition, or DERP (y-axis). As Pamukcu et al. (2015) implied water saturation for their calculations, the results of the calculations with DERP were obtained using a melt water content of 4 wt %. As no error was given for the data of Pamukcu et al. (2015), no error can be calculated for the DERP estimated pressures.
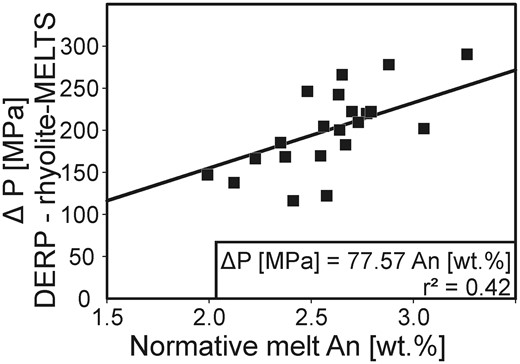
Difference in P (MPa) (ΔP) from estimations calculated with rhyolite-MELTS and from DERP for the dataset of Pamukcu et al. (2015), as a function of the normative An content of the glass. The pressure difference between the two models increases with the normative An content. The black line represents a linear trend calculated by least squares that matches the data with a coefficient of determination of 42%. The equation of the linear fit given in the figure may be applied for a rough correction of calculated pressures with rhyolite-MELTS.
As mentioned above, the position of the minimum point in an An-bearing rhyolitic system had, until now, been determined experimentally for only three levels of An content (James & Hamilton, 1969). Therefore, when Blundy & Cashman (2001) proposed their equations to make projection in the haplogranite system usable for natural compositions, they had only a very limited available dataset. As shown in Figs 4 and 5a, the data presented in this study on the position of An-bearing minima, although they agree in principal with those from James & Hamilton (1969), do so within a certain error. Owing to this 2–2·5 wt % error, interpretations based on only three datapoints are strongly affected by outliers (see minimum points 15 and 17 in Fig. 5a). This effect is less severe for equations (1) and (6) of DERP that perform a similar task to the Blundy & Cashman (2001) projection scheme, but could be calibrated using a much larger database.
Although rhyolite-MELTS itself does not use the Blundy & Cashman (2001) projection scheme as part of its calculation mechanism, estimates of the effect of An by rhyolite-MELTS reproduce the general trend of estimates made with this projection (Gualda et al., 2012). We therefore speculate that the same problems with constraining the effect of An at higher pressures and An contents that exist for the Blundy & Cashman (2001) projection can be found in the rhyolite-MELTS calculations, ultimately leading to a underestimation of pressures. At this point, with two inconsistent melt-silica content based geobarometers available, we propose that the most viable approach to test their accuracy is the direct comparison with independent geobarometers. An experimental study designed to allow for a simultaneous test of all five geobarometers mentioned in this study (amphibole, DERP, fluid saturation, rhyolite-MELTS, TitaniQ) might be another interesting approach to shed light on this issue.
CONCLUSIONS
Our experiments in rhyolitic systems with five different conditions with respect to pressure, An and melt water contents demonstrate that the effect of normative melt An on the position of cotectic curves and minimum points is of critical importance for geobarometry using a ternary projection in rhyolitic systems. Our newly expanded database was used to constrain the effect of normative melt An on phase equilibria and indicates that previous attempts underestimated the effect of normative An (in the range 0–7 wt % normative An) on the position of the minimum points. A new geobarometer was calibrated based on our experimental results (DERP) and is available as an MS-Excel sheet, which can be downloaded from the Supplementary Data. DERP is calibrated for pressures in the range 50–500 MPa and takes into account the effect of normative An content as well as of melt water content. Pressures estimated with DERP are in good agreement with independent approaches used to determine magma storage pressures (barometers or experimental approaches). We emphasize, however, that any user of DERP has to carefully evaluate if the investigated glass compositions are truly suitable for the geobarometer, especially if these compositions are truly saturated in quartz and feldspar. For the investigation of melt inclusions that are usually in direct contact with one mineral only, an accompanying study of melt volatile contents and possible saturation pressures is probably necessary to crosscheck the congruence of the resulting pressures.
Our barometer DERP uses the same input information as the rhyolite-MELTS geobarometer. Whereas rhyolite-MELTS relies entirely on the calibration of a rigorous thermodynamic model based on experiments in a natural system, the mechanics behind DERP are substantially different. For the construction of our geobarometer, we followed the approach of Blundy & Cashman (2001) of making more complex, natural data projectable in the well-described, simplified haplogranite system. With the broadly expanded experimental database presented in this study on the effect of An on the Qz–Ab–Or projection, we were able to provide a model with updated equations, increasing the accuracy of estimated minimum point positions. Although rhyolite-MELTS can successfully model results of the Blundy & Cashman (2001) projection scheme, pressures estimated with this model are systematically lower than those calculated with DERP. The evidence presented in this study indicates that a possible explanation for this offset might be found in the different assessment of the effect of An in the two models. Because it is calibrated experimentally, we are confident that DERP has a significant advantage in this respect. However, given the available data, we acknowledge that it is too early to draw any definite conclusions and propose that both geobarometers need to be tested and compared in the future to evaluate the nature of this incongruence.
Monte-Carlo simulations were used to demonstrate that the analytical uncertainty of glass compositions, especially for alkali concentrations, needs to be determined accurately to extract reliable information from geobarometers based on the cotectic compositions of rhyolitic systems. We propose that glass measurements that are to be used to calculate pressures with DERP should be of the highest possible quality and designed with a special focus on the correct determination of alkalis. It is once more emphasized that the reliability of pressure estimates can be greatly enhanced by the combination of two or more geobarometers. A potential candidate for such a complementary approach is the TitaniQ geobarometer (Huang & Audétat, 2012), which, unlike amphibole or fluid-saturation geobarometry, should be applicable in any situation where the prerequisites for DERP geobarometry are matched. However, its application requires a good understanding of the history of individual quartz minerals in magma plumbing systems.
ACKNOWLEDGEMENTS
We would like to thank the workshop staff at the Institut für Mineralogie of the Leibniz Universität Hannover, Manuel Christ, Björn Ecks and Ulrich Kroll for technical support with the high-pressure vessels, and Julian Feige for sample preparation. Further thanks go to Harald Behrens, Tim Müller, Eric Wolff and Chao Zhang for analytical support, and to Eric Christiansen, Torsten Bolte and André Stechern for fruitful discussions.
FUNDING
This work and Sören Wilke were supported by the Deutsche Forschungsgemeinschaft (DFG; ‘German Research Foundation’) (project HO1337/31) in the frame of the ICDP program. David A. Neave acknowledges support from the Alexander von Humboldt Foundation.
SUPPLEMENTARY DATA
Supplementary data for this paper are available at Journal of Petrology online.
