


Abstract
Fluid driven seismicity has been observed worldwide. The occurrence of intraplate seismicity triggered by pore pressure perturbations is a widely accepted process. Past analysis of earthquake swarms in the NW-Bohemia/Vogtland region provided evidence for the diffusion of pore pressure fronts during the migration of earthquakes within each swarm. Here, we test the hypothesis whether the diffusion of hydraulically induced pore pressure perturbations from the surface to the hypocentral depth could be a valid trigger mechanism. We test this hypothesis for the earthquake swarms in the Nový Kostel focal zone based on the analysis of 121 earthquake swarms and microswarms which occurred between 1992 and 2016.
During the past 30 yr, 90 per cent of the earthquake swarms clustered beneath the village Nový Kostel within a depth range between 6 and 12 km. The spatial distribution of the swarms suggests a main diffusion pathway to the hypocentres, namely conduits along a NW-SE trending fracture zone which can be correlated at the surface with a part of the Libocký creek. A secondary branch of this fault zone exits in the southern part below the Horka reservoir. The filling of this reservoir began in 1969 and might have triggered the first significant earthquake swarm during the last century within the Nový Kostel area in the year 1985/1986. Since then, both the number of potentially triggered swarms as well as the number of microswarms increased with time.
According to a robust statistical evaluation, hydraulically induced pore pressure perturbations could have triggered at least 19 per cent of the analysed earthquake swarms assuming effective diffusivities of 0.5 m2 s–1. Thus, hydroseismicity seems to be a valid option to explain at least a part of the earthquake swarms. The alternate hypothesis that ascending/intruding magmatic fluids trigger the remaining part of the earthquake swarms is another potential but weak option.
1 INTRODUCTION
Hydroseismicity describes the triggering of earthquakes due to pore fluid pressure perturbations induced by hydrological events at the surface (precipitation, snow melt and surface run-off) and its diffusion along faults/conduits towards the hypocentral depths. This migration process can be described by the diffusion of hydraulic pressure pulses. A comprehensive discussion of the theoretical basis of this fluid-induced seismicity had been performed by Shapiro (2015). First important results of hydroseismicity were presented by Costain et al. (1987). Various parameters that might influence the triggering of seismicity at different depths were discussed by Costain (2008). A comprehensive review of about 30 worldwide studies of hydroseismicity were presented by Costain & Bollinger (2010). Saar & Manga (2003), analysed an example of induced seismicity caused by the recharge of groundwater reservoirs by spring snow melt. The seismicity occurred at 4–5 km depth and was triggered by hydrostatic pressure increases which propagated with a diffusivity of ∼0.1 m2 s–1. Christiansen et al. (2005) identified groundwater recharge with diffusion of excess pore pressure and snow unloading as an external forcing mechanisms to trigger local seasonal seismicity.
The relevance of hydroseismicity is also evident in the context of reservoir induced seismicity (Howells 1974; Dura-Gomez & Talwani 2010; Telesca 2010; Stabile et al.2014; Hainzl et al.2015). Talwani et al. (2007) give an overview of induced seismicity and introduced the so-called seismogenic permeability, as precondition for hydroseismicity.
Telesca (2010) analysed the reservoir-induced seismicity of Koyna-Warna area (India) between the years 2001 and 2004 and identified statistically significant correlations between the daily water level and the daily number of earthquakes with a time lag of approximately 223 d, corresponding to an average vertical hydraulic diffusivity of 0.2 m2 s–1 for that area. In particular, this statistical evaluation of the hydroseismicity process can be considered in regions where seasonal meteorological influences induce the trigger pulses, such as monsoons (Bettinelli et al.2008; Hainzl et al.2015).
Hainzl et al. (2006) gave an example of rainfall-induced stress changes which triggered the local seismicity at Mt Hochstaufen in the Alps. Afterwards, Hainzl et al. (2013) presented a comprehensive forecast model which tested the influence of the pore pressure changes at depth due to rainfall, tidal and thermoelastic stress changes.
A similar process of induced seismicity by pressurized fluids occurs on a smaller scale at boreholes where the fluid pressure increased above the critical pressure range during injection tests, for example at the German Continental Deep Drilling Site (KTB, Zoback & Harjes 1997; Shapiro et al.2006). At KTB, small pressure perturbations ‘as low as 0.01–1 bars at the hypocentres’ (Shapiro et al.2006) were sufficient to induce micro-earthquakes.
The area of interest, the Nový Kostel (NK) focal zone in the NW-Bohemia/Vogtland (NWBV) earthquake swarm region can be characterized as one of the seismically most active regions in central Europe. The stress field in the area is dominated by the NW-SE component of the European stress field (Heidbach et al.2008; Vavryčuk 2011). This normal stress component is the main reason for a stress accumulation up to the subcritical steady state. The occurrence of earthquake swarms in this region has been known since the 19th century. During the last 30 yr, strong earthquake swarms were recorded in the years 1985/1986, 1997, 2000, 2008, 2011, 2013 and 2014. The local magnitudes are usually less than ML = 4.0 except for some single events, for example ML = 4.4 in May 2014 (Hainzl et al.2016). Comprehensive investigations of the earthquake swarm phenomena at such intraplate fault zones were performed but the mechanisms and triggering processes of this specific seismological phenomenon are not fully understood yet. In general, earthquake swarms are characterized as a sequence of earthquakes which are clusterized in time and space but without any predominant, principal earthquakes (Yamashita 1998). Fischer et al. (2014) gave an overview about the current state of the art on this topic.
Mrlina et al. (2003) and Gaždová et al. (2011) first considered hydrological influences as possible trigger for the seismicity at our area of interest, however these studies were not successful. Their hydrological data were recorded in wells (groundwater level) and were likely not linked with the interconnected and deep-reaching hydraulic system. Hydrological short-term indications, in particular groundwater level variations, were recorded by Koch et al. (2003) a few days before the onset of the year 2000 earthquake swarm. However, similar anomalies could not be repeated with the same significance for the following earthquake swarms. The possible origin of earthquake swarms in NWBV region due to an overpressurized mantle degassing, in particular CO2, were discussed, for example by Horálek & Fischer (2008), Heinicke et al. (2009) and Bräuer et al. (2008, 2014). Babuška et al. (2016) expanded this hypothesis taking into account the influence of tectonic stress on the subsidence of the Cheb basin.
Here, we test the hypothesis that hydraulically induced pore pressure perturbations (HIPPPs) at the surface migrate to the focal depths and thus might trigger at least part of the earthquake swarms observed in the NK focal zone.
2 STUDY AREA AND DATA INPUT
The NWBV region is located on the border region of Czech Republic and Germany. Fig. 1 shows the study area with the distribution of the epicentral clusters, important creeks and rivers and the CO2 gas emission sites at mineral springs or mofettes.
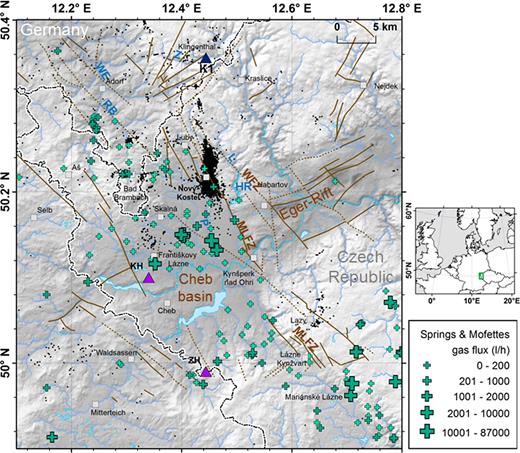
The area of investigation—the NW-Bohemia/Vogtland earthquake swarm region. Legend: black dots—epicentres 1992–2016. Blue triangle—gauge station K1 at the creek Zwota/Svatava; green crosses: mineral water springs with CO2 or mofettes; blue lines—local rivers and creeks: Z, Zwota; WE, Weiße Elster; RB, Rauner Bach; HR, Horka reservoir; brown lines—faults according to 1:500 000 geological map of the Česká geologická služba Prague; purple triangles: Quaternary volcanoes KH, Komorní Hórka (Kammerbühl); ZH, Železna Hórka (Eisenbühl).
2.1 Geological setting and seismicity
The main tectonic structures are the NE-SW trending Eger rift, the NW-SE trending Mariánské Lázně fault zone (MLFZ), the parallel trending Wohlbacher fault zone (WFZ) and the N-S trending Počátky-Plesná zone (PPZ) (SLUG 1996; Bankwitz et al.2003; Schunk et al.2003; Peterek et al.2011). Other tectonic faults in E-W and N-S striking directions are further tectonic features indicating a highly fractured region (http://mapy.geology.cz).
The WFZ along the Libocký creek valley plays an important role for our analysis as a potential pathway for fluid migration and diffusion of pressure pulses. It is located at a distance of about 3 km subparallel to the MLFZ. Here, the bottom of the valley has an elevation of 550 m a.s.l., whereby the surrounding plateaus are about 80–150 m higher. Vertical displacements observed by GPS campaigns by Mrlina & Seidl (2008) give hints that this fault zone may separate two blocks, east and west of it, of different geodynamical activity.
The normal stress component is thought to be responsible for the stress accumulation and the seismic activity in that region (Horálek et al.1996; Vavryčuk 2002; Horálek & Fischer 2010; Vavryčuk 2011; Vavryčuk et al.2013). Three local seismological networks, the Czech networks WEBNET (Fischer & Horálek 2003) and KRASNET (Nehybka & Skácelová 1995), and the Saxonian Network SXNET in Germany (Korn et al.2008), record seismicity with local magnitudes as low as approximately ML = –1. Typical b-values of the earthquake swarms are ∼1.0 (Fischer et al.2010). Strong historic earthquakes occurred N and NE of the MLFZ (see fig. 19 in Fischer et al.2014) in the years 1824, 1897, 1903, 1908 and 1962. The spatial distribution of earthquake swarms and microswarms in the past 30 yr is illustrated in Fig. 1 (shown are 19 200 earthquakes with ML > 0 between January 1992 and December 2016). The epicentres of most earthquakes can be separated into several local clusters (Horálek et al.1996; Fischer et al.2014). The NK focal zone is the seismically most active cluster since 1985 (Fischer et al.2014). The distribution of hypocentres at the NK focal zone can be described as a narrow NNW-SSE striking belt of about 12 km × 2 km (Fischer et al.2014). The focal depths range from 6 to 12 km.
A comprehensive discussion of the focal mechanisms in comparison to the tectonic stress field shows that the prevailing strike direction of the earthquakes is about 169° with a dip range of 68°–80° WSW (Vavryčuk 2011; Vavryčuk et al.2013). These left-lateral strike-slip focal mechanisms represent the majority of the NK earthquake swarms. The strike of the principal fault zone follows the strike of the PPZ. The second and less important focal mechanism type is a right-lateral strike–slip on principal faults with a strike of 304° which was dominant during the earthquake swarm of 1997.
For our analysis, we have used the time-series of earthquake activity which occurred in the most prominent focal zone of NK within an area of 50.19–50.26° N and 12.43–12.46° E in the period 1992–2016. These data were compiled from the WEBNET bulletin (by courtesy of T. Fischer, Charles University/GFU Prague). The magnitude of completeness of this bulletin is about –0.3 (Fischer et al.2010). We identified in total 121 earthquake swarms, most of them are microswarms or subphases of the major swarms, according to their spatiotemporal clustering. We have used the following selection criteria to define a microswarm: (i) at least five earthquakes in a spatial cluster within 48 hr, and/or (ii) at least 1 km vertical or horizontal distance to the previous microswarm. In each case, we considered the first earthquake as representative for onset of the swarm or their subphases, hereafter referred as SOQ (swarm onset quake). Supplementary Table A1 contains the list of these 121 SOQs (see the Appendix Online ) and Fig. 2 shows their epicentral distribution and focal depths.
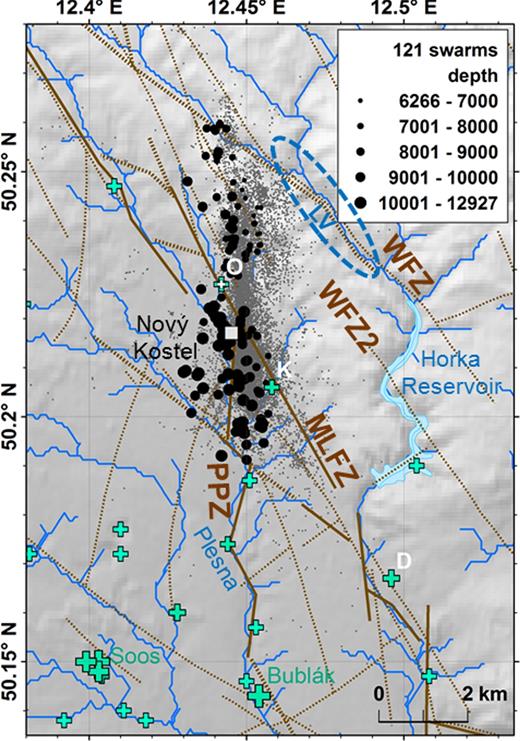
Distribution of 121 SOQ in the NK focal zone (black dots). The size of the dots indicates the focal depth in m. Blue dashed ellipse: possible infiltration area of hydraulic pressure pulses at the Libocký valley. Faults from the geological map 1:50 000 (Česká geologická služba): MLFZ, Mariánské Lázně Fault Zone; PPZ, Počátky–Plesná zone; WFZ, Wohlbacher Fault Zone; WFZ-2, parallel branch of the WFZ. Green crosses are CO2 gas emission sites. The size indicates the relative amount of gas release. The gas emission sites near Dolni Čáskov (D), Kopanina (K) and Oldřišská (O) depict on the MLFZ outcrop.
2.2 Hydrology and hydrogeology
The hydrology of the study area is characterized by the northward-flowing river Weiße Elster (WE in Fig. 1) as main river system, which is fed among others by the creek Rauner Bach. In the Southern part, the creeks Plesná, Libocký and Zwota (German name)/Svatava (Czech name) discharge into the main river Ohře.
Previous studies have used river discharge as a proxy for the relative pressure variations at the surface and applied it as an input to calculate the relative fluid pressure variations within the crust (Saar & Manga 2003; Costain 2008). For our studies, we analyse discharge records of the gauge station Klingenthal 1 (12.444° E, 50.356° N, K1 in Fig. 1) located at the Zwota/Svatava creek. The gauge station is located about 15 km North of NK. Discharge has been measured since 1960 by the Saxon State Office for Environment, Agriculture and Geology (LfULG), Dresden, Germany. The mean discharge equals 1.16 m3 s–1 with a maximum of 40 m3 s–1 during a snow melt period measured in December 1974. During periods of low precipitation, discharge decreases to 0.4 m3 s–1 and less. A seasonal influence to the discharge was not identified at our area of study except for the spring snow melt, which depends on the precipitation and ambient temperature before the melting period. However, this effect varied from year to year and therefore, we consider the hydrological signal as a continuous oscillation without a strict annual periodicity.
An important precondition for hydroseismicity is the existence of a groundwater recharge area linked to an interconnected fault system. Different options of superficial water inflow to these fracture zones are discussed by Lachassagne et al. (2011) and references therein. Studies of the groundwater inflows into mines in the nearby Ore Mountains (about 40 km NE of NK) indicates a typical fracture system caused by the Variscan orogeny with an increased fracture transmissivity of the crystalline basement rocks of up to 10−5 m2 s–1 (Achtziger-Zupančič et al.2016). These fractures have the same typical NW-SE strike direction as in the NK region, and are believed to have a genesis comparable to that of our area of investigation.
In our study, we consider the area around the Libocký valley (WFZ) close to the NK focal zone to be a groundwater recharge area for our studies which ‘provides a natural pore fluid pressure signal of narrow temporal width and potentially large amplitude’ (Saar & Manga 2003). However, periods of strong rain events do not only affect the shallow aquifer. Deeper aquifers within the metamorphic rocks are also affected and refreshed by the infiltration of precipitation. During intensive precipitation, additional hydraulic pore pressure could be generated within the damage zones during the transition from an unsaturated to a saturated fracture zone according to their specific extension (Bense et al.2013; Thomas et al.2016). This elevated hydraulic pressure could be proportional to the height of the water-filled hydraulically active fractures at the steep slopes of the Libocký valley. Fig. 3 shows a sketch of the origin of these additional aquifer heads. This hydraulic situation can prevail over several days or even a few weeks and could provide the basis for the pore pressure perturbations discussed here. In the case of an interconnected fluid system (blue dashed lines), an additional hydraulic pressure head could build up along these slopes and diffuse along the WFZ to the hypocentres. The northern cluster of hypocentres at this latitude (black dots) shows an interesting deviation towards the east (Vavryčuk et al. 2013; Fischer et al. 2014) which could correspond with the WFZ. This link could be the shortest part of the diffusion pathway for the fluid pressure pulses towards the hypocentres (more details will be discussed in Sections 4.5.2 and 4.5.3). The length of the diffusion pathways increases towards the south because of the SE-NW trending WFZ in comparison to the N-S trending focal zone.
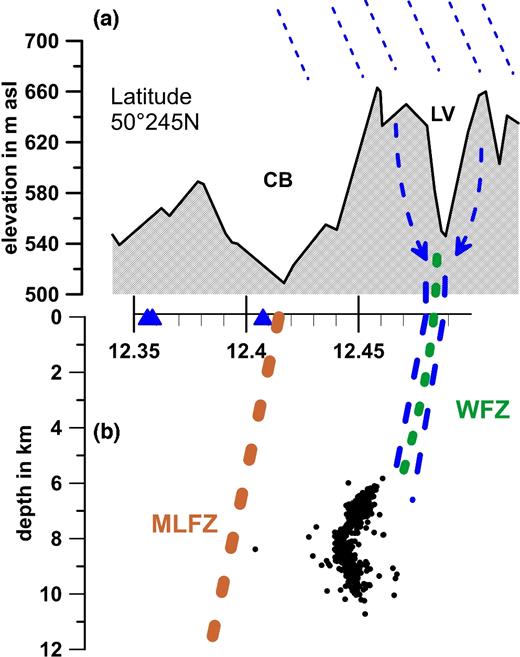
Sketch of the hydrological and seismotectonic situation in the epicentral area north of NK during a rainy period (indicated by the oblique hatched blue lines on top). (a) The elevation profile of the northern Cheb basin (CB) and the Libocký valley (LV) along the latitude of 50°245 N. Blue triangles: CO2 gas emission sites at this latitude. (b) Depth section showing the hypocentres (black dots), the WFZ (green dashed line) and a possible hydraulic link from the surface to the hypocentres (blue dashed line). The WFZ and the MLFZ (brown dashed line) are shown with an assumed dip of about 80° SW.
We consider this diffusion pathway along the WFZ as the most important one for the northern part of the focal zone. At the southern end of this infiltration line, the Horka reservoir provides an additional potential source for temporal hydraulically pressure variations. The morphology of this reservoir follows a meandering structure, starting with the Libocký valley (WFZ) and changes towards the south in a parallel SW-located branch of the WFZ (Fig. 2, WFZ2). That means that another hydraulic link to the southern focal zone could exists via this secondary branch of the WFZ in addition to the northern part along the creek.
This reservoir and its water level oscillations respond to the same local hydrological events. For simplicity, we use the Libocký infiltration line instead of the Horka reservoir level data—which shows a similar temporal behaviour—for the calculation of the pore pressure changes at the focal depths. Obviously, we cannot identify which pressure front arrives first at the hypocentres: from the Libocký valley or from the Horka reservoir; likely both in the middle of the NK cluster, while pressure fronts starting in the Libocký valley and the Horka reservoir should reach the northern and southern parts first, respectively.
It is important to note, that the Horka reservoir might also play an important role for the historical development of hydroseismicity within the NK area. The Libocký creek feeds into the Horka Reservoir, which was built in the years 1966–1970. The elevation of the dam is 40 m and the reservoir contains a water volume of about 19×106 m3. The initial swell started in the year 1969. After the filling process was finished, typical water level oscillations of about 10 m maximum were observed in the past 35 yr (data by courtesy of VODNÍ DÍLA—TBD a.s.) which correlate with the temporal discharge variations of the Zwota gauge station in relation to the local hydrological situation/events. A data gap of the first years (1969–1982) was filled according to the following assumptions: (i) a constant filling rate during the first 3 yr, and (ii) thereafter (1972–1982) the artificial data reflect typical temporal variations which were observed in the following years. Differences to the real history would cause a minor increase in the pore pressure because of the strong amplitude of the initial phase (about 31 m) in comparison to the lower short-term oscillations (±5 m) thereafter.
2.3 Magmatic fluids
Another feature within the study area is the occurrence of mantle derived fluids at the surface, in particular CO2. More than 200 acidic mineral springs with different concentrations of CO2 and mofettes are known (Egerter et al.1984; Weinlich et al.1999). Fig. 1 shows their distribution within the study area. The CO2 discharge is related to the continuous fluid migration from magmatic reservoirs in the crust/mantle transition along conduits to the surface. The isotopic signatures of these fluids, in particular the δ13C values of CO2 between –4‰ and –2‰ PDB, as well as the increased 3He/4He ratios up to 6 Ra indicate their magmatic origin (Weinlich et al.1999; Bräuer et al.2008, 2014). Such migration along fluid-saturated, interconnected conduits indicates that deep reaching fracture zones exist in this region. According to travertine dating in the nearby spa Karlovy Vary (Vylita et al.2007) and investigations of alteration in the fracture zone obtained from one of the mineral springs with mantle-derived fluids (Bad Brambach, Heinicke et al.2009), these conduits have existed for more than 200 000 yr.
The following transients in fluid composition have been observed—given in chronological order:
1994: Isotopic shifts in δ13C and 3He/4He observed for several months following the earthquake swarm of 1994 December 4/5 were explained by the admixture of crustal fluids—released at the hypocenter—to the background mantle flux (Bräuer et al.2008).
2000: A methane (CH4) increase and simultaneous δ13Cmethane decrease had been observed at the Wettinquelle in Bad Brambach about 8 wk after the onset of the 2000 seismic swarm which lasted from August until December (Bräuer et al.2005, 2007). Furthermore, a decrease of the 3He/4He ratios was observed at all monitoring locations before the beginning of the swarm (Bräuer et al.2008).
2000–2002: At several locations within the Cheb basin (e.g. Dolní Častkov, Hartoušov), Bräuer et al. (2008) found significantly higher 3He/4He ratios as compared to a previous sampling campaign during 1992–1994, which indicated either increased permeabilities and/or shorter distances to the degassing magma.
2005: The 3He/4He trend described above continued at the mofettes of Dolní Častkov and Hartoušov (Bräuer et al.2008). A value of 5.89 Ra was obtained for the Hartoušov mofette, which is within the range of European subcontinental lithospheric mantle (SCLM) xenoliths (6.3 ± 0.4 Ra; Gautheron et al.2005). 3He/4He remained in the SCLM range during 2006–2008 (Bräuer et al.2009).
2008: Following the strong swarm of October 2008, samples were taken fortnightly from selected springs and mofettes until April 2011 (Bräuer et al.2014). A long-term δ13C trend (2005 until 2011) at Bublák was presumably related to a progressive magma degassing process.
Note, that the transients of 1994 and 2000 refer to post-seismic changes in the fluid regime. The shift in 3He/4He ratios towards higher mantle contributions is temporally not well resolved: it occurred between 1992 and 2002 and thus could be pre-, co- or post-seismic. Furthermore, the majority of CO2-rich springs and mofettes are located to the W and SW of the NK focal zone. No indications for mantle degassing are known for the area NE of the MLFZ at NK or above the other epicentral clusters around the locations of Klingenthal, Luby or Lazy.
3 HYPOTHESIS
The hypothesis that we present here is that a sudden increase in the pore fluid pressure at the surface induced by extreme hydrological events (e.g. intense precipitation, snow melt, and surface run-off) perturbs the pore pressure at depth through hydraulic pressure diffusion and may trigger earthquake swarms in the NK focal zone. Very little is known about the fluid pathways and subsurface structures in this area. Therefore, in order to calculate the pore pressure changes at depth, we have to make reasonable assumptions on (i) the potential infiltration area and diffusion pathways (Section 3.1) and (ii) the effective diffusivity (Section 4.1).
3.1 Infiltration area and pathways
The depth distribution of the SOQs (swarm onset quakes) shows a spatial trend from NNE, where the shallowest earthquakes occurred, to SSW, where the deepest ones are located (Fig. 2). Fitting a line to the 70–80° dipping plane of SOQs in the northern cluster (Vavryčuk et al.2013; Fischer et al.2014) and extrapolating this line up to the surface, a possible infiltration area of a pressure pulse propagating from the surface down to the focal zone can be found: the NW-SE trending WFZ. Morphologically, the WFZ is represented by the Libocký creek, which is found within a steep valley (Fig. 3). We will use this valley as the starting point for estimating the migration distance between the surface and hypocentres. At greater depths, other fracture zones with horizontally oriented structures might exist. In fact, a recent reprocessing of the reflection seismic profile 9HR profile (Mullick et al.2015) reveals a complex pattern of predominantly subhorizontal bright reflectors at a depth of about 5–8 km below the Libocký creek area. These features can be interpreted as horizontal or subhorizontal fluid accumulations zones being part of the migration pathways for the diffusion of pressure pulses.
3.2 Diffusion of pore pressure perturbations
The widely accepted interpretation of the earthquake swarm phenomenon considers pore pressure perturbations as the initial trigger for rupturing (Shapiro et al.2003). Increased pore pressure of crustal fluids reduces the friction and fulfils the Coulomb failure criteria (CFS) for shear failure. Hainzl (2004) modelled this process for the conditions of the NK focal zone. In a study of the 2008 swarm stresses, Vavryčuk et al. (2013) found that most of the activated fault segments were optimally oriented for failure and had intrinsically a high instability. Therefore, a small increase in pore pressure may be enough to meet the Coulomb rupture criterion. The resulting changes in the local stresses, in addition to the continuous diffusion of a pore pressure perturbation, could lead to a cascade of ruptures observed as a seismic swarm. The tensile component in the moment tensors (Vavryčuk et al.2013) indicates the opening of fractures, further supporting this hypothesis.
The pore pressure pulse propagates the distance r within the diffusion time td according to the local effective hydraulic diffusivity Deff (in m2 s–1). The latter is defined as the ratio of hydraulic conductivity (in m s–1) to specific storage coefficient (in m−1). An important assumption for far-reaching pressure transients is existence of a hydraulically connected fracture system (e.g. fault zones) with conduits of high permeability which is, however, typical for seismically active regions.
The hydraulically induced pore pressure perturbations (HIPPPs) act in addition to the undrained hydrostatic pressure, and are thus given in relative units because the real value of pressure increase near the surface during a hydrological event is unknown. Our evaluation is based on the daily values of stream discharge rates Q recorded at a nearby gauge station (K1 in Fig. 1). In that way, the discharge can be considered as a proxy for local hydrological events with their respective amplitudes and durations determined with a high temporal resolution.
Fig. 4 shows an example of relative HIPPPs at different depths caused by a spike-like event of the river discharge (Q)—taken as a proxy for a pressure disturbance at the surface. As can be seen in the figure, the temporal delay of the relative pressure increases towards larger diffusion distances and amplitudes attenuate with increasing depth/distance.
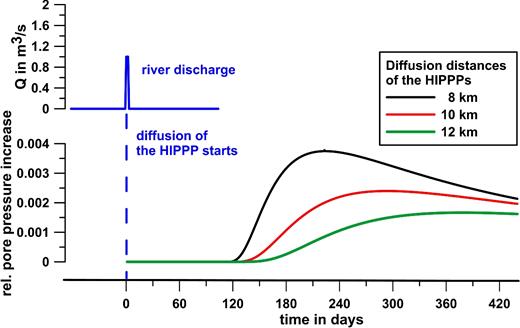
Example of the diffusion of a pore pressure front from the surface (e.g. a river) to different distances at depth along fracture zones. The pressure perturbations are shown with relative amplitudes. The effective diffusivity Deff is 1.0 m2 s–1 in this example.
4 RESULTS AND DISCUSSION
4.1 Effective diffusivity
Calculation of the pressure front diffusion towards the seismogenic depth according to eq. (2) requires knowledge of the effective diffusivity. Very likely, the hydraulic diffusivity will be different for and within each fault/fracture zone, depending on different permeabilities at different depths and the heterogeneity of the upper crust. The question is therefore: if the earthquake swarms are possibly triggered by a hydrostatic pressure increase at the surface, which effective diffusivities would be required? Three approaches are considered to find the most probable solution:
Estimation of the diffusivity range from extreme hydrological events (Section 4.1.1)
Identification of periods of increased pore pressure at the hypocentres (Section 4.1.2)
Diffusivities during the expansion of earthquake swarms (Section 4.1.3).
4.1.1 Estimation of the diffusivity range from extreme hydrological events
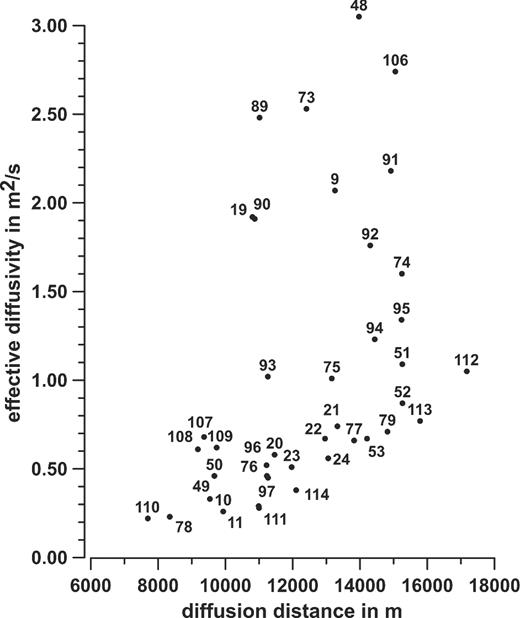
An effective diffusivity range would present a kind of integral approximation over the different diffusion pathways. A preliminary approximation can be obtained from the analysis of exceptional periods with one major (spike-like) discharge event—a so called hydrological master event—within overall low discharge periods followed by one or several swarms/microswarms. This analysis assumes that all earthquake swarms following within 1 yr after the hydrological master event are triggered by this HIPPP. Fig. 5 shows six hydrological master events and their possibly triggered earthquake swarms (represented by the SOQ). The epicentres and focal depths are indicated in Table A1 (see Online) as well as the diffusion distance, diffusion time and the corresponding diffusivity according to eq. (1). This simplified analysis gives a first overview about the range of diffusivities which might be expected. The diffusivities vary between 0.22 and 3.05 m2 s–1. The distribution of these 40 analysed diffusivities and their respective diffusion distances is presented in Fig. 6. More than 60 per cent of these values are ≤1 m2 s–1, 85 per cent having diffusivities <2 m2 s–1. One single outlying diffusivity of 7.0 m2 s–1 (swarm 47) was excluded because it is probably overestimated.
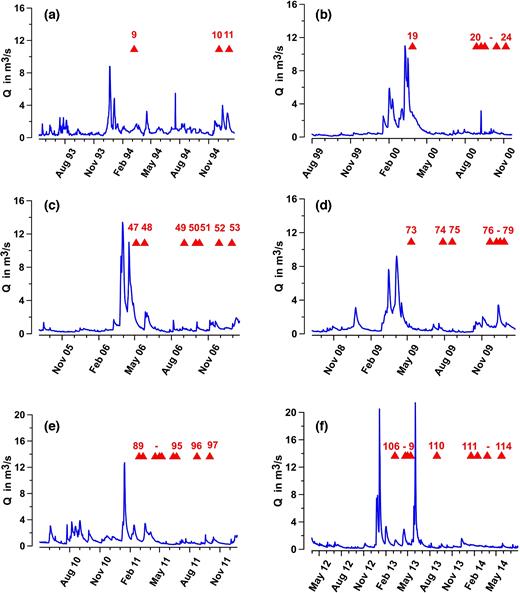
Six hydrological master events (a–f) of separated discharge (Q) events of the river Zwota (blue line) as proxy for the HIPPPs. Potentially triggered earthquake swarms are marked as red triangles (given with their ID code).
Effective diffusivities in the range >0.2 and <5 m2 s–1 obtained from the master-event-approach are well within the range of diffusivities between ≈0.1 and 10 m2 s–1 obtained from studies of the earthquake swarms in the years 2000, 2008 and 2014 (Parotidis et al.2005; Hainzl et al.2012; Hainzl et al.2016). Similar results have also been found by Talwani et al. (2007), Costain (2008), Hainzl et al. (2015) and Telesca (2010) in other areas with presumed hydroseismicity.
4.1.2 Identification of periods of increased pore pressure at the hypocentres
To estimate the relative HIPPP at depth, we applied eq. (2) to our long-term discharge time-series recorded at the Zwota creek gauge station (daily values, since 1964) for diffusion distances ranging between 8 and 16 km. Fig. 7(a) shows the discharge oscillation for the investigation period 1992–2016. According to the results of the previous paragraph, the tested diffusivities vary between 0.2 and 5 m2 s–1. Fig. 7(b) shows an example of the relative pressure variations calculated for different distances with an effective diffusivity of Deff = 0.5 m2 s–1. The maxima and minima of the pressure perturbations show the typical delay and the reduced amplitudes for larger diffusion distances. Fig. 7(b) also indicates that only significant increases in discharge, that is during extreme hydrological events with Q about >5 m3 s–1, and/or repeated hydrological events, can induce a relevant pressure variation at seismogenic depths. Low Q values during periods of normal precipitation (a few l m–2 of rain) generate only slight pressure variations, which attenuate within the upper few km of the crust and do not induce relevant HIPPPs at depths. After 2002, the pore pressure perturbations at larger distances have a slightly increasing trend, however the site experienced a period of relative drought, resulting in the decreasing trend observed in the last 3 yr.
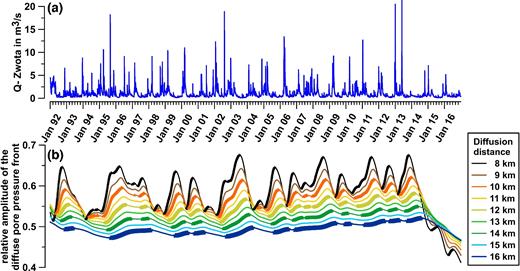
Relative pore pressure amplitudes at depth (for different diffusion distances) calculated for Deff = 0.5 m2 s–1. (a) The discharge Q of the river Zwota (blue line) as proxy for HIPPs. (b) Periods of increasing pore pressure are indicated by thicker line segments at the diffusion distance of 8, 10, 12, 14 and 16 km, respectively.
In order to identify potential trigger times, we selected periods with steadily increasing trend in the relative HIPPPs at the seismogenic depths. Positive gradients in the pressure variations indicate these critical periods. To select these trigger periods, we have defined a threshold of minimum increase of 0.002 per cent of the relative pressure variation in comparison to the day before. The absolute day-to-day pressure increase seems to be small, but we have to consider a long-term diffusion process in the crust here. The periods of steadily increasing pore pressure varies from 6 weeks up to 31 months for such a gradient. Studies of induced seismicity suggest that the pressure perturbation that can trigger seismicity can be very low (i.e. 0.01–1 bar, Shapiro et al.2006). However, the in situ pressure variations at the hypocentres are unknown.
The analysis of the complete time-series in Fig. 7(b) (82 200 values) reveals that about 38 per cent of the relative pore pressure values show an increasing trend above the threshold of 0.002 per cent per day for an effective diffusivity of Deff = 0.5 m2 s–1. These periods of increased pore pressure are indicated at the respective diffusion distances in Fig. 7(b).
Next, to evaluate the hypothesis of hydroseismicity, we compared all periods with an increasing relative HIPPP with the occurrence of all selected 121 SOQs. In each case, we considered the hypocentres of the SOQs and the respective diffusion distances of the HIPPPs. This evaluation was applied with the previously estimated range of effective diffusivities from 0.2 to 5 m2 s–1. Fig. 8 shows the number of the potentially triggered swarms in relation to the diffusivity values.
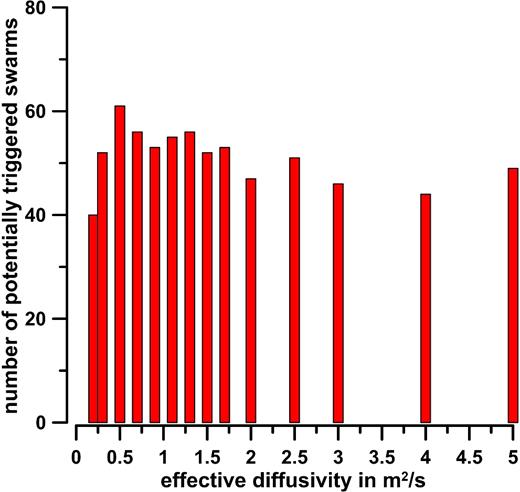
Bar charts showing the number of potentially triggered earthquake swarms by HIPPPs depending on the effective diffusivity.
This evaluation reveals that the number of potentially triggered earthquake swarms ranges from 40 swarms (Deff = 0.2 m2 s–1) to 61 swarms (Deff = 0.5 m2 s–1). Further, the increase the diffusivity shows only small variations in the number of potentially triggered swarms. No significant maximum or decreasing trend for higher values of diffusivity was observed. The reason for this continuous high level of potentially triggered swarms is based on the different SOQ’s that are triggered in different periods of HIPPPs due to the different effective diffusivities along the fracture zones. Fig. 9 gives an example of this effect during a period of 3 yr. That means, that the potentially triggered swarms shift towards longer diffusion periods for lower diffusivities. For example, for a diffusivity coefficient greater than 1.5 m2 s–1, the hydrological event during March 2006 (master event C) induced a HIPPP at the seismogenic depth which may have triggered the swarm on May 2006. A HIPPP which diffuses with an effective diffusivity coefficient of D ≤ 1.5 m2 s–1 could have only triggered the swarms in September 2006 and thereafter.
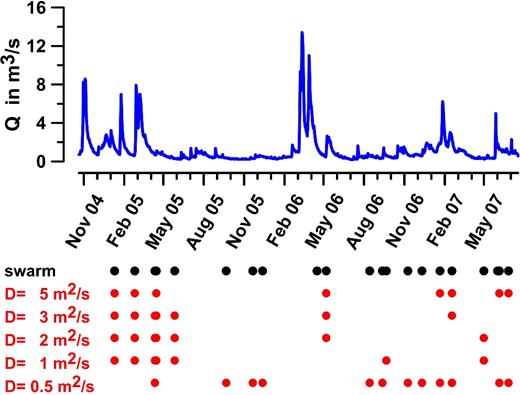
Comparison of the trigger effect due to different diffusivities and therefore different diffusion periods towards the hypocentres. Increased discharge values indicate the beginning of HIPPPs (blue line). All earthquake swarms are marked by black points. The potentially triggered swarms according to the diffusivity values are indicated by red points. For lower diffusivities, the trigger periods shifted towards longer diffusion periods and swarms which occurred later.
We have to consider that this evaluation did not narrow the range of possible diffusivities. In a further step, we therefore analyse which diffusivities are needed to explain the most relevant and largest earthquake swarms.
4.1.3 Diffusivities during the expansion of earthquake swarms
Precisely located hypocentres with errors less than 100 m (Fischer et al.2014) indicates the earthquake swarms expand within a narrow fracture zone along a N169° E striking line. Numerous earthquakes have potentially generated an interconnected fracture zone ideal for pore pressure diffusion. The expansion of the hypocentres during an earthquake swarm will follow this weak shear zones. We also consider these fracture zones as the most probable diffusion pathways for the pressure pulses.
We followed the approach of Parotidis et al. (2005) and Hainzl et al. (2012) to analyse which diffusivities describe the spatiotemporal expansion of the earthquake swarms triggered by HIPPPs. We assumed that the diffusivities of the seismically active shear zones are identical to our conduits which could indicate the most prevalent diffusivity range.
The largest earthquake swarms of the years 1997, 2000, 2008, 2011, 2013 and 2014 were selected for their analysis because of their spatiotemporal expansion in comparison to the numerous micro-swarms with low or only short-term expansion. The top panels of each subplot in Figs 10(a)–(f) show the spatiotemporal expansion during the first hours and days of these six swarms. The respective r–t envelops fitted according to eq. (1) describe a part of the swarm expansion even though they are not the best fits. For example, the spatiotemporal behaviour of the swarm in the year 1997 (Fig. 10a) can be described by an envelope with a diffusivity of 0.2 m2 s–1 and the calculated HIPPP with an effective diffusivity of the same range indicates a contemporary long-term pore pressure increase during the swarm period (bottom panels).
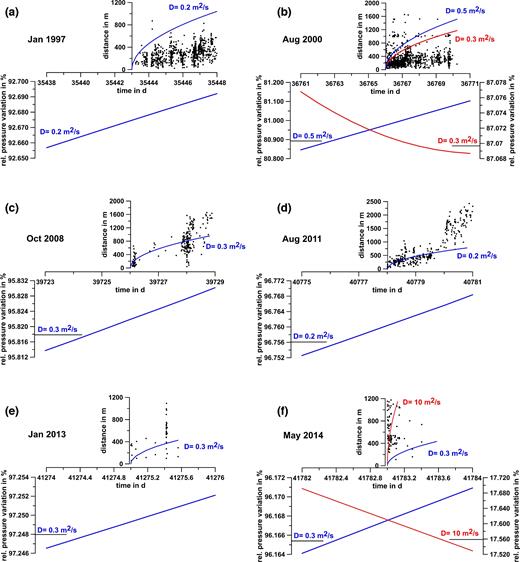
The spatiotemporal expansion of six earthquake swarms (a–f) are shown in the top panel during their first hours and days. The fluid pressure diffusion could induce this expansion depending on the diffusivity. The presented envelopes indicate possible diffusivities which describe the expansion process roughly (blue lines). These diffusivities are used in the bottom panel to consider the respective pore pressure behaviour induced by HIPPPs (blue lines). Diffusivities estimated from the swarm expansion according to their respective references are shown in: (b) Parotidis et al. (2005) in red; (c) —identical to our estimation in blue; (f) Hainzl et al. (2016) in red.
Additional to our calculated pressure variations, we present also two references in the Figs 10(b) and (c) with similar estimations of the diffusivity (Parotidis et al.2005; Hainzl et al.2012) and the respective pore pressure increase to trigger the swarms. However, the small discrepancy of D in Fig. 10(b) indicates only that the fits of the envelopes are acceptable approximations.
An exceptional case is the swarm in the year 2014 (Fig. 10f). We assume that the fracture permeability and the diffusivity were in the lower range (D ≤ 0.3 m2 s–1) with an increasing trend of the pore pressure before the first main shock (ML = 3.5) occurred. The swarm expansion of the following main shock of ML = 4.4 (Hainzl et al.2016) about one week later shows a fluid driven seismicity after the failure with a diffusivity of about 10 m2 s–1 during the swarm expansion. Section 4.5.1 will continue this discussion.
For all six swarms (Figs 10a-f), a HIPPP with an increasing trend in the relative pressure variation can be observed for the lower diffusivities between 0.2 and 0.5 m2 s–1. This could be a further hint for the most probable range of low diffusivities.
4.2 Earthquake swarms probably triggered by HIPPPs
We used this range of low diffusivities obtained in Section 4.1 as the input to calculate the HIPPPs to a distance of up to 16 km. Periods of increasing pressure are then identified and plotted as potentially stimulated swarms in Fig. 11(b) for the three diffusivities (0.2, 0.3 and 0.5 m2 s–1). Because of multiple trigger possibilities of the three analysed HIPPPs, we have excluded the duplications from the overall sum of all potentially triggered SOQ. We found a total of 88 swarms (= 73 per cent) were potentially triggered by HIPPs (Fig. 11c).
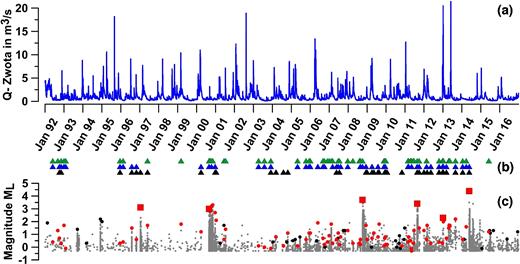
(a) Time-series of the discharge (blue line) as proxy for hydraulic pressure disturbances at the surface. (b) Potentially triggered earthquake swarms by HIPPPs (triangles). The pressure perturbations were calculated for the low diffusivity range: 0.2 m2 s–1 (black), 0.3 m2 s–1 (blue) and 0.5 m2 s–1 (green). (c) Time-series of the local seismicity (grey points, MC > –0.3). The analysed 121 swarms are indicated at their maximum magnitude by black points, the potentially triggered earthquake swarms by HIPPPs by red points and the six swarms of Fig. 10 by red squares.
4.3 The influence of the Horka reservoir
The presented analysis used the Libocký creek valley with WFZ as the main infiltration line of the hydraulic pressure variations caused by hydrological events. However, we have to also consider a possible influence to the hydraulic pressure regime due to the Horka reservoir, which is located in the southern part of this valley. The maximum amplitude of water level variations related to hydrological events is about 10 m according to the input of the Libocký creek, which is rather similar to the discharge signal Q. Fig. 12(a) shows the temporal oscillations of both parameters during the period 1982–1992.
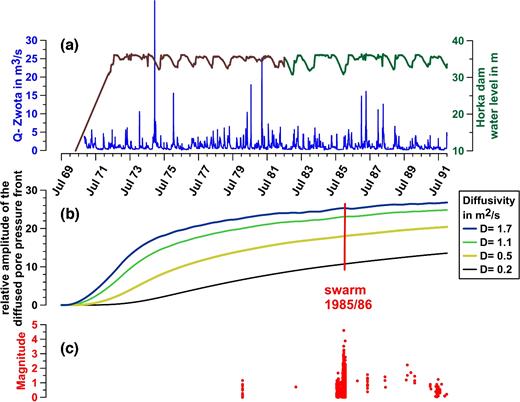
(a) Temporal variations of the discharge at the creek Zwota (blue line) and the water level of the Horka reservoir (green line). Data for the period of the reservoir filling were not available and were replaced by artificial data with a linear filling part to the normal level and typical variations similar to the following years (brown line segment). (b) Possible HIPPPs at the focal zone of the earthquake swarm of the year 1985/1986 (red line) due to the filling of the Horka reservoir. Different diffusivities (see legend) indicate the different behaviour of the relative pressure perturbations. (c) Seismicity of the NK focal zone, data base according to the bulletin VOCATUS (Neunhöfer 1998) and Neunhöfer & Hemmann (2005).
From the hydroseismicity point of view, the initial filling of the reservoir, with a water level increase of up to 35 m, is likely an important key process. The associated hydrostatic pressure increase of about 350 kPa is a persistent pressure increase, possibly bringing the upper crust in the NK area closer to failure.
The filling process of the reservoir started approximately in the year 1969, which constitutes the beginning of a hydraulically induced pore pressure diffusion. The NK focal zone was not seismically active in the years before 1985 (Fig. 12c). However, the first strong earthquake swarm occurred after a delay of about 15 yr. This swarm, which can be identified as the beginning of the seismic activity at the NK focal zone, occurred in July 1985 and lasting for about 8 months. The strongest recorded NK earthquake occurred on December 21 (50.242° N, 12.453° E, focal depth ∼9.8 km) with a magnitude of MLmax = 4.6 (Neunhöfer & Meier 2004). This earthquake is still one of the strongest recorded swarm-related earthquakes in this focal zone. The long period between the filling process and 1985 earthquake swarm was not considered as hydroseismicity process until now. We present the first results of the diffusion of pressure fronts with the estimated diffusivity range of 0.2–1.7 m2 s–1 in Fig. 12(b).
This example of initial reservoir filling with their HIPPPs at the seismogenic cluster suggests a unique evaluation of the hydroseismicity at NK. Fig. 12(b) shows the relative pressure perturbations after a diffusion distance of about 14 km from the Horka reservoir to the focal zone at a depth of about 10 km. The first earthquake swarm could have been triggered according to this estimation during a period of increasing pore pressure with a strong gradient. In case of Deff = 0.2 m2 s–1, the relative pressure increase would be about 0.014 per cent per day during the earthquake swarm preparation process, and for Deff = 1.7 m2 s–1 only 0.0004 per cent per day. In case of higher diffusivities (Deff > 2 m2 s–1), the pore pressure would reach the uppermost level before the swarm occurred. That means that the trigger process of the earthquake swarm of the year 1985/1986 is supported by HIPPPs which diffused with a relatively low effective diffusivity.
4.4 Hypothesis testing
The results support the hypothesis that hydroseismicity could act as one potential trigger mechanism, at least for some earthquake swarms in the NK focal zone. Figs 13(a)–(c) presents periods of increased pore pressure at depth (grey areas) for three diffusivities together with both the potentially triggered and non-triggered swarms.
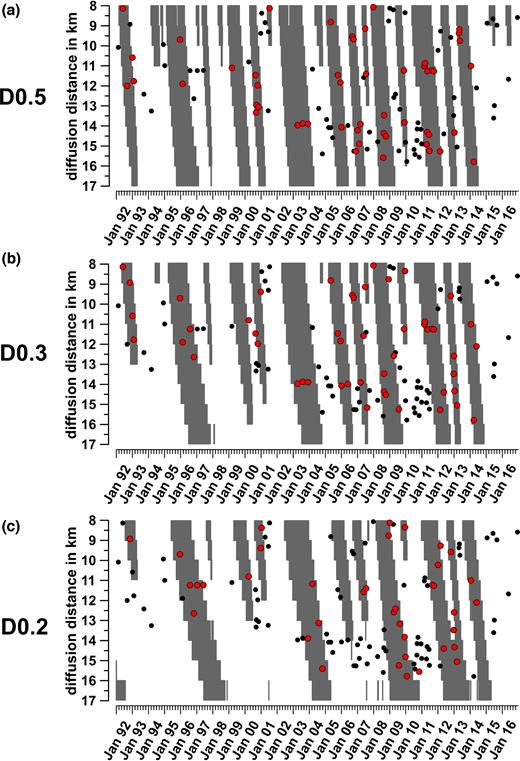
Panels a, b and c shows periods of increased pore pressure of 0.002 per cent per day at depth (grey areas) for three effective diffusivities (a: D = 0.5 m2 s–1, b: D = 0.3 m2 s–1, c: D = 0.2 m2 s–1). The SOQs of potentially triggered earthquake swarms are marked as red dots, while non-triggered swarms are shown as black dots.
For example, Fig. 13(a) shows the ‘triggering space-time area’ (grey zones) for D = 0.5 m2 s–1. 61 swarms out of 121 are triggered since they lay within the ‘triggering space-time area’ (red points), while 60 non-triggered events fall outside this area (black points). In comparison to this result, a robust statistical analysis indicates a weaker correlation to the hydroseismicity hypothesis. Considering the fraction (X) of total space-time area taken up by ‘triggering space-time area’ (e.g. 9131 d × 9 depth intervals of 1 km = 82180 d × km), we get X = 0.387 for the 61 swarms triggered by hydroseismicity. Meanwhile the remaining 60 swarms triggered by a different and unknown process occur in the complementary space-time area (1–X) = 0.613. Assuming that this process is independent of the hydroseismicity, it should continue even during the episodes of hydraulically increased pore pressure. Therefore, X/(1–X) × 60 swarms within the triggering space-time area should not be effected by HIPPPs. Thus we can expect that 38 swarms in the space-time area are not related to HIPPPs, meaning that the number of events triggered by HIPPPs would be 23 which is about 19 per cent of the total number of swarms.
Figs 13(b) and (c) show the ‘triggering space-time area’ for D = 0.3 and D = 0.2 m2 s–1, respectively. Following the same statistical procedure as above, we find that HIPPP triggered swarms make up about 15 and 7 per cent of the total number of swarms, respectively.
However, this statistical analysis is based on the assumption that a secondary trigger process is contemporarily active and unaffected by hydraulically related pressure changes. No indications for this secondary process were observed so far. Observed transients in the fluid regime were described in Section 2.3: a shift in 3He/4He ratios towards higher mantle contributions occurred between 1992 and 2005. Thereafter the mantle contribution remained rather stable at values around Ra ∼ 6. A long-term δ13C trend (2005 until 2011) at a mofette south of NK (Bublák) was presumably related to a progressive magma degassing process. The hypothesis of fluid-driven seismicity by magmatic fluids is based on these variations in the isotope ratios in relation to a selection of few major swarms, in particular 2000 and 2008.
4.5 Geological and geophysical aspects
4.5.1 Orientation of seismically active faults
The lateral distribution of the earthquake swarms triggered by HIPPPs shows no indications for a spatial clustering. Reasons for this random distribution might be the heterogeneous differences in the fracture zones and possible variations in the diffusivities related to the shear processes of the previous swarms along these fault zones. An open fracture zone would have higher permeabilities and higher diffusivities as consequence of previous shear processes on favourably oriented fault zones in contrast to misoriented fault planes with lower permeability and diffusivity. These fault planes can be only activated for a shear process if the pore pressure is increased in comparison to the favourably oriented fracture zones. Mukuhira et al. (2017) describes this process from the results of a hydraulic stimulation process at a deep injection well (Häring et al.2008). In their experiment, the diffusion of pressure perturbations with lower pore pressure is faster and farther in comparison to a larger pore pressure. Tentatively we may suggest for the NK focal zone, that the reactivation of open fracture zones is associated with larger diffusivities (about 0.5 m2 s–1 or more) and, on the other hand, an opening of smaller fracture zones corresponds to lower diffusivities (≤0.3 m2 s–1) due to the enlarged pore pressure.
This process could be observed during the extraordinary earthquake swarm which occurred in May 2014. Hainzl et al. (2016) studied the spatiotemporal behaviour of this swarm. The result shows that a main shock-aftershock sequence with two main shocks of magnitude ML = 3.5 and 4.4 occurring on an unfavourably oriented fault plane in comparison to the regional stress field. The fast expansion of this swarm, which can be described by a pore pressure diffusion process with a diffusivity of about 10 m2 s–1 (Hainzl et al.2016, Fig. 10F) indicates a failure process on pre-existing, likely reactivated fault planes. Hainzl et al. (2016) speculate an intrusion of overpressurized pore fluids or magma triggering this unusual swarm.
However, a possible explanation could be also a hydroseismicity process with an exceptionally enlarged pore pressure perturbation as trigger of the swarm. The reason for this assumption is an extreme hydrological event (a flood) in June 2013, which induced one of the strongest HIPPPs in this investigation period (Qmax = 21 m3 s–1). Only a pressure front diffusion of low diffusivity (≤0.3 m2 s–1) shows an increasing trend in the pressure variation at the hypocentre leading to the events in May 2014. For example, the pore pressure could be enlarged before the onset of the swarm by up to 99.5 per cent of the maximum pore pressure in the investigated time-series (Fig. 10f). Following the idea of Mukuhira et al. (2017), the enlarged pore pressure of the hydrological event in summer 2013 diffused with a very low diffusivity and reached an extraordinary increase of pore pressure in May 2014 which could trigger the swarm.
A similar process could be assumed for the earthquake swarm in the year 1997 which also occurred on an unfavourably oriented fault plane (Horálek et al.2002).
4.5.2 Hydraulic fault properties
Two further geological arguments to support the hydroseismicity approach can be achieved by the investigation of the tectonic and hydraulic link between the infiltration line along the WFZ and the hypocentres.
The map in Fig. 14(a) shows the epicentres of the analysed 121 SOQs (Table A1, see Online) as well as the complete seismic activity. The N-S distribution along a N169° E strike direction follows the direction of the principal faults found from stress analysis (Vavryčuk 2011). The lateral distribution of earthquake swarms possibly triggered by hydroseismicity (88 red points in Fig. 14a) show no local anomalies or concentrations with one exception: beyond a line slightly west and parallel to the MLFZ, no triggered events occur further to the SW. This supports the assumption/hypothesis that the SW dipping MLFZ acts as a kind of impermeable barrier for the pore pressure diffusion due to a missing hydraulic link between the damage zones on both sides of the MLFZ. The seismically inactive fault core sealed probably the fault core by mineral precipitation and silification (Weinlich et al.2013). A possible consequence of this hypothesis is that these segments of the MLFZ could separate the meteoric ground water in the east from the magmatic CO2-rich fluids to the west of the MLFZ. This argument is supported by the strong spatial separation between the hypocentres and the distribution of mineral springs or mofettes with mantle originated fluids at this range of latitudes (50.20–50.24° N, Fig. 14b). All CO2-rich mineral springs are located west of the MLFZ, with the exception of three locations near Dolni Čáskov, Kopanina and Oldřišská, which are nonetheless located directly on the western part of the fault outcrop. These gas emission sites are probably fed from the magmatic reservoirs in the SW, whereby the western damage zone of the MLFZ could act as vertical migration path. However, at the seismogenic depth the hypocentres are mainly located in the eastern part of the MLFZ segment because this normal fault dips towards SW with about 60–80°.
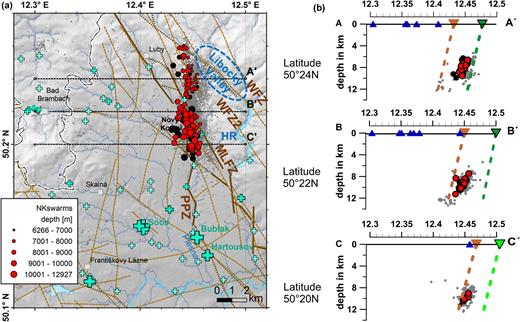
(a) Distribution of the epicentres of the 121 analysed SOQs between 1992 and 2016 (black dots). The red dots indicate swarms which could be triggered by HIPPPs. The blue dashed line marks the possible infiltration area of the fluid pressure pulses along the Libocký creek valley; HR—Horka reservoir. The overall seismicity is shown as small grey dots. (b) Depth slices along the lines A-A´, B-B´ and C-C´ in (a) across the strike of the fault zones. Distribution of the hypocentres (red and black dots for the same SOQs as above) in comparison to the WFZ (Libocký valley, dark green triangle), to the WFZ2 (the parallel branch of the WFZ, light green triangle) and the MLFZ (brown triangle). The respective brown and green lines indicate faults at depth assuming a dip of 80° SW. Blue triangles mark CO2 gas emission sites at these latitudes.
The dip has been estimated directly from the earthquake focal mechanisms, which show a dip range of 68–80° WSW on principal fault zones with a strike of about N169° E (Vavryčuk 2011). Hints for a lower dip of up to 50° W was proposed by Bälz (1908) as observed at coal mines near Dolni Čáskov as well as fractures with a dip of 70–80° W observed at a quarry near Kynšperk. A dip of 60° W was suggested by Bleibinhaus et al. (2003) based on the MVE90 re-interpretation and by Halpaap et al. (2017) according to a seismic reflection survey across the PPZ. In order to visualize their relationship to the hypocentres in our area of investigation and to the CO2 gas emission zone, we have applied the steepest dip of 80° to both the MLFZ and the subparallel WFZ in the depth slices shown in Fig. 14(b). The results would be also valid for a lower dip range.
4.5.3 Seismic velocity structure
The third argument which supports the hydroseismicity hypothesis can be derived from the strong 2008 earthquake swarm. Because this is a seismologically well-studied swarm, we apply the results from VP/VS value studies to illustrate the key points of the hydroseismicity hypothesis. A 3-D VP/VS model using data collected during that swarm (Alexandrakis et al.2014) shows an elongated zone of high VP/VS values coinciding with the location of the focal zone and in line with that of the N169° E principal fault. The authors interpreted this feature as the signature of brittle and fluid-saturated rocks, an option which was also supported by other studies (e.g. Hainzl et al.2012). A 3-D tomography study of the NK area by Mousavi et al. (2015) imaged similar structures.
The results of Alexandrakis et al. (2014) are visualized as a 3-D model (Fig. 15) to demonstrate the probable distribution of fluid filled fracture zones above and below an area of lower VP/VS values overlaying the NK focal zone. Fig. 15(a) shows the major fault zones (MLFZ and the WFZ) in relation to the NK focal zone. The uppermost swarm earthquakes could be directly linked with the WFZ in NE. Almost all of these earthquakes occurred east of the MLFZ as mentioned above.
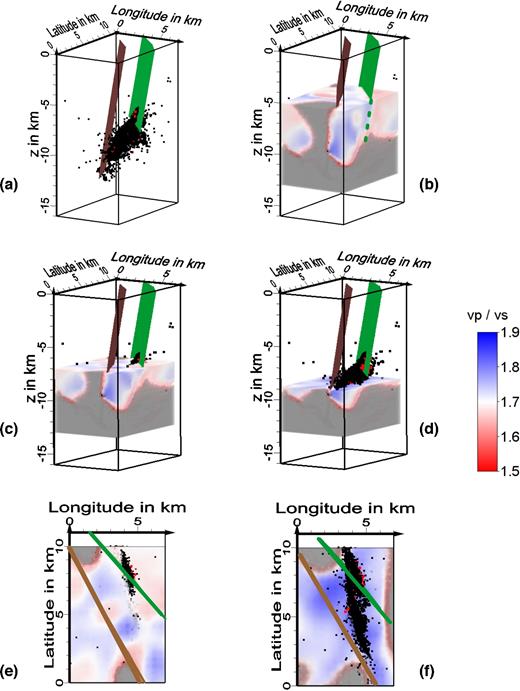
3-D model of VP/VS values at the NK focal zone with the major fault zones MFLZ (brown) and WFZ (green) at 3 different depths. The view point is located in SE, starting coordinates are: 50.17N and 12.39E. The swarm earthquakes are indicated by black points. The potentially triggered swarms by HIPPPs are shown as red points. (a) Position, strike and dip of the major fault zones. The uppermost earthquakes in NE are probably linked with the WFZ. (b) Horizontal clip plane of the VP/VS values at 5 km depth. Grey areas indicate regions with low data coverage or model instability and are therefore not included in the interpretation. The blue coloured surface indicates a high VP/VS value at that depth range. A contrast of the velocity ratio is visible along the extended WFZ (green dashed line). Images (c) and (d) are similar to image (b) but with VP/VS values starting at depth of 7 and 9 km. Image E and F show the depth slices of image C and D with the major fault zones.
Figs 15(b)–(d) show the lateral distribution of the VP/VS values at depths of 5, 7 and 9 km. The uppermost zones of the 3-D model down to about 5.5 km depth (Fig. 15b) are characterized by a zone of high VP/VS values between the MLFZ and the WFZ. Furthermore, the WFZ separates this zone in the SW from lower VP/VS values northeast of the fault at that depth. We consider this contrast in velocity ratio, which can be identified also down to 10 km depth, as an additional indication for a deeply reaching fault zone, a potentially diffusion pathway for the HIPPPs.
Below this zone, Alexandrakis et al. (2014) analysed a layer of lower VP/VS values of about 1 km thickness between the MLFZ and the WFZ (Fig. 15c), which they interpreted to be an intrusive/granitic body with reduced fluid content. A transition from low to high VP/VS values is evident below 7 km which also corresponds to the bright reflectors imaged in their 9HR seismic profile (Mullick et al.2015). In that case, the interface between the overlaying hard rock and the fluid saturated brittle rock below may provide a subhorizontal route for the fluid migration following the focal zone towards deeper hypocentres. This analysis supports the importance of the WFZ as a hydraulic link and its potential as a conduit for the diffusion of HIPPPs towards the focal zone. Depth slices at 7 and 9 km (Figs 15e and f) underline this result as well as the clustering of hypocentres NE of the MLFZ.
5 CONCLUSIONS
We tested the hypothesis that hydrological events might explain the onset of earthquake swarms in the Nový Kostel focal zone. The discharge of the gauge station Zwota was used as proxy for hydraulically induced pore pressure perturbations which diffuse into the upper crust.
A comparison of swarms triggered by calculated HIPPPs of different diffusivities of 0.2, 0.3 and 0.5 m2 s–1 suggests that these pore pressure perturbations could have triggered 7, 15 and 19 per cent of the analysed earthquake swarms in the period 1992–2016, respectively.
The analysis of the pressure pulse generation caused by the initial filling of the Horka reservoir supports the assumption that the beginning of the earthquake swarm activity in the NK focal zone during the swarm of the year 1985/1986 was triggered by this exceptional increase of hydrostatic pressure about 15 yr earlier.
The WFZ along the Libocký creek could play an important role as conduit for the pore pressure diffusion.
MLFZ could act as SW barrier for the diffusion of pore pressure perturbations. An impermeable MLFZ further implies that the earthquake swarms west of the MLFZ are likely not triggered by HIPPPs, whereas the earthquakes to the east of it are probably not driven by magmatic fluids.
The alternate hypothesis, that the swarms are triggered by episodically rising mantle fluids remains a valid option, but has some weak points as listed below:
From travertine age determinations and alteration studies of fracture zones, it might be assumed that mantle fluids are present in the region since more than 200 000 yr but no indications for local seismicity in the NK focal zone were observed before the year 1985.
Strong historic earthquake swarms occurred in areas without surface manifestations of mantle fluids (N and NE of the MLFZ).
There are no emission of mantle fluids in springs or mofettes NE of the MLFZ; the main degassing centres are located outside of the NK focal zone.
Thus, neither the mantle fluid, nor the hydroseismicity hypothesis seems to explain all of the swarm occurrences satisfactorily. Therefore, more interdisciplinary research on the origin of the earthquake swarms in the NK area is needed.
Acknowledgements
This study has been supported by the German Research Foundation, grant HE2177/16. We acknowledge support and data provided by the Saxon State Office for Environment, Agriculture and Geology (LfULG, Saxony, Germany), the West Bohemia Seismic Network WEBNET and the VODNÍ DÍLA—TBD a.s., with the permission of VD Povodí Ohře, státní podnik, Czech Republic. We are grateful to T. Fischer (Charles University, Prague, Czech Republic) for providing seismic data and his fruitful comments. The authors would like to thank two anonymous reviewers and the editor for their encouraging comments and valuable suggestions.
REFERENCES
SUPPORTING INFORMATION
Supplementary data are available at GJI online.
Appendix
Please note: Oxford University Press is not responsible for the content or functionality of any supporting materials supplied by the authors. Any queries (other than missing material) should be directed to the corresponding author for the paper.
